Abstract
Using the temperature and seepage field-coupling module within COMSOL Multiphysics software, we examined freezing behavior and its evolving patterns in curved underground freezing pipes. This study employed transient states, with the Darcy’s law and porous-media heat-transfer options activated in the Physical Field Interface of the Physical Field and Variable Selection column. The models were created to establish numerical models of freezing reinforcement for both single and multiple pipes with various curvatures. These models were designed to simulate the evolving temperature and seepage fields of soil under diverse freezing conditions. Subsequently, this research utilized the models to simulate the freezing and consolidation conditions of a shallowly buried tunnel within the context of shallow tunnel conditions. The study reveals that after freezing a single pipe using water flow, the change in thickness of the frozen wall in curved pipes is notably smaller than that in straight pipes. This difference is particularly pronounced in the upstream section. Specifically, at a distance of −2000 mm from the main surface, the change in thickness of the frozen wall in straight pipes exceeds that in s = 7 curved pipes by approximately 350 mm. The smaller the long arc ratio s, the greater the arc of the freezing tube and the better the water-blocking effect. In the multi-pipe freezing model, the s = 7 curved pipes exhibit a frozen-wall thickness approximately 120 mm greater than that of straight pipes at a distance of −2000 mm from the main surface. Under the condition of a shallow buried concealed excavation with surging water, a pipe with a long arc ratio s = 7 arc freezing at 46 d attains a permafrost curtain thickness that is equivalent to that achieved by the straight pipe freezing at 58 d. This reduction in thickness shortens the working period by 12 days, resulting in a more efficient process. The successful application of the freezing method in the water-rich aquifer is expected to be a valuable reference for similar projects in the future.
1. Introduction
Artificial ground freezing is a method of freezing groundwater and soil into a layer of ice in order to control the flow of groundwater and soil or provide solid support to underground works. The method mainly involves injecting a refrigerant into underground boreholes to cool the surrounding soil and water so that it freezes and forms a barrier with a certain degree of strength, which can effectively prevent the flow of underground soil and water into the working platform. Due to rapid economic growth and the extensive construction of underground projects, artificial ground-freezing technology has gained widespread use in tunnel construction. Its adoption is primarily driven by its environmentally friendly nature, controllability, safety features, and other advantageous characteristics [1,2,3,4,5,6].
Straight freezing tubes are usually preferred as they have the advantages of simple processing, ease of transportation and construction, etc. [7,8,9,10]. However, the freezing wall shape formed by this traditional straight pipe is more regular and uniform and fails to provide targeted reinforcement to weak areas with soil and water flow.
Previous research has primarily focused on altering the layout, spacing, and cross-sectional area of straight freezing tubes to enhance freezing effectiveness [11,12]. These changes aimed to increase the overall impact. Although arc-freezing single pipes have a more complex structure, demanding different processing techniques and higher material consumption than straight pipes, they result in more balanced structural stress in the frozen soil curtain. This enhances safety. In the case of reinforcing weak areas, arc single pipes offer improved safety and economy compared to merely increasing the quantity using straight pipes. Additionally, they prove to be safer and more cost-effective.
Researchers across the world have focused more on the shape of frozen monotubes in terms of cross-sectional dimensions and have drawn many useful conclusions. For example, Rocha et al. [13] found that the cross arrangement of elliptical freezing tubes has a more significant heat-transfer effect. Bai et al. [14] modeled elliptical single and double freezing tubes with different length-to-short-axis ratios and found that the larger the length-to-short-axis ratio, the larger the freezing area, and elliptical freezing tubes are more efficient than circular freezing tubes in freezing. Meanwhile, the analogous problem of curvature in the lengthwise direction of freezing tubes has been less studied. Wu et al. [15] studied ring-shaped freezing tubes during a tunnel road expansion project. Their aim was to ensure the construction process’s reliability while optimizing the original structure to improve the effectiveness of freezing water. However, they did not conduct a comprehensive investigation into the freezing behavior of curved single pipes and multi-pipes within soil, nor did they explore their advantages over straight pipes. Chen et al. [16] proposed the use of a ring-shaped freezing tube to freeze and reinforce the shield-tail brush replacement effectively. However, they did not thoroughly explore the freezing characteristics of curved single tubes or multiple tubes in the soil or their advantages over straight tubes. Investigating the water–heat coupling evolution between curved single tubes and multi-tubes during freezing is crucial for enhancing freezing-engineering methods.
Based on the principles of heat transfer and Darcy’s law in porous media, this study establishes a numerical model for arc-frozen single-pipe and multi-tube permafrost and analyzes temperature and seepage fields under different arc single-pipe and multi-tube freezing reinforcements. This paper will compare these results with the more effective curved arc pipes used in shallow buried tunnels with water influx. This analysis aims to assess their water-stopping capabilities and understand temperature field isotherms, freezing-wall thickness, and other distributions. The findings can serve as valuable technical references for enhancing freezing efficiency and similar water-influx projects.
2. Arc-Freezing Tube Design
In the actual project, 108, 127 mm, etc. diameter straight freezing tube is commonly used in the construction of artificial freezing method. [17,18]. To ensure that the designed and completed curved freezing tubes match the length of straight tubes in the freezing area, they should have the same “effective length”. The effective length is the distance between the centers of the cross-sections at both ends of the frozen tube. A schematic of a straight tube and an arc-shaped tube is shown in Figure 1, where the geometry of the arc-shaped tube is determined by the effective length L and the arc height H. To describe the dimensions of the curved tubes, the ratio of the effective length to arc height, L/H, is defined and denoted by s. Combining the degree of processing difficulty and economy, the value of s is determined to be between 7 and 20 when s is equal to 7, 10, 16, and 20. In this study, the case where L = 7000 mm and the tilt angle is 30° is taken as an example, and the relevant dimensional parameters of the curved pipe are shown in Table 1.
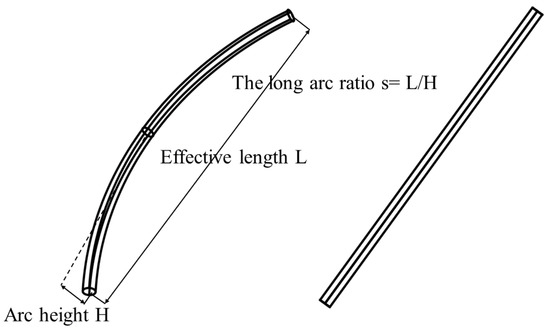
Figure 1.
Geometrical parameters of straight and curved freezing tubes.

Table 1.
Parameters related to the geometry of curved freezing tubes.
From Figure 1 and Table 1, it can be seen that the length of the straight tube is equal to its effective length, and the arc height is zero. When the effective length of the freezing tube L increases, the arc height H ratio decreases, and the freezing tube “arch” is higher. However, when the effective length of L remains unchanged, the arc height H increases to one-half of the effective length, giving the freezing tube a semi-circular ring shape. This research focuses on s = 7, 10, 16, and 20 to analyze the freezing effect of different ratios on the formation.
3. Modeling Arc Freeze Tubes
3.1. Theoretical Model of Freezing
The theory of porous media is an important tool to study the freezing process of strata [19]. Many researchers have explored the freezing process of artificial strata by considering soil as a porous medium [20,21]. By applying the principle of convective heat transfer within a porous medium, this research can establish an energy-conservation equation for heat flow in the presence of phase change, connecting the seepage field to the temperature field given by
where is the equivalent volumetric heat capacity; is the equivalent thermal conductivity; is the equivalent fluid heat capacity; is the fluid seepage-velocity vector; is the specific heat energy during the ice-water phase transition; is the heat source-sink term; and the seepage velocity is determined by Darcy’s law for porous media.
Taking into account the effect of groundwater seepage, the temperature of the water flow is the same as that of the soil layer. However, due to the circulation of low-temperature brine through the chilled tubes, there are internal and external differences between the temperatures of the chilled tubes and the ground. Heat transfer occurs as the water flows around the cryotubes. represents the heat generated through thermal conduction, where the soil remains stationary without undergoing relative displacement. However, because of variations in temperature within the same area, temperature differences arise and subsequently facilitate the transfer of heat. In the temperature field, the flow of groundwater due to differences in temperature leads to the flow of thermal convection between the body and the solid; i.e., the thermal-convection term is embodied in the heat flow energy-conservation equation:
where is the equivalent fluid heat capacity and is the fluid’s seepage-velocity vector. The convective term (the coupling term) as a heat source is added to the heat-transfer control equation to reflect the coupling of the seepage field to the temperature field.
With the coupling of the temperature field to the seepage field, the groundwater flow through the freezing temperature field implies that the fluid flows in only one direction and the groundwater’s flow state is laminar. Consider that the Reynolds number Re between 1 and 10 satisfies Darcy’s law. The localized freezing of fluid within the seepage field results in the displacement of the seepage field boundary, causing fluctuations in the fluid’s permeability coefficient due to temperature variations. Therefore, the differential control equation of the seepage field under the influence of temperature is given by [22,23,24]
Combining Darcy’s law expressions:
where is the soil porosity; are coefficients of the expansion of water and soils, respectively; is the fluid seepage-velocity vector; K is the seepage coefficient; P is the penetration pressure; is the seepage field source-sink term; and is the density of water.
The transient differential control equation of the seepage field has the fluid pressure P as the dependent variable, and the seepage velocity can be controlled by Equation (5) to simulate various seepage velocities. k is the permeability coefficient, the value of which is mainly related to the porosity of the soil body, and it also varies with the change in stratum temperature T:
The inclusion of non-constant variation in the permeability coefficient with freezing temperature introduces an additional factor into the seepage field control equation, thereby accounting for the coupling between the temperature field and the seepage field. Here, is the coefficient of permeability of the soil at room temperature, and is the coefficient of permeability of the soil after freezing.
3.2. Basic Assumptions
During soil freezing and consolidation, the underground environment is affected by multiple factors, and the mechanism of mutual influence among them is complicated. In this paper, the established calculation model is a heat–fluid coupling model. It simplifies the complex multi-field coupling problem by excluding the impact of the stress field on the temperature field in real engineering. This approach focuses on creating a basic calculation framework for the freezing process and makes the following fundamental assumptions for our calculations [25,26,27,28]:
- (1)
- The temperature load is directly applied to the wall of the freezing pipe, and the cold generated in the freezing pipe is directly transferred to the surrounding soil by the wall of the freezing pipe. The interaction between the freezing tube and the soil is not considered, and the cooling plan is shown in Table 2.
Table 2. Brine cooling plan.
- (2)
- Assuming that the soil layer is distributed horizontally from top to bottom and has a uniform temperature field, the initial temperature is set to 27.5 °C; the envelope area of the soil at the −10 °C isotherm is the minimum freezing zone, and the envelope area of the −1 °C isotherm is the maximum freezing zone.
- (3)
- The soil is a saturated, homogeneous, isotropic, porous medium with a constant total porosity; the soil layer conforms to the seepage properties. It is assumed that the material properties of the soil layer change uniformly with the temperature, and the process of the change in properties is only considered to be the effect of temperature; intrinsic modeling is not addressed in the text.
- (4)
- The fluid within the porous medium of the model exhibits laminar flow, making it suitable for characterization using Darcy’s law. Post-freezing, the seepage velocity approaches zero. The model introduced in this paper designates the left and right boundaries as seepage inlets and outlets, with unidirectional horizontal fluid flow. Upstream water is adequately replenished, and downstream water flows smoothly, ensuring a stable seepage field with constant upstream and downstream water head levels. However, the model does not account for freeze-up, thawing, or sinking processes.
3.3. Numerical Modeling
Utilizing the freezing theory and the underlying assumptions outlined above, this study employs Darcy’s law and the porous-media heat-transfer interface within the finite element software COMSOL Multiphysics. This approach is employed to formulate the governing equations for temperature and seepage fields, allowing for the simulation of the freezing process in both straight and curved pipes with varying s-values. The study aims to investigate and compare the impact of freezing under water-heat coupling conditions [29,30]. The model has a transverse dimension of X = 20 m and a longitudinal dimension of Z = 15 m. A 7 m curved pipe with s-values of 7, 10, 16, and 20 and a 7 m long straight pipe inclined at 30° were modeled. Frozen sections were removed using the Borel operation, followed by applying temperature loads to the exposed surfaces. The results are presented in Figure 2. Seepage occurs from the high-head boundary to the low-head boundary, and the upper and lower boundaries are assumed to be impermeable. To better observe the changes in the temperature and seepage fields after the freezing of different tubes, the difference in head between the left and right boundaries is taken as 30 m.
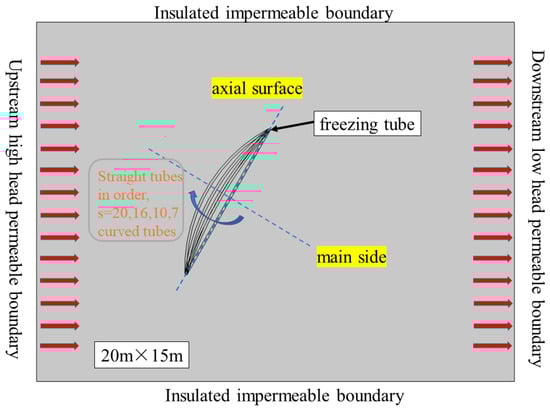
Figure 2.
Schematic diagram of the numerical model.
Since the field variables vary with time, the model is studied using transients, which are solved automatically and transiently using Darcy’s law and porous-media heat-transfer options under the Physical Field Interface in the Physical Field and Variable Selection column and setting a time step of 24 h and a total step of 58 d. Building upon the findings of previous scholars [31], our study aims to replicate the most challenging scenario. To achieve this, this study has chosen soil material with properties closely resembling those of the most adverse sand layer. Detailed soil and fluid parameters are provided in Table 3 for reference. According to the previous related research, the use of the method of heat-flow-coupling simulation analysis has a certain degree of feasibility. In the investigation of temperature field evolution during various freezing-reinforcement programs in the context of shield -tail brush replacement under seepage effects, researchers such as Chen [32] have found that simulation outcomes closely mirror the observed data trends. This alignment suggests a more accurate representation of real-world engineering conditions.
Table 3.
Physical parameters.
4. Discussion—Single-Pipe Model
4.1. Analysis of Temperature Field Cloud Map
Figure 3 shows field cloud diagrams for temperature and seepage for straight and curved pipes with different s-values after 58 days of freezing, under both hydrostatic and moving-water conditions. The temperature line around the freezing tube under the hydrostatic condition is uniformly distributed and gradually spreads to the soil body along the wall of the freezing tube, and the overall contour of the temperature cloud map of the straight tube is symmetrical about the axial surface and the main surface of the freezing tube. Under dynamic conditions, the transformation of the freezing tube’s cloud patterns remains consistent. Whether observed along the axial plane or the principal plane, the symmetry in the temperature profile of the soil surrounding the freezing tube diminishes. Instead, a downstream extension of the cold source creates a “cold channel” in the soil layer downstream, resulting in lower temperatures compared to the upstream section. This aligns with previous research, confirming that the cold source primarily impacts a smaller area upstream and has a more significant influence on the downstream region [33]. Hence, the above results are largely reliable as the upstream freezing pipe continuously exchanges heat with the soil as the freezing proceeds. This phenomenon subsequently influences the temperature field through seepage, transporting the upstream cold to the downstream of the freezing region, resulting in an ultimate asymmetrical cold aggregation downstream.
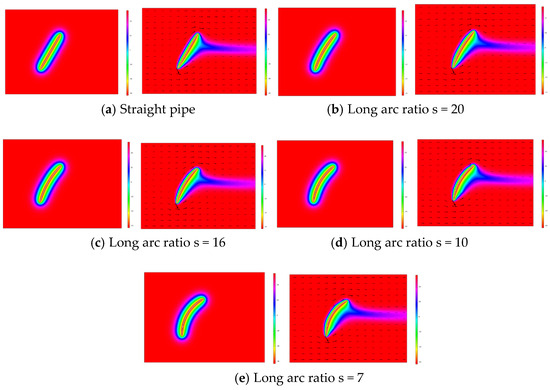
Figure 3.
Temperature field clouds for 58 d of freezing under hydrostatic (left) and dynamic (right) conditions for each pipe type.
4.2. Analysis of Freezing Wall
When assessing the freezing effect, one crucial criterion for evaluation is the thickness of the freezing curtain (or freezing wall) in the freezing project. This measurement plays a pivotal role in determining the overall effectiveness of the freezing process. Taking the main surface as the dividing line, the pipe is divided into three parts—the upstream section, the middle section, and the downstream section—and the thickness of the curtain is measured both when the water is stagnant and when it is flowing. Figure 4 illustrates the variation in the difference in curtain thickness away from the main surface after 58 days of freezing under both static water and dynamic water conditions in various pipes. The permafrost curtains formed by different tubes under hydrostatic conditions exhibit approximately equal thickness. This similarity arises from the fact that despite variations in tube shapes, they all share the same cross-sectional area and provide an equivalent cooling effect within the unit cross-section. Figure 4 shows that, except for the curved pipe for which s = 7, the difference in thickness is smaller with the increase in distance; i.e., the isothermal change before and after seepage is small. This also confirms that seepage has a larger impact upstream and a smaller impact downstream as per the above cloud diagram analysis; i.e., the cold volume in the upstream section is brought to the downstream section due to the seepage effect.
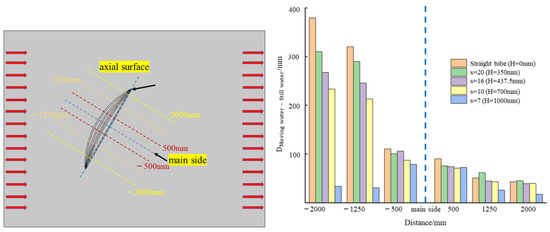
Figure 4.
Schematic representations that indicate surface positions of frozen wall observation in both hydrostatic and dynamic conditions for each pipe type, with histograms depicting variations in thickness with changing positions.
The difference between the cross-section at positions −500 mm and 500 mm from the main surface and at 1250 mm and 2000 mm is not much different, and the interpolated value at the middle section is slightly higher, which indicates that there is not much difference in the effect of seepage either. However, there is a small difference in the value of the change in the thickness of the freezing wall of the different tubes. When analyzing the upstream sections at positions −2000 mm and −1250 mm from the main surface, it is observed that the difference in the thickness of the freezing curtain diminishes as the long arc ratio s decreases (resulting in an increase in ‘H’). This suggests that as the arc of the freezing pipe becomes higher, and there is less variation in the thickness of the freezing wall, indicating a greater “blocking” capacity of the fluid. The difference is smallest for s = 7, and the decrease in the difference is large compared to the other tubes, which indicates that a tube with this shape freezes better than the other tubes and produces a curtain to resist deformation. This is because the freezing pipe in the upstream section has a larger inclination with the direction of water flow, which leads to a larger angle between the freezing wall and the water flow, and consequently a better water-insulation effect. As the value of s decreases and the curvature increases, the freezing wall upstream of the freezing pipe gradually becomes perpendicular to the water flow, and the coverage of this “vertical wall” is wider; hence, the larger the curvature of the curved pipe structure is, the more that the freezing effect of the water barrier becomes the most significant in the upstream region, followed by the middle section, and with the smallest value in the downstream section. In summary, the curved freezing tube exhibits an improved freezing-wall structure when subjected to force in the context of water flow, as compared to the scenario where the freezing-wall thickness remains relatively unchanged with no seepage. This suggests that the curved freezing tube offers a certain “offset” effect compared to the freezing wall created by a straight tube. Furthermore, the “counteracting” effect becomes more pronounced with smaller s-values, emphasizing the heightened “offset” effect in such cases.
4.3. Analysis of the Seepage Field
Similarly, the change in groundwater seepage velocity also reflects the freezing effect of the frozen pipes. The seepage field maps of different pipes after freezing were studied, taking the straight pipe and the curved pipe with s = 7 as an example. Figure 5 shows the final seepage-velocity maps of the straight pipe and the curved pipe with s = 7 after freezing for 58 d, and a series of seepage-velocity contours are plotted to analyze the seepage velocity. As shown in the seepage-velocity cloud diagram, the seepage velocity on the left side of the soil body decreases from the model boundary to the freezing area, and the seepage velocity on the right side gradually increases from the freezing area to the downstream boundary. The flow is nearly absent in the freezing area, and seepage velocity is almost 0; i.e., the freezing wall blocks the hydraulic connection between the inside and outside of the wall. This is due to the decreasing temperature of the freezing tubes, which causes the hydric soil in the surrounding area to completely transform into ice and causes the groundwater to flow downstream from the upper and lower sides around the freezing walls. Considering the seepage-velocity contour, the upper and lower ends have higher seepage velocities that are several orders of magnitude higher than those of the left and right ends. This can be attributed to the large heat flux and low heat-exchange capacity at the upper and lower ends. In addition, during freezing, more and more moisture due to the generation of the freezing wall is blocked from being gathered at the upper and lower ends, which accelerates the seepage velocity at the upper and lower ends.
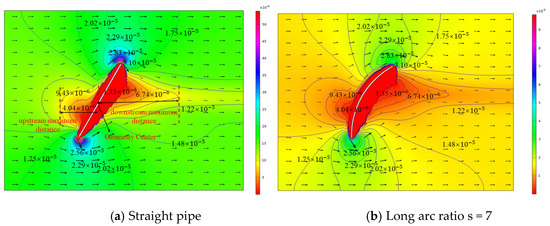
Figure 5.
Cloud diagram of seepage field in straight and s = 7 curved tubes and some isovelocity line schematics.
Various tube-freezing methods exhibit similar trends in their impact on the seepage field, albeit with some distinctions in their outcomes. When plotting seepage-velocity contours, it becomes evident that identical isovelocity lines assume varying positions on the cloud diagrams of different frozen tubes. In this study, the primary focus is on examining the obstructive influence of the frozen wall on the water flow. As a result, our analysis concentrates on the coverage of isovelocity lines at the left and right extremities. A seepage velocity of 9.43 × 10⁻⁶ m/s was selected for the study, i.e., the part circled in red in Figure 5, where the water velocity is lower than 9.43 × 10⁻⁶ m/s within the range and higher outside it. The reference position is taken to be the geometric center of the straight pipe, and the furthest distance of this flow velocity value is measured both upstream and downstream from the geometric center. This measurement is conducted to facilitate a more effective comparison of the freezing and waterproofing effects, as illustrated in Figure 6.
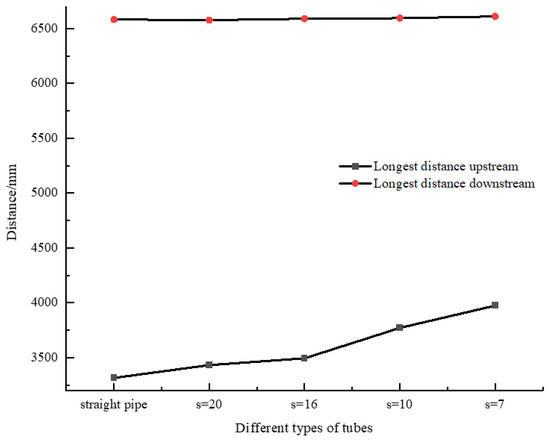
Figure 6.
Variation in the distance of 9.43 × 10⁻⁶ m/s isovelocity line from the geometric center for different tubes.
As shown in Figure 6, the change in the s-value has a negligible effect on the farthest downstream distance; the smaller the s, the larger the arc, and the farthest upstream distance gradually increases; i.e., the same isovelocity line is farther away from the freezing area, and the seepage velocity within the isovelocity line is smaller, which indicates that the freezing wall produces a better interception of the flow of groundwater. At the position with the same seepage velocity, the smaller the value of s, the closer the isovelocity line of the curved pipe is to the upstream head boundary, reflecting better water insulation. The reason may be that due to the influence of seepage, the efficiency of heat exchange both upstream and downstream is increased, resulting in a rapid drop in stratum temperature and an accelerated phase-change rate. This accelerated process shortens the time available for the flowing water to accumulate within the freezing region, causing it to transform into ice-crystal water before it can accumulate there. Therefore, due to the larger curvature of the freezing pipe, the area of freezing influence is large, the phase-change area is large, the reaction is more obvious, and the amount of unfrozen water icing in the solid soil layer becomes more, and closer to the freezing wall, the seepage rate is smaller. Therefore, the larger the curvature of the freezing pipe, the better the effect of freezing and waterproofing. This conclusion can provide new ideas for similar engineering for local seepage problems.
5. Modeling and Analysis of Multiple Pipes
5.1. Numerical Modeling of Multiple Pipes
In Section 4, the development of the temperature and seepage fields under single-pipe freezing was investigated in the two-dimensional XOZ plane for the freezing pipe; the results show that the curved pipe has a more advantageous effect in separating and stopping water when facing the horizontal seepage in the stratum. The longer the arc ratio of s, the more obvious the advantage. Similarly, in order to highlight the advantage of the arc pipe in the third dimension (the Y direction), an additional 10 m thickness is introduced to the stratum, extending the previously two-dimensional setup. Three freezing pipes, spaced at 500 mm intervals along the Y direction, are then positioned while keeping all other conditions unchanged. To ensure a more effective comparative analysis of freezing effects, the disparity in the head is reduced to 5 m, establishing a three-dimensional multi-pipe numerical model. Figure 7 shows the numerical model for multi-pipe freezing.
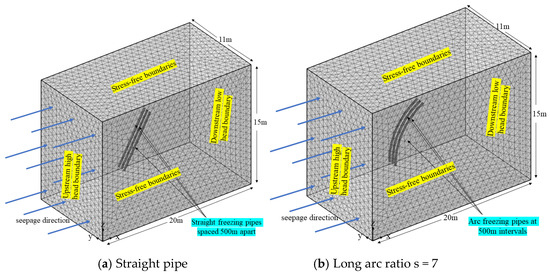
Figure 7.
Numerical modeling of multi-pipe freezing.
5.2. Discussion
In Section 4, the different two-dimensional types of single-pipe model-calculation results were compared. Then, the multi-pipe model was mainly used in the thickness direction of the temperature field and seepage field to carry out the study. Two solid frozen single-pipe intermediate weak zones were selected for analysis, where the straight pipe and the length of the arc ratio of the s = 7 arc pipe model were selected with a Y = 0.25 m cross-section.
As can be seen from Figure 8, after 58 days of freezing, the weakest points in the two multi-pipe models had completely frozen in a cross-circle pattern. The overall formation indicates an average temperature consistently lower than −10 °C within the stable freezing area. As shown by the temperature field in the cloud diagram, particularly within the red line boundary defined by the freezing wall, the main freezing area of the straight pipe’s weakest cross-section exhibits an average thickness of approximately 1.12 m. As one moves away from the main surface, at a distance of −2000 mm from it, the thickness of the freezing wall measures around 1.19 m. The average thickness of the freezing wall in the main freezing area of the s = 7 curved pipe is about 1.19 m, and the thickness of the freezing wall at the distance of −2000 mm from the main surface is up to 1.31 m. In the arc-shaped pipe, the average thickness of the freezing wall is 70 mm, and at a position −2000 mm away from the main surface, the difference in the freezing wall’s thickness is 120 mm, as it is for the single pipe in Section 3.2. This verifies that the arc-shaped pipe is able to maintain a relatively thick freezing wall in the positive freezing period under the action of seepage flow. Secondly, the inter-circle time of the freezing wall can also reflect the freezing effect of different tubes. The intersection of the −10 °C isotherm and −1 °C isotherm is different: the minimum freezing zone of the curved pipe starts to appear on the 4th d, and the maximum freezing zone starts to appear on the 5th d, while the minimum straight freezing zone starts to appear on the 5th d, and the maximum freezing zone starts to appear on the 6th d. To summarize, the arc-shaped pipe freezing is nearly 1 d earlier than the intersection time of the straight pipe freezing.
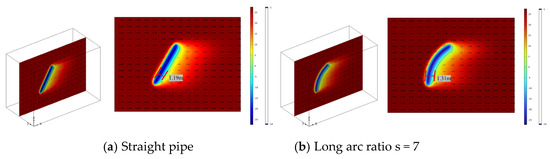
Figure 8.
Cloud view of the freezing temperature field of multiple tubes with Y = 0.25 m cross-section.
In addition, in order to further study the freezing effect of different tubes, Figure 9 shows the isovelocity line variation cloud map of the X = 2.7 m cross-section, and Table 4 makes a comparison of different ranges of isovelocity line envelopes.
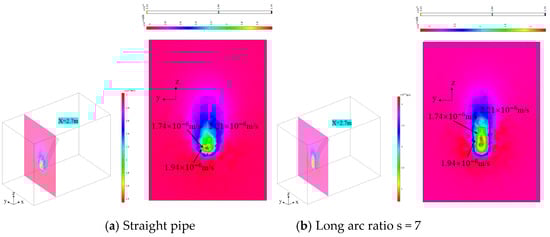
Figure 9.
Clouds of isochronous variation for the X = 2.7 m cross-section.
Table 4.
Comparison table of different isochronous envelope ranges.
In Section 4.3, two-dimensional calculations yielded smaller seepage velocities at the same location on the water surface of the curved pipe model, which provides a better blockage of the water flow. The same velocities are also chosen here for comparison. Observation of the cloud diagram reveals that the magnitude of the velocity change is large in the middle part, which is because it is in the upstream region, i.e., in the lower end of the freezing tube, and it gradually decreases higher up as the seepage velocity increases progressively away from the freezing tube. When the seepage velocity is the same, the isovelocity line envelope range is larger for the s = 7 curved pipe, while the straight pipe’s envelope range is slightly smaller and the inner velocity of the envelope is smaller than the outer velocity. This suggests that as the coverage increases, the velocity within the region becomes broader and slower, leading to a more significant waterproofing effect on the waterfront side. Conversely, when the coverage is smaller, this effect is less pronounced. This observation further confirms the conclusion that the curved pipe demonstrates superior water-blocking capabilities.
6. Effect of Working Conditions
6.1. Modeling of Working Conditions
The tunnel vault has a relatively shallow overburden thickness of approximately 9 m, categorized as a shallowly buried tunnel. It has a maximum diameter of 6.5 m and is excavated in two steps: upper and lower. During the excavation of the lower step, there was an issue with water and sand gushing, and it was impossible to continue the excavation construction. To address this, temporary concrete blocking walls were constructed on both sides of the lower step’s outflow section to impede water flow. The artificial freezing method was then employed to fortify the water containment. The layout of the freezing- and temperature-measuring holes is illustrated in Figure 10.
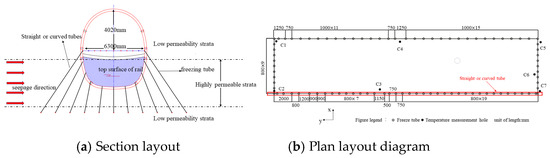
Figure 10.
Palm face section and freezing tube layout plan.
Figure 11 depicts the schematic of the model’s geometry. Building upon the engineering profile, Section 3’s basic assumptions, and relevant conditions, a freezing model for both a straight pipe and an arc pipe with a ratio of 7 was established. The material properties of the stratum in this model remain consistent with those outlined in Section 3. However, there is a variation in stratum permeability, with only the high-permeability stratum retaining its original characteristics, while the permeability for the remaining strata is set to 10−9 m2.
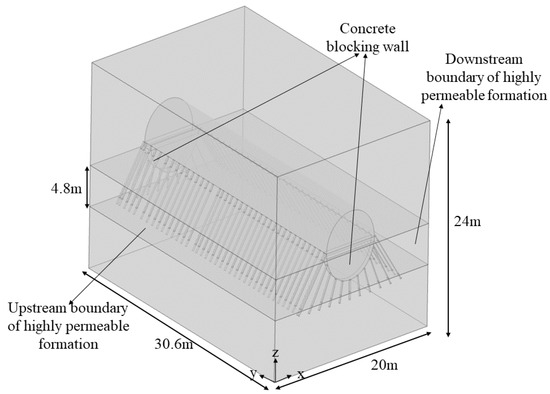
Figure 11.
Geometric schematic diagram of shallowly buried concealed tunnel model.
The upstream and downstream permeable boundaries exhibit a head difference of 1.2 m, while all other boundaries are considered impermeable. The remaining parameters and settings for both the single-pipe and multi-pipe freezing configurations remain unchanged. Following the grid division and calculations, the study subsequently replaced the straight pipe with a curved pipe in the waterfront for comparative analysis.
6.2. Analysis of Results
The relevant results are shown in Figure 12. The primary focus of the analysis here is on the waterfront side, with the key distinction being the difference in freezing pipe types, while all other parameters and conditions remain the same. A layer of frozen soil curtain was wrapped around the tunnel after freezing reinforcement, with frozen soil within the brown area (−1 °C contour) and stable frozen soil curtain within the blue area (−10 °C contour). Since the curtain range exceeds the boundary of the highly permeable water soil layer, the final result shows that there is almost no water infiltration into the tunnel, and a waterproofing effect is achieved.
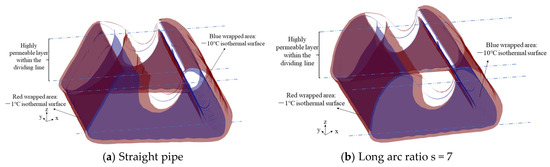
Figure 12.
Equivalent surface diagram for different tubes frozen at 58 d.
After comparative analysis, it was observed that in the case of the straight pipe freezing, the −1 °C isotherm of the freezing curtain began to close the intersection circle on the 7th day and continued to expand outward, completing its basic closure on the 10th day. Conversely, the −10 °C isotherm in this configuration started intersecting with the circle on the 10th day and thickened over time. For the arc-shaped pipe freezing, the −1 °C isotherm initiated its closure of the intersection circle as early as the 6th day and continued to expand outward, reaching its basic closure on the 10th day. The −10 °C isotherm, in this case, began closing the intersection circle on the 11th day and also exhibited a gradual thickening trend. This indicates that when using freezing methods for curved and straight tubes, the contour of the curtain exhibits a consistent pattern. This consistency can be attributed to the alteration of the freezing tube’s curvature while maintaining constant freezing tube spacing and cross-section dimensions. Under these conditions, the cold generated by different freezing tubes diffuses at an equal rate in the direction of the tunnel excavation, aligning with the hydrostatic conditions outlined in Section 4.2. Consequently, various tube curvatures result in the same thickness for the freezing wall, and the time for achieving −1 °C and −10 °C closures follows a similar pattern.
For the curtain on the water-facing side, the excavated face of the section with the most unfavorable reinforcement zone and the largest freezing distance is taken as the object of study, the thickness of the curtain is analyzed, and the change in the thickness of the stabilized freezing curtain of the section with the freezing process is plotted, along with the changes at the temperature-measurement apertures C2 and C3 on the water-facing side. The thickness of the stable freezing curtain of the section with the freezing process is analyzed (Figure 13).
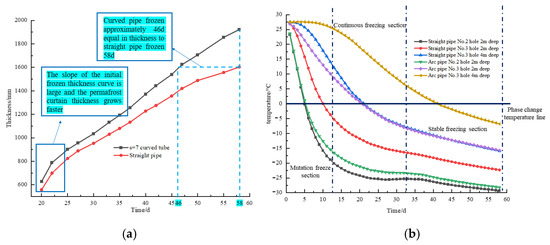
Figure 13.
A plot of curtain thickness versus time in the least favorable reinforcement zone and a line graph of temperature change in each temperature-measurement hole. (a) Thickness of the stabilized permafrost curtain, (b) Temperature-measurement hole temperature.
As can be seen from the temperature plot, the temperature changes in three distinct steps—the sudden change freezing section, continuous freezing section, and stable freezing section. The freezing process occurs in distinct stages. Initially, at the onset of freezing until the phase-change stage, the stratum temperature undergoes a rapid decline, with intense heat exchange, leading to a steep curve drop, known as the sudden change in the freezing section. As freezing progresses, temperatures continue to decrease, marking the transition into the continuous freezing section. During this phase, the temperature difference between the freezing tube and the stratum diminishes, resulting in a reduction in the rate of heat exchange and a slower decline in temperature compared to the continuous freezing section, signifying the stabilization of the freezing section.
When analyzing temperature measurements from specific holes, it becomes evident that the temperature drop is more pronounced and results in a lower final freezing temperature in the No. 2 hole for both freezing tubes. However, the temperature in the No. 2 hole of the curved tube is slightly higher than that of the straight tube, which is attributed to the curvature of the tube, which positions the temperature-measurement hole farther from the solid, resulting in a slightly lower temperature. A similar trend is observed in the No. 3 hole position of the curved tube, where the freezing temperature exhibits a slower rate of decline.
The plot of the frozen soil-curtain thickness shows that the slope of the growth curve of the pre-freezing curtain thickness and the curtain thickness growth rate are large, as borne out by measured temperatures, which verifies the reasonableness of the data.
After freezing is complete, the long arc ratio (s = 7) results in an arc-pipe-freezing wall about 400 mm thicker than that of the straight pipe. The arc pipe reaches a thickness around 46 days that is equivalent to the thickness at 58 days needed for the straight pipe, making it approximately 1600 mm thick and reducing construction time by 12 days. Additionally, the high-head side of the model shows an arched freezing wall, indicating improved structural stability and confirming the arc pipe’s superior water isolation in the gushing stratum.
7. Conclusions
In this study, the development and characteristics of the temperature field and seepage field of a single tube and multiple tubes frozen at different arcs were analyzed. Additionally, this study has conducted simulations to investigate the effectiveness of water-stopping conditions in shallowly buried tunnels for both straight tubes and long arc tubes with a ratio of s = 7 under the conditions of water surging. Subsequently, this study has performed a comparative analysis, leading us to the following key conclusions:
- (1)
- During the freezing process, the shape of the curtain is mainly determined by the shape of the freezing monotube; as the freezing process progresses, the upstream cold is carried downstream by the groundwater, and a “cold channel” appears in the soil layer.
- (2)
- As the long arc ratio s decreases and the curvature of the pipe increases, after freezing with a single pipe in the presence of water flow, the change in the freezing-wall thickness in the curved pipe becomes smaller than that of the straight pipe. This difference is particularly prominent in the upstream section, where change in the freezing wall’s thickness in the straight pipe exceeds that of the s = 7 curved pipe by approximately 350 mm at a distance of −2000 mm from the main surface. A smaller s-value brings the freezing pipe closer to the permeability boundary, resulting in a shorter time for the groundwater phase change and a closer proximity of the upstream seepage-velocity contour to the boundary, ultimately leading to improved effectiveness of the water barrier.
- (3)
- In the multi-pipe freezing model, the s = 7 curved pipe has a freezing-wall thickness approximately 120 mm greater than that of the straight pipe at a distance of −2000 mm from the main surface.
- (4)
- The use of artificial freezing of water isolation in the lower step of a shallowly buried tunnel as a solution is safe and reliable and can provide new ideas for similar engineering risks.
- (5)
- Under the water-surging condition of this shallowly buried excavation, the most unfavorable permafrost curtain thickness of the freezing of a straight pipe at 58 d can be reached by using the freezing of an arc pipe at 46 d, which effectively shortens the construction period to 12 d and proves the superiority of the freezing of the arc pipe to block water.
Author Contributions
Conceptualization, K.Y. and J.H.; methodology, J.H.; software, J.H.; validation, J.H. and K.Y.; formal analysis, K.Y.; investigation, K.Y.; resources, J.H. and K.Y.; data curation, K.Y.; writing—original draft preparation, K.Y.; writing—review and editing, T.W.; visualization, K.Y.; supervision, J.H.; project administration, J.H.; funding acquisition, J.H. and T.W. All authors have read and agreed to the published version of the manuscript.
Funding
This research was funded by the State Key Laboratory for GeoMechanics and Deep Underground Engineering, China University of Mining and Technology (SKLGDUEK2204), the Hainan University Collaborative Innovation Center Project (XTCX2022STB09), the Hainan Provincial Natural Science Foundation Innovation Research Team Project (522CXTD511), the High-tech Direction Project of Key R&D Program of Hainan Provincial Science and Technology Department (ZDYF2021GXJS020), and the Enterprise Entrusted Project of Hainan University (HD-KYH-2022405).
Institutional Review Board Statement
Not applicable.
Informed Consent Statement
Not applicable.
Data Availability Statement
Not applicable.
Conflicts of Interest
The authors declare no conflict of interest.
References
- Levin, L.; Golovatyi, I.; Zaitsev, A.; Pugin, A.; Semin, M. Thermal monitoring of frozen wall thawing after artificial ground freezing: Case study of Petrikov Potash Mine. Tunn. Undergr. Space Technol. 2021, 107, 103685. [Google Scholar] [CrossRef]
- Cheng, P.; Guo, J.; Yao, K.; Chen, X. Numerical investigation on pullout capacity of helical piles under combined loading in spatially random clay. Mar. Georesour. Geotechnol. 2023, 41, 1118–1131. [Google Scholar] [CrossRef]
- Liu, X.; Shen, Y.; Zhang, Z.; Liu, Z.; Wang, B.; Tang, T.; Liu, C. Field measurement and numerical investigation of artificial ground freezing for the construction of a subway cross passage under groundwater flow. Transp. Geotech. 2022, 37, 100869. [Google Scholar] [CrossRef]
- Cheng, P.; Liu, Y.; Li, Y.P.; Yi, J.T. A large deformation finite element analysis of uplift behaviour for helical anchor in spatially variable clay. Comput. Geotech. 2022, 141, 104542. [Google Scholar] [CrossRef]
- Yan, Q.; Wu, W.; Zhong, H.; Zhao, Z.; Zhang, C. Temporal and spatial variation of temperature and displacement fields throughout cross-passage artificial ground freezing. Cold Reg. Sci. Technol. 2023, 209, 103817. [Google Scholar] [CrossRef]
- Han, L.; Ye, G.L.; Li, Y.H.; Xia, X.H.; Wang, J.H. In situ monitoring of frost heave pressure during cross passage construction using ground-freezing method. Can. Geotech. J. 2016, 53, 530–539. [Google Scholar] [CrossRef]
- Vitel, M.; Rouabhi, A.; Tijani, M.; Guérin, F. Modeling heat transfer between a freeze pipe and the surrounding ground during artificial ground freezing activities. Comput. Geotech. 2015, 63, 99–111. [Google Scholar] [CrossRef]
- Huang, S.B.; Guo, Y.L.; Liu, Y.Z.; Ke, L.H.; Liu, G.F.; Chen, C. Study on the influence of water flow on temperature around freeze pipes and its distribution optimization during artificial ground freezing. Appl. Therm. Eng. 2018, 135, 435–445. [Google Scholar] [CrossRef]
- Li, K.Q.; Yin, Z.Y.; Liu, Y. Influences of spatial variability of hydrothermal properties on the freezing process in artificial ground freezing technique. Comput. Geotech. 2023, 159, 105448. [Google Scholar] [CrossRef]
- Hu, X.D.; Deng, S.J.; Ren, H. In situ test study on freezing scheme of freeze-sealing pipe roof applied to the Gongbei tunnel in the Hong Kong-Zhuhai-Macau bridge. Appl. Sci. 2016, 7, 27. [Google Scholar] [CrossRef]
- Hu, X.D.; Li, X.Y.; Wu, Y.H.; Han, L.; Zhang, C.B. Study on the effect of inter-tube freezing and water sealing by the tube curtain freezing method in Gongbei Tunnel. J. Geotech. Eng. 2019, 41, 2207–2214. [Google Scholar]
- Xiao, C.Y.; Hu, X.D.; Zhang, Q.H. Temperature field characteristics of locally frozen permafrost wall with multi-row pipe. J. Rock Mech. Eng. 2007, S1, 2694–2700. [Google Scholar]
- Rocha, L.; Saboya, F.; Vargas, J. A comparative study of elliptical and circular sections in one- and two-row tubes and plate fin heat exchangers. Int. J. Heat Fluid Flow 1997, 18, 247–252. [Google Scholar] [CrossRef]
- Bai, T.L.; Ye, C.; Li, Z.C.; Liang, R.Z.; Xiao, M.Z.; Cai, B.H. Study on the freezing development law of elliptical freezing tube in water-rich sand layer under seepage. Saf. Environ. Eng. 2022, 29, 85–92. [Google Scholar] [CrossRef]
- Wu, Y.W.; Hu, J.; Zeng, D.L.; Wang, Z.X.; Liu, W.B. Construction reliability analysis of new tunnel end extension structure. Highway 2019, 64, 287–293. [Google Scholar]
- Chen, L.; Hu, J.; Gao, L.; Wang, Z.X.; Zeng, D.L.; Wu, Y.W. Numerical analysis of temperature field of ring freeze reinforced structure during shield tail brush replacement. Sci. Technol. Eng. 2021, 21, 1593–1600. [Google Scholar]
- Yang, P.; Zhao, J.L.; Li, L. An artificial freezing technique to facilitate shield tail brush replacement under high pore-water pressure using liquid nitrogen. KSCE J. Civ. Eng. 2021, 25, 1504–1514. [Google Scholar] [CrossRef]
- Yan, Q.X.; Wu, W.; Zhang, C.; Ma, S.Q.; Li, Y.P. Monitoring and evaluation of artificial ground freezing in metro tunnel construction-a case study. KSCE J. Civ. Eng. 2019, 23, 2359–2370. [Google Scholar] [CrossRef]
- Rouabhi, A.; Jahangir, E.; Tounsi, H. Modeling heat and mass transfer during ground freezing taking into account the salinity of the saturating fluid. Int. J. Heat Mass Transf. 2018, 120, 523–533. [Google Scholar] [CrossRef]
- Sudisman, R.A.; Osada, M.; Yamabe, T. Experimental Investigation on Effects of Water Flow to Freezing Sand around Vertically Buried Freezing Pipe. J. Cold Reg. Eng. 2019, 33, 04019004.1–04019004.12. [Google Scholar] [CrossRef]
- Alzoubi, M.A.; Madiseh, A.; Hassani, F.P.; Sasmito, A.P. Heat transfer analysis in artificial ground freezing under high seepage: Validation and heatlines visualization. Int. J. Therm. Sci. 2019, 139, 232–245. [Google Scholar] [CrossRef]
- Wang, Y.; Liu, Y.G.; Bian, K.; Zhang, H.; Wang, X.J.; Zhang, H.Y.; Wang, W.L.; Qin, S.J. Influence of low temperature tail water reinjection on seepage and heat transfer of carbonate reservoirs. Energy Explor. Exploit. 2021, 39, 2062–2079. [Google Scholar] [CrossRef]
- Long, W.; Rong, C.X.; Shi, H.; Huang, S.Q.; Wang, B.; Duan, Y.; Wang, Z.; Shi, X.; Ma, H.C. Temporal and Spatial Evolution Law of the Freezing Temperature Field of Water-Rich Sandy Soil under Groundwater Seepage: A Case Study. Processes 2022, 10, 2307. [Google Scholar] [CrossRef]
- Al-Damluji, O.A.; Fattah, M.Y.; Al-Adthami, R.A. Solution of two-dimensional steady-state flow field problems by the boundary element method. J. Eng. Technol. 2004, 23, 750. [Google Scholar]
- Wu, T.; Zhou, X.M.; Zhang, L.G.; Zhang, X.J.; He, X.N.; Xu, Y. Theory and technology of real-time temperature field monitoring of vertical shaft frozen wall under high-velocity groundwater conditions. Cold Reg. Sci. Technol. 2021, 189, 103337. [Google Scholar] [CrossRef]
- Hu, R.; Liu, Q.; Xing, Y. Case study of heat transfer during artificial ground freezing with groundwater flow. Water 2018, 10, 1322. [Google Scholar] [CrossRef]
- Li, Z.M.; Chen, J.; Sugimoto, M.; Ge, H.Y. Numerical simulation model of artificial ground freezing for tunneling under seepage flow conditions. Tunn. Undergr. Space Technol. 2019, 92, 103035. [Google Scholar] [CrossRef]
- Li, X.K.; Li, X.; Liu, S.; Qi, J.L. Thermal-seepage coupled numerical simulation methodology for the artificial ground freezing process. Comput. Geotech. 2023, 156, 105246. [Google Scholar] [CrossRef]
- Xu, P.; Han, S.; Xing, Y. Analysis of influencing factors of temperature field in freezing construction of metro connecting passage. Geotech. Geol. Eng. 2022, 40, 1331–1343. [Google Scholar] [CrossRef]
- Li, M.; Cai, H.; Liu, Z.; Pang, C.; Hong, R. Research on Frost Heaving Distribution of Seepage Stratum in Tunnel Construction Using Horizontal Freezing Technique. Appl. Sci. 2022, 12, 11696. [Google Scholar] [CrossRef]
- Wu, Y.; Zeng, H.; Hu, J.; Ren, X.; Xue, X. Finite Element Study on Temperature Field of Underwater Dredging Devices via the Artificial Ground Freezing Method. Geofluids 2022, 2022, 7502693. [Google Scholar] [CrossRef]
- Chen, L. Study on the Evolution of Temperature Field of Different Freezing Reinforcement Schemes for Shield Tail Brush Replacement under Seepage. Master′s Thesis, Hainan University, Haikou, China, February 2023. [Google Scholar]
- Wang, B.; Rong, C.X.; Lin, J.; Cheng, H.; Cai, H.B. Study on the formation law of the freezing temperature field of freezing shaft sinking under the action of large-flow-rate groundwater. Adv. Mater. Sci. Eng. 2019, 2019, 1670820. [Google Scholar] [CrossRef]
Disclaimer/Publisher’s Note: The statements, opinions and data contained in all publications are solely those of the individual author(s) and contributor(s) and not of MDPI and/or the editor(s). MDPI and/or the editor(s) disclaim responsibility for any injury to people or property resulting from any ideas, methods, instructions or products referred to in the content. |
© 2023 by the authors. Licensee MDPI, Basel, Switzerland. This article is an open access article distributed under the terms and conditions of the Creative Commons Attribution (CC BY) license (https://creativecommons.org/licenses/by/4.0/).