1. Introduction
With the rapid development of artificial intelligence and the continuous promotion of digital transformation in education, technology also plays a crucial role in the field of education, as it helps to improve the quality of education [
1,
2]. Traditional search engines cannot meet the resource retrieval needs of students [
3]. Contemporary learners are striving to solve a common dilemma: the task of identifying the most suitable learning materials among numerous online resources. Often, they find themselves overwhelmed by information overload, which hampers their learning effectiveness [
4]. In the face of this ‘information overload’ quandary, the question of furnishing personalized learning resource recommendations has emerged as a critical concern [
5]. However, high dropout rates and low retention rates have emerged in online learning environments [
6,
7]. In MOOC, the relevance of courses can affect the dropout rate of users [
8]. Therefore, it is more necessary to intelligently recommend courses with complementary knowledge rather than alternative courses. Intelligent algorithms and technologies can filter out irrelevant learning resources and automatically recommend relevant resources to learners based on their personalized preferences, enabling them to acquire knowledge more effectively and promote personal development [
9].
The need to suggest preferences in virtual environments is considered an important component of online education [
10]. Learners usually have different learning needs and preferences, which can affect their learning efficiency [
11,
12]. This article aims to explore methods to improve the effectiveness of learning resource recommendations, provide more personalized suggestions, enhance students’ learning experience, and ultimately improve learning outcomes. The inspiration for this experiment comes from the concept of “one person, one model”, which reduces the burden of a single model trying to adapt to all scenes [
13]. It analyzes the learning resources that are most suitable for this specific group in the current learning environment. Based on real-world conditions, we investigated which resource types are most advantageous among various learning materials and whether different resource types exhibit different learning preferences.
Recommendation algorithms, as an effective means to solve the problem of “information overload,” have become a hot topic in the academic community and have been widely applied [
14]. It can effectively solve the problem of user information overload, making it possible to recommend projects related to users [
15]. Learning resource recommendation systems, as intelligent tools, can analyze learners’ personalized characteristics and the associations between learning resources, thereby providing accurate learning recommendations to help learners acquire knowledge more efficiently. Wang et al. [
16] believe that learning needs are not only related to current abilities but also to future development plans. They jointly model current abilities and future goals and, through a unique mechanism for identifying needs, obtain the development needs of different learners, thereby recommending the most suitable course. Lv et al. [
17] proposed a knowledge point recommendation method based on a weighted knowledge graph, where each node represents a knowledge point and is weighted based on students’ mastery level. Wan et al. [
18] designed a learner impact model (LIM) to capture learners’ interpersonal relationships, optimized the learner impact model using intuitionistic fuzzy logic, and found the most suitable learner through self-organization. Zhu et al. constructed a heterogeneous graph of teaching evaluation and transformed student information, interpersonal relationships, and evaluation texts into a network structure, aggregating multimodal and heterogeneous course information into a graph-based network [
19]. A learning object recommendation model based on heterogeneous learning behavior and knowledge graph is proposed, which eliminates the influence of noise and obtains complex interaction behavior by using an attentive composition-based graph convolutional network (ACGCN) and dense feature-based operation-aware network (DFOAN) [
20].
In conventional recommendation systems, the common practice is to utilize explicit rating data provided by users [
21]. However, in the realm of online course learning, explicit rating actions are infrequent, rendering the application of explicit feedback to personalized learning resource recommendations challenging. In contrast, implicit feedback, such as user interactions like clicks and browsing behavior on items [
22], can be effectively captured and analyzed. Implicit feedback can customize recommendations based on each interaction [
23]. In their course activities, students leave behind traces that implicitly express their preferences. This type of data is relatively easy to gather and can be leveraged as implicit feedback. To explore the utilization of implicit data in recommendation systems, researchers have delved into various dimensions. Chen et al. [
24] concentrated on implicit content within multimedia interactions and introduced a novel attention mechanism called Attentive Collaborative Filtering (ACF) into collaborative filtering algorithms to incorporate user behavior information and preferences. Zhou et al. [
25] underscored the significance of user micro-behavior, which offers a deeper and more granular understanding of users. They put forth a recommendation framework for modeling the sequence and impact of micro-behavior, abbreviated as RIB. Meanwhile, Xu et al. [
26] posited that learners’ learning behavior can provide deeper insights into their knowledge mastery. They introduced a learning behavior-oriented knowledge tracing (LBKT) model and investigated three typical learning behaviors: speed, attempts, and hints. By analyzing these learning behaviors, it becomes possible to infer the most indicative knowledge state.
While knowledge graph-based recommendation systems excel in comprehension, they exhibit limited adaptability to the personalized needs of learners. On the other hand, collaborative filtering-based recommendation systems can provide personalized learning suggestions, but they often encounter data sparsity and cold start issues, making it difficult to obtain the best recommendations [
27,
28]. Researchers have uncovered that the integration of knowledge graphs into recommendation systems can enhance recommendation performance, augment interpretability, and bolster personalization [
29]. Gu et al. [
30] amalgamated the RippleNet model with collaborative filtering, taking into account both movie attribute data and user-movie interaction data. This approach seeks to strike a balance between considering item attributes and user interactions. In a similar vein, Feng et al. [
31], building upon collaborative filtering, crafted item knowledge graphs and user knowledge graphs to enhance information richness. This involved enriching the matrix with item feature data and extracting user preferences to enhance recommendation accuracy. Li et al. [
32] integrated the knowledge graph into the task of ocean forecasting data while considering the correlation of user behavior among forecasters.
Building upon the aforementioned background, this article integrates knowledge graph information into the recommendation system by constructing a knowledge graph of the course on the basis of collaborative filtering recommendations. In addition, construct an implicit feedback model, mine students’ implicit feedback data, and design different preference rules to apply to the recommendation process.
The primary contributions of this article are outlined as follows:
- (1)
This study integrates user learning behavior with the semantic information of learning resources, leveraging the strengths of both knowledge graphs and collaborative filtering algorithms.
- (2)
With the aid of students’ learning records, our study centers on examining the influence of video and graphic learning resources on students. Building upon previous experiments, we delve deeply into the effects of resource types to elucidate their impact on students’ learning outcomes and personalized requirements.
In the contemporary digital era, an array of learning resources is available, yet video and graphic resources stand as predominant forms. The focus in online learning environments is to recommend personalized learning materials based on the specific characteristics of learners [
33,
34]. This experiment aims to assess the efficacy of these two resource types in catering to diverse learning preferences among students. Such insights can aid educators in making informed decisions regarding resource selection and optimization, ultimately enhancing personalized learning experiences. Through an extensive investigation of the impact of these resource categories, this study aspires to offer actionable insights for the education sector, fostering more effective development and utilization of learning resources.
3. Combining Knowledge Graph and Collaborative Filtering Recommendation Algorithm
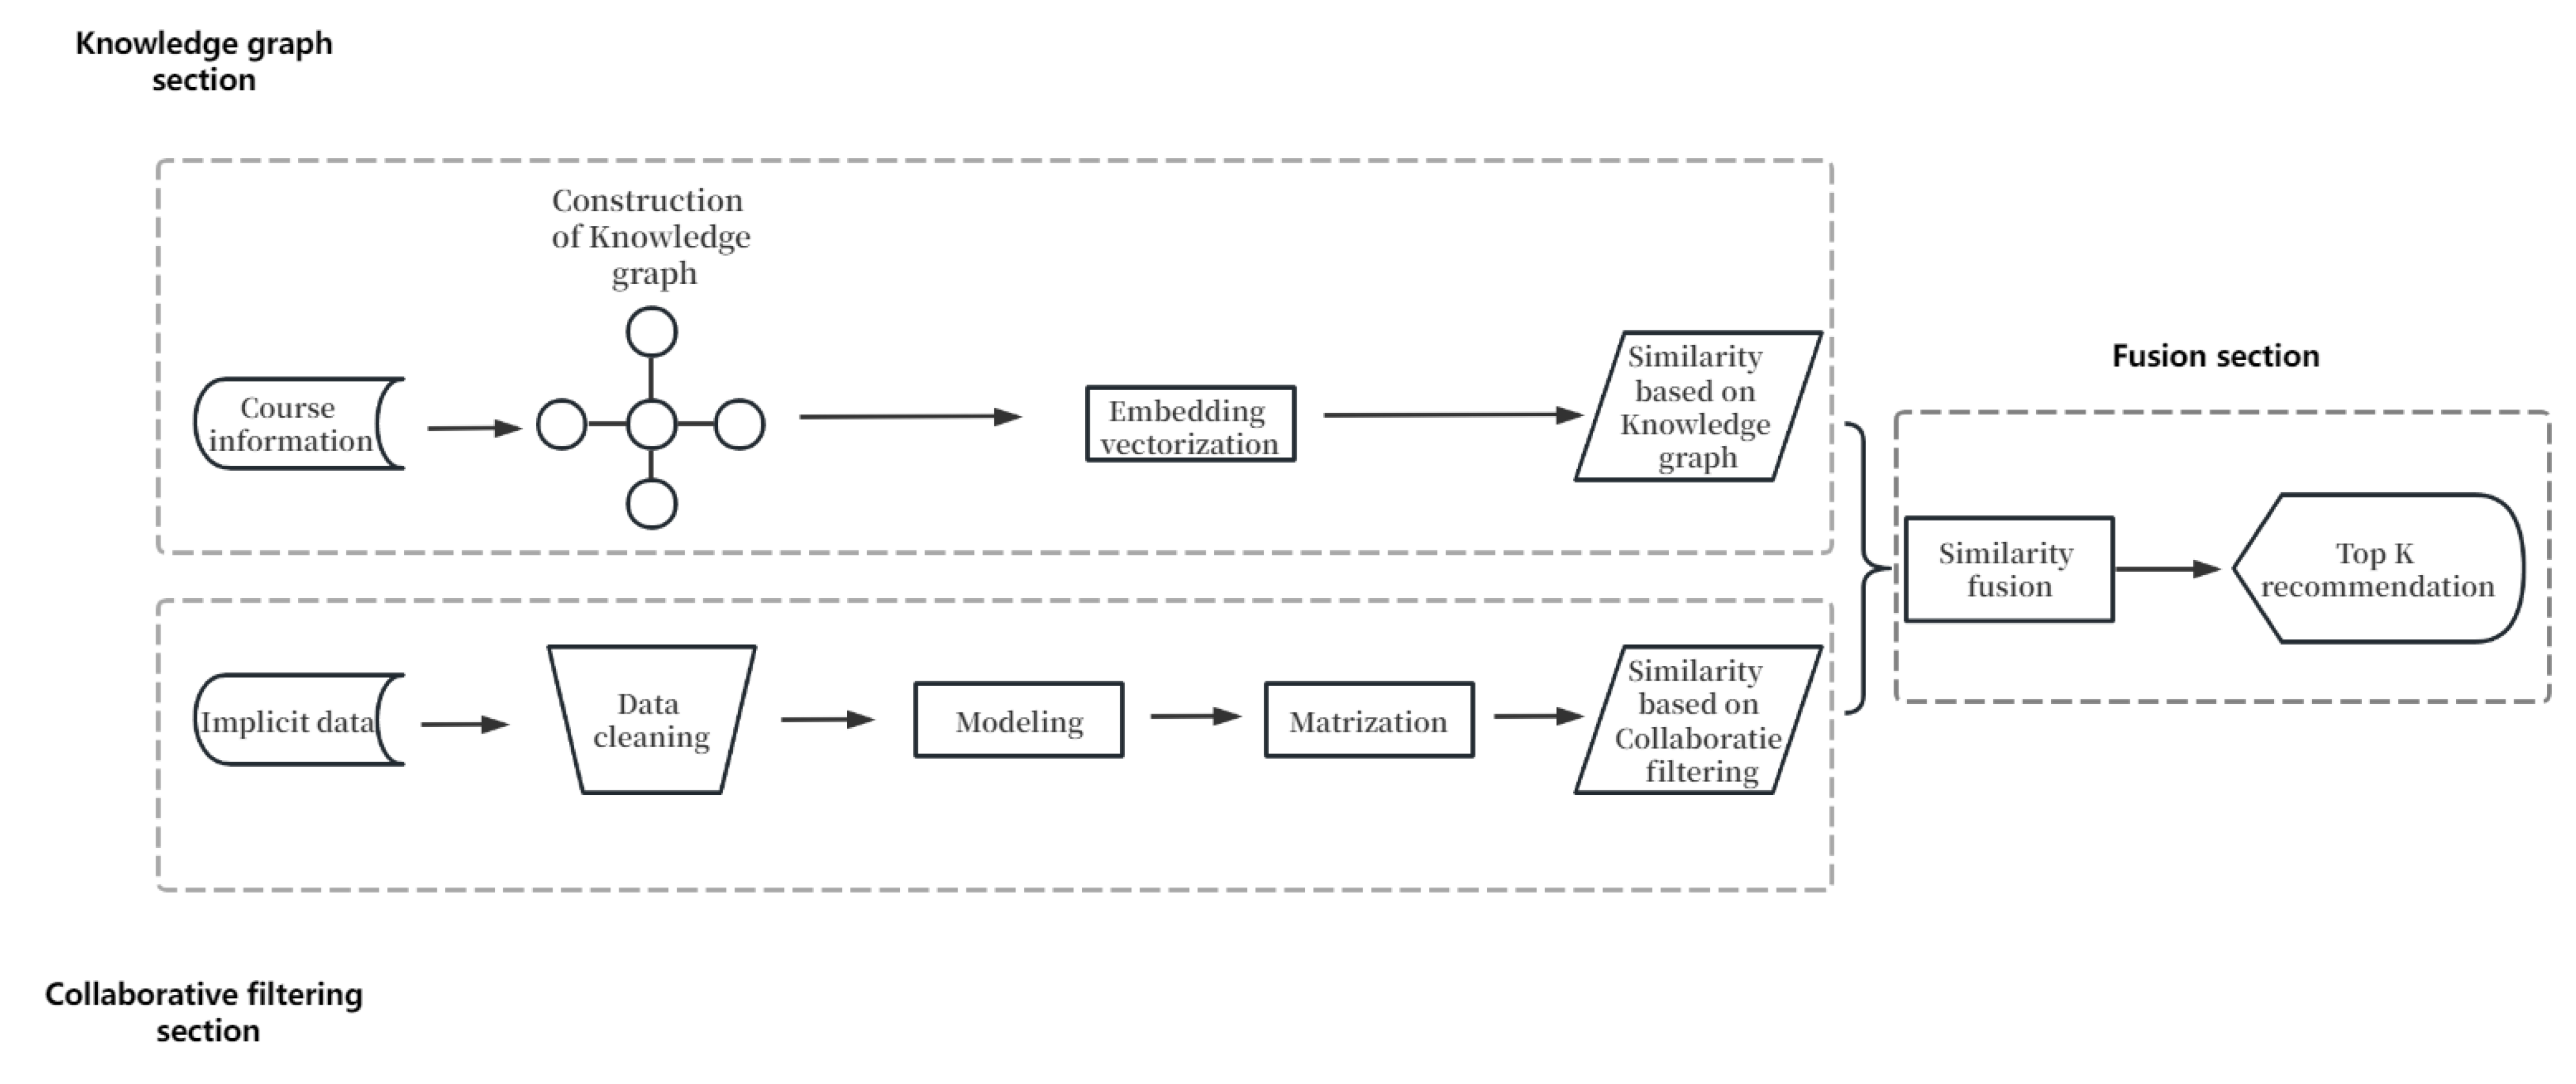
The algorithm described in this article proceeds as follows: Initially, it analyzes course information and constructs a course knowledge graph. Using the knowledge graph embedding method, it converts chapter content into vector representations and calculates the similarity between chapters. Subsequently, implicit user data are collected, and preference rules are applied to calculate chapter similarity. Finally, the algorithm combines collaborative filtering and knowledge graph similarity to achieve accurate and personalized recommendation results.
The algorithm’s framework, depicted in
Figure 2, consists of three main parts.
The first part focuses on the knowledge graph. It begins by gathering course information and constructing a knowledge graph for the course. This knowledge graph is used to vectorize chapter content through knowledge graph embedding, ultimately determining the similarity of the knowledge graph section.
The second part is dedicated to collaborative filtering. It starts by collecting implicit user data within the course and performing data cleaning to remove redundant information. An implicit feedback model is then established based on preference rules. This part concludes with a data matrix to calculate the collaborative filtering section’s similarity.
The third and final part involves fusion. It combines the similarities obtained from the previous two sections, applying different weights for Top-K recommendations.
3.1. Knowledge Graph Similarity Calculation
3.1.1. Construction of Knowledge Graph
In the realm of education, the course knowledge graph stands as a significant application of knowledge graph technology in course content. Constructing the course knowledge graph enables the structured representation of course knowledge points, culminating in the formation of a cohesive knowledge system. Among the various approaches to knowledge graph construction, manual methods excel in precisely determining knowledge points and relationships. Consequently, this paper employs manual construction methods to establish the knowledge graph.
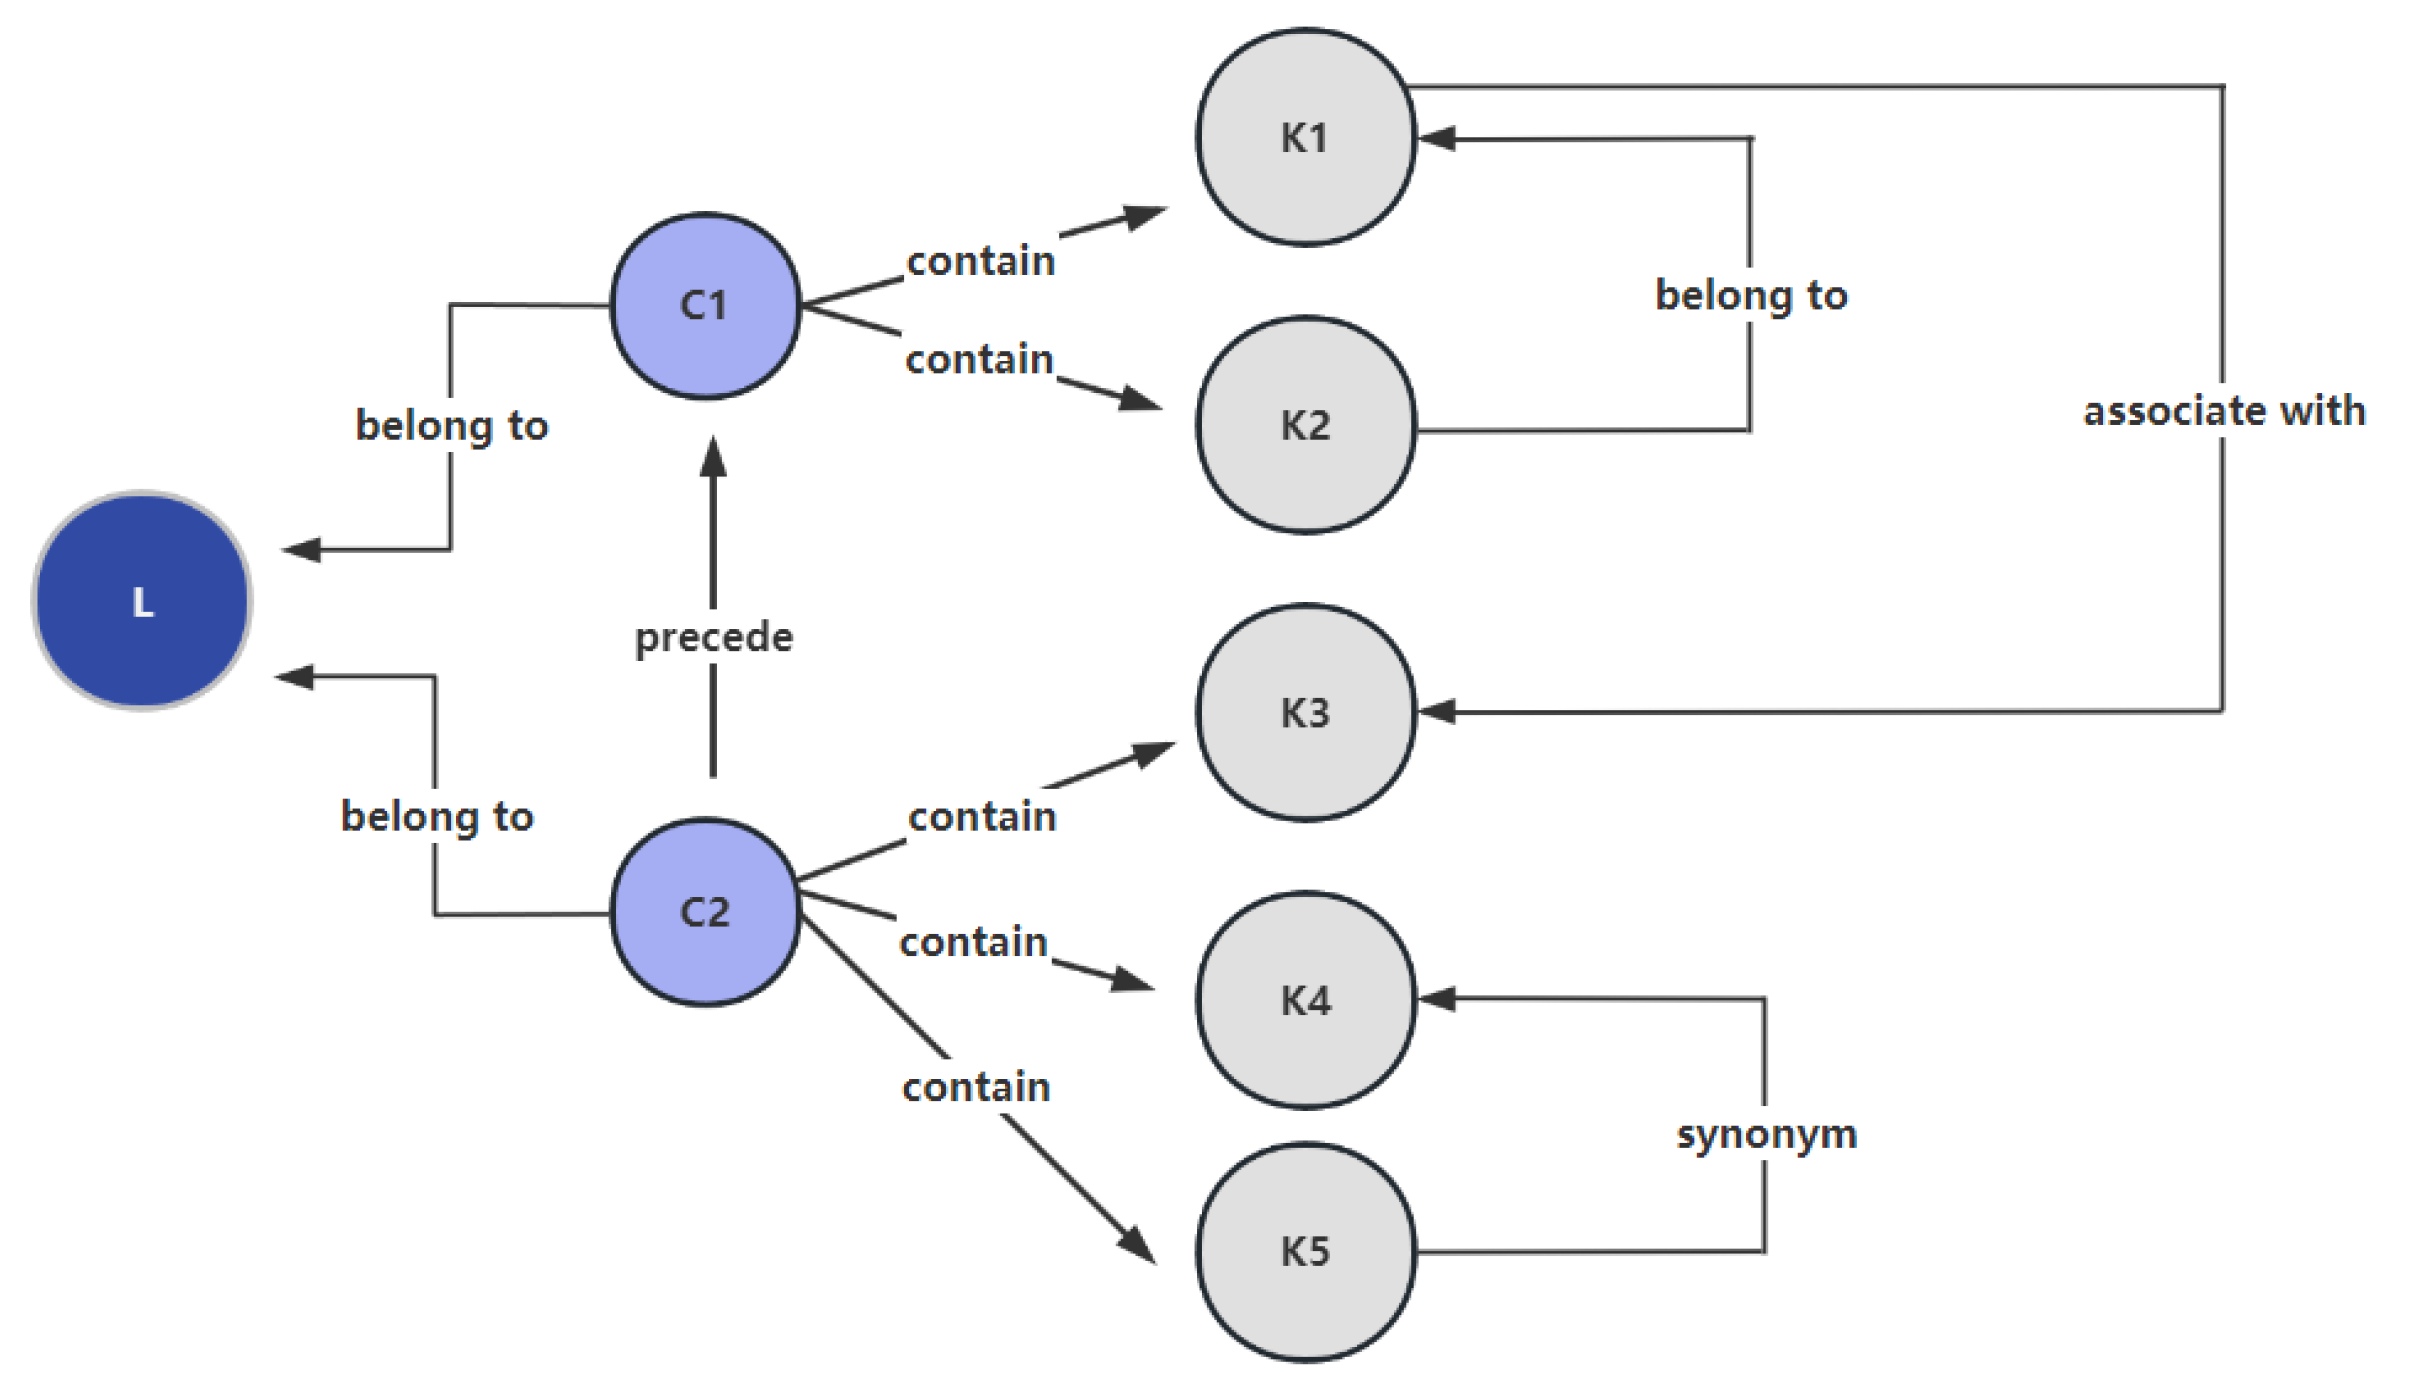
During the construction phase, data are sourced from online learning platforms, encompassing course materials such as slides, micro-videos, and text materials. These teaching materials define the course structure, organizing the knowledge graph into three layers. The first layer, denoted as ‘L,’ represents course modules and is established based on the selected courses. The second layer, ‘C,’ signifies chapter modules and is structured around the chapter names extracted from online courses. The third layer, ‘K,’ represents knowledge point modules. Each chapter necessitates a clear definition of relevant knowledge points to ensure accuracy. Within the course resources, fundamental chapters and knowledge points exhibit clear logical order relationships. Based on the course’s characteristics and content, five types of relationships—namely “belongs to, associates with, precedes, contains, and synonym”—are defined.
Figure 3 illustrates the conceptual structure of the knowledge graph.
Knowledge extraction constitutes the central step in the manual construction of the course knowledge graph. Entities and relationships are meticulously extracted, guided by predefined knowledge points. In the entity extraction phase, a thorough review of video and text resources from each chapter is conducted to identify concepts closely related to the chapter’s content. Knowledge point entities are then extracted and linked to the previously defined knowledge points, encompassing concepts such as “process” and “scheduling”. In the relationship extraction phase, knowledge graph relationships among knowledge points are deduced based on their logical connections. For instance, the knowledge point “scheduling algorithm” may entail a predecessor relationship, such as the “scheduling concept”. To ensure the precision of the knowledge system, knowledge extraction encompasses the acquisition of knowledge points from various textbooks and data sources. Due to the disparities among sources, the same knowledge point entity may exhibit variations, necessitating entity alignment to eliminate ambiguities. For instance, “process control” in one textbook and “process management” in another can be harmonized into a standardized entity: “process control”.
3.1.2. Knowledge Graph Representation Learning
In this paper, the training of the knowledge graph utilizes the TransD model. The TransD model employs a margin-based ranking loss function to compute the distance between real relationships and vector representations. It employs the backpropagation algorithm to iteratively update the vector representation values. This iterative process aims to attain optimal vector representations. The loss function for this model is expressed as follows:
represents positive triplets and represents the corresponding negative triplets. is the set of positive triplets and is the set of negative triplets. is the margin value that separates positive and negative triplets. represents setting elements less than 0 to zero while keeping the values of elements greater than 0 unchanged.
Based on the pre-constructed knowledge graph triplets, such as <Chapter A, Precedes, Chapter B> and <Chapter B, Contains, Knowledge Point C>, the entities in the knowledge graph are embedded into a high-dimensional vector space. For each entity and relationship, two vectors are initialized, one in the entity space representing the entity’s position and another in the relationship space representing the relationship’s position. A loss function is defined, and the stochastic gradient descent algorithm is used to minimize the loss function. Through batch training, vector representations for each chapter entity are obtained. Next, the entity vectors are used to calculate the similarity between entities. Different similarity metrics can be used for similarity calculation. In this paper, cosine similarity is chosen as the similarity calculation method. It measures the similarity by calculating the cosine value of the angle between two vectors. The calculation formula is as follows (Equation (6)):
After obtaining the similarity between vectors, the semantic vectors obtained from the knowledge graph can be transformed into a similarity matrix. The chapter set is defined as .
Indeed, when the cosine similarity approaches 1, it signifies that the directions of the two vectors are nearly identical, and the angle between them is close to 0 degrees. This implies that they can be regarded as highly similar. The notation represents the similarity between chapters achieved through the knowledge graph method.
3.2. Collaborative Filtering Similarity Calculation
3.2.1. Implicit Feedback Model
This paper builds an implicit feedback model based on learning information from online courses. The learning information includes the user’s video-watching progress and text-reading progress for each chapter. According to this feature, it assumes that user has a preference value for the video content of chapter and a preference value for the text content. In the implicit feedback, the overall preference value for this chapter is calculated using and . The formula is defined as follows:
In this paper, an implicit feedback model is constructed by utilizing learning information obtained from online courses. This learning information includes the user’s progress in watching videos and reading text materials for each chapter. Given this context, it assumes that user
holds a preference value
for the video content of chapter
and a preference value
for the text content of chapter
. Within the framework of implicit feedback, the combined preference value
for this chapter is computed by considering both
and
. The formula for this calculation is defined as follows:
In the formula, represents the total duration of videos that user has watched in chapter , while represents the total duration of text content that user has studied in chapter . signifies the total duration of videos available in chapter , and Ap denotes the total amount of text content within chapter . Furthermore, represents the predetermined preference ratio for video content while indicates the predetermined preference ratio for text content.
In the information age, video and text formats constitute the primary multimedia learning resources. These multimedia formats integrate visual, auditory, and textual components to offer learners vivid, intuitive, and diverse learning experiences, which exert a profound influence on learning outcomes. To assess the significance of these two formats in learning resource recommendations, this paper formulates the following preference rules:
In this configuration, the weight for video resources is established as 1, while the weight for text resources is designated as 0.5. This weight assignment is intended to underscore the significance and relatively higher priority attributed to video resources in learning resource recommendations.
- (2)
Text Dominance
In this configuration, the weight for text resources is defined as 1, while the weight for video resources is assigned a value of 0.5. This weight arrangement is intended to highlight the significance and relatively higher priority assigned to text resources in learning resource recommendations.
3.2.2. Item based Collaborative Filtering
Assuming there are users and chapters in the dataset. The user set can be represented as , and the chapter set can be represented as . Based on Equation (9) and the preference rules set in this paper, we can form the user behavior matrix .
In
Table 1, the user behavior matrix,
represents the user
’s preference level for chapter
. For example, if user
has a video learning progress of 70% and a text learning progress of 20% in chapter
. When using the video-dominant preference rule,
. When using the text-dominant preference rule,
. Under the two preference rules, different user behavior matrices are formed.
In item-based collaborative filtering, using the user behavior matrix, recommendations are made based on the user’s historical behavior. To achieve this, the similarity between chapters is computed using cosine similarity, resulting in the similarity matrix for the collaborative filtering method. When the similarity approaches 1, it signifies a higher frequency of occurrence or a stronger connection between these two chapters in user behavior data. This suggests that users tend to select these two chapters together. The notation represents the chapter-to-chapter similarity obtained through the collaborative filtering algorithm.
3.3. Similarity Fusion
In the similarity fusion method, linear models are favored for their interpretability and scalability. Utilizing a linear model allows for an intuitive understanding of the influence of various features on the recommendation results. Hence, this paper opts for a linear model. The similarity obtained from the knowledge graph,
, is integrated with the similarity derived from item-based collaborative filtering,
, through a weighted fusion approach. The optimal outcome is attained by iteratively adjusting the weights. The computational formula is presented in Equation (10):
The parameter signifies the fusion weight ratio, with ∈ [0, 1] governing the balance between item-based collaborative filtering and TransD in the fusion process. By varying the value of , we can assess how different fusion ratios influence the performance of the recommendation algorithm and identify the optimal α value. Once the similarity results are obtained, a Top-K sorting is conducted to produce the final recommendation list.
4. Analysis of Experimental Data and Results
4.1. Experimental Dataset
The data used in this study are collected from the learning resource data and learner learning behavior records within the municipal high-quality course “Introduction to Computer” on the Chongqing Smart Education Platform. This dataset includes both video and text resources for each chapter, as well as the learning progress of each user.
After extracting concepts and establishing relationships based on the content of the course chapters and knowledge points, the extracted concepts and established relationships are integrated into the knowledge graph.
Figure 4 provides a visual representation of the knowledge graph for the course.
4.2. Evaluating Indicator
In this study, courses chosen by users were categorized as positive, whereas courses not selected were deemed negative. The system’s performance is assessed using Precision, Recall, and F1 scores. The parameters within the confusion matrix can be employed to elucidate Precision and Recall. The confusion matrix is presented in
Table 2.
Accuracy represents the proportion of courses that students actually choose among all recommended courses.
The recall rate represents the proportion of courses successfully recommended by the recommendation system among all students’ actual choices.
The F1 value considers both to make the recommended results more balanced.
4.3. Fusion Proportion Experiment and Result Analysis
In this experiment, collaborative filtering and knowledge graphs are integrated, with their contributions weighted by the parameter , which governs the balance between these two components in the recommendation process. The fusion ratio is a variable used to comprehensively evaluate recommendation performance under various fusion ratios. To ensure the rigor of the experimental outcomes, two sets of experimental designs are employed, aligned with the preference rules outlined in this study. This approach ensures that collaborative filtering and knowledge graph results, generated under the two sets of preference rules, are weighted separately to yield the experimental evaluation metrics. The results are subsequently subjected to detailed analysis and comparison.
In both sets of experiments, the value of K is set to 16 for Top-K recommendations, and the embedding dimension of TransD is set to 100. The range of
is [0, 1], starting from 0 with a step size of 0.1, gradually increasing to 1. Each set of experiments is repeated 10 times, and the average values of each metric are calculated. The experimental results under different fusion weights
are shown in
Table 3.
Upon analyzing the experimental results within the video-dominant group, it becomes evident that precision, recall, and F1-score exhibit an upward trend as the fusion weight ratio α increases, with video content being given higher priority. The three performance metrics reach their peak values when = 0.6, after which they begin to gradually decline.
Similarly, from the analysis of the text-dominant group results, the performance metrics also show an increasing-then-decreasing trend. When = 0.6, the experimental performance is optimal.
By comprehensively analyzing the results from both groups, it can be concluded that under the conditions of = 16 and the embedding dimension of 100, selecting = 0.6, which corresponds to a fusion ratio of 6:4, yields the best recommendation performance.
4.4. Algorithm Comparison
In order to verify the practicality of the methods used in this article, four other recommended methods were selected for comparison, namely TransD, ItemCF, CKE, and KGAT. In order to ensure the comprehensiveness of the experimental comparison, the baseline method selected in this article includes traditional recommendation algorithms and more advanced recommendation algorithms. Its introduction is as follows:
- (1)
TransD [
42]: A model used for knowledge graph representation learning aimed at capturing semantic associations between entities and relationships.
- (2)
ItemCF [
43] (item-based collaborative filtering): Object-based collaborative filtering that analyzes items that users have liked in the past and recommends other items that are similar to these items.
- (3)
CKE [
44] (Collaborative Knowledge Base Embedding): Based on knowledge graph embedding, a multi-layer neural network is used to integrate the knowledge base.
- (4)
KGAT [
45] (Knowledge Graph Attention Network): It combines graph convolutional networks and attention mechanisms to capture complex associations in the knowledge graph.
ItemCF-Text represents ItemCF using text dominant preference rules in this article. ItemCF-Video represents ItemCF using video dominant preference rules in this article. In the CKE algorithm, the interaction event that occurs in the dataset is denoted as 1; otherwise, it is denoted as 0. In the KGAT algorithm, each user’s interaction with an item is considered a positive instance. The method used in this article α Set to 0.6
The experimental results are shown in
Table 4.
Analyzing the experimental results can lead to the following conclusions:
- (1)
Compared with other models, the method proposed in this paper shows a certain improvement in performance. This indicates that the method used in this article relies more on the specific interaction data during the learning process. By introducing implicit feedback models, this article can better capture the feature representations of students’ learning progress and resource types, especially when setting weights for different resource types. This means that we have a better understanding of student’s needs and learning environments and can more accurately recommend appropriate learning resources for them.
- (2)
Compared to the KGAT and CKE methods, the method proposed in this paper slightly improves the F1 value. This may be because the task of this article focuses more on considering the interaction between users and resources, which can more easily adapt to the set preference rules. In addition, the complexity of the method proposed in this article is relatively low, which may also contribute to performance improvement.
- (3)
Compared with ItemCF and TransD, regardless of the K value, the mixed method exhibits better performance than using either method alone. This emphasizes the suitability of combining these two methods for recommendation in this article, providing better performance for recommendation systems.
In summary, in this experiment, a hybrid method combining implicit feedback models, knowledge graphs, and collaborative filtering has been proven to be more suitable and suitable for the current experimental environment. This method takes into account students’ learning preferences and fully utilizes existing learning interaction data, providing students with more intelligent and practical learning resources.
4.5. Preference Comparison Experiment and Result Analysis
To investigate the influence of different types of learning resources in the recommendation process, we conducted a comparison between the video-dominant and text-dominant scenarios while maintaining the fusion ratio determined in the previous experiments. Within the specified fusion ratio condition, Top-K recommendations were performed to assess the impact of the two resource types. We also varied the value of
to compare experimental results across different recommendation quantities. In both sets of experiments,
ranged from 10 to 16,
was set to 0.6, and TransD’s embedding dimension remained at 100. Each experiment was repeated 10 times, and the average values were computed. The results for different values of
are detailed in
Table 5.
Figure 5a,b show the precision and recall of the experiment, respectively.
Based on the above results, we can observe that as the K value increases, the accuracy under the two preference rules shows a decreasing trend, while the recall rate shows an increasing trend. Increasing the k value usually increases the diversity of recommendation results. This means that the system is more inclined to recommend various types of content to meet the diverse needs that users may have, which can improve recall rates. But, capturing more related projects may also lead to the introduction of unrelated projects, thereby reducing accuracy. The comparison of the results shown in the two images shows that assigning high-weight values to video resources has achieved good results in recommendation performance, both in terms of accuracy and recall. This indicates that compared to text resources, video resources play a more important role in course recommendation, and in this course, video resources can better meet users’ learning needs and preferences.
In the experiment in
Figure 5a, a sharp decrease in the accuracy curve was observed when the recommended quantity K increased from 11 to 12. When increasing the k value, the system may have already considered most of the relevant courses. When more course options are introduced, there may be differences in the relevance between these additional courses and the specific needs of the user. This sharp decrease may be due to one or more additional recommended courses not matching the user’s interests, resulting in a decrease in accuracy. Meanwhile, when increasing the number of recommendations, users may face information overload issues as they need to evaluate more course options. This may make it more difficult for users to make wise choices, thereby affecting accuracy. However, as the experiment progresses, the accuracy curve stabilizes. Users gradually adapt to the recommendations provided by the system and begin to provide positive feedback on more courses suggested by the system.
In future education and teaching, teachers can harness technology and educational innovations to integrate multimedia resources and online learning platforms into their teaching methodologies. Emphasizing the use of video resources can offer students immersive and engaging educational content and experiences. Schools can provide the necessary technical support and training to assist teachers in effectively incorporating video resources into their teaching methods. This approach not only enhances students’ personalized learning experiences but also boosts the effectiveness of teaching for educators.
5. Conclusions
The goal of this study is to deeply explore the hidden resources present in online courses and use a recommendation algorithm that combines knowledge graph representation learning with collaborative filtering. It constructs a course knowledge map and utilizes the knowledge map embedding method to perform weighted fusion with item-based collaborative filtering algorithms. Nowadays, many online learning platforms provide a large amount of learning resources, but learners often find it difficult to find resources that are suitable for their needs and learning styles. This issue is considered one of the bottlenecks in online learning, and in previous learning resource recommendations, the impact of different resource types has not been explored. In order to optimize learning resource recommendation strategies and improve learners’ learning outcomes and needs, two preference rules, video-dominant and text-dominant, were set up to study their impact on recommendation results. A key finding is that there are differences in the impact of different types of learning resources on learners. The experimental results show that the higher the video weight, the better the results, highlighting the importance of video resources in learners’ learning process. The importance of research lies not only in addressing the resource recommendation problem in online learning but also in its potential impact. In the field of education, this study provides valuable insights for educators, encouraging them to adopt video resources more widely and actively explore innovative teaching methods. Teachers can consider emphasizing the production and use of video content to provide a richer learning experience.
Although progress has been made in this study, there are still some shortcomings. Currently, there are challenges in the relevance of user needs and their information processing capabilities. When the diversity of user needs is high, some less relevant courses may be taken into account. At the same time, the course evaluation mechanism also needs to be improved, and more user feedback data needs to be added to reduce the recommendation of lower quality or unevaluated courses. In future work, a course screening mechanism will be added to eliminate low-quality or poorly evaluated courses in order to improve the quality of the recommendation list. Introduce user feedback, such as ratings or comments, to further improve recommendations. The experiment will be conducted on larger and more representative datasets, such as MOOCCube, with a focus on exploring the feasibility of the algorithm [
46].


