Article

Tumor Volume Distributions Based on Weibull Distributions of Maximum Tumor Diameters

1
Department of Physics, Science Faculty, University of Zürich, 8057 Zürich, Switzerland
2
Radiotherapy Hirslanden AG, Rain 34, 5000 Aarau, Switzerland
*
Author to whom correspondence should be addressed.
Appl. Sci. 2023, 13(19), 10925; https://doi.org/10.3390/app131910925
Submission received: 15 July 2023 / Revised: 26 September 2023 / Accepted: 28 September 2023 / Published: 2 October 2023
(This article belongs to the Special Issue Advances in Radiation Therapy for Tumor Treatment)

Abstract

:
(1) Background: The distribution of tumor volumes is important for various aspects of cancer research. Unfortunately, tumor volume is rarely documented in tumor registries; usually only maximum tumor diameter is. This paper presents a method to derive tumor volume distributions from tumor diameter distributions. (2) Methods: The hypothesis is made that tumor maximum diameters d are Weibull distributed, and tumor volume is proportional to dk, where k is a parameter from the Weibull distribution of d. The assumption is tested by using a test dataset of 176 segmented tumor volumes and comparing the k obtained by fitting the Weibull distribution of d and from a direct fit of the volumes. Finally, tumor volume distributions are calculated from the maximum diameters of the SEER database for breast, NSCLC and liver. (3) Results: For the test dataset, the k values obtained from the two separate methods were found to be k = 2.14 ± 0.36 (from Weibull distribution of d) and 2.21 ± 0.25 (from tumor volume). The tumor diameter data from the SEER database were fitted to a Weibull distribution, and the resulting parameters were used to calculate the corresponding exponential tumor volume distributions with an average volume obtained from the diameter fit. (4) Conclusions: The agreement of the fitted k using independent data supports the presented methodology to obtain tumor volume distributions. The method can be used to obtain tumor volume distributions when only maximum tumor diameters are available.

1. Introduction

Tumor volume is an important parameter in various aspects of cancer research, including tumor growth modeling, predictions of therapeutic outcomes in cancer treatment [1,2,3] and modeling of tumor control probability (TCP) in radiotherapy.
In particular, in TCP modeling, the knowledge of the tumor volume is of high relevance. The classical TCP model for an individual patient is of sigmoidal shape and depends on patient individual characteristics, such as tumor volume, cell radiation sensitivity, clonogenic cell density and others [4,5,6]. Characteristically, the TCP shows a steep gradient with dose. If the tumor control in a cohort of patients with the same tumor is epidemiologically observed, the gradient of the TCP–dose relation decreased due to variations of the patient-specific characteristics in the cohort [7,8]. Standard practice is therefore to fit empirical TCP models as, e.g., logistic models to those data [9,10]. Since there is no direct relation between the empirical cohort TCP models and the mechanistically based patient individual TCP models, the obtained fitting parameters cannot be used to predict patient individual TCP. However, this is necessary for the use of TCP calculation in radiotherapy treatment planning.
Recently, it has been shown that the tumor control for an individual patient can be integrated over the volume by assuming that the tumor volumes in the patient cohort are exponentially distributed [11,12]. This results in an analytic representation of the cohort TCP which, interestingly, results in a logistic curve. However, since the parameters of the new logistic representation of cohort TCP are mechanistically based, it allows determination of the patient individual model parameters. This is the first step towards the clinical use of TCP models.
Hence, it would be helpful to know the distribution of tumor volumes for the individual tumor types. Unfortunately, tumor volume is never documented in tumor registries today. If anything at all the maximum tumor diameter is documented. In the database of the National Cancer Institute, in its Surveillance, Epidemiology, and End Results (SEER) program database, for example, the maximum tumor diameters of about half a million patients per year are documented. It would be useful if tumor volumes could somehow be derived from reported maximum tumor diameters. Although there have been several attempts to estimate tumor volumes from tumor diameters [13,14,15,16,17,18,19,20,21], there is no known method to calculate tumor volume distributions from tumor diameter distributions.
This paper presents a first attempt at deriving tumor volume distributions from tumor diameter distributions. The paper is mainly divided into three parts. In the first part, the method for deriving tumor volume distributions from tumor diameter distributions is presented. It is shown that, under certain assumptions, an exponential distribution of tumor volumes follows from a Weibull distribution of maximum tumor diameters. In the second part, a three-dimensional dataset of segmented tumor volumes is used to verify the method. In the third and final part, tumor volume distributions are calculated from the maximum diameters of the SEER database for breast, NSCLC and liver as examples.

2. Materials and Methods

2.1. Maximum Tumor Diameter Distribution

When individuals are diagnosed with a tumor, usually the maximum tumor diameter at the time of diagnosis is recorded. In the past, it has been suggested that the maximum diameters (in the following, referred to as simply “diameters”) of tumors of one type are Weibull distributed [22]. The probability density function (pdf) of the diameters is then:
f d = λ · k · λ · d k 1 · e λ · d k for   d   >   0 ,
where and λ and k are the parameters of the Weibull distribution, and d is the maximum diameter of a tumor. However, these studies did not distinguish between the distribution of tumor size in patients (hereafter referred to as the intrinsic distribution) and the distribution of actually diagnosed tumor diameters. This distinction is essential because of the technical limitations of diagnostic methods the occurrence of small tumors is underestimated. Therefore, the diagnosed distributions will change over the years as diagnostic methods tend to improve. The best example of this is the introduction of mammography in the diagnosis of breast cancer. We therefore propose to describe the intrinsic distribution of tumor diameters by a Weibull distribution and to model the limitation of diagnostic methods in the detection of small tumors by a “diagnostic limit function” 1 e x p d / d c k that depends on a critical maximum tumor diameter dc. This “diagnostic limit function” represents the probability of detecting a tumor in a population of cancer patients. The simplest possible representation of the diagnostic function was chosen because, to the best of our knowledge, too little information is available to justify a more precise formulation. The introduction of the parameter k will become clear at a later stage, when the volume distributions are derived. The resulting probability density function of maximum tumor diameters in a cohort of tumor patients can then be written as:
f d = 1 e d d c k · λ · k · λ · d k 1 · e λ · d k for   d   >   0 ,
where dc is the critical diameter. If the shape of a tumor is represented by an ellipsoid [23], the volume is V = π 6 · d · d 2 · d 3 with the three diameters d (maximum diameter), d2 and d3. Obviously, the distribution of the maximum tumor diameters alone is not sufficient to determine the shape of the volumes and, thus, d, d2 and d3. Therefore, it is necessary to introduce a first assumption; it is assumed that the tumor volume is sufficiently defined by the maximum diameter with:
V = μ · d k
where k is the parameter from the Weibull distribution of diameters, and μ is a scaling factor which is π/6 multiplied by the dimension [cm3-k] when the maximum diameter is expressed in cm. In case of ellipsoids, the product of the second and third diameter is determined by d 2 · d 3 = d k 1 . In a simple case, the ellipsoid is rotationally symmetric about the longest axis d and forms a spheroid. The relation between maximum and minimum diameter is then fixed: d 2 = d 3 = d k 1 / 2 . This means that the shape of the spheroid is determined by the choice of k, and the closer k is to 3, the more spherical the spheroid becomes. If the tumors were perfect spheres, k = 3 would sufficiently determine the volume. On the other hand, the tumor volume becomes pencil shaped for k = 1, which means that a realistic range of values for k is between 1 and 3. It should also be mentioned that the shape of the ellipsoid or spheroid depends on the volume. This is a direct consequence of Equation (3) and is exemplarily shown in Figure 1 for k = 1.5 and three different tumor diameters (d= 1.5, 3 and 6 cm). It can be seen that small tumors are rather spherical in shape and become more elongated in the course of their growth.
With the definition of the volume by Equation (3) and assuming the general case of an ellipsoidal tumor volume, it is possible to transform the pdf of maximum diameters (Equation (2)) into the pdf g(V) of volumes. The transformation between the two pdfs is a strict mathematical procedure given by [24]:
g V = f d V · d d d V   using   d V = V μ 1 k
If Equation (4) is solved for g(V), the following volume distribution is obtained:
g V = 1 e V V c · λ k μ · e λ k μ · V
where V c = μ · d c k is the corresponding critical volume. Since the right side of Equation (5) is an exponential distribution, the average volume can be directly calculated from the parameters of the Weibull distribution of diameters:
V ¯ = μ   λ k
Equation (5) then yields:
g V = 1 e V V c · V ¯ + V c V ¯ 2 · e V V ¯
where a normalization factor ( 1 + V c / V ¯ ) is multiplied such that the integral over g(V) is one.
In summary, we have shown that Weibull-distributed maximum tumor diameters will directly lead to exponentially distributed volumes. This was derived under the assumption that the tumor volumes correspond to ellipsoids whose shape is defined by the parameter k. In addition, the diameter and volume pdfs were extended by a “diagnostic limit function” that takes into account that, due to technical limitations in a real patient cohort, tumors can only be diagnosed if they exceed a diameter dc or a volume Vc.

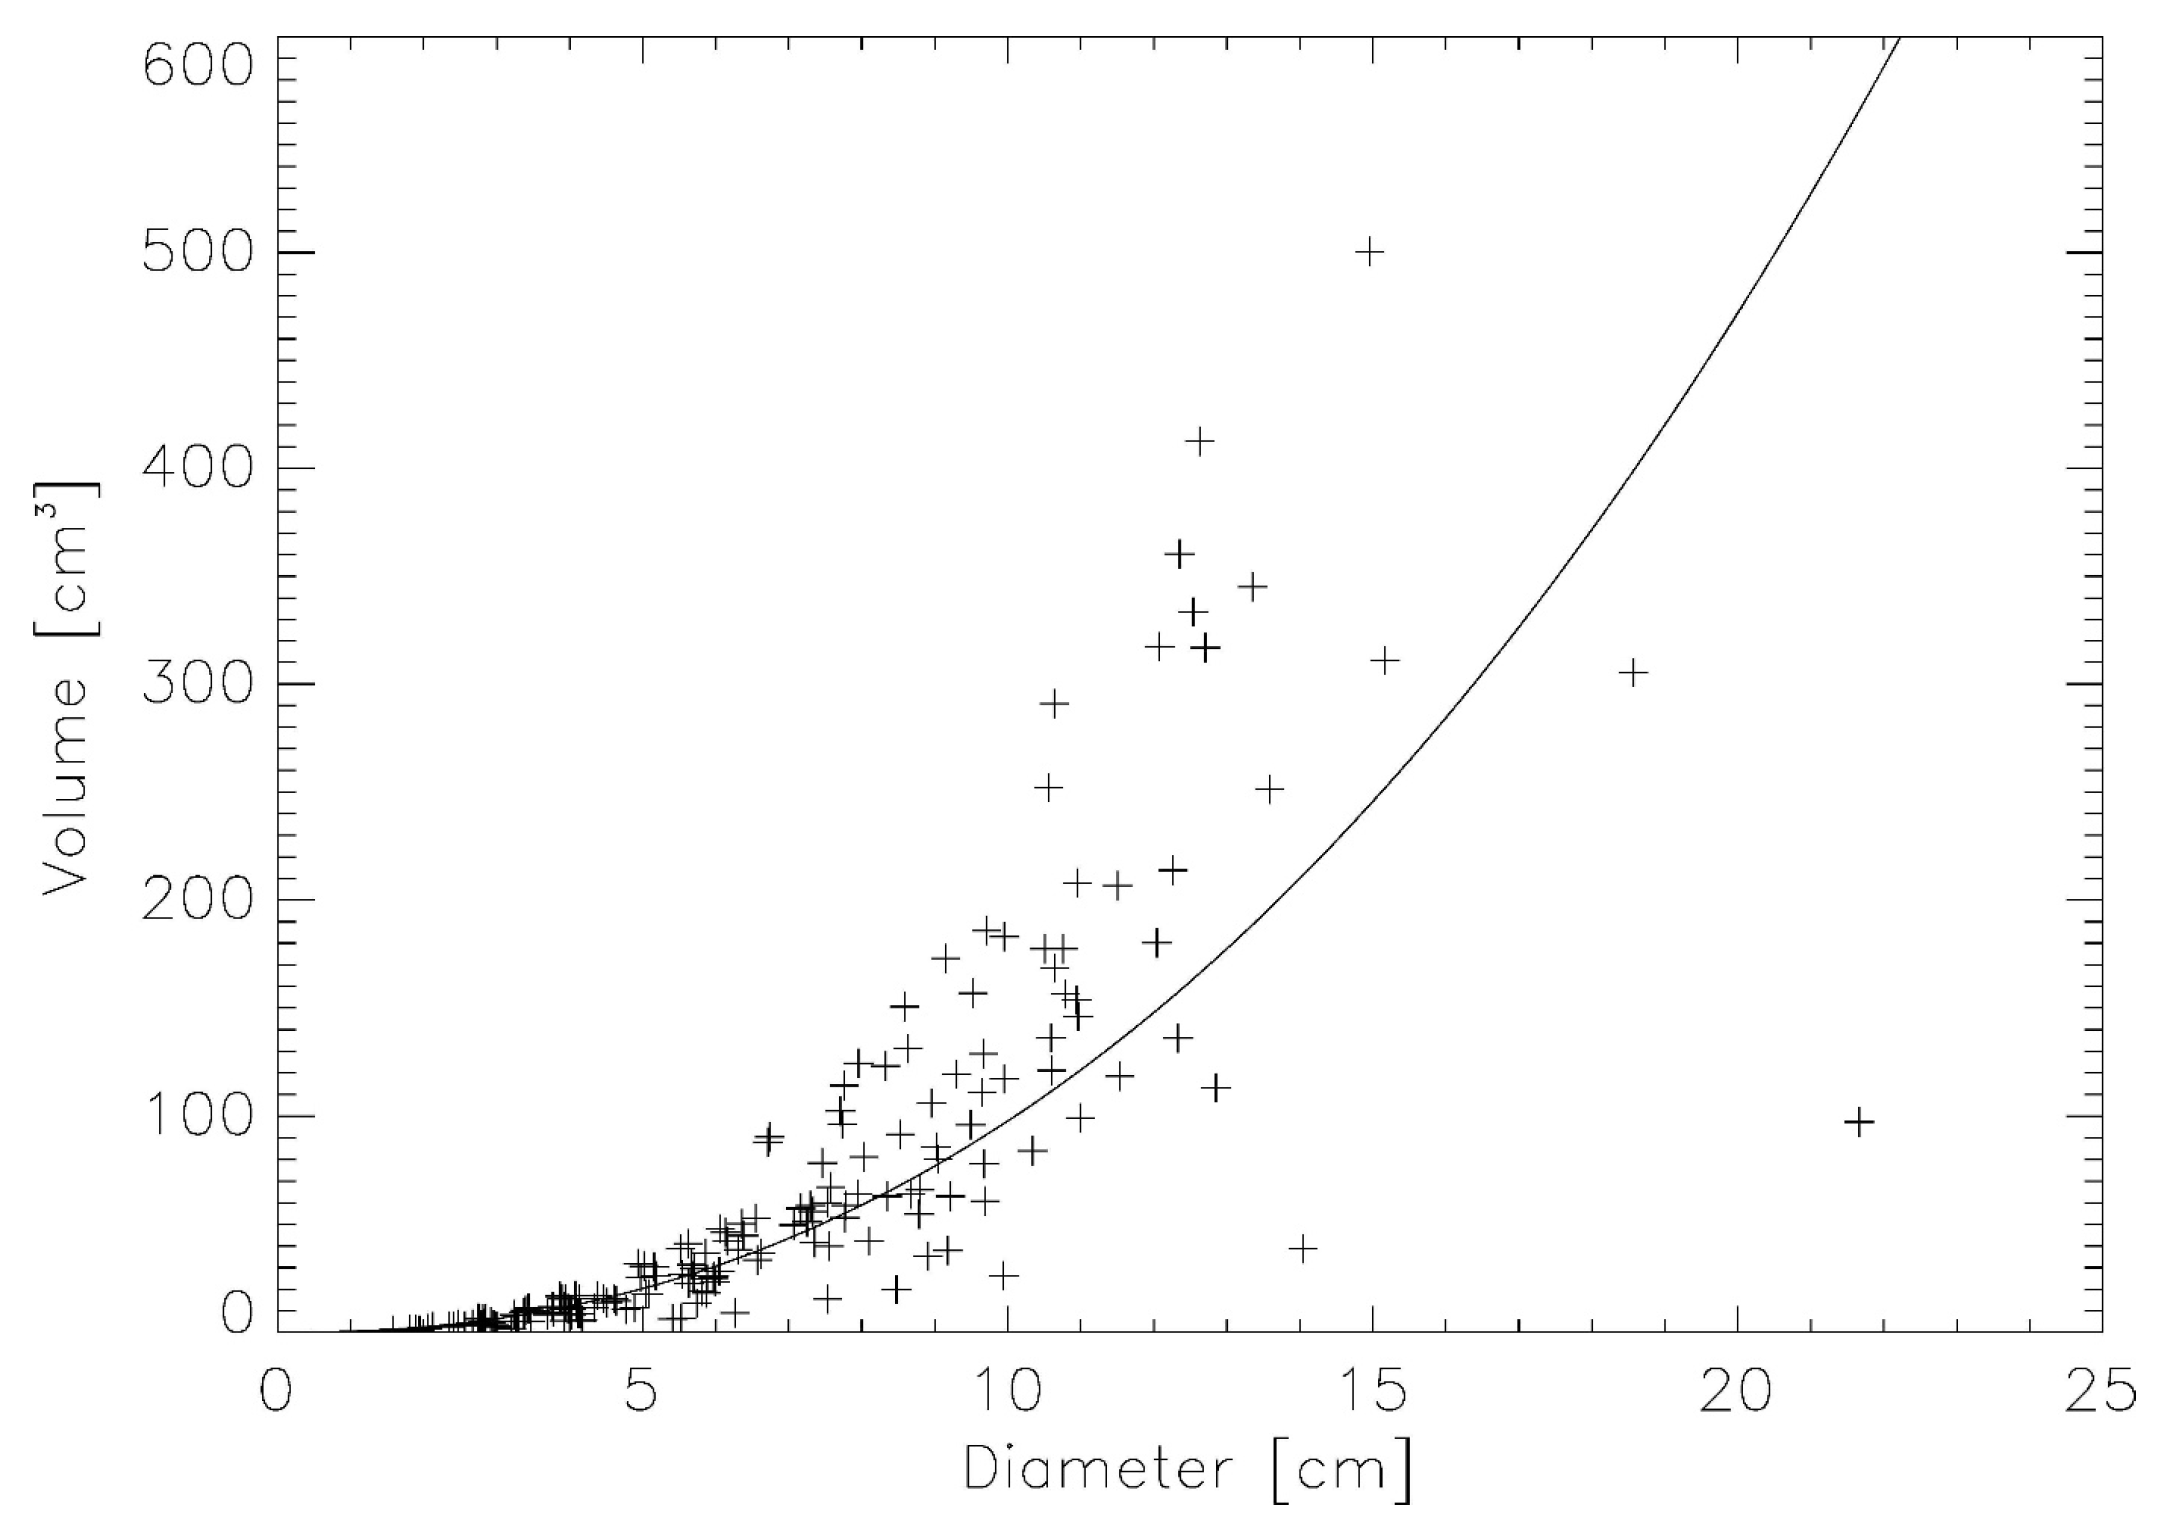
2.2. Verification Using Real Lung Tumor Volumes

To test the method presented in the last chapter, we need to know not only the distribution of maximum tumor diameters, but also the associated tumor volumes for a cohort of patients with a given tumor. As mentioned in the introduction, tumor registries do not currently provide these data. One possibility is to rely on data from radiotherapy patients, where three-dimensional imaging is available and tumors are appropriately segmented. A disadvantage of this data is that they include only patients selected for radiotherapy. Thus, there is a selection bias. The Cancer Image Archive makes anonymized segmented tumor volume data publicly available. We used the data for NSCLC because the Cancer Image Archive contains the most records (422) for this tumor type. Only cases in which a single tumor mass was present were considered, which was the case for 176 records. For each of these 176 datasets, tumor volume and maximum tumor diameter were determined. The data were histogrammed in 10 bins to obtain satisfactory statistical accuracy. Diameters ranged from 0 to 15 cm and volumes from 0 to 550 cm3. Data were fitted using PVWave (Version 2017.0, Rogue Wave Software, Minneapolis, MN, USA) by minimizing chi-squared.

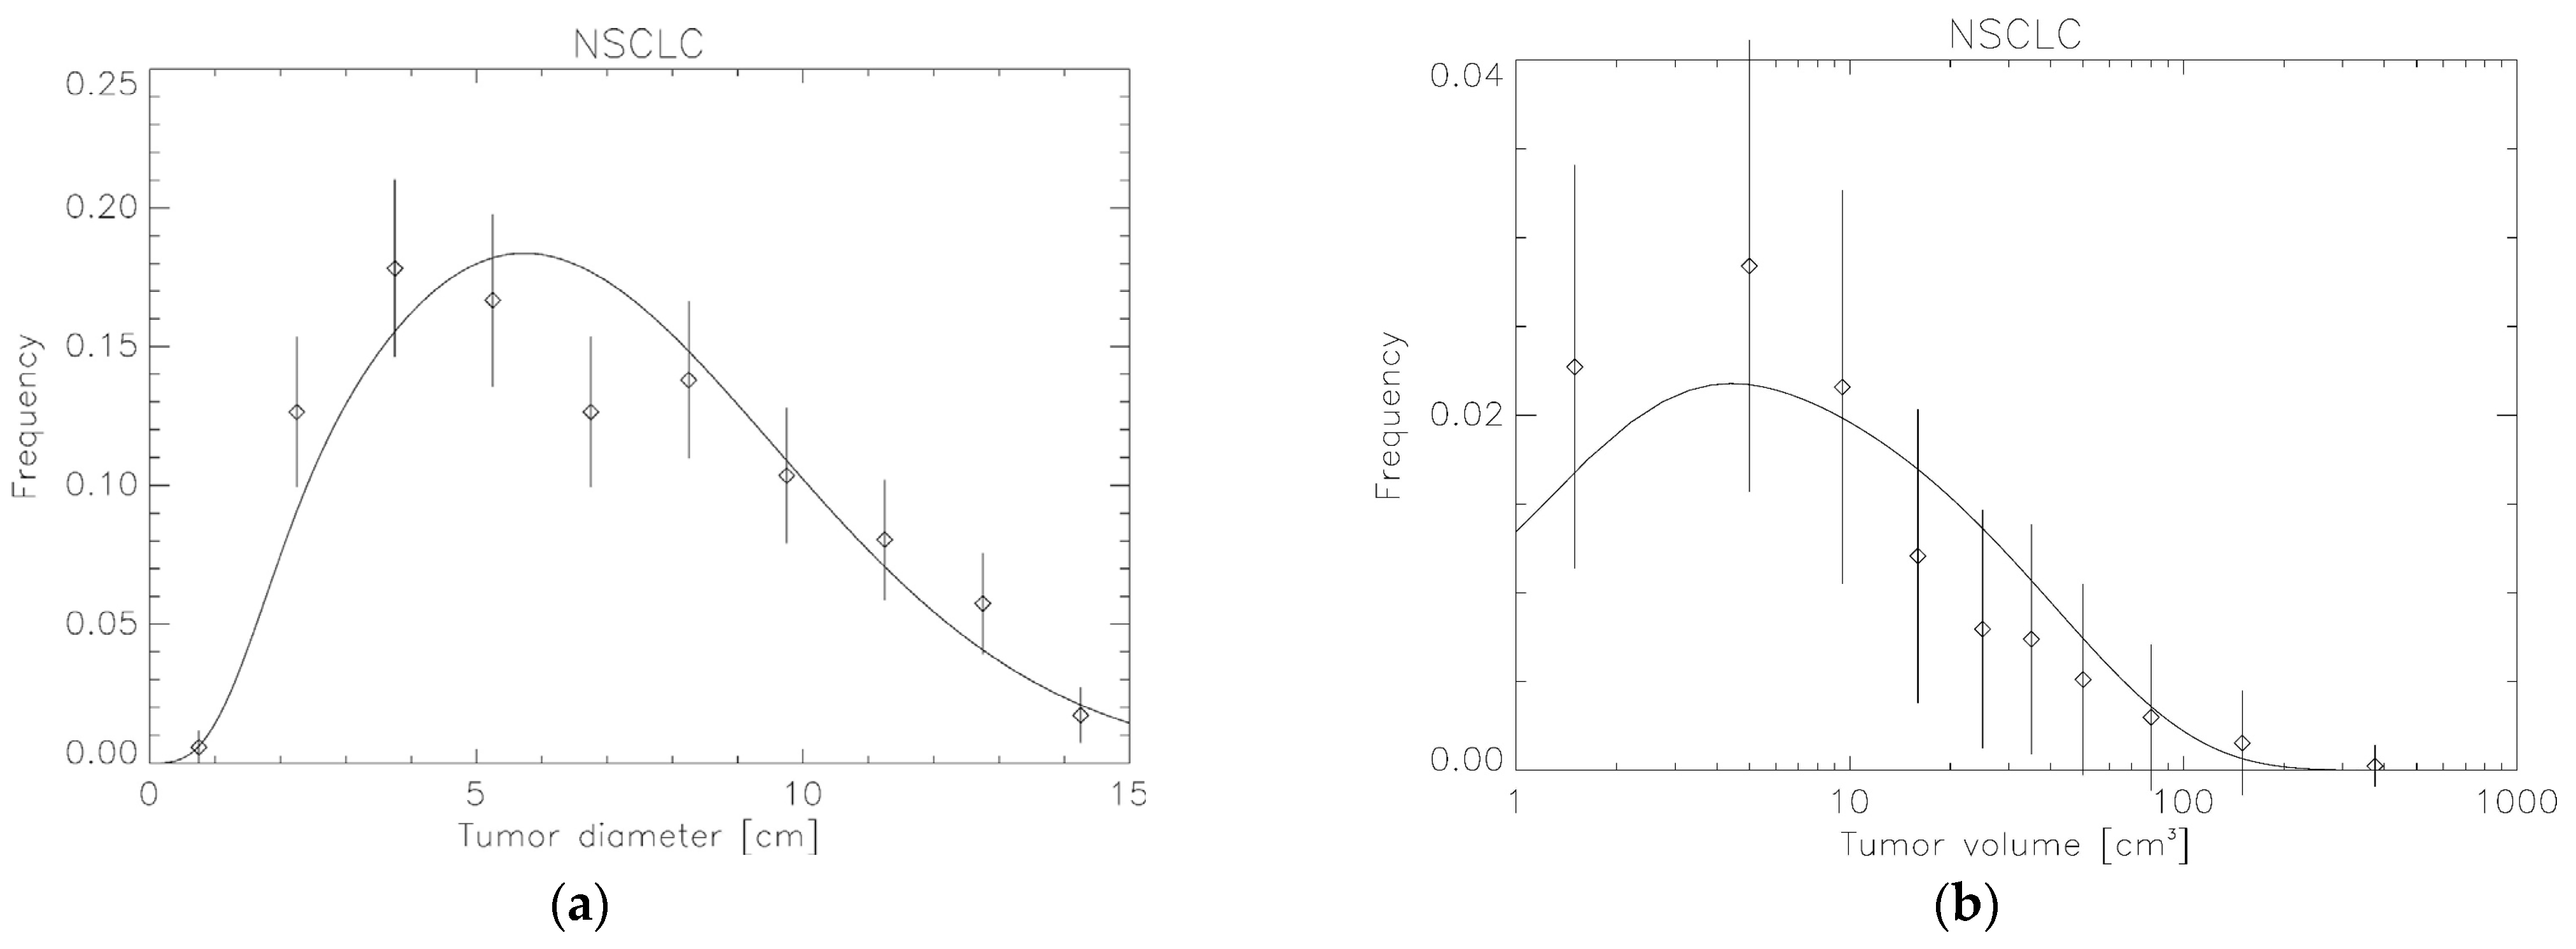
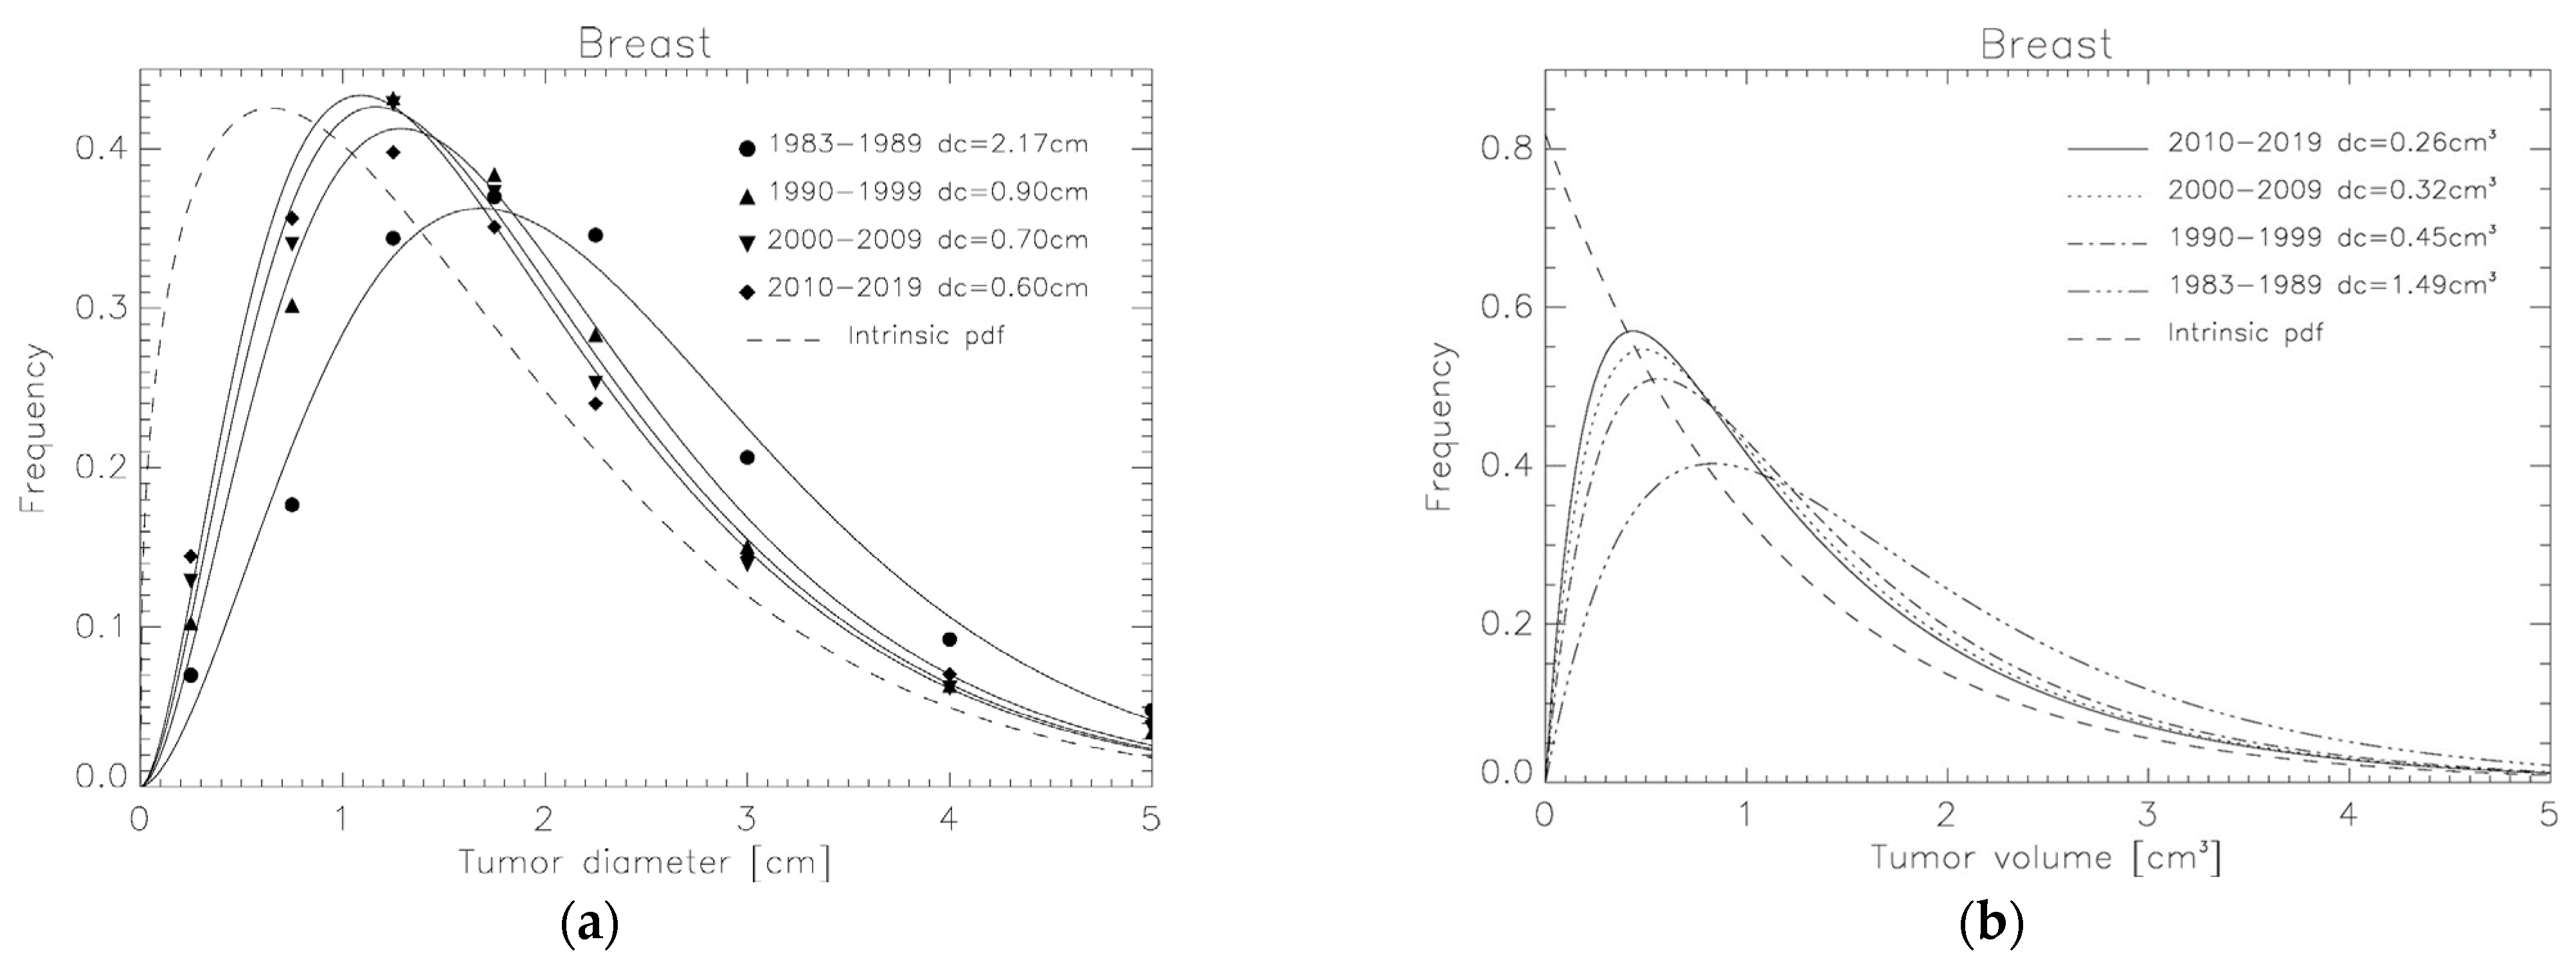
2.3. Tumor Volume Distributions Determined from SEER for Breast, NSCLC and Liver

To apply the presented method of deriving volume distributions from diameter distributions, we extracted maximum diameters from the SEER [25] database for the three tumor types breast, NSCLC and liver. The SEER database has generally contained tumor diameter at time of diagnosis data since 1975, and, according to SEER guidelines, tumor size is measured as the largest diameter or dimension of the tumor. The way tumor size is coded in SEER has changed over time. For this work, only post-1988 data were considered because pre-1988 data were categorized with much poorer accuracy. The data were queried using SEERStat [26].
For each of the three tumor types, multiple diameter distributions were created, each depending on the year of diagnosis. This allowed us to test the diagnostic limit function for plausibility, as more recent diagnoses should also contain smaller tumors (small dc) due to improved diagnostic capabilities and more frequent screening. Table 1 shows the distribution of patients over the different time periods. The data obtained from the SEER queries were filtered to include only the relevant tumor diameter ranges. For breast cancer, data were restricted to female patients older than 15 years. Weibull distributions were fitted to the data using PVWave (version 2017.0, Rogue Wave Software, Minneapolis, MN, USA) by minimizing the chi-squared. The parameters λ and k were fitted to all time periods, while dc was fitted to the specific time period.

3. Results

3.1. Verification Using Real Lung Tumor Volumes

The method derived in this work to determine tumor volume distributions from tumor diameter distributions is based on the assumption that tumors can be represented as ellipsoids and that their volume scales with the diameter to the power of k. The NSCLC dataset allows verification of this scaling. On the one hand, k can be calculated from the fit of the modified Weibull distribution (Equation (1)) to the distribution of maximum diameters; on the other hand, k can be determined directly from a fit of the volumes to dk. A match would support the methodology.
Figure 2 plots the volume data for the 176 tumors as a function of maximum diameter. The solid line corresponds to a fit to the relationship π 6 · d k . The parameter k was determined to be 2.21 ± 0.25. Figure 3a shows the fit of the Weibull distribution from Equation (1) to the histogrammed maximum diameters. The resulting parameters are λ = 0.13 ± 0.01, k = 2.14 ± 0.36 and dc = 1.5 ± 0.9 cm.
Another indication that the method of estimating volume distributions from diameter distributions is applicable is shown in Figure 3b. Here, the volume distribution is plotted, which was generated directly from the fitted parameters λ, k and dc of the diameter distribution. For the mean tumor volume, V ¯ = π   6 · λ k = 41.2   c m 3 , and for the critical volume, V c = π 6 · d c k = 1.3   c m 3 was used.

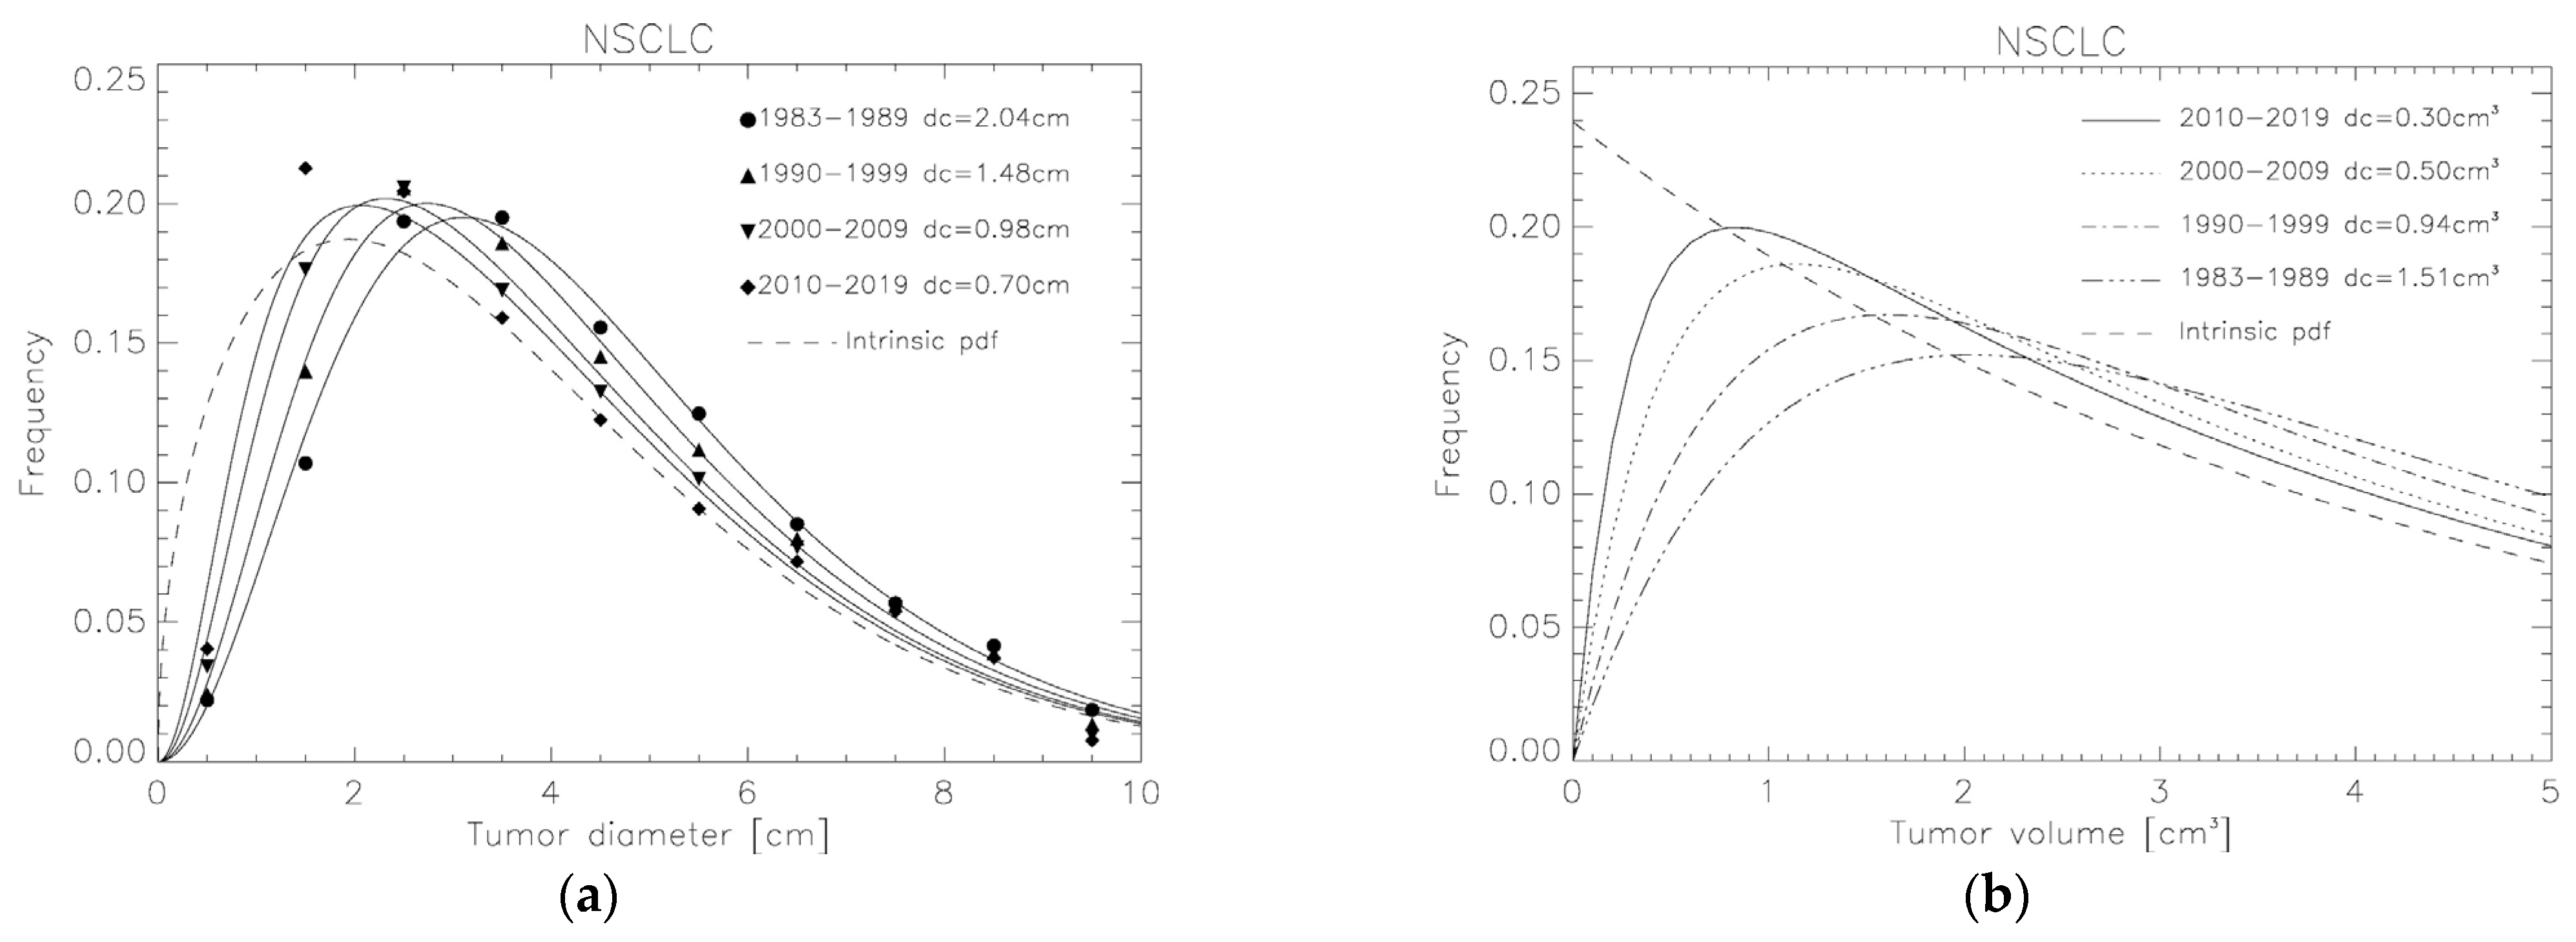
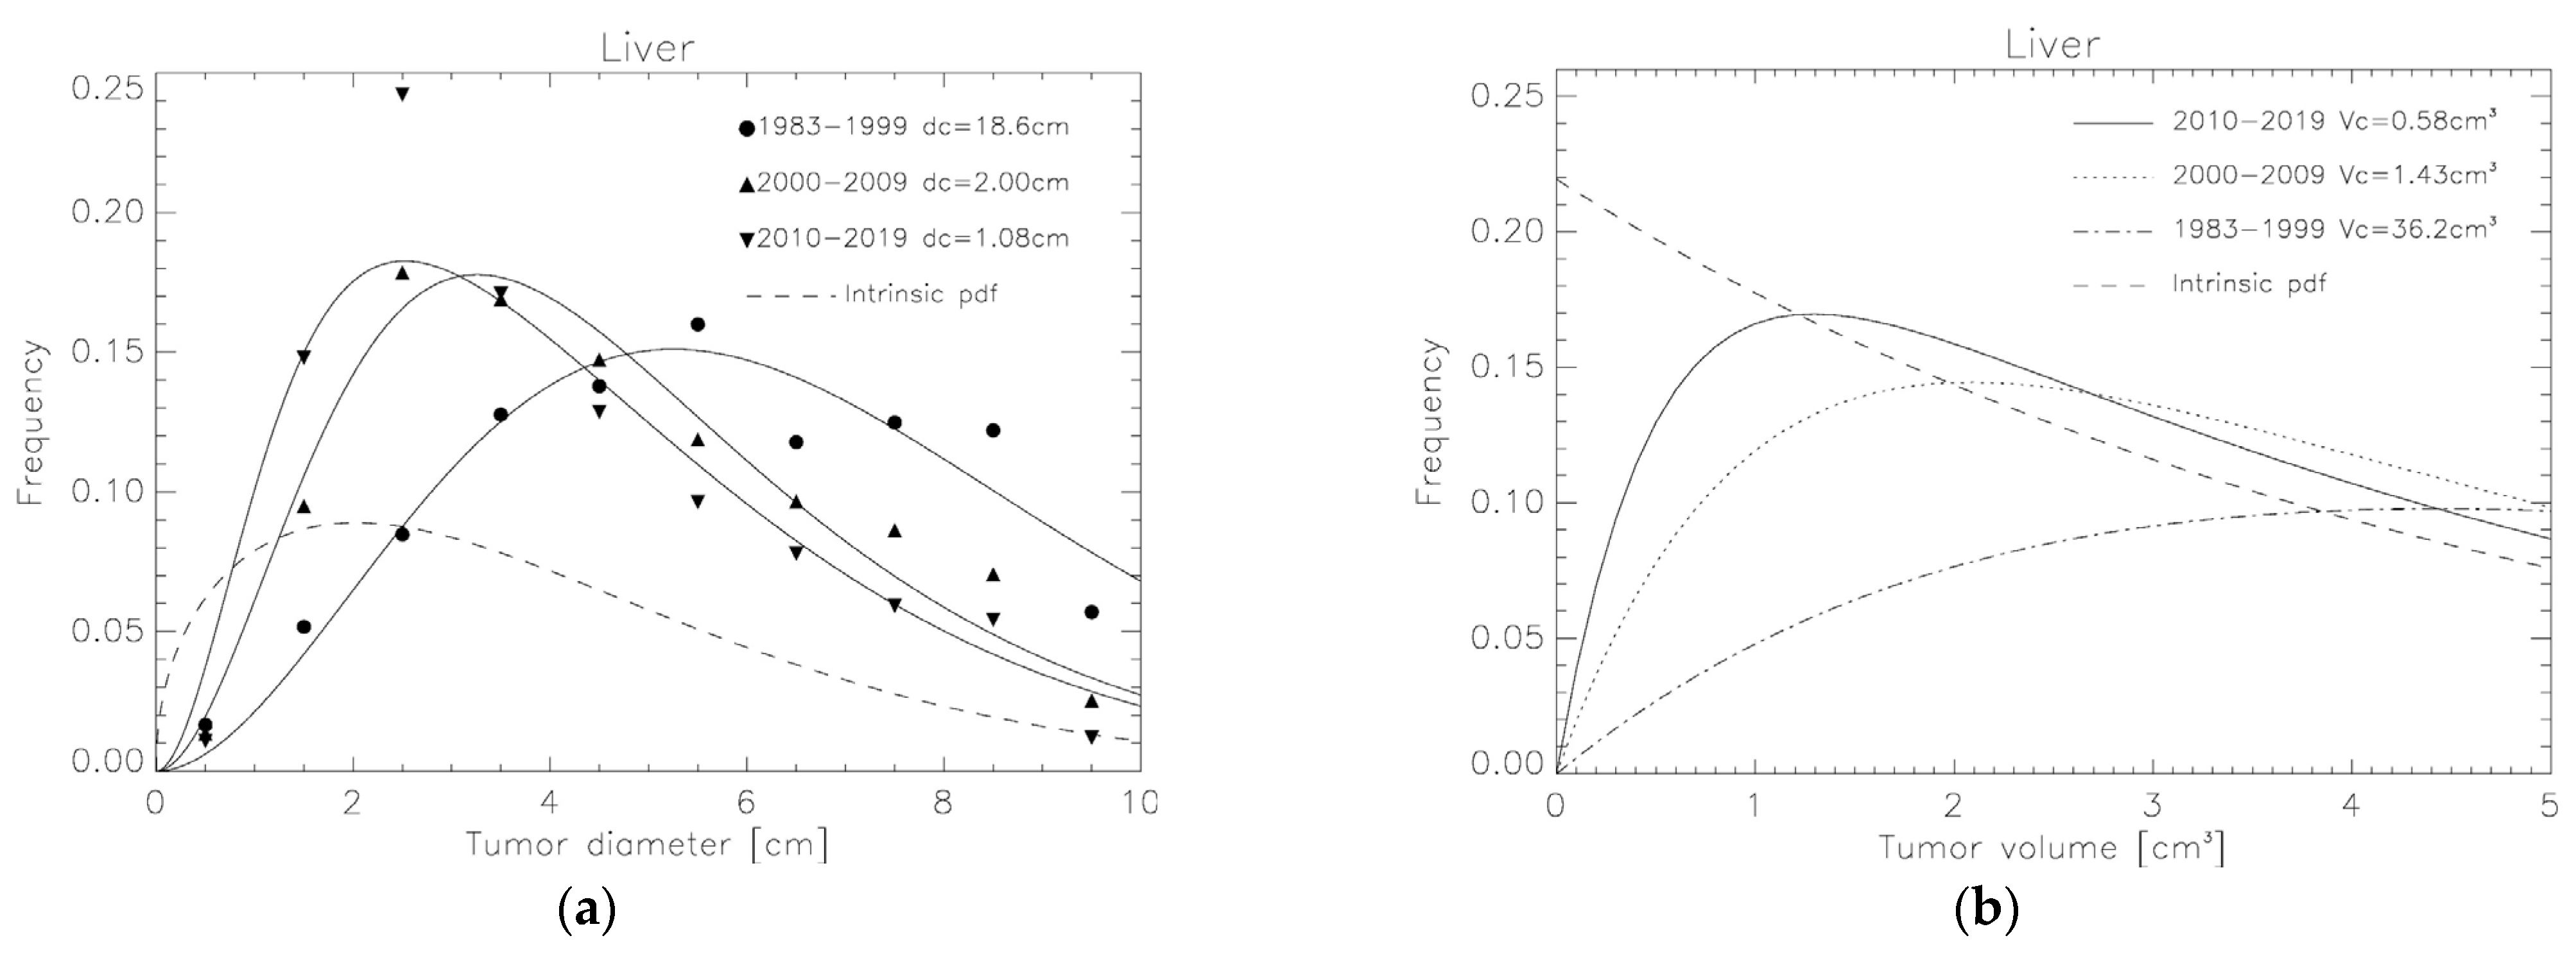
3.2. Tumor Volume Distributions Determined from SEER for Breast, NSCLC and Liver

In Figure 4a, Figure 5a and Figure 6a, the histograms of the tumor diameter data from the SEER database with the corresponding Weibull distribution fits are shown. The symbols represent the SEER data and the solid lines the respective fits. As expected, the critical diagnostic limit diameter dc for all three tumor types decreases with increasing diagnostic period. Table 2 provides an overview of these results. The dashed line shows the intrinsic Weibull distribution of tumor diameters according to Equation (1).
After dc, λ and k were determined from the diameter distributions, Vc and V ¯ were calculated using Equations (2) and (5), respectively (see Table 2). With this information, the exponential distribution of volumes can now be calculated using Equation (6). The resulting distributions and the critical limit volumes Vc are shown in Figure 4b, Figure 5b and Figure 6b for breast, NSCLC and liver, respectively. The dashed line again represents the intrinsic distribution of the volumes, which is exponential when Vc = 0.

4. Discussion

In this work, it was shown that it is possible to derive tumor volume distributions from the distributions of maximum tumor diameters in a cohort of patients. It can be seen that spherical tumors (k = 3) are always exponentially distributed. If the assumption of spherical shape is omitted, then the transformation holds under the assumption the tumor is an ellipsoidal with maximum diameter d and the smaller diameters d 2 · d 3 = d ( k 1 ) . As a consequence, the parameter k from the Weibull distribution of diameters determines the shape of the tumor ellipsoids.
A second important result, particularly with respect to modeling tumor control in radiotherapy, is that tumor volumes are exponentially distributed. As shown in other work, this allows relation of the tumor control of an individual patient to the tumor control in a cohort of radiotherapy patients [11,12].
This presented study has several limitations that warrant consideration. The most important thing to mention is that the shape of the tumor volumes must follow a certain regularity. This seems to be the case for the cohort of NSCLC tumor patients studied here, for which both the maximum diameters of the tumors and the tumor volumes are available. However, the number of patients in this dataset is small, and, therefore, the statistical power is limited. Therefore, additional tests of the model with larger patient cohorts and various tumor types for which the volumes and maximum tumor diameters are available are needed in the future.
Another disadvantage of the volume data taken from the Cancer Imaging Archive, in addition to its statistical limitations, is that it only includes patients selected for radiotherapy, and, therefore, there is a selection bias (e.g., surgery for small tumors). This selection bias has a direct impact on tumor volume distributions, as selection criteria for radiotherapy may also depend indirectly on tumor sizes (stage). Indeed, the fitted parameter k differs from that obtained from the SEER data. However, the selection bias does not affect the tested relation between volume and maximum diameter, as shown in Figure 2.
An open question is how to correctly specify a cohort of individuals with tumors for which the presented intrinsic distributions for tumor diameters and tumor volumes apply. Does this include only patients with macroscopic tumors or also those with microscopic tumors? If microscopic tumors are included, the questions arise: what is the minimum size of such tumors? Are only those microscopic tumors counted which later necessarily transform into a macroscopic tumor?
An interesting side aspect of the intrinsic tumor size distribution is that one can estimate to what extent diagnostic procedures need to be improved in order to be able to diagnose as many tumors as possible. For breast tumors, for example, one can deduce from the intrinsic Weibull distribution of tumor diameters that one would have to detect all tumors larger than 0.2 cm to diagnose 95% of all tumors and all those larger than 0.3 cm to diagnose 90%.
The methodology developed in this report allows one to obtain tumor volume distributions from the maximum tumor diameters which are available for many tumor sites in tumor registries such as, e.g., the SEER database. The obtained tumor volume distributions can be used to obtain an analytic representation of a cohort TCP. A fit of this cohort TCP model to epidemiologically available local tumor control data allows, in turn, the use of patient individual TCP models for radiotherapy treatment planning.

Author Contributions

Conceptualization, U.S. and J.B.; methodology, U.S.; software, S.R. and U.S.; validation, U.S. and S.R.; formal analysis, U.S.; investigation, U.S. and S.R.; resources, U.S.; data curation, S.R.; writing—original draft preparation, U.S.; writing—review and editing, J.B. and S.R.; visualization, U.S. and J.B.; supervision, U.S.; project administration, U.S.; funding acquisition, U.S. All authors have read and agreed to the published version of the manuscript.

Funding

This work was supported by the Swiss National Science Foundation (SNSF), grant number: 320030-182490.

Institutional Review Board Statement

Not applicable.

Informed Consent Statement

Not applicable.

Data Availability Statement

Research data are stored in an institutional repository and will be shared upon request to the corresponding author.

Conflicts of Interest

The authors declare no conflict of interest.

References

  1. Dubben, H.H.; Thames, H.D.; Beck-Bornholdt, H.P. Tumor volume: A basic and specific response predictor in radiotherapy. Radiother. Oncol. 1998, 47, 167–174. [Google Scholar] [CrossRef]
  2. Kim, H.J.; Kim, W. Method of tumor volume evaluation using magnetic resonance imaging for outcome prediction in cervical cancer treated with concurrent chemotherapy and radiotherapy. Radiat. Oncol. J. 2012, 30, 70–77. [Google Scholar] [CrossRef]
  3. Kim, H.; Kim, W.; Lee, M.; Song, E.; Loh, J.J. Tumor volume and uterine body invasion assessed by MRI for prediction of outcome in cervical carcinoma treated with concurrent chemotherapy and radiotherapy. Jpn. J. Clin. Oncol. 2007, 37, 858–866. [Google Scholar] [CrossRef] [PubMed]
  4. Munro, T.R.; Gilbert, C.W. The relation betweenvtumour lethal doses and the radiosensitivity of tumourvcells. Br. J. Radiol. 1961, 34, 246–251. [Google Scholar] [CrossRef]
  5. Webb, S.; Nahum, A.E. A model for calculating tumour control probability in radiotherapy including the effects of inhomogeneous distributions of dose and clonogenicvcell density. Phys. Med. Biol. 1993, 38, 653–666. [Google Scholar] [CrossRef]
  6. Nahum, A.E.; Sanchez-Nieto, B. Tumour control probability modelling: Basic principles and applications in treatment planning. Phys. Med. 2001, 17 (Suppl. 2), 13–23. [Google Scholar]
  7. Suit, H.; Skates, S.; Taghian, A.; Okunieff, P.; Efird, J.T. Clinical implications of heterogeneity of tumor response to radiation therapy. Radiother. Oncol. 1992, 25, 251–260. [Google Scholar] [CrossRef] [PubMed]
  8. Bentzen, S.M.; Thames, H.D.; Overgaard, J. Does variation in the in vitro cellular radiosensitivity explain the shallow clinical dose-control curve for malignant melanoma? Int. J. Radiat. Biol. 1990, 57, 117–126. [Google Scholar] [CrossRef]
  9. Okunieff, P.; Morgan, D.; Niemierko, A.; Suit, H.D. Radiation dose-response of human tumors. Int. J. Radiat. Oncol. Biol. Phys. 1995, 32, 1227–1237. [Google Scholar] [CrossRef] [PubMed]
  10. Roberts, S.A.; Hendry, J. Inter-tumour heterogeneity and tumour control. In Radiobiological Modelling in Radiation Oncology; Dale, R.G., Jones, B., Eds.; BIR Publications: London, UK, 2007; pp. 169–195. [Google Scholar]
  11. Schneider, U.; Besserer, J. Tumour volume distribution can yield information on tumour growth and tumour control. Z. Med. Phys. 2022, 32, 143–148. [Google Scholar] [CrossRef]
  12. Radonic, S.; Besserer, J.; Meier, V.; Bley, C.R.; Schneider, U. A Novel Analytical Population Tumor Control Probability Model Includes Cell Density and Volume Variations: Application to Canine Brain Tumor. Int. J. Radiat. Oncol. Biol. Phys. 2021, 110, 1530–1537. [Google Scholar] [CrossRef]
  13. Carlsson, G.; Gullberg, B.; Hafström, L. Estimation of liver tumor volume using different formulas—An experimental study in rats. J. Cancer Res. Clin. Oncol. 1983, 105, 20–23. [Google Scholar] [CrossRef] [PubMed]
  14. Euhus, D.M.; Hudd, C.; LaRegina, M.C.; Johnson, F.E. Tumor measurement in the nude mouse. J. Surg. Oncol. 1986, 31, 229–234. [Google Scholar] [CrossRef] [PubMed]
  15. Tomayko, M.M.; Reynolds, C.P. Determination of subcutaneous tumor size in athymic (nude) mice. Cancer Chemother. Pharmacol. 1989, 24, 148–154. [Google Scholar] [CrossRef]
  16. Sorensen, A.G.; Patel, S.; Harmath, C.; Bridges, S.; Synnott, J.; Sievers, A.; Yoon, Y.H.; Lee, E.J.; Yang, M.C.; Lewis, R.F.; et al. Comparison of diameter and perimeter methods for volume calculation. J. Clin. Oncol. 2001, 19, 551–557. [Google Scholar] [CrossRef] [PubMed]
  17. Mayr, N.A.; Taoka, T.; Yuh, W.T.; Denning, L.M.; Zhen, W.K.; Paulino, A.C.; Gaston, R.C.; Sorosky, J.I.; Meeks, S.L.; Walker, J.L.; et al. Method and timing of tumor volume measurement for outcome prediction in cervical cancer using magnetic resonance imaging. Int. J. Radiat. Oncol. Biol. Phys. 2002, 52, 14–22. [Google Scholar] [CrossRef] [PubMed]
  18. Eichelberger, L.E.; Koch, M.O.; Daggy, J.K.; Ulbright, T.M.; Eble, J.N.; Cheng, L. Predicting tumor volume in radical prostatectomy specimens from patients with prostate cancer. Am. J. Clin. Pathol. 2003, 120, 386–391. [Google Scholar] [CrossRef] [PubMed]
  19. Feldman, J.P.; Goldwasser, R.; Mark, S.; Schwartz, J.; Orion, I. A mathematical model for tumor volume evaluation using two-dimensions. J. Appl. Quant. Methods 2009, 4, 455–462. [Google Scholar]
  20. Güth, U.; Brenckle, D.; Huang, D.J.; Schötzau, A.; Viehl, C.T.; Dieterich, H.; Holzgreve, W.; Wight, E.; Singer, G. Three-dimensional pathological size assessment in primary breast carcinoma. Breast Cancer Res. Treat. 2009, 116, 257–262. [Google Scholar] [CrossRef]
  21. Thiel, D.D.; Jorns, J.; Lohse, C.M.; Cheville, J.C.; Thompson, R.H.; Parker, A.S. Maximum tumor diameter is not an accurate predictor of renal cell carcinoma tumor volume. Scand. J. Urol. 2013, 47, 472–475. [Google Scholar] [CrossRef]
  22. Kandethody, M.R.; Tsokos, C.P. Chapter 14—Some issues in statistical applications: An overview. In Mathematical Statistics with Applications in R, 3rd ed.; Ramachandran, K.M., Tsokos, C.P., Eds.; Academic Press: Cambridge, MA, USA, 2021; pp. 569–613. ISBN 978-0-12-817815-7. [Google Scholar]
  23. Andea, A.A.; Bouwman, D.; Wallis, T.; Visscher, D.W. Correlation of tumor volume and surface area with lymph node status in patients with multifocal/multicentric breast carcinoma. Cancer 2004, 100, 20–27. [Google Scholar] [CrossRef] [PubMed]
  24. Available online: https://en.wikibooks.org/wiki/Probability/Transformation_of_Probability_Densities (accessed on 7 September 2023).
  25. Surveillance, Epidemiology, and End Results (Seer) Program. Seer*Stat Database: Incidence—Seer Research Data, 8 Registries, Nov 2021 Sub (1975–2019)—Linked to County Attributes—Time Dependent (1990–019) Income/Rurality, 1969–2020 Counties, National Cancer Institute, Dccps, Surveillance Research. Available online: www.seer.cancer.gov (accessed on 20 October 2022).
  26. National Cancer Institute. Seer*Stat Software, August 2019. Available online: https://seer.cancer.gov/seerstat/ (accessed on 20 October 2022).
Figure 1. Shape of tumors as a function of their maximum diameter. The ellipsoids are calculated exemplarily for k = 1.5 and three different tumor diameters (d = 1.5, 3 and 6 cm). It can be seen that small tumors are rather spherical in shape and become more elongated in the course of their growth.
Applsci 13 10925 g001
Figure 2. Fit of the tumor volumes to maximum tumor diameters of 176 NSCLC tumors of the Cancer Image Archive (depicted as “+”). The relation π 6 · d k is shown as the solid line with k = 2.21 obtained from a least-squares fit.
Applsci 13 10925 g002
Figure 3. Fit (solid line) of the normalized modified Weibull distribution of Equation (1) to the histogrammed tumor diameters (symbols) of 176 NSCLC tumors of the Cancer Image Archive in (a). The resulting fit parameters are λ = 0.13 ± 0.01, k = 2.14 ± 0.36 and dc = 1.5 ± 0.9 cm. In (b) the histogrammed volume data are plotted together with volume distribution from Equation (5). It should be noted that the volume distribution was obtained by using the parameters of the diameter fit. The vertical bars represent the statistical error sqrt(n)/n, where n is the number of subjects in the corresponding diameter and volume bin, respectively.
Applsci 13 10925 g003
Figure 4. Fit of the normalized modified Weibull distributions of Equation (1) to the histogrammed tumor diameters for breast cancers from the SEER database for different time periods in (a). In (b), the obtained volume distributions from Equation (5) are shown. The dashed lines show the intrinsic size distributions.
Applsci 13 10925 g004
Figure 5. Fit of the normalized modified Weibull distributions of Equation (1) to the histogrammed tumor diameters for NSCLC from the SEER database for different time periods in (a). In (b), the obtained volume distributions from Equation (5) are shown. The dashed lines show the intrinsic size distributions.
Applsci 13 10925 g005
Figure 6. Fit of the normalized modified Weibull distributions of Equation (1) to the histogrammed tumor diameters for liver cancers from the SEER database for different time periods in (a). In (b), the obtained volume distributions from Equation (5) are shown. The dashed lines show the intrinsic size distributions.
Applsci 13 10925 g006
Table 1. Overview of analyzed SEER data.
Diameter Interval (cm)Patient Number in Time Period
Breast Cancer 1983–19891990–19992000–20092010–2019
0.0–0.521726165926712,710
0.5–1.0548118,12224,45831,366
1.0–1.510,66825,90730,77034,998
1.5–2.011,47123,03226,78830,885
2.0–2-510,72617,01318,19121,124
2.5–3.512,80218,06920,01225,335
3.5–4.557427636889712,414
4.5–5.52979410253427128
NSCLC1983–19891990–19992000–20092010–2019
0.0–1.02134206017052199
1.0–2.010,31211,962882511,586
2.0–3.018,67817,57810,29311,132
3.0–4.018,80915,89484498663
4.0–5.015,00712,41066296670
5.0–6.012,021954750664935
6.0–7.08206683638453905
7.0–8.05468480227702934
8.0–9.04011331819642026
9.0–10.017941142473412
Liver1983–19992000–20092010–2019
0.0–1.04798159
1.0–2.01476932179
2.0–3.024113043566
3.0–4.036312342516
4.0–5.039210761893
5.0–6.04558671418
6.0–7.03357051146
7.0–8.0355630872
8.0–9.0347515798
9.0–10.0162185176
Table 2. Overview of the fitted parameters. It should be noted that Vc and V ¯ of the exponential volume distribution are not separately fitted, but calculated from the diameter fits.
Fit of Modified Weibull to Maximum Diameter (Equation (1))Results for Exponential Distribution of Volumes
dc (cm)λkVc (cm3) V ¯ (cm3)
Breast cancer 0.57 ± 0.041.35 ± 0.05 1.12 ± 0.02
1983–19892.17 ± 0.24 1.49 ± 0.23
1990–19990.90 ± 0.09 0.45 ± 0.06
2000–20090.70 ± 0.090.32 ± 0.05
2010–20190.60 ± 0.100.26 ± 0.10
NSCLC 0.25 ± 0.071.49 ± 0.03 4.26 ± 0.004
1983–19892.04 ± 0.13 1.52 ± 0.15
1990–19991.48 ± 0.10 0.94 ± 0.09
2000–20090.98 ± 0.130.51 ± 0.10
2010–20190.70 ± 0.210.31 ± 0.14
Liver 0.22 ± 0.021.45 ± 0.09 4.70 ± 0.01
1983–199918.6 ± 16 36.3 ± 47
2000–20092.00 ± 0.33 1.43 ± 0.35
2010–20191.08 ± 0.500.59 ± 0.38
Disclaimer/Publisher’s Note: The statements, opinions and data contained in all publications are solely those of the individual author(s) and contributor(s) and not of MDPI and/or the editor(s). MDPI and/or the editor(s) disclaim responsibility for any injury to people or property resulting from any ideas, methods, instructions or products referred to in the content.

