Article

Analytical Calculation Model of the TV3-117 Turboshaft Working Regimes Based on Experimental Data

by
Razvan Marius Catana
and
Gabriel Dediu
*
National Research and Development Institute for Gas Turbines COMOTI, 061126 Bucharest, Romania
*
Author to whom correspondence should be addressed.
Appl. Sci. 2023, 13(19), 10720; https://doi.org/10.3390/app131910720
Submission received: 9 August 2023 / Revised: 24 September 2023 / Accepted: 25 September 2023 / Published: 26 September 2023
(This article belongs to the Section Aerospace Science and Engineering)

Abstract

:
The paper presents a practical and relevant analytical calculation model for free turbine turboshaft working regimes and engine performance. The analytical calculation model is based on a post-processing method that analyzes a series of experimental data, specifically focusing on the percentage variations of the engine’s main parameters from the minimum to the takeoff working regime. The experimental data were acquired from three different types of engines: TV2-117A turboshaft, AI-20K turboprop, and Viper 632-41 turbojet. The analysis method aimed to identify, through calculations, certain similarity parameters that exhibit nearly constant variations or variations within tight limits. These parameters can then be used as approximate constants in the calculation model. By utilizing these constants related to similarity parameters, a mathematical connection between different engine regimes is established; more exactly, for the engine data from a known to unknown regime. In the current case, only the engine data from the takeoff regime are requested to be known, and in this way, the other working regimes of several engines can be calculated.

1. Introduction

The use of an analytical calculation methodology to determine the working regimes of gas turbine engines, from the idle to maximum regime, is not commonly presented in gas turbine theory, turbomachinery books, or research papers [1,2]. This approach, valuable for gas turbine education and practical engineering applications, needs more exposure. Generally, thermodynamic calculation models for gas turbine engines are based on a series of assumptions, which are defined by certain parameters or coefficients, which are assigned constant values, in order to generate an easier calculation algorithm [3,4]. In the case of regime calculation, by using the calculation assumptions, mathematical relations between the parameters of the known regime with the parameters of the unknown regime can be determined. The calculation models can use dimensional or kinematic parameters, such as diameters, cross sections, velocities, blade angles, as well as thermodynamic parameters such as engine main parameters and performances. By default, these models incorporate the mathematical relations between the dimensional, kinematic, and thermodynamic parameters [5,6].
The models that combine dimensional or kinematic parameters with thermodynamic parameters are less accessible for use. This is because most specifications of an engine, as presented on data sheets, refer to the engine’s main parameters and performance not its dimensional or kinematic parameters. Even in the engine manuals, the dimensional and kinematic parameters for the main station of the engine are not specified. Therefore, a calculation model that uses only thermodynamic parameters is more accessible and flexible for use or development. The development of an analytical calculation model requires a database with values and variations of the engine’s main parameters and performance.
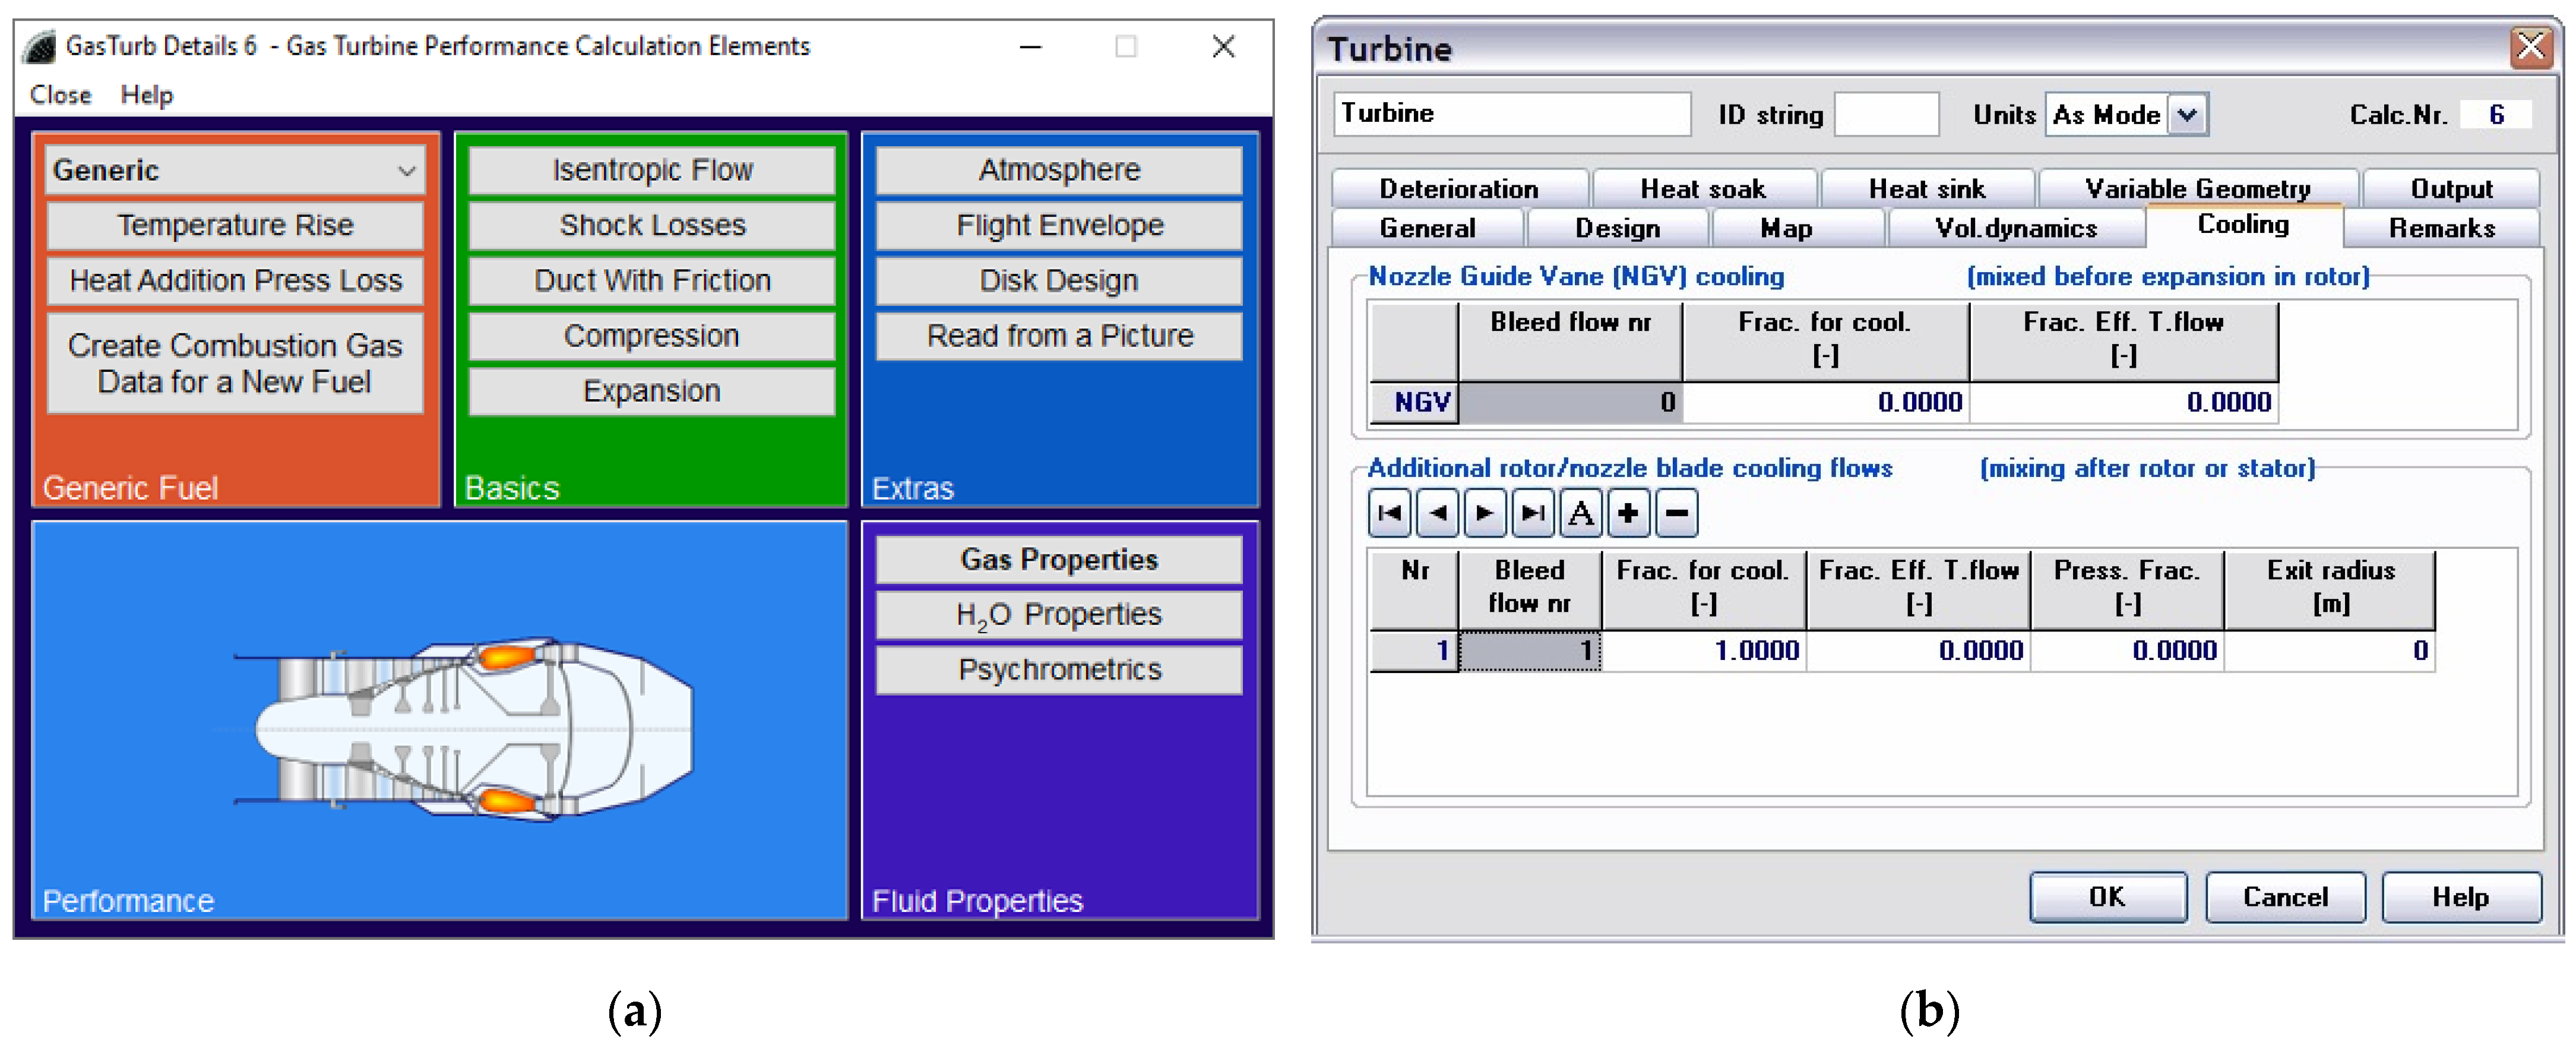
In the field of gas turbine performance calculation, from the standpoint of accuracy and precision, there are specific professional software programs, such as the Gas Turb Program [7] presented in Figure 1a, Gas Turbine Simulation Program (GSP) [8] presented in Figure 1b, and the Propulsion Object-Oriented Simulation Software (PROOSIS) [9], that are advanced tools of gas turbine engines working simulation and performance analysis. These software programs implemented mathematical calculation models using various engine parameters. Through a graphical interface, they are used to determine and simulate engine performances and working regimes.
To use these software programs, a license is required, which you must pay for. Additionally, when using these types of software, the user becomes just an operator without understanding the equation system behind the software. The mathematical models used in the professional software [7,8,9] are based on a vast and valid data library from engine measurements, experiments, and tests used in order to generate a closely realistic simulation. There are specific research or work papers [10,11,12,13], similar from an engineering point of view to the current paper, that study the development of a gas turbine design and off-design performance calculation models. The current paper presents a mathematical model based on a limited data library, but with valid experimental data acquired from engine testing applications presented in some of our previous research papers [14,15].
A simple engine modeling approach involves processing the performance data provided by the engine manufacturer. By applying basic thermodynamic relationships, it is possible to predict the performance of gas turbines in terms of the engine life cycle [16].

2. Engine Presentation

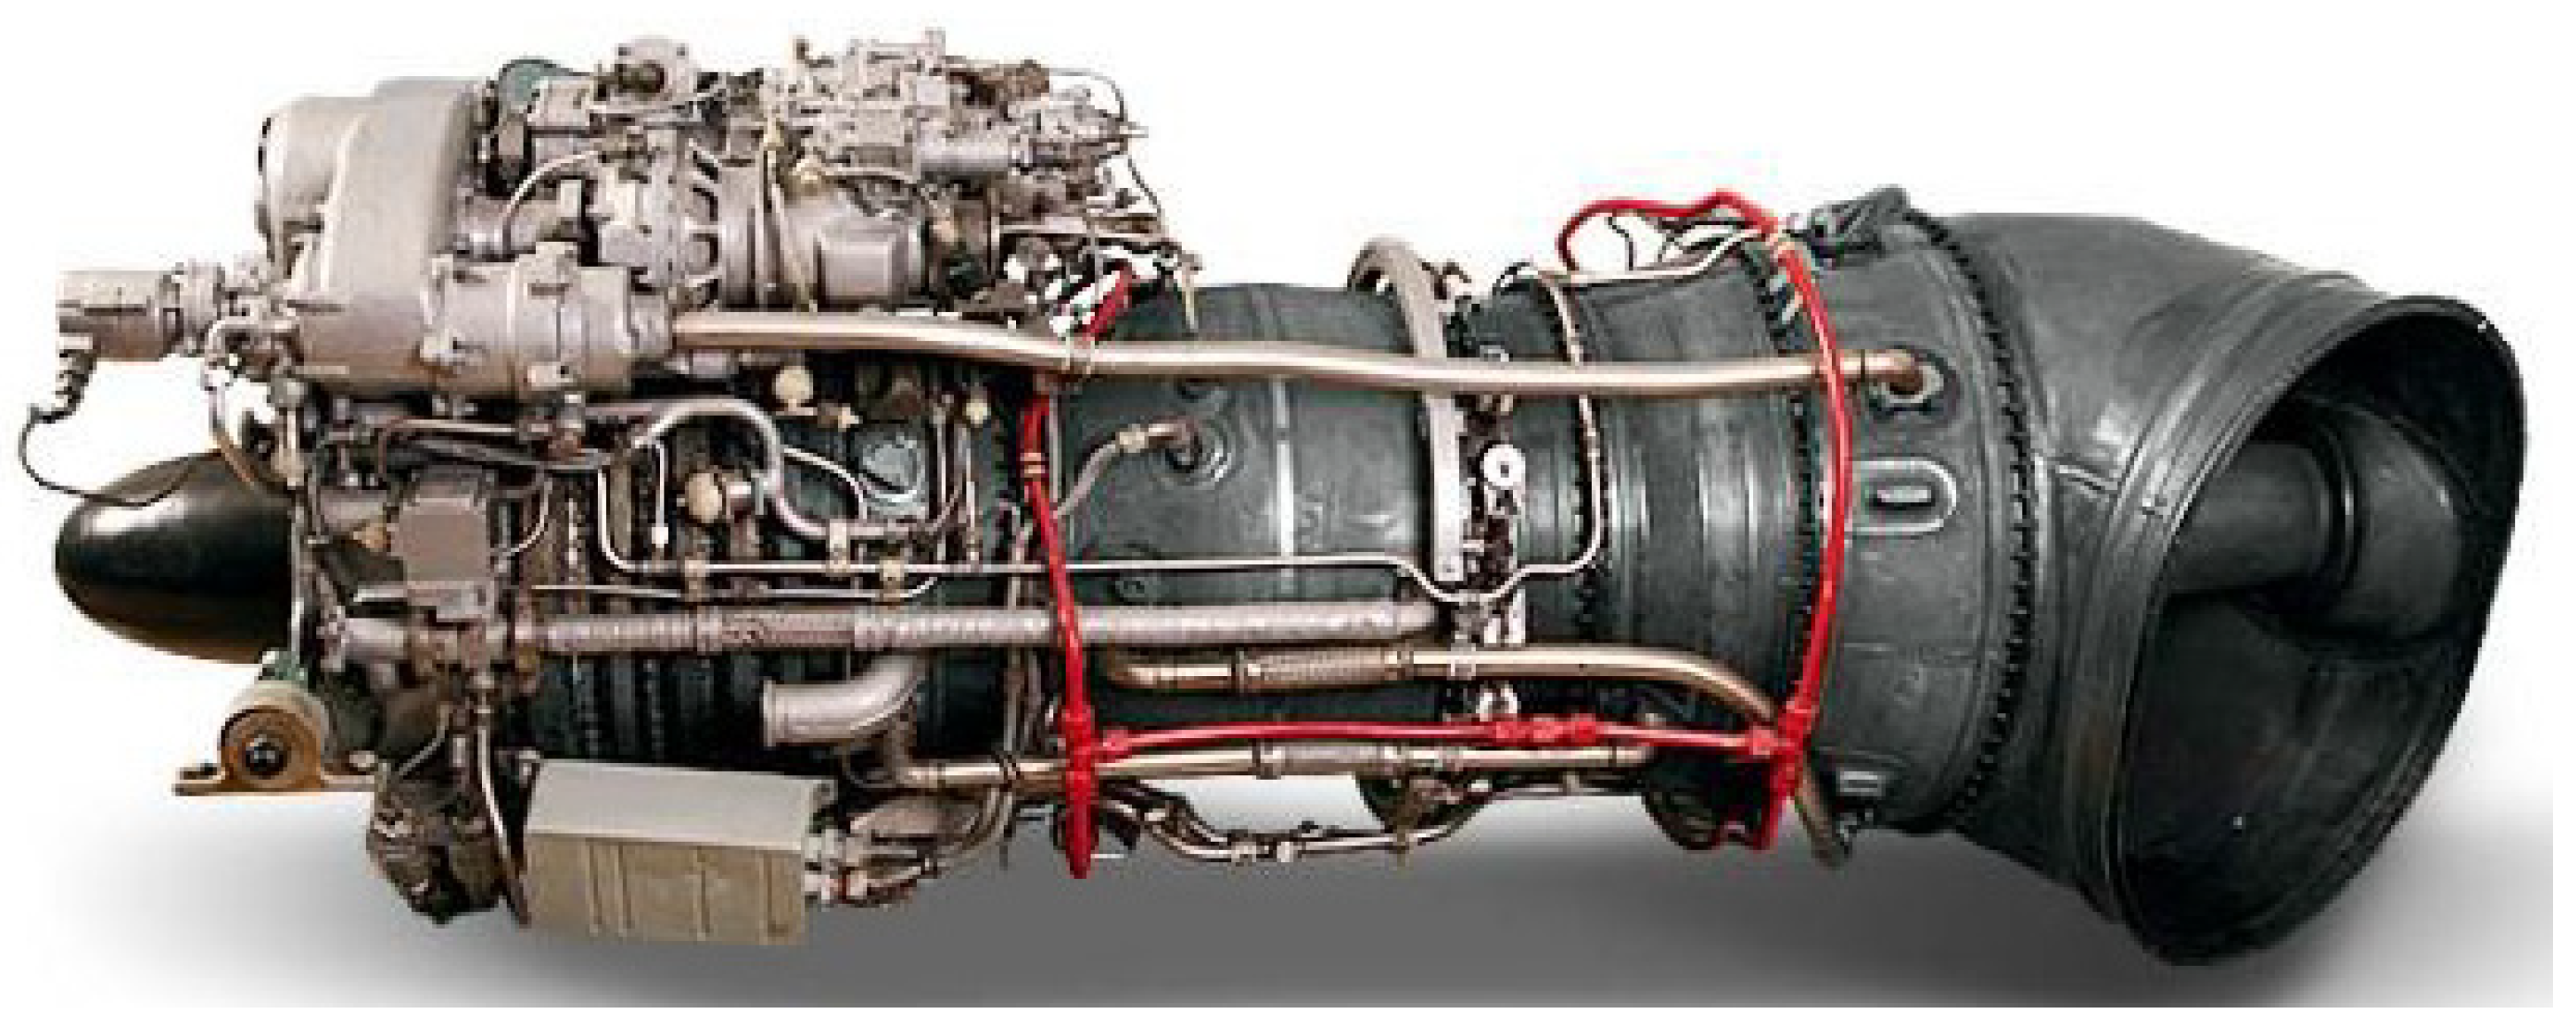
The analytical calculation model is applied for the TV3-117 MT gas turbine engine. According to the manual [17], TV3-117 MT is a free turbine turboshaft engine, produced by the Klimov manufacturer [18], which was installed on 90% of helicopters developed by the Mil and Kamov Engineering Centre. The TV3-117 MT engine from Figure 2 is a two-spool turboshaft, formed by a gas generator module and a free power turbine module. The gas generator consists of 12 stages of axial compressor, of which four stator stages are with variable geometry, an annular chamber, and two stages of axial turbine. The free power turbine module consists only of two stages of axial turbine and a transmission module.
At I.S.A. sea level conditions, the engine provides a power of 2225 HP at a maximum engine rotational speed of 19.500 rpm and at an overall pressure ratio of 9.45:1, for an air mass flow of 8.75 kg/s and a specific fuel consumption of 0.230 kg/HP/h.
The fuel engine control system is defined by constant free turbine speed law, adjusted between 96 ± 100%, depending on the engine regime. The gas generator speed at 100% is 19.500 rpm, and at 100%, the free turbine speed is 15.000 rpm.
In Table 1 is presented the operating regimes, at sea level condition, defined by the values of some main engine parameters extracted from the engine manual [17].
The engine manufacturers present the engine constructive configuration delimited by a series of stations marked with numbers. Usually, these stations are reference points of the thermodynamic model for design point calculations [20]. In Figure 3 are presented the stations of TV3-117 MT turboshaft, defined by the inlet and the outlet of engine rotor components. In this case, station 1 is the compressor inlet, station 2 is the compressor outlet, station 3 is the gas generator turbine inlet, station 4 is the gas generator turbine outlet and also the power turbine inlet, and station 45 is the power turbine outlet.

3. Similarity Parameters and Experimental Data

The concept of the analytic model calculation is based on the analysis of experimental data from the working regimes of several engines. This analysis aims to determine a series of ratio parameters that have an approximately constant variation from the idle to the takeoff regime. These parameters are called similarity parameters [1,2,3,4,5] and are used in the analytical calculation model as reference parameters. Usually, the engine regimes are defined through the engine shaft speed. The current analytic calculation model used experimental data from three different types of engines: the TV2-117A turboshaft, AI-20K turboprop, and Viper 632-41 turbojet. These engines were involved in testing applications following the run on the test bench [14,15]. The data results presented in the current paper are the post processing results of raw experimental data from our own previous research papers [14,15]. Based on this, the percentage variation in the engine’s main parameters ( Δ p r m i ) is determined by reporting to the takeoff regime in order to observe the variation limits of each parameter and to identify certain parameters or ratio parameters that have variations within close limits. These can be used as similarity parameters.
Δ p r m i = p r m i p r m T O × 100
For a valid analysis, it is essential to use corrected parameters because the experimental data were acquired under various atmospheric conditions. Thus, it needs to be reported to standard atmospheric condition. Typically, the fundamental corrected parameters involve speed, temperatures, and pressures in the engine main stations, as well as air mass flow and fuel flow. These parameters are defined by the following formulas:
N c o = N × 288 T 1 ; T i . c o = T i × 288 T 1 ; p i . c o = p i × 1.01325 p 1
M a f = M a f . c o × 1.01325 p 1 × T 1 288 ; F f . c o = F f × 1.01325 p 1 × 288 T 1
The corrected values of the main engine parameters are different than actual values, but the percentage variation is the same. The percentage values of certain corrected main engine parameters are grouped into a series of tables. In Table 2 are shown the percentage values of inlet turbine total temperature ( T 3 t ) and overall total pressure ratio (πct).
In Table 3 are grouped the percentage values of the air mass flow (Maf) and fuel flow (Ff).
The Table 4 shows the compressor total adiabatic efficiency ( η C t ) and turbine total adiabatic efficiency ( η T t ).
In Table 5 are shown the percentage values of combustor chamber total pressure loss ( σ c a t ) and burn efficiency ( η c c h ).
Following the percentage analysis, it was found that the engine main parameters varied from idle to the takeoff between certain limits. Additionally, it is noteworthy that not all parameters have the same value variations or vary in the same way, as shown in Table 6.
According to gas turbine theory, there are certain similarity parameters used in thermodynamics calculations as constants. These parameters are ratios of specific main engine parameters, among which the most commonly used ones are mentioned.
N T 3 . t T O G f × T 3 . t p 3 . t T O l C . t N 2 T O
Following the percentage variation analyses, an additional coefficient is defined, namely the turbine temperature ratio, which can be used as a similarity parameter.
T 3 . t T 4 . t T O
One objective of the percentage variation analysis was to validate, through the calculation, based on measured data, that the similarity parameter indeed maintains nearly constant values as is specified in engine gas turbine theory. The percentage values of the similarity parameter are presented in the subsequent tables: Table 7 and Table 8.
In order to have a better view about the percentage variations of each similarity parameter of each studied engine reported to the engine speed, the data results are grouped into a series of tables form Table 9, Table 10, Table 11 and Table 12.
Thus, in Table 9 and Table 10 are shown the percentage values of the first and secondary similarity parameter, which are the most used in gas turbine theory.
In Table 11 are shown the percentage values of the third similarity parameter, which usually are used on compressor map performance calculation.
In Table 12 are shown the percentage values of the fourth similarity parameter, which was found following the thermodynamics analyses of the current experimental data.
Following a global analysis view, from the above table, it is observed that each similarity parameter has the limit of the variation vectors not being so different. Globally, after the 80% engine regime (speed), the limits of the variation vector are lower than 5%. Based on that, it can be specified that similarity parameters from lower regime than takeoff can be determined by the similarity parameter from the takeoff regime multiplied with variation vectors, as is shown in the next equations:
N T 3 . t R = v a r . v e % × N T 3 . t T O
G f × T 3 . t p 3 . t R = v a r . v e % × G f × T 3 . t p 3 . t T O
l C . t N 2 R = v a r . v e % × l C . t N 2 T O
T 3 . t T 4 . t R = v a r . v e % × T 3 . t T 4 . t T O

4. Analytical Calculation Model

As mentioned above, the analytical calculation model is applied to determine the regimes of the TV3-117 MT turboshaft engine. It should be noted that only some main parameters and performance from the takeoff regime are known, as presented in Table 13.
The first step of calculation of the TV3-117 MT engine regimes is to determine the main and similarity parameters from the takeoff regime, because the variation for the other regimes is reported to the similarity parameter values from the takeoff regime. In this way, to obtain accurate values is essential to use polynomials, for air and gas enthalpy and entropy, which are functions of working temperature [21].
In the case of air and gases (for ideal combustion), enthalpy and entropy are thus defined:
h a T a , s a T a p 0 = f T a h g . i d T g , s g . i d T g p 0 = f T g
where the polynomial function is the form:
f T = a 1 . a , g + a 2 . a , g × T + a 3 . a , g × T 2 + a 4 . a , g × T 3 + a 5 . a , g × T 4 + a 6 . g × T 5 .
In case of gases (for real combustion), the enthalpy and entropy have the next forms:
h g T g = x i d × i g . i d T g + x a . e x × h a T g
s g T g p 0 = x i d × s g . i d T g p 0 + x a . e x × s a T g p 0
where the mass participation x i d , x a . e x depending on air excess λ e x and air–fuel ratio m i n L
x i d , x a . e x = f λ e x , m i n L .
Apart from enthalpy and entropy polynomials, the calculation model requires some additional parameters or coefficients for which regular values are chosen, as shown in Table 14.
Thus, using specific data from Table 13 and Table 14, the values of the similarity parameters for the takeoff regime are calculated as described in the particular calculation below.
Since there is not sufficient data to determine certain main engine parameters, a preliminary step was to determine the air excess that is useful for the air and gas mass flow calculation. The calculation method of air excess starts from the enthalpy equality relation between reactants HR and reaction products HP from the general combustion reaction [22].
H R T 2 . t , T f = H P T 3 . t
Additionally, the enthalpies are defined as a function of temperature under a polynomial form:
H R , P T = R i × a 1 + a 2 × T 2 + a 3 × T 2 2 + a 4 × T 3 2 + a 5 × T 4 2 + b 1 T
From the above equality, a second-degree equation in the unknown α e x is derived. The solution of this equation provides the values of air excess.
α e x 2 × a + α e x × b + c = 0 α e x . 1,2 = b ± Δ 2 × a α e x
α e x = f T 3 . t , π C . t α e x = 3.687 f f c = 1 α e x × m i n L
After the air excess was determined, the calculation continues to determine the main engine parameters and performance that are components of the similarity parameters.
F f = P × 0.736 × S F C 3600 M a f = F f f f c G f = M a f + F f
p 2 . t . i d = p 2 . t s a T 2 . t . i d = s 1 . t + R a × ln p 2 . t p 0 T 2 . t . i d
l C . t . i d = h a T 2 . t . i d h a T 0 l C . t = l C . t . i d η C . t
l T G . t = M a f G f × l C . t η m ; l T P . t = P × 0.736 G f ; l T . t = l T G . t + l T P . t
h g T 4 . t = h g T 3 . t l T G . t T 4 . t
h g T 45 . t = h g T 3 . t l T . t T 45 . t
Following the application of the above calculation model, in Table 15 are presented the calculated values of the similarity parameters from the takeoff regime.
From this point, the engine working regimes lower than takeoff can be calculated. In the current case, the calculation of the TV3-117 MT engine operating regimes starts by using the same regime speed of the gas generator, N = 96.1, 94.7, 93.5, 91.5, and 73.0 [%], as is specified in the engine manual. In this way, it a comparison method of the calculated regimes is performed with the operating regimes shown in the engine manual. Therefore, the engine main parameters and performance for the other regimes, from the idle to nominal regime, are calculated by using the next set of equations in the following order.
The compressor total adiabatic efficiency:
η C . t R = 0.96 ÷ 1 × η C . t T O η C . t R
The compressor total specific actual work:
l C . t N 2 R = 0.85 ÷ 1 × l C . t N 2 T O l C R .
The ideal compressor outlet total temperature:
l C . t . i d = η C . t × l C . t R l C . t . i d R ;
h 2 . i d = l C . t . i d h 0 R h 2 . i d R ;
h 2 . i d R = h a T 2 . t . i d R T 2 . t . i d R .
The compressor outlet total pressure:
s 1 . t = s 2 . t . i d = s a T 2 . t . i d R a × ln p 2 . t / p 0 R ;
p 2 . t R = p 0 × e s a . p 0 T 2 . t . i d s 1 . t R a p 2 . t R .
The turbine inlet total pressure:
σ c a . t R = 0.96 ÷ 1 × σ c a . t T O σ c a . t R ;
p 3 . t = p 2 . t × σ c a . t R p 3 . t R .
The turbine inlet total temperature:
N G T 3 . t R = 0.9 ÷ 1 × N G T 3 . t T O T 3 . t R .
The gases flow:
G f × T 3 . t p 3 . t R = 0.85 ÷ 1 × G f × T 3 . t p 3 . t T O G f R
From this point, the analytical model, continues with the calculation of air excess [22] at each regime by applying the same method described for the takeoff.
α e x = f T 3 . t , π C . t R α e x 2 × a + α e x × b + c = 0 R α e x R
The fuel flow coefficient:
f f c = 1 α e x × m i n L R f f c R
The mass and gases air flow at other regimes:
M a f = G f 1 + f f c R M a f R F f = G f M a f R F f R
The gas generator turbine outlet total temperature:
l T G . t = M a f G f l C . t η m . G R l T G . t R ; i g T 4 . t = i g T 3 l T G . t R T 4 . t R
The temperatures ratio of the free turbine:
T 4 T 45 . t R = 0.89 ÷ 1 × T 4 T 45 . t T O T 4 . t T 45 . t R T 45 . t R
The total specific actual work of entire turbine and free turbine:
l T . t = i g T 3 . t i g T 45 . t R l T . t R ; l T P = l T l T G R l T P R
The power at free turbine shaft and specific fuel consumption:
P T P = l T P × G f R P T P R ; s f c = F f P T P R s f c R
The thermal efficiency depends on the fuel lower heating value (LHVf) with the next form:
η t e = P T P F f × L H V f R η t e R
The engine was tested with TS-1 fuel the value of LHV is 42,900 [kJ/kg].

5. Calculated Results and Charts

Following the application of the analytical calculation model based on similarity parameters, several main engine parameters and some performances at each engine regime of the TV3-117 MT turboshaft were determined. In Table 16 are presented the calculated actual values of the engine parameters and performance.
The foundation of the analytical calculation model is the percentage variation in similarity parameters. In Table 17 are shown the percentage variation values ( Δ p r m c ) of the calculated parameters and performances from Table 16. The values were calculated by reporting all values from each regime to the values of the takeoff regime, and also by applying the Equation (1).
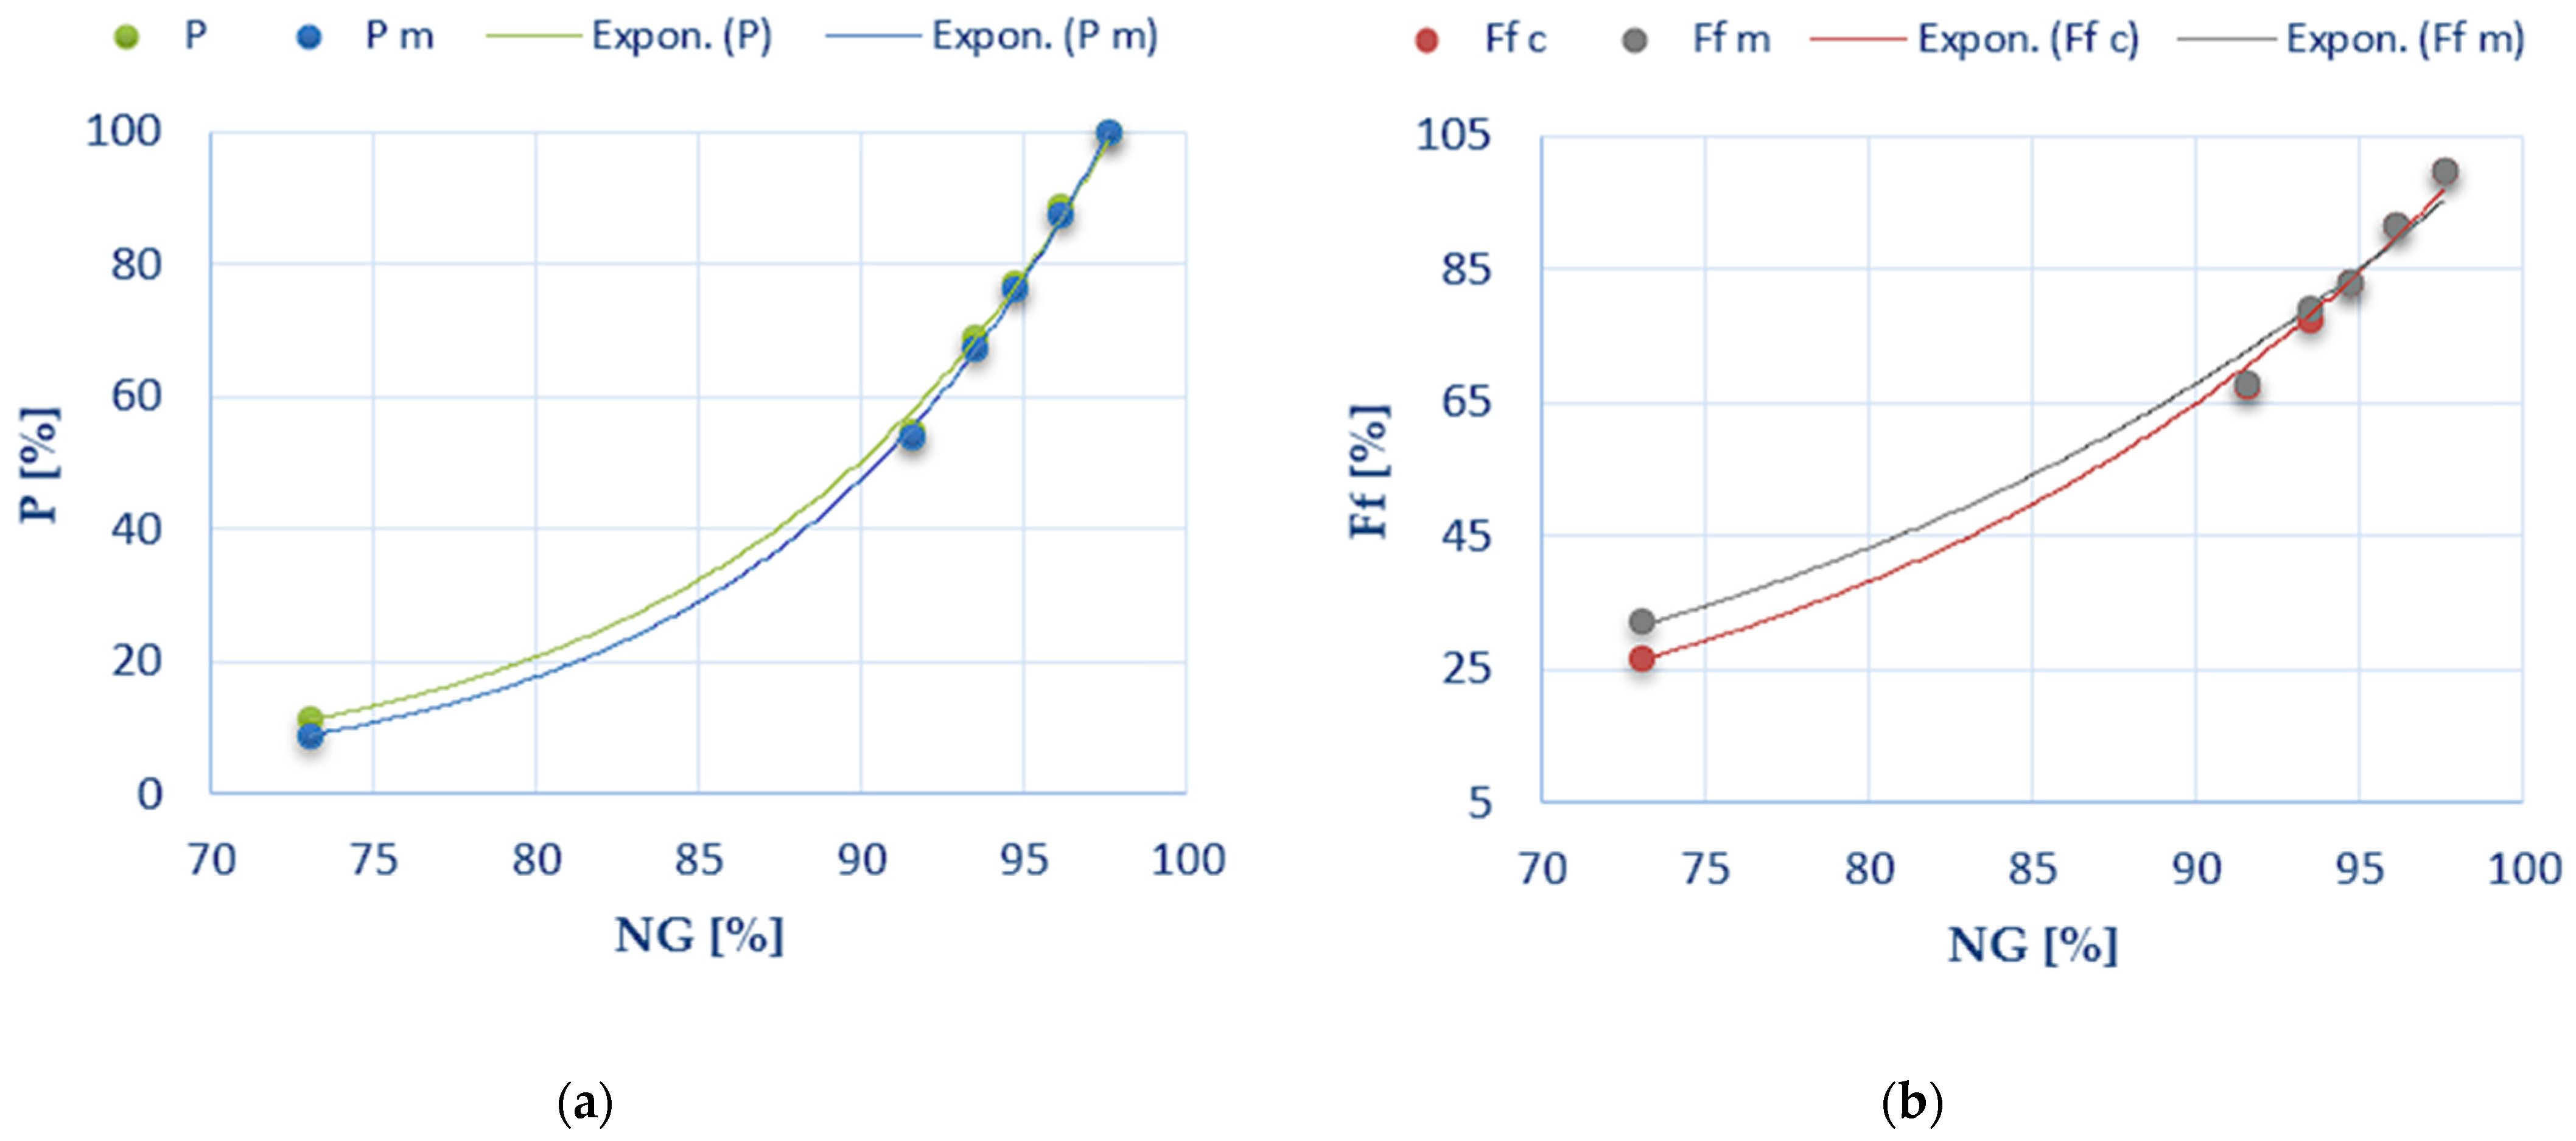
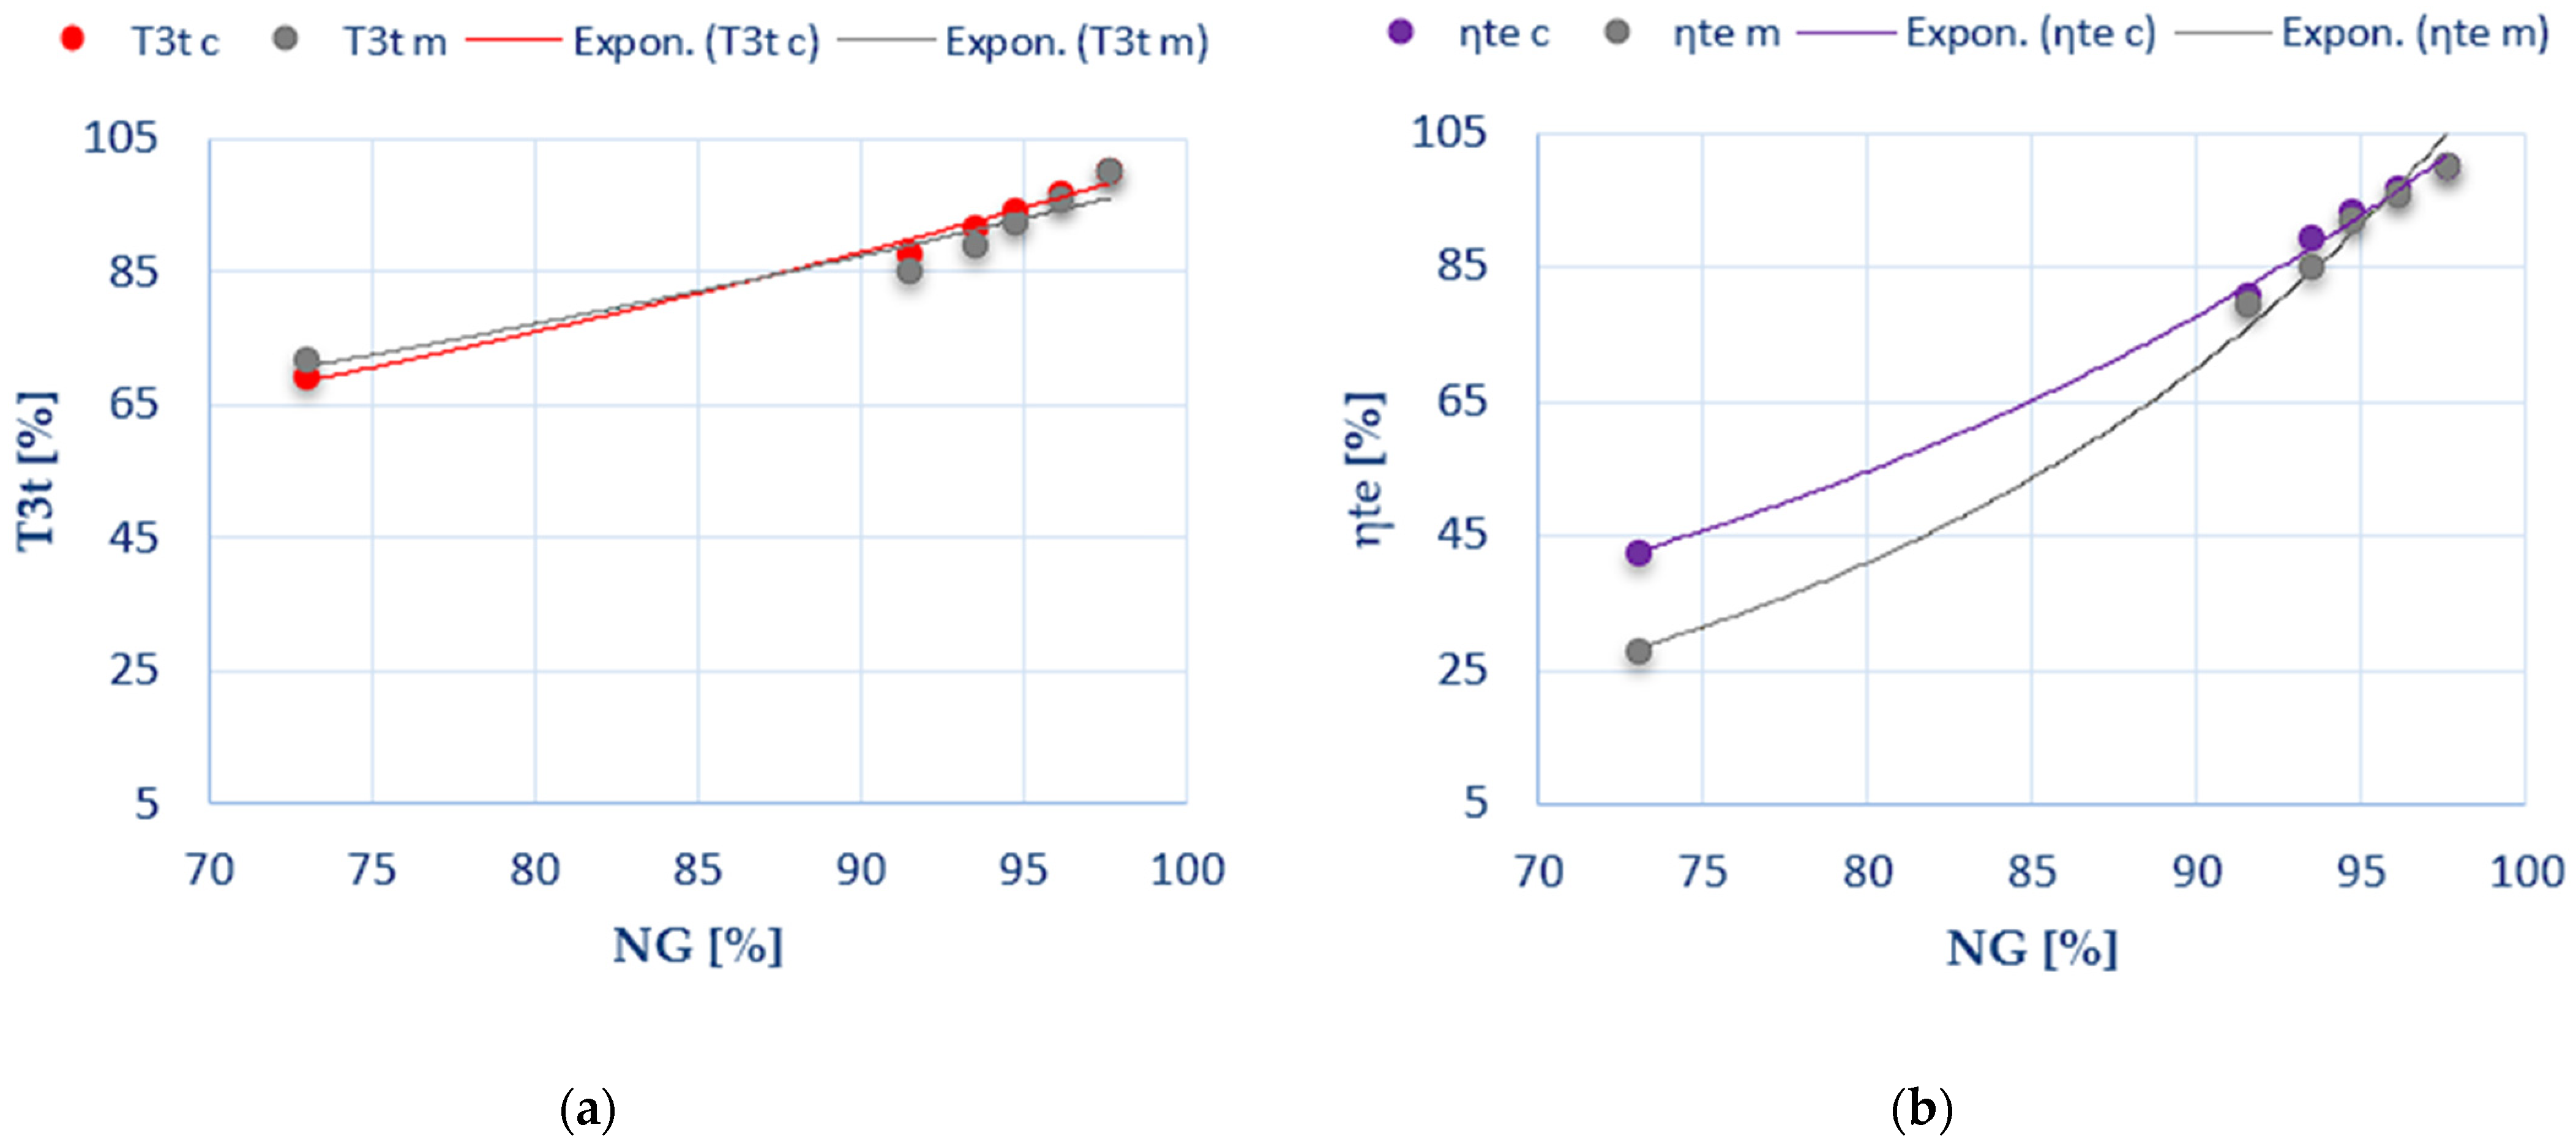
To have a graphical view about parameter variation, in the next figures from the displays in Figure 4, Figure 5, Figure 6 and Figure 7, under the charts, except the takeoff point, the percentage variations of the main engine parameters performances, such as mass air flow (Maf), fuel flow (Ff), overall total pressure ratio ( π C t ), and turbine inlet total temperature (T3t), gas generator turbine total-specific actual work ( l T G ), free turbine total-specific actual work ( l T P ), engine shaft power (P), and thermal efficiency (ηte) with the engine speed are shown.
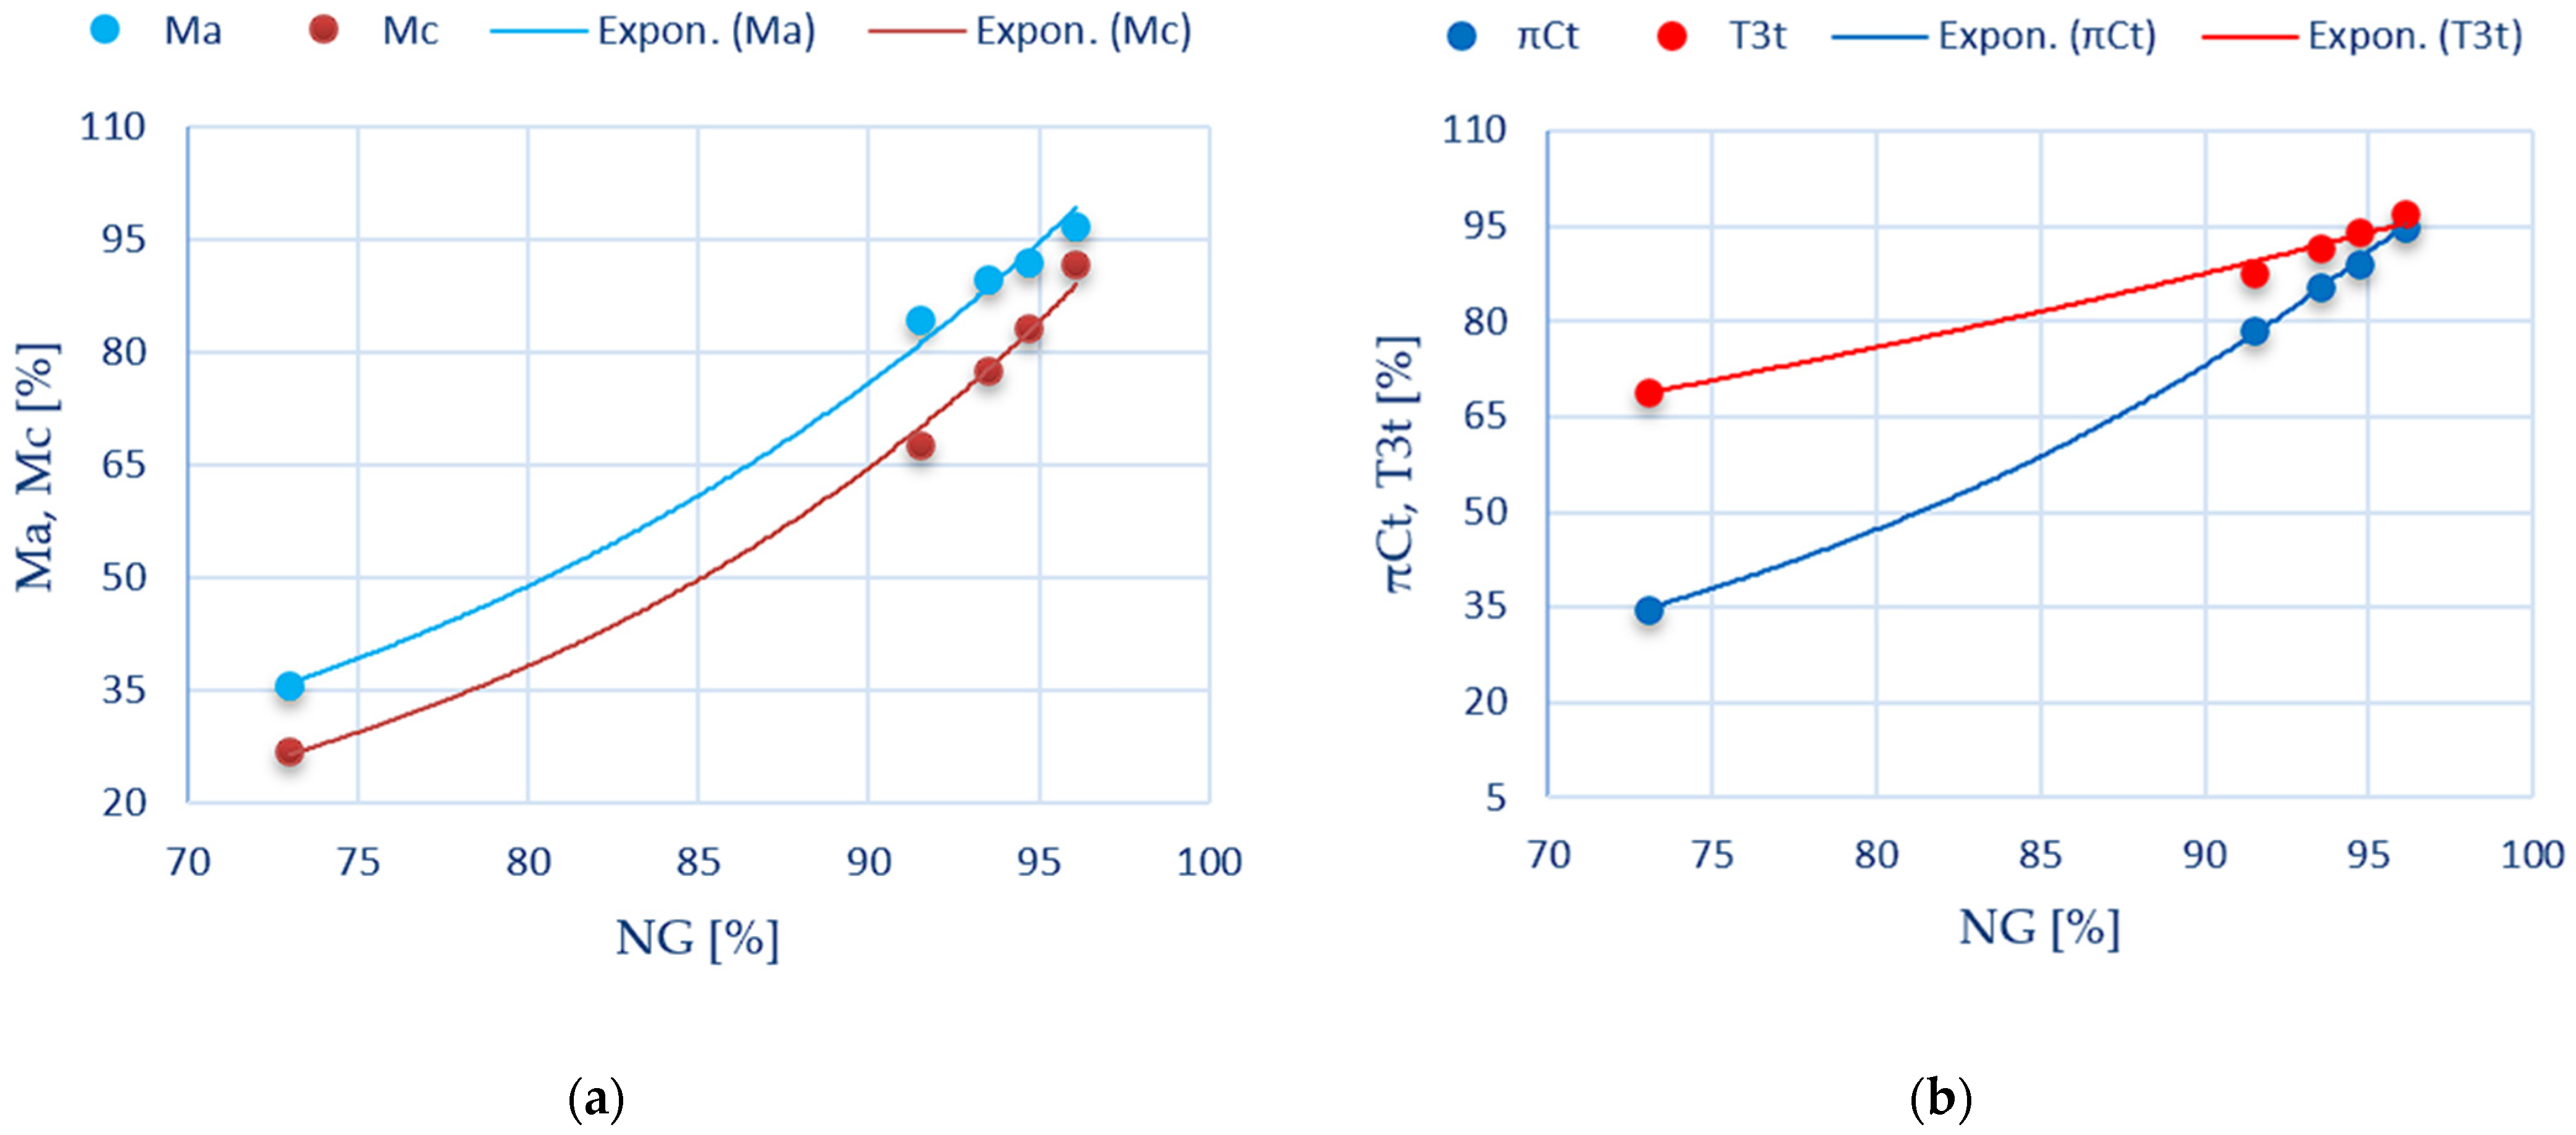
In Figure 4a, it is observed that the curve variation in the air mass flow is similar with the fuel flow but with higher percentage values than the fuel flow. At the idle regime, the air mass flow starts to vary from 36% compared to 27% of the fuel flow. In Figure 4b, it is noticed that the overall total pressure ratio of the curve variation is different than the turbine inlet total temperature. In this case, the highest difference is at the idle regime, where the overall total pressure ratio starts to vary from 35% compared to 69% of the turbine inlet total temperature; but at higher regimes than idle, the values begin to converge.
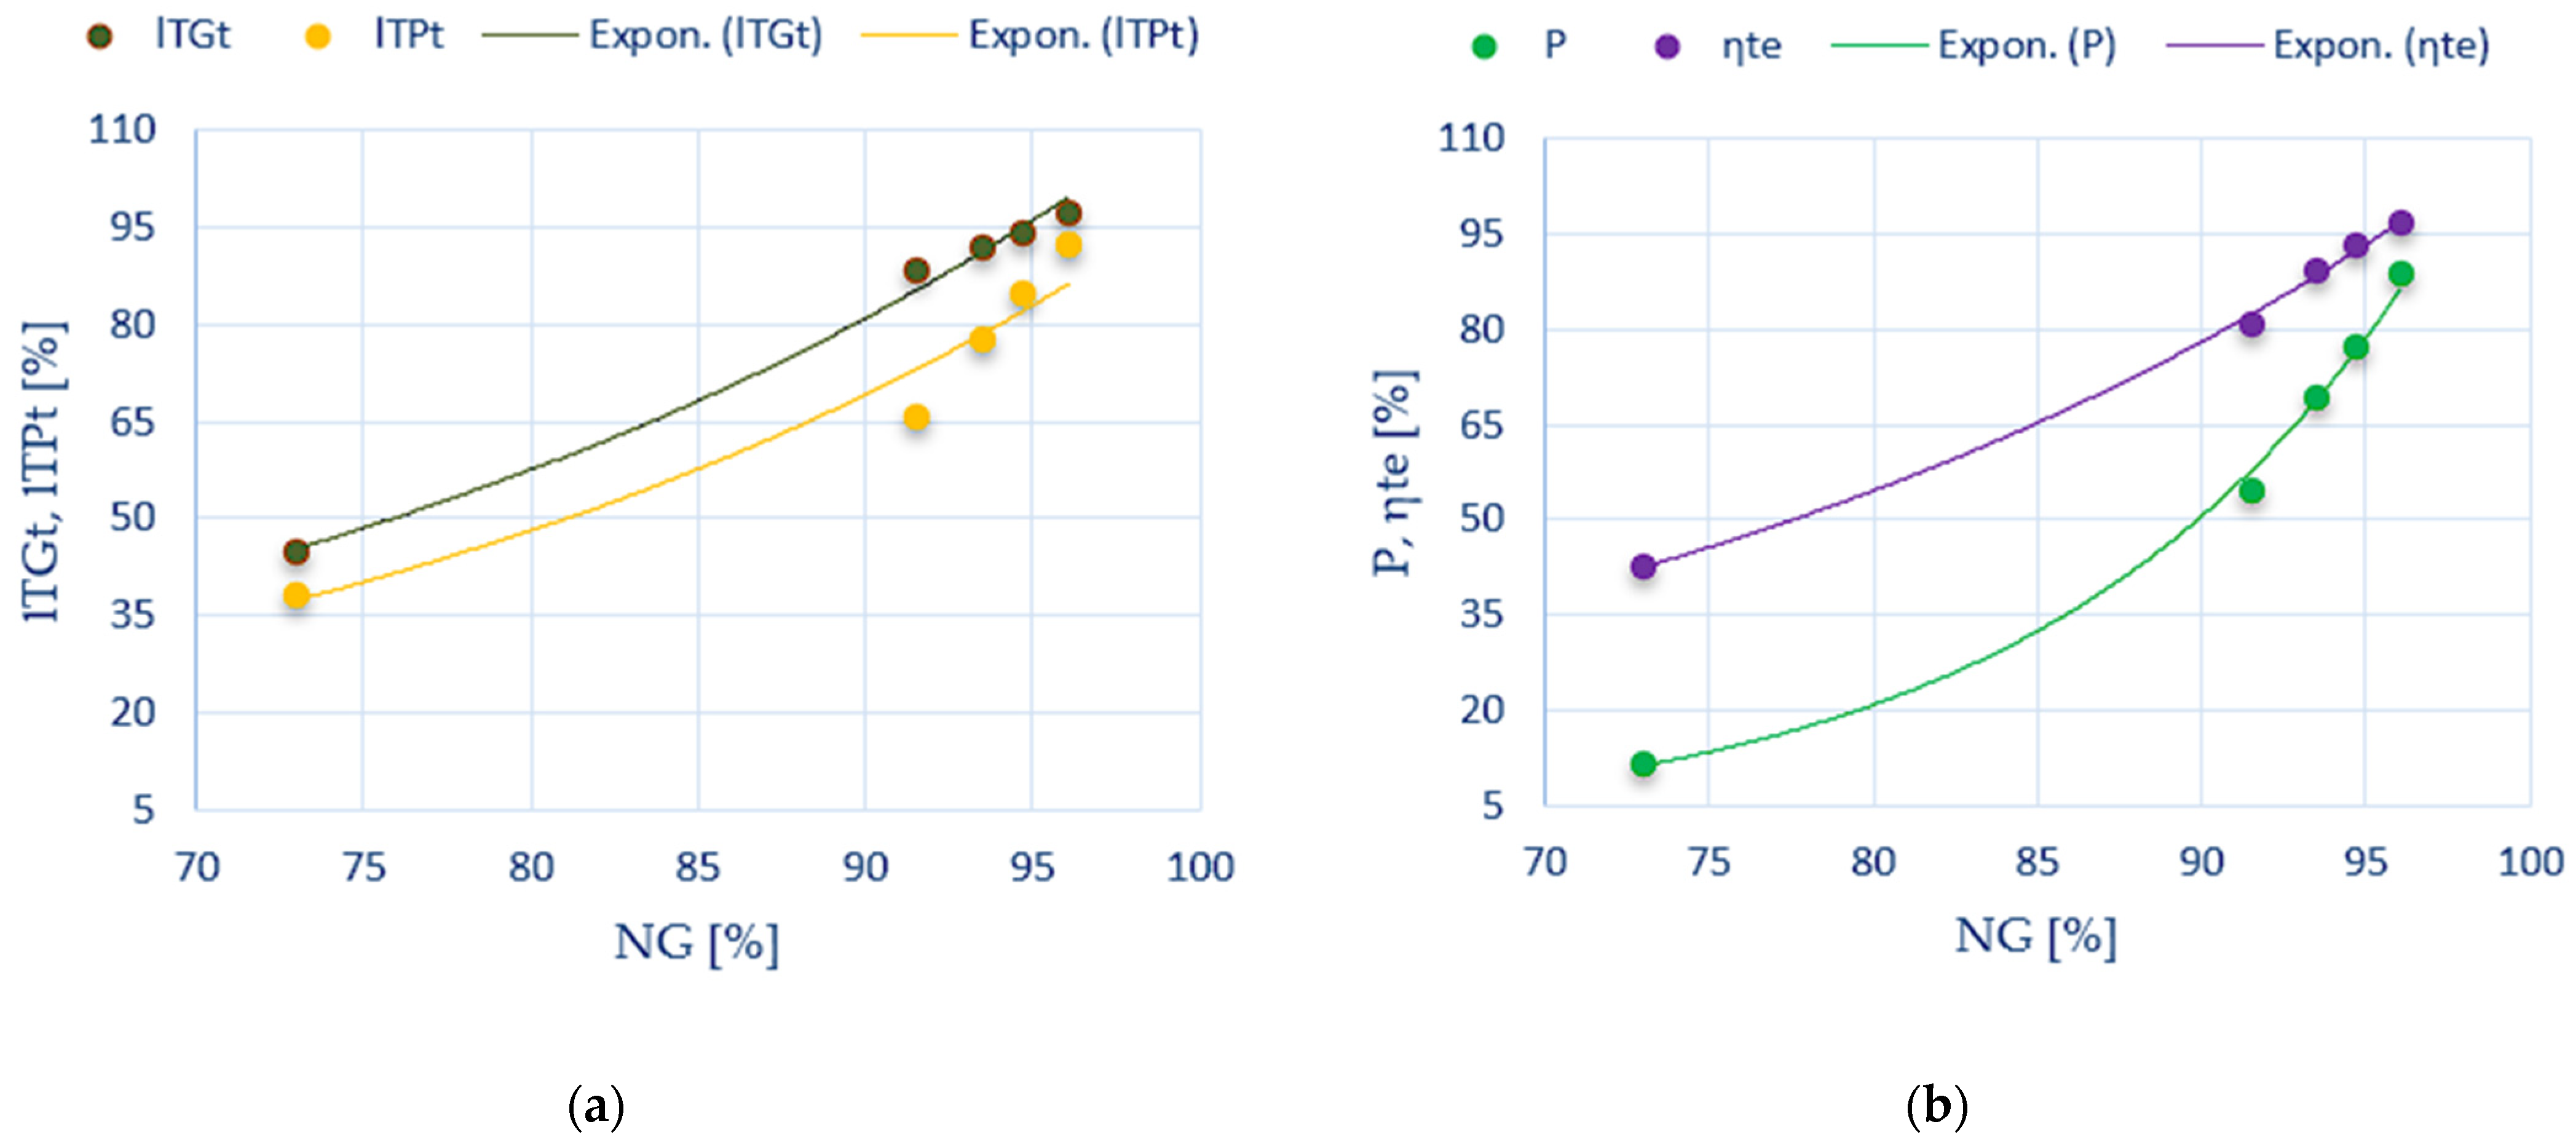
In Figure 5a, it can be seen that the turbine total-specific actual work has close curve variation with the free turbine total-specific actual work, but with higher percentage values than free turbine total-specific actual work. In Figure 5b, it is noticed that the curve variation in the thermal efficiency is different than shaft power, defined by higher percentage values. The difference consists in the values at the idle regime, where the thermal efficiency starts to vary from 42% compared to 11% of the shaft power. Even at higher regimes, the values are not starting to converge.

6. Discussion

In order to make a validation of the analytical calculation model to assure if the results are correctly calculated, it is required to compare the calculated data with data from the engine manual. The comparison method is obvious through the percentage variation. In this case, a first step is to calculate the percentage variation in data from the engine manual ( Δ p r m m ), by applying the Equation (1). In Table 18 are shown the values of percentage variation in the main engine parameters and performance extracted from the engine manual.
Therefore, the comparison method is based on the percentage differences, but only for the same parameters and performance shown in the engine manual. So, the percentage differences ( d p r m ) are defined by the following mathematical relation:
d p r m = Δ p r m c Δ p r m m
In Table 19 are presented the actual values of percentage differences of engine parameters and performance at the same gas generator speed as is specified in the engine manual.
Overall, from Table 19 it is observed that for regimes above 80%, the percentage difference values for the parameters and performance are under 3%. Only the thermal efficiency exhibits a value of −4.2%. In the case of regimes lower than 80%, such as the idle regime, it results in a value of 5.5% for fuel consumption, and a higher value of −15.0% for the thermal efficiency. One reason the fuel flow for the idle regime has a larger value is that the engine manual provides the maximum possible values, which also affects the thermal efficiency value. So, in the case of 80% higher regimes, where the percentage difference values are lower than 3%, the calculation model can be declared as almost validated. In the case of the idle regime, because some percentage differences are higher than 5.5%, that calculation model can be declared as partially validated, and requires more attention on the variation vector.
In order to have a better view about the comparison between the calculated data and engine manual data, in Figure 6 and Figure 7 are presented under the same chart the percentage variation with the engine speed of that calculated relative to the manual data of certain main parameters and performances, such as shaft power, fuel flow, turbine inlet total temperature, and thermal efficiency.
In Figure 6a,b and Figure 7a, it is observed that the curve variation in the calculated power, fuel flow, and turbine inlet total temperature relative to the data manual are almost the same. Only on the idle regime, the values are a little bit different, and in the rest of the regimes, the values are quite similar.
In Figure 7b, it can be seen that the curve variations of calculated thermal efficiency relative to data manual have some differences, higher compared power, fuel flow, and turbine inlet temperature. The biggest difference is also at idle regime around 15%, but at higher regime, the values begin to converge.

7. Conclusions

The objective of this paper is to provide a version of an analytical calculation model of working regimes and performance analysis for a free turbine turboshaft, useful for gas turbine engine education and several propulsion experimental applications. The paper work presents an analytical calculation model to determine the particular operating regimes of the TV3-117 MT turboshaft, at which are only known certain performances and some main engine parameters from the takeoff regime. The paper presents a first version of working regime model calculation, based on a limited data library, with relevant experimental data, from three different types of engines, as is the TV2-117A turboshaft, AI-20K turboprop, and the Viper 632-41 turbojet, following the engines run on the test bench. This current analytical calculation model, compared to some simulation software, does not require knowing the dimensional parameters or the performance map of the compressor and turbine, and does not work with kinematic parameters and works only with experimental parameters from engine regime variation analysis. The analytical calculation model has a validity rate of around 97% for regimes above 80% engine speed and a validity rate of around 85% for regimes between idle and 80% engine speed. The validity rate was determined by comparison of the calculated data with the engine manual data, which are the main reference. Similarity parameters have an approximate validity rate of around 90% because they do not have fixed constant values across different regimes. Experimental data processing demonstrated that they vary within narrow limits, which can be eventually reduced to constant values. In conclusion, by improving the data library, by adding more experimental data, and other extra similarly calculated coefficients, this model will be a powerful tool for performance prediction and off-design analysis.

Author Contributions

Conceptualization, R.M.C.; methodology, R.M.C.; software, R.M.C.; validation, R.M.C.; formal analysis, R.M.C.; investigation, R.M.C.; resources, R.M.C.; data curation, R.M.C.; writing—original draft preparation, R.M.C.; writing—review and editing, G.D.; visualization, G.D.; supervision, G.D.; project administration, R.M.C.; moreover, preparing the engines, instrumentation, the acquisition of parameters and testing, R.M.C. All authors have read and agreed to the published version of the manuscript.

Funding

The Research was carried out under the “Nucleu” Program through The National Plan for Research, Development and Innovation 2022–2027, funded by the Romanian Ministry of Research, Innovation and Digitalization (MCID), Grant no. 31N/2023. The APC was funded by the Romanian Ministry of Research, Innovation and Digitalization (MCID) through project number PN23.12.01.02.

Informed Consent Statement

Not applicable.

Data Availability Statement

Data is contained within the article and in referenced papers.

Conflicts of Interest

The authors declare no conflict of interest.

Nomenclature

The following parameters and variables are used in this research.
NomenclatureDescription
P [ H P ] Shaft Power
S F C   [ k g / H P / h ] Specific fuel consumption
N G   [ % ] Gas generator shaft speed
N T P   [ % ] Free turbine shaft speed
N   [ % ] Working gas generator shaft speed
F C   [ k g / h ] Fuel consumption
F f     [ k g / s ] [ k g / h ] Fuel flow
f f c   [-]Fuel flow coefficient
α e x [-]Air excess
M a f   [ k g / s ] Mass air flow
G f   [ k g / s ] Gases flow
π C t [-]Overall total pressure ratio
π T t [-]Turbine total pressure ratio
η C t [-]Compressor total adiabatic efficiency
η T t [-]Turbine total adiabatic efficiency
η m G [-]Gas generator mechanical efficiency
P 0   [ ° C ] Standard pressure
T 0   [ ° C ] Standard temperature
P 1 t [ b a r ] Compressor inlet total pressure
T 1 t   [ K ] Compressor inlet total temperature
P 2 t   [ b a r   a ] Compressor outlet total pressure
T 2 t   [ K ] Compressor outlet total temperature
P 3 t   [ bar   a ] Turbine inlet total pressure
T 3 . t [ K ] Inlet turbine maximum temperature
P 4 t   [ bar   a ] Gas generator turbine inlet total pressure
T 4 t   [ K ] Turbine outlet total temperature
P 45 t   [ bar   a ] Free turbine outlet total pressure
T 45 t   [ K ] Free turbine outlet total temperature
h a T   [ k J / k g ] Air enthalpy polynomial function
s a T   [ k J / k g ] Air entropy polynomial function
h g . i d T   [ k J / k g ] Ideal gases enthalpy polynomial function
s g . i d T   [ k J / k g ] Ideal gases entropy polynomial function
x g . i d [-]Ideal gases mass participations
x a . e x [-]Air excess mass participations
a i . g [-]Gases enthalpy and entropy polynomial coefficients
l C t . i d [ k J / k g ] Compressor total specific ideal work
l C t [ k J / k g ] Compressor total specific actual work
l T t . i d [ k J / k g ] Turbine total specific ideal work
l T t [ k J / k g ] Turbine total specific actual work
h 1 t T   [ k J / k g ] Total specific enthalpy for station “1”
h 2 t . i d T   [ k J / k g ] Total specific ideal enthalpy for station “2”
h 2 t T   [ k J / k g ] Total specific enthalpy for station “2”
h 3 t T   [ k J / k g ] Total specific enthalpy for station “3”
h 4 t T   [ k J / k g ] Total specific enthalpy for station “4”
h 45 t T   [ k J / k g ] Total specific enthalpy for station “45”
P T P [ k W ] Free turbine shaft power
L H V f [ k J / k g ] Fuel lower heating value
η T e [-]Thermal efficiency
Δ p r m i   % Percentage variation in calculated data
Δ p r m m   % Percentage variation in data from engine manual
d p r m   % Percentage differences
N G . c o   [ % ] Corrected gases generator shaft speed
M a f . c o   [ k g / s ] Corrected air mass air flow
F f . c o   [ k g / s ] Corrected fuel flow
π C t [-]Corrected overall total pressure ratio
T 3 t . c o   [ K ] Corrected inlet turbine temperature
η C t . c o [-]Corrected compressor total adiabatic efficiency
η T t . c o [-]Corrected turbine total adiabatic efficiency
d P   [ % ] Different percentage of engine power
d T 3 t   [ % ] Different percentage of inlet turbine temperature
d F C   [ % ] Different percentage of fuel consumption
d η t e   [ % ] Different percentage of thermal efficiency

References

  1. Bathie, W.W. Fundamentals of Gas Turbines; Iowa State University of Science and Technology: Ames, IA, USA, 1984. [Google Scholar]
  2. Rogers, G.F.C.; Saravanamuttoo, H.I.H.; Mayhew, Y.R. Gas Turbine Theory, 4th ed.; Longman Group Limited: London, UK, 1996. [Google Scholar]
  3. Whittle, F. Gas Turbine Aero-Termodynamics; Pergamon Press: Elmsford, NY, USA, 1981. [Google Scholar]
  4. Japikse, D.; Baines, N.C. Introduction to Turbomachinery; Concepts ETI, Inc.: Norwich, VT, USA; Oxford University Press: Oxford, UK, 1994. [Google Scholar]
  5. Stanciu, V.; Brebenel, M. Modeling and Simulation of Aviation Gas Turbine Engines, Applications, Politehnica University of Bucharest; Printech: Bucharest, Romania, 2013; ISBN 978-606-521-921-2. (Translation from Romanian). [Google Scholar]
  6. Chapman, J.W.; Lavelle, T.M.; Litt, J.S. Practical Techniques for Modeling Gas Turbine Engine Performance; NASA/TM-2016-219147; Glenn Research Center: Cleveland, OH, USA, 2016; p. 44135. [Google Scholar]
  7. GasTurb. Available online: https://www.gasturb.com/software/gasturb-details.html (accessed on 12 February 2023).
  8. GSP Team. Available online: https://www.gspteam.com/Files/manuals/UM/GSP_UM_11.pdf (accessed on 12 February 2023).
  9. EcosimPro. Available online: https://www.ecosimpro.com/products/proosis/ (accessed on 12 February 2023).
  10. Kurzke, J. How to Create a Performance Model of a Gas Turbine From a Limited Amount of Information. In Proceedings of the ASME Turbo Expo 2005: Power for Land, Sea, and Air, Reno, NV, USA, 6–9 June 2005; ASME GT 2005-68537; ASME: New York, NY, USA, 2005; pp. 145–153. [Google Scholar]
  11. Lazzaretto, A.; Toffolo, A. Analytical and Neural Network Models for Gas Turbine Design and off-Design Simulation. Int. J. Appl. Thermodyn. 2001, 4, 173–182. [Google Scholar]
  12. Alexiou, A.; Mathioudakis, K. Development of Gas Turbine Performance Models Using A Generic Simulation Tool, GT2005-68678. In Proceedings of the GT2005 ASME Turbo Expo 2005: Power for Land, Sea and Air, Reno-Tahoe, NV, USA, 6–9 June 2005. [Google Scholar]
  13. Nicoara, R.; Suciu, C.; Dombromirescu, C.; Dombrovschi, M.; Prisacariu, E. Analysis of Gas Turbine Stability at Idle and Sub-Idle Speeds. Turbo J. 2020, VII, 44–53. [Google Scholar]
  14. Catana, R.M.; Dediu, G.; Tarabic, C.M. Studies and Experimental Research in the Evaluation of TV2-117A Turboshaft Engine Working Regimes. Appl. Sci. 2022, 12, 3703. [Google Scholar] [CrossRef]
  15. Catana, R.M.; Badea, G.P. Experimental Analysis on the Operating Line of Two Gas Turbine Engines by Testing with Different Exhaust Nozzle Geometries. Energies 2023, 16, 5627. [Google Scholar] [CrossRef]
  16. Ottawa, J. Performance Prediction and Simulation of Gas Tur-Bine Engine Operation; RTO/NATO, RTO Technical Report 44 AC/323(AVT-018)TP/29; Research and Technology Organisation: Neuilly-sur-Seine, France, 2002; ISBN 92-837-1083-5. [Google Scholar]
  17. TV3-117 MT Free Turbine Turboshaft. In Engine Description and Maintenance Manual; Book 1/2; Military Technical Academy: Bucharest, Romania, 1975; (Translation from Romanian).
  18. Gebrehiwet, L.; Nigussei, Y.; Teklehaymanot, T. A Review-Differentiating TV2 and TV3 Series Turbo Shaft Engines. Int. J. Res. Publ. Rev. 2022, 3, 1822–1838. [Google Scholar] [CrossRef]
  19. Szabo, J.; Hocko, M. Proposal Modifications Turboshaft Engine TV3-117 on Energy Use, ACTA AVIONICA. Available online: acta-avionica.tuke.sk (accessed on 23 May 2023).
  20. Effiom, S.O.; Abam, F.I.; Nwankwojike, B.N. Performance evaluation of aeroderivative gas turbine models derived from a high bypass turbofan for industrial power generation. Cogent Eng. 2017, 4, 1301235. [Google Scholar] [CrossRef]
  21. Catana, R.M.; Dediu, G.; Tarabic, C.M.; Serbescu, H.M. Performance Calculations of Gas Turbine Engine Components Based on Particular Instrumentation Methods. Appl. Sci. 2021, 11, 4492. [Google Scholar] [CrossRef]
  22. Catana, R.M.; Cican, G. Study of air excess in relation with engine parameters for a generalized reaction based on Jet-A fuel. Appl. Mech. Mater. 2015, 772, 395–400. [Google Scholar] [CrossRef]
Figure 1. (a) Gas Turb Program graphical interface; (b) Gas Turbine Simulation Program (GSP) graphical interface.
Applsci 13 10720 g001
Figure 2. TV3-117 MT turboshaft engine [19].
Applsci 13 10720 g002
Figure 3. TV3-117 MT engine stations.
Applsci 13 10720 g003
Figure 4. (a) Percentage variation in mass air flow (Maf) and fuel flow (Ff) with engine speed. (b) Percentage variation in overall total pressure ratio ( π C t ) and turbine inlet total temperature (T3t) with engine speed.
Applsci 13 10720 g004
Figure 5. (a) Percentage variation in gas generator turbine total-specific actual work ( l T G ) and free turbine total-specific actual work ( l T P ) with engine speed. (b) Percentage variation in engine shaft power (P) and thermal efficiency (ηte) with engine speed.
Applsci 13 10720 g005
Figure 6. (a) Curve variation in calculated power relative to data manual. (b) Curve variation in calculated fuel flow relative to data manual.
Applsci 13 10720 g006
Figure 7. (a) Curve variation in calculated turbine inlet total temperature relative to data manual. (b) Curve variation in calculated thermal efficiency relative to data manual.
Applsci 13 10720 g007
Table 1. TV3-117 MT operating regimes.
Engine RegimesP [HP]SFC [kg/HP/h]NG [%]NTP [%]T3t [°C]Ff [kg/h]ηte [-]
Takeoff22250.23097.6 ± 0.598 ± 1975511.80.2673
Takeoff (L)19500.24096.1 ± 0.598 ± 1935468.00.2561
Nominal17000.25094.7 ± 0.5100 ± 2900425.00.2459
Cruise 115000.27093.5 ± 0.5100 ± 2870405.00.2277
Cruise 212000.29091.5 ± 0.5100 ± 2830348.00.2120
Idle2000.8373 +645 +15700165.00.7450
Table 2. Percentage variation in corrected inlet turbine temperature ( T 3 t . c o ) and overall pressure ratio ( π C t . c o ) with engine speed ( N c o ).
TV2AI-20ViperTV2AI-20ViperTV2AI-20Viper
N c o [%] T 3 t . c o [%] π C t . c o [%]
64.1-50.668.46-64.4633.03-26.07
83.359.361.477.2786.6866.1652.0832.8833.08
85.564.871.579.0586.067.5256.6838.3142.88
88.372.576.982.5187.2369.8864.6247.6749.44
90.576.081.585.7588.8472.8872.652.4655.88
92.579.387.189.8483.8476.4281.5760.7365.63
94.284.092.292.6586.8482.3186.5570.5676.13
95.689.497.196.092.0490.4492.2183.5889.24
96.993.8100.499.1198.1296.3897.6796.5896.18
97.595.0102.4100100100100100100
Table 3. Percentage variation in corrected air mass flow ( M a f . c o ) and corrected fuel flow ( F f . c o ) with corrected engine speed ( N c o ).
TV2AI-20ViperTV2AI-20ViperTV2AI-20Viper
N c o [%] M a f . c o [%] F f . c o [%]
64.1-50.626.14-29.1924.63-16.29
83.359.361.453.8843.6539.4941.6233.8523.31
85.564.871.559.8551.7951.9844.9538.6129.98
88.372.576.968.6964.1159.0554.9247.1635.1
90.576.081.576.1170.1465.3768.7552.2844.66
92.579.387.183.8272.1675.3172.9751.9949.0
94.284.092.288.4781.8583.7780.9662.2161.54
95.689.497.193.4587.0793.5889.2675.7480.0
96.993.8100.498.0897.5398.1598.8494.5292.54
97.595.0102.4100100100100100100
Table 4. Percentage variation in corrected compressor total adiabatic efficiency ( η C t . c o [%]), and turbine total adiabatic efficiency ( η T t . c o ) with corrected engine speed (N).
TV2AI-20ViperTV2AI-20ViperTV2AI-20Viper
N c o [%] η C t . c o [%] η T t . c o [%]
64.80-49.499.0-94.7096.08-61.35
84.3059.76095.4891.5996.8397.8390.0783.94
86.5065.469.995.2696.02102.00100.2791.3779.69
89.4073.175.396.7998.98104.44101.6293.0778.58
91.7076.779.798.1397.84103.78102.3795.2977.52
93.8080.08598.4498.64101.49101.7499.08109.27
95.5084.99099.3499.89103.62101.4498.04102.18
97.0090.294.899.5499.55104.23100.4398.95100.40
98.4094.89899.2699.89101.57100.2299.35100.50
99.1196.0100100100100100100100
Table 5. Percentage variation in combustor chamber total pressure loss ( σ c a t ) and burn efficiency ( η c c h ) with the corrected engine speed (N).
TV2AI-20ViperTV2AI-20ViperTV2AI-20Viper
N c o [%] σ c a t [%] η c c h [-]
64.80-49.4--101.58--96.16
84.3059.760-101.05100.21-98.9697.52
86.5065.469.9-100.6399.00-96.8798.27
89.4073.175.3-100.4298.92-98.8598.66
91.7076.779.7-100.1198.90-99.4898.99
93.8080.085-98.9598.66-98.9699.36
95.5084.990-98.9599.09-100.9499.65
97.0090.294.8-100.099.61-100.9499.88
98.4094.898-100.099.83-100.1099.96
99.1196.0100-100100-100100
Table 6. Percentage variation limits of some main engine parameters.
Engine N c o [%] T 3 t . c o [%] π C t . c o [%] M a f . c o [%] F f . c o [%]
TV264 ÷ 97.568 ÷ 10033 ÷ 10026 ÷ 10025 ÷ 100
AI-20K60 ÷ 9586 ÷ 10032 ÷ 10043 ÷ 10034 ÷ 100
Viper 63251 ÷ 102.464 ÷ 10026 ÷ 10029 ÷ 10016 ÷ 100
Table 7. Percentage variation in ratio between speed and inlet turbine temperature, and ratio between gas flow inlet rubine temperature and pressure.
TV2AI-20ViperTV2AI-20ViperTV2AI-20Viper
N [%] N / T 3 . t [%] G f × T 3 . t / p 3 . t [%]
64.1-50.679.42-61.4867.13-87.40
83.359.361.497.2267.0373.6992.9896.0896.26
85.564.871.598.5875.5884.9595.91101.7899.82
88.372.576.999.6881.6789.8698.67101.09100.19
90.576.081.5100.2484.9193.1699.30104.26100.36
92.579.387.1100.1191.1797.2498.47103.56101.21
94.284.092.2100.3194.9099.2299.49101.82100.36
95.689.497.1100.0298.1099.6499.37106.2299.94
96.993.8100.499.9199.7099.78100.07101.1100.38
97.595.0102.4100100100100100100
Table 8. Percentage variations of ratio between compressor total specific actual work and speed square and ratio between inlet and outlet turbine temperatures.
TV2AI-20ViperTV2AI-20ViperTV2AI-20Viper
N [%] l C . t / N 2 [%] T 3 . t / T 4 . t [%]
64.1-50.670.58-113.981.12-88.34
83.359.361.482.8699.17107.988.8589.0592.40
85.564.871.585.8694.75102.0390.9090.0394.26
88.372.576.989.9094.5698.7893.7091.6595.09
90.576.081.592.9695.4598.8995.7292.2095.59
92.579.387.196.4899.68101.5397.3295.0102.30
94.284.092.297.3298.0199.3598.4396.56101.03
95.689.497.198.96100.7899.5699.2199.03100.51
96.993.8100.4100.62100.28100.2799.8899.87100.32
97.595.0102.4100100100100100100
Table 9. Percentage variations of the first similarity parameter defined as the ratio between engine speed and inlet turbine temperature radical.
TV2-117A TurboshaftAI-20K TurbopropViper 632-41 Turbojet
N % N T 3 . t [ % ] N % N T 3 . t [ % ] N % N T 3 . t [ % ]
64 ÷ 8379 ÷ 9760 ÷ 8067 ÷ 9151 ÷ 8262 ÷ 93
83 ÷ 97.597 ÷ 10084 ÷ 95.095 ÷ 10087 ÷ 102.497 ÷ 100
Table 10. Percentage variations of the second similarity parameter defined as the ratio between gas flow, inlet turbine temperature radical, and inlet turbine pressure.
TV2-117A TurboshaftAI-20K TurbopropViper 632-41 Turbojet
N % G f × T 3 . t p 3 . t [ % ] N % G f × T 3 . t p 3 . t [ % ] N % G f × T 3 . t p 3 . t [ % ]
64 ÷ 8367 ÷ 9360 ÷ 6596 ÷ 10251 ÷ 6187 ÷ 96
85 ÷ 97.595 ÷ 10065 ÷ 95.0104 ÷ 10072 ÷ 102.499 ÷ 101
Table 11. Percentage variations of the third similarity parameter defined as the ratio between compressor total specific actual work and speed square.
TV2-117A TurboshaftAI-20K TurbopropViper 632-41 Turbojet
N % l C . t N 2 [ % ] N % l C . t N 2 % N % l C . t N 2 [ % ]
64 ÷ 8871 ÷ 9060 ÷ 9595 ÷ 10051 ÷ 77 114 ÷ 99
90 ÷ 97.593 ÷ 10077 ÷ 102.499 ÷ 101
Table 12. Percentage variations of the fourth similarity parameter defined as the ratio between inlet and outlet turbine temperatures.
TV2 TurboshaftAI-20 TurbopropViper 632 Turbojet
N % T 3 . t T 4 . t % N % T 3 . t T 4 . t % N % T 3 . t T 4 . t %
64 ÷ 8390 ÷ 9660 ÷ 7689 ÷ 9351 ÷ 7788 ÷ 95
85 ÷ 97.597 ÷ 10079 ÷ 95.095 ÷ 100 81 ÷ 102.496 ÷ 100
Table 13. TV3-117 MT certain main data at the takeoff regime.
P [HP]SFC [kg/HP/h] T 3 . t [°C] π C t [-]N [%]
22250.2309759.697.6
Table 14. Additional parameters and coefficients used in the calculation model.
T 0 [K] p 0 [bara] σ d a t [-] η C t [-] σ c a t [-] η c c h [-] η m G [-]
2881.013250.990.840.960.980.99
Table 15. Calculated values of the similarity parameters at the takeoff regime.
p 3 . t [bara] G f [kg/s] T 3 . t [K] T 4 . t [K] N T 3 . t [-] G f × T 3 . t p 3 . t [-] l C . t N 2 [-] T 3 . t T 4 . t [-]
9.6307.79412488030.02829.478325.81.553
Table 16. The calculated values of the TV3-117 MT parameters at each regime.
Engine RegimesNG [%]Maf [kg/s] π C t [-]Ff [kg/s]T3t [°K]P [HP]ηte [-]
Takeoff97.67.6529.60.142124822250.2687
Takeoff (L)96.17.3919.1210.130121019720.260
Nominal94.77.0438.5570.118117517220.250
Cruise 193.56.8548.2170.110114515390.240
Cruise 291.56.4537.5620.096109712190.217
Idle73.02.7333.3370.0388622520.1145
Table 17. Percentage values ( Δ p r m c ) of TV3-117 MT calculated main data.
Engine RegimesNG [%]ΔMa [%] Δ π C c [%]ΔFf [%]ΔT3t [°%]ΔP [%]Δηte [%]
Takeoff97.6100100100100100100
Takeoff (L)96.196.5995.0191.5596.9688.6396.76
Nominal94.792.0489.1483.1094.1577.3993.04
Cruise 193.589.5785.5977.4691.7569.1789.32
Cruise 291.584.3378.7767.6187.9054.7980.76
Idle73.035.7234.7626.7669.0711.3342.61
Table 18. Percentage values of data from the engine manual.
Engine RegimesNG [%]NTP [%]ΔP [%]ΔT3t [%]ΔFf [%]Δηte [%]
Takeoff97.698100.0100.0100100.0
Takeoff (L)96.19887.695.991.495.8
Nominal94.710076.492.383.092.0
Cruise 193.510067.489.279.185.2
Cruise 291.510053.985.168.079.3
Idle73.0429.071.832.227.9
Table 19. Percentage differences ( d p r m ) between the calculated data and manual data.
Engine RegimesNG [%]dP [%]dFf [%]dT3t [%]dηte [%]
Takeoff97.60.00.00.00.0
Takeoff (L)96.1−0.99−0.11−1.06−0.93
Nominal94.7−0.99−0.06−1.84−1.05
Cruise 193.5−1.751.67−2.52−4.14
Cruise 291.5−0.850.39−2.77−1.45
Idle73.0/+6−2.345.482.72−14.74
Disclaimer/Publisher’s Note: The statements, opinions and data contained in all publications are solely those of the individual author(s) and contributor(s) and not of MDPI and/or the editor(s). MDPI and/or the editor(s) disclaim responsibility for any injury to people or property resulting from any ideas, methods, instructions or products referred to in the content.

