Article

Modeling of Traffic Information and Services for the Traffic Control Center in Autonomous Vehicle-Mixed Traffic Situations

1
Department of Industrial Engineering, Sungkyunkwan University, Suwon 16419, Republic of Korea
2
Advanced Institute of Convergence Technology, Suwon 16229, Republic of Korea
*
Author to whom correspondence should be addressed.
Appl. Sci. 2023, 13(19), 10719; https://doi.org/10.3390/app131910719
Submission received: 31 August 2023 / Revised: 15 September 2023 / Accepted: 23 September 2023 / Published: 26 September 2023
(This article belongs to the Special Issue Future Transportation)

Abstract

:
Achieving fully autonomous driving requires seamless collaboration between advanced autonomous driving and road infrastructure technologies. As the proportion of autonomous vehicles (AVs) increases, challenges may arise from their insufficient knowledge of the behavior of traffic objects and inability to effectively drive short distances. Therefore, traffic control centers that can proactively control these issues in real time are essential. In this study, first, the terminology is defined and the types of AV-mixed Traffic Information that a traffic control center needs to efficiently collect, store, and analyze to accommodate the coexistence of AVs and conventional vehicles are identified. Second, a generic notation for an AV-mixed Traffic Information model is defined and the results of modeling each AV-mixed Traffic Information type are presented. Third, an AV-mixed Traffic Information services model that included the names, operations, input/output messages, and relationships of all services is suggested. Finally, the importance of the service functionalities is evaluated through a survey. This study will serve as an initial guideline for the design, construction, and operation of traffic control centers and will help proactively address issues that may arise from the interaction between AVs and conventional vehicles on the road. Moreover, it contributes to identifying the types of traffic information and services that traffic control centers must provide in the era of AV-mixed traffic and suggests future directions for analysis and utilization of traffic information.

1. Introduction

Autonomous driving enables a vehicle to operate without the need for human driver intervention [1], by relying on sensors (e.g., camera and light detection and ranging (LiDAR)) to perceive the surrounding driving environment, assess potential risks, and plan the most efficient route. The Society of Automotive Engineers (SAE) proposed six levels of autonomous driving, ranging from Level 0 (no automation) to Level 5 (full automation), to describe the capabilities of vehicles on the road [2]. These levels are determined based on four criteria: (1) the responsibility for primary control, (2) responsibility for monitoring the driving environment, (3) responsibility for fallback to a safe state, and (4) driving mode. According to these criteria, current prevailing autonomous driving technologies in the market typically fall between Level 2 (partial automation) and Level 3 (conditional automation) [3], which can be realized through technologies related to the autonomous vehicle itself (i.e., standalone autonomous driving) [4].
One of the ways to achieve Level 4 (high automation) and Level 5 (full automation) is cooperative autonomous driving [5], which consists of advanced infrastructure and communication technology. The advanced infrastructure, named intelligent transportation systems (ITS), consists of several components such as road traffic safety facilities [6], vehicle detection systems (VDS) [7], roadside units (RSU) [8], local dynamic map (LDM) systems [9], and traffic control centers [10]. The communication technology, called vehicle-to-everything (V2X) communication, can be realized via ultra-low latency communication speeds with other vehicles and infrastructure over wired and wireless networks. Additionally, cybersecurity must be ensured, including the blocking of eavesdropping, prevention of message forgery, blocking of malicious control message transmission, and protection against unauthorized information acquisition [11].
Currently, countries, automakers, and other stakeholders are working toward advancing autonomous driving technology from a policy, technology, and standards perspective.
At the national policy level, the United States (U.S.) [12] has provided direction on a wide range of areas, including advanced manufacturing, artificial intelligence, related infrastructure, regulations, taxation, intellectual property rights, and the environment required to promote AV technology through “Automated Vehicle 4.0.” China [13] has designated six regions, including Beijing, Shanghai, and Guangzhou, as pilot cities for the development of connected cars and smart city processes, and is actively developing the relevant technologies. Europe [14] has prepared a joint roadmap, “Automated Driving Roadmap”, centered on the European Road Transport Research Advisory Council, proposing fully autonomous driving by 2030. South Korea [15] is investing private and public funds to lead the autonomous driving market by 2030 through Korea’s national strategy for autonomous vehicles.
In addition, technologies that focus on different strategies for traditional and new automakers are being developed. To gain the competitive advantage of autonomous driving technology, existing automakers are acquiring startups or establishing joint ventures and collaborating to conduct autonomous driving research with ventures. For example, Volkswagen and Ford [16] acquired the autonomous driving platform company “Argo AI” and established a joint venture as part of a strategic alliance to jointly develop autonomous driving technology. Hyundai Motors [17] has expanded its business into the mobility service sector through a joint venture named “Motional”, established with the U.S. autonomous driving specialist company “Aptive.” Motional [18] is currently conducting a pilot operation of its vehicle-hailing service termed “RoboRide.” Tesla [19], a representative example of a new automobile manufacturer, can mass-produce AV based on electric vehicles and is considered to be the closest to commercialization with its self-developed artificial intelligence semiconductor chips and camera-centric object recognition method.
Meanwhile, the International Organization for Standardization (ISO) and the SAE have established industry standards for vehicles, roads, and V2X messages, respectively. For instance, the ISO has set up several Technical Committees (TC), such as ISO/TC 22 for road vehicle standards, ISO/TC 204 [20] for intelligent transport systems standards, and ISO 14296 [21] for the LDM standard. Moreover, SAE has defined the J2735 standard message to support V2X communication. The J2735 is considered a de-facto standard, and many countries are referencing it to proceed with the standardization of V2X data [22].
As a result of these efforts, the interaction between AVs and conventional vehicles on the road is inevitable in the future, which is likely to result in various challenges [23,24]. For instance, safety issues may arise since AVs have a lack of responsiveness to unexpected situations and inadequate knowledge of the behavior of other road users such as cars, pedestrians, and motorcycles. Additionally, efficiency issues related to road utilization may arise because of the inability of AVs to effectively drive short distances. The role of traffic control centers is crucial in promptly identifying these challenges and addressing them by delivering information to AVs, actively responding to and managing the situation, and optimizing traffic flow. Currently, most existing traffic information centers collect traffic information (such as traffic conditions and incidents) on specific links and provide it to navigators, broadcasters, and others in a one-way manner every 5 min [25,26]. In the future, these conventional traffic information centers will need to expand their functions and roles to become integrated monitoring and traffic control centers for both AVs and conventional vehicles. These centers would collect and provide real-time micro-traffic information at the lane level, enable real-time traffic control, and facilitate optimal traffic flow.
This study proposed a traffic information model that should be managed by the traffic control center and a software service model to provide traffic information for problem-solving and preemptive response in roads mixed with AVs and conventional vehicles. By employing the results of our research, one can model various kinds of objects in traffic sites (e.g., autonomous vehicles and traffic signals) and utilize the result of modeling to ensure the safety of objects. The results can also be the standard for communication between related parties operating the integrated traffic control centers, so that the cost occurred from misunderstanding each other can be reduced.
The remainder of this paper is organized as follows. Section 2 reviews related works. In Section 3, types of future traffic information are identified and defined by expanding the conventional traffic information utilized in Korea. Then, a notation for expressing each proposed traffic information type is proposed as a logical model and the logical modeling results for each traffic information type are described. In Section 4, a future traffic information service model is proposed, which described the names, operations, input/output messages, and relationships between services that provide traffic information. Then, the importance of each service is evaluated through a survey. Finally, the conclusions and possible avenues for future research are presented in Section 5.

2. Related Works

2.1. Traffic Information Center

The traffic information center is an institution that exists on a national or local basis and serves as a hub for linking, integrating, analyzing, and providing traffic information collected from various traffic sites [6,27]. Its primary functions include real-time monitoring of traffic conditions, signal control, traffic management, provision of traffic information, operation of bus management systems, and operation of unmanned enforcement systems. Additionally, many countries operate traffic monitoring/control centers worldwide to enhance road utilization efficiency, improve road traffic safety, enhance convenience for public transportation users, and promote orderly traffic flow [28,29].
In New York, U.S., the New York City Traffic Management Center [25] actively monitors and manages traffic conditions across New York City by utilizing incident information provided by police agencies, road safety equipment (RSE), Closed-circuit Television (CCTV), and VDS. Additionally, the center optimizes signals to minimize traffic congestion. Moreover, it provides real-time traffic information, traffic incident/regulation updates, CCTV location, and video information, as well as public transportation route/route information through 511NY, a traffic information platform.
The Berlin Traffic Information Center [26] in Berlin, Germany, collects traffic information through RSE and CCTV on 1360 km of major roads and uses it to monitor real-time traffic conditions or provide traffic information to drivers and users.
The Japan Road Traffic Information Center (JARTIC) [30] in Japan provides real-time traffic conditions by collecting and integrating road traffic information across Japan. Traffic information provided by the JARTIC includes real-time traffic flow, real-time accident and construction section, disaster, and traffic statistics information.
South Korea has the National Transport Information Center (NTIC) [31] operated by the MOLIT and Urban Traffic Information Center (UTIC) [32] operated by the National Police Agency. The NTIC integrates and provides nationwide traffic information in connection with the Korea Expressway Corporation and Private Expressway Traffic Information Center. Traffic information provided by the NTIC includes traffic flow, traffic incidents, CCTV, vehicle detection, dangerous section, and standard node-link information. In addition, the UTIC has established local transportation centers in major cities across South Korea to integrate traffic information collected through on-board equipment installed in taxis and patrol cars, RSE installed on roads, and highway/national road traffic flow/incident information received from NTIC. Traffic information provided by the UTIC includes traffic flow, traffic incidents, CCTV video, traffic safety, and protected area information.

2.2. Modeling of Traffic Information

Modeling refers to the process of creating a concise representation or abstraction of a complex system, phenomenon, or object in order to understand its behavior. Numerous objects (e.g., vehicles) existing in various traffic environments (e.g., road networks) generate a considerable amount of traffic data/information. By employing data/information modeling methods, traffic data/information are represented concisely so that users concerned with traffic sites can communicate with each other. Generally, conventional studies have primarily focused on traffic object modeling.
Several studies have proposed traffic data/information models that can represent objects moving in road networks. Brakatsoulas et al. [33] suggested a semantic model to represent trajectories using the background geographic information and an algorithm to map vehicle positions onto a road network. Thus, trajectories were spatially modeled as networks comprising edges and nodes. Mouza and Rigaux [34] designed a model that adopts a discrete view of the underlying space for moving objects. They partitioned the space into zones, each of them being uniquely identified by a label. Then, locations were represented by mapping them into zones. Güting et al. [35] proposed a route-oriented model for moving objects in networks. In this technique, a road network is represented by using routes and junctions. Then, the represented road network, where a road’s geometrical property is described by a line, integrates trajectories. Similar studies have been presented in the literature [36,37].
A traffic data/information model that focused on the objects moving in various environments (e.g., indoor and free space) has also been proposed. Jensen et al. [38] introduced a graph-based model employing radio frequency identification (RFID) for indoor tracking of moving objects. In this model, indoor space is separated into cells corresponding to graph vertices and movement of objects in cells is detected by RFID readers and is represented as edges in the graph. Notably, a trajectory consists of a sequence of RFID records, and a method for constructing and refining trajectories is developed. In a similar vein, the modeling structure for moving objects in a symbolic indoor space has been proposed in the literature [39]. The proposed model consists of records in a trajectory-based format (i.e., oid, symbolicID, and t), where oid represents the id of a moving object, symbolicID indicates a specific indoor space region, and t implies time. Xu and Güting [40] proposed a data model that can generally deal with the movement of objects in comprehensive traffic environments. In this model, generic moving objects, space, and infrastructure components are represented with the incorporation of precise/succinct transportation modes, such as cars, walks, and buses.
Although these studies have contributed to the concise and effective modeling of various objects existing in traffic sites, these studies have only considered the information related to moving objects. As aforementioned, various challenges are expected because of the mixing of AVs and conventional vehicles. To facilitate the safety of vehicles and pedestrians, traffic control centers should collect and provide real-time and microscopic traffic information from moving objects (e.g., autonomous vehicles) and unmovable objects (e.g., traffic flow detectors and traffic lights) altogether. Thus, a data/information model that can represent various kinds of objects and attributes determined by the specific object, time and location should be designed that can be used by traffic control centers to ensure the safety of traffic sites. Table 1 presents a comparative overview of the proposed model with conventional models.

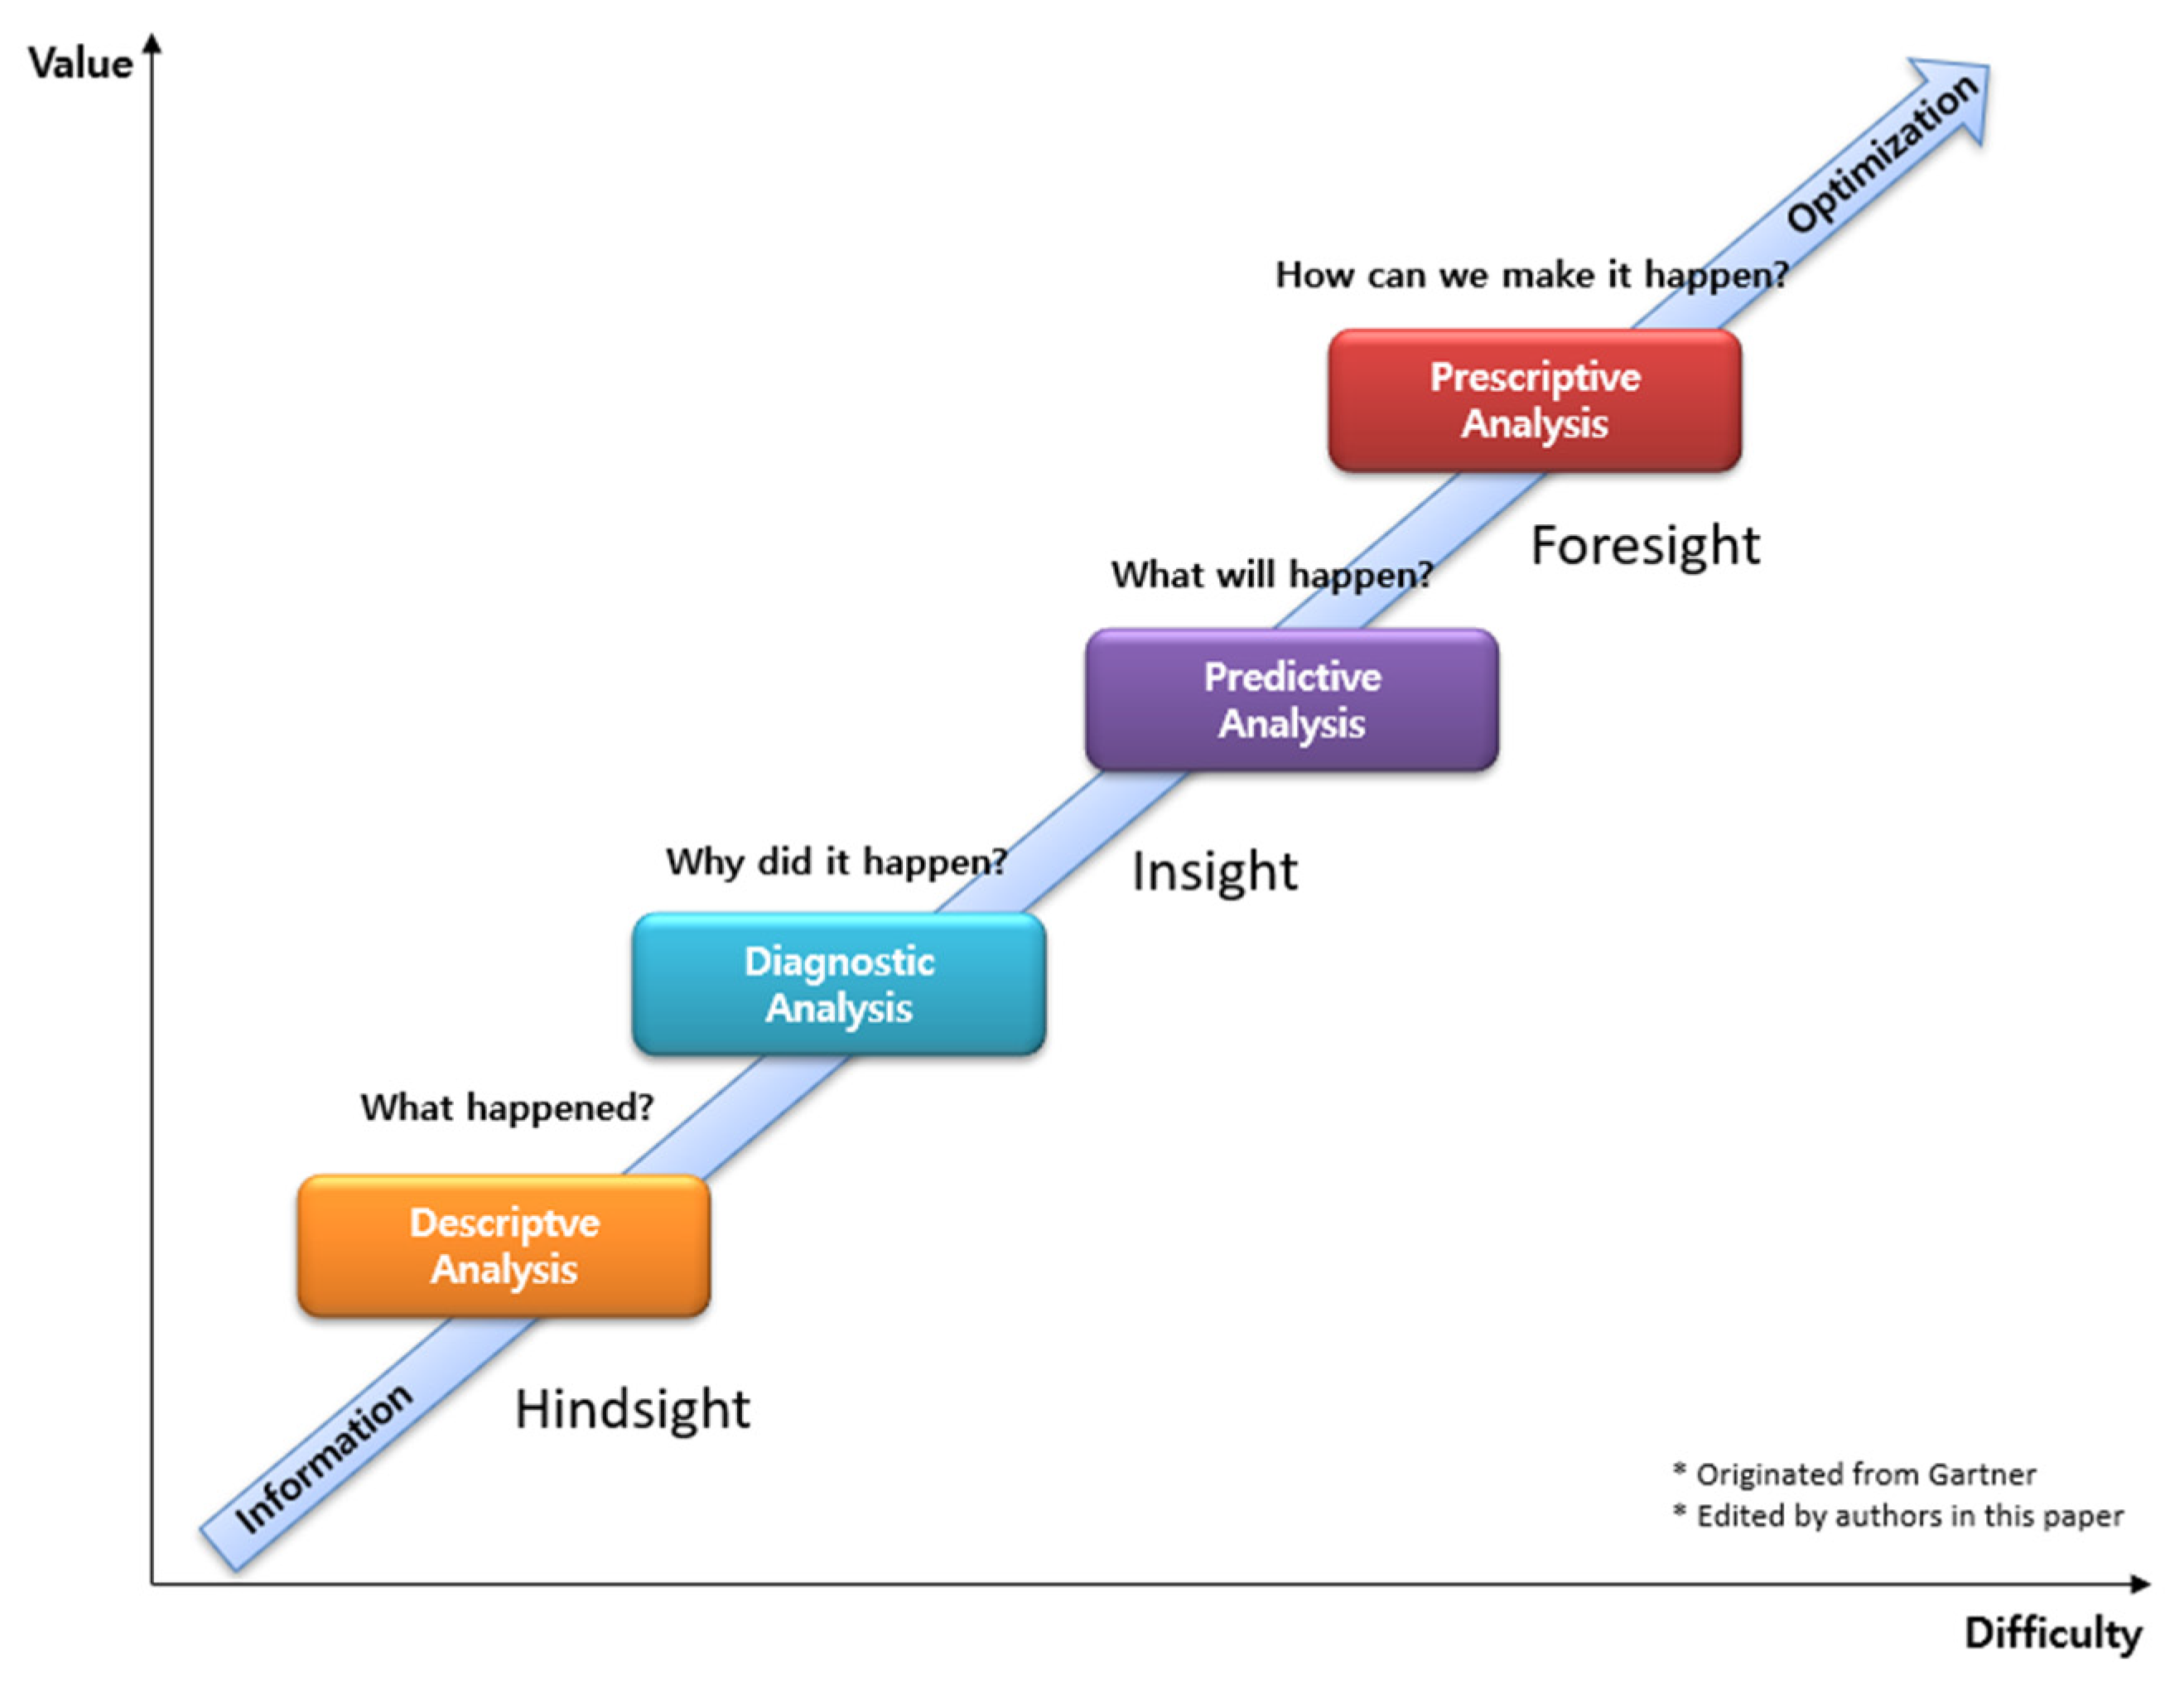
2.3. Gartner’s Analytic Ascendancy Model

As shown in Figure 1, the analytic ascendancy model [41], proposed by Gartner, classifies the types of analysis depending on the degree of analysis challenges and values into four types: descriptive, diagnostic, predictive, and prescriptive analysis. Descriptive analysis describes facts that have occurred in the past or present based on various criteria. Diagnostic analysis determines the cause of a specific problem. Predictive analysis predicts the future or grasps the possibility of unknown results. Prescriptive analysis suggests alternatives for predicted situations. Various studies have been conducted using analytic ascendancy models to classify analysis systems or analysis services in the fields of manufacturing, architecture, and education.
Groggert et al. [42] introduced the results of a survey on the data analysis status of manufacturers located in Switzerland and Germany. A survey of 100 manufacturing companies was conducted with questions such as the progress status of data collection and processing and the impact of data analysis results. Then, the analysis level of each manufacturer was classified using Gartner’s analysis ascendancy model in the process of analyzing the survey results. The survey showed that 41, 40, 15, and 4 companies perform data analysis of the descriptive/diagnostic/predictive/prescriptive analysis level, respectively. Motlagh et al. [43] proposed a general reference model, consisting of physical, sensing, networking, and computing technology, to address the limitation of the conventional Internet of Things analysis platform that manages smart space. The proposed model was built using digital twin technology. Then, four twins were constructed by employing the concept of analytics ascendancy models. The four twins provided statistics of sensors, correlation between sensors, prediction of room occupancy or sensors, and solutions for the most efficient smart space management. Further, the four twins were tested by applying it to TellUs at Oulu University in Finland. The results showed that they contributed to the improvement of smart space quality by presenting additional analysis methods than existing IoT platforms. Uskov et al. [44] proposed a smart learning analysis system used by the faculty and students in the computer science/information system department curriculum at Bradley University in the U.S. The proposed system has an analytical engine that is based on existing student data for efficient science-technology-engineering-mathematics training. By applying the analytics ascendancy model, the engine is classified into four categories: Descriptive, diagnostic, predictive, and prescriptive analytics. Each analytics provides statistical methods, search and sorting algorithms, statistical models, machine learning algorithms, and simulation and optimization algorithms. A survey of 61 undergraduate and 42 graduate students was conducted on the effectiveness of the proposed system. The result showed that 41% of undergraduate and 61% of graduate students responded that the proposed system was highly effective in learning subjects of the curriculum.

3. Modeling of AV-Mixed Traffic Information

In this section, the AV-mixed Traffic Information is defined by referring to the Fundamental Traffic Information defined by MOLIT to model the AV-mixed Traffic Information. Then, a traffic information notation that can represent attributes constituting the defined traffic information is described. Finally, the results of the AV-mixed Traffic Information modeling are presented.

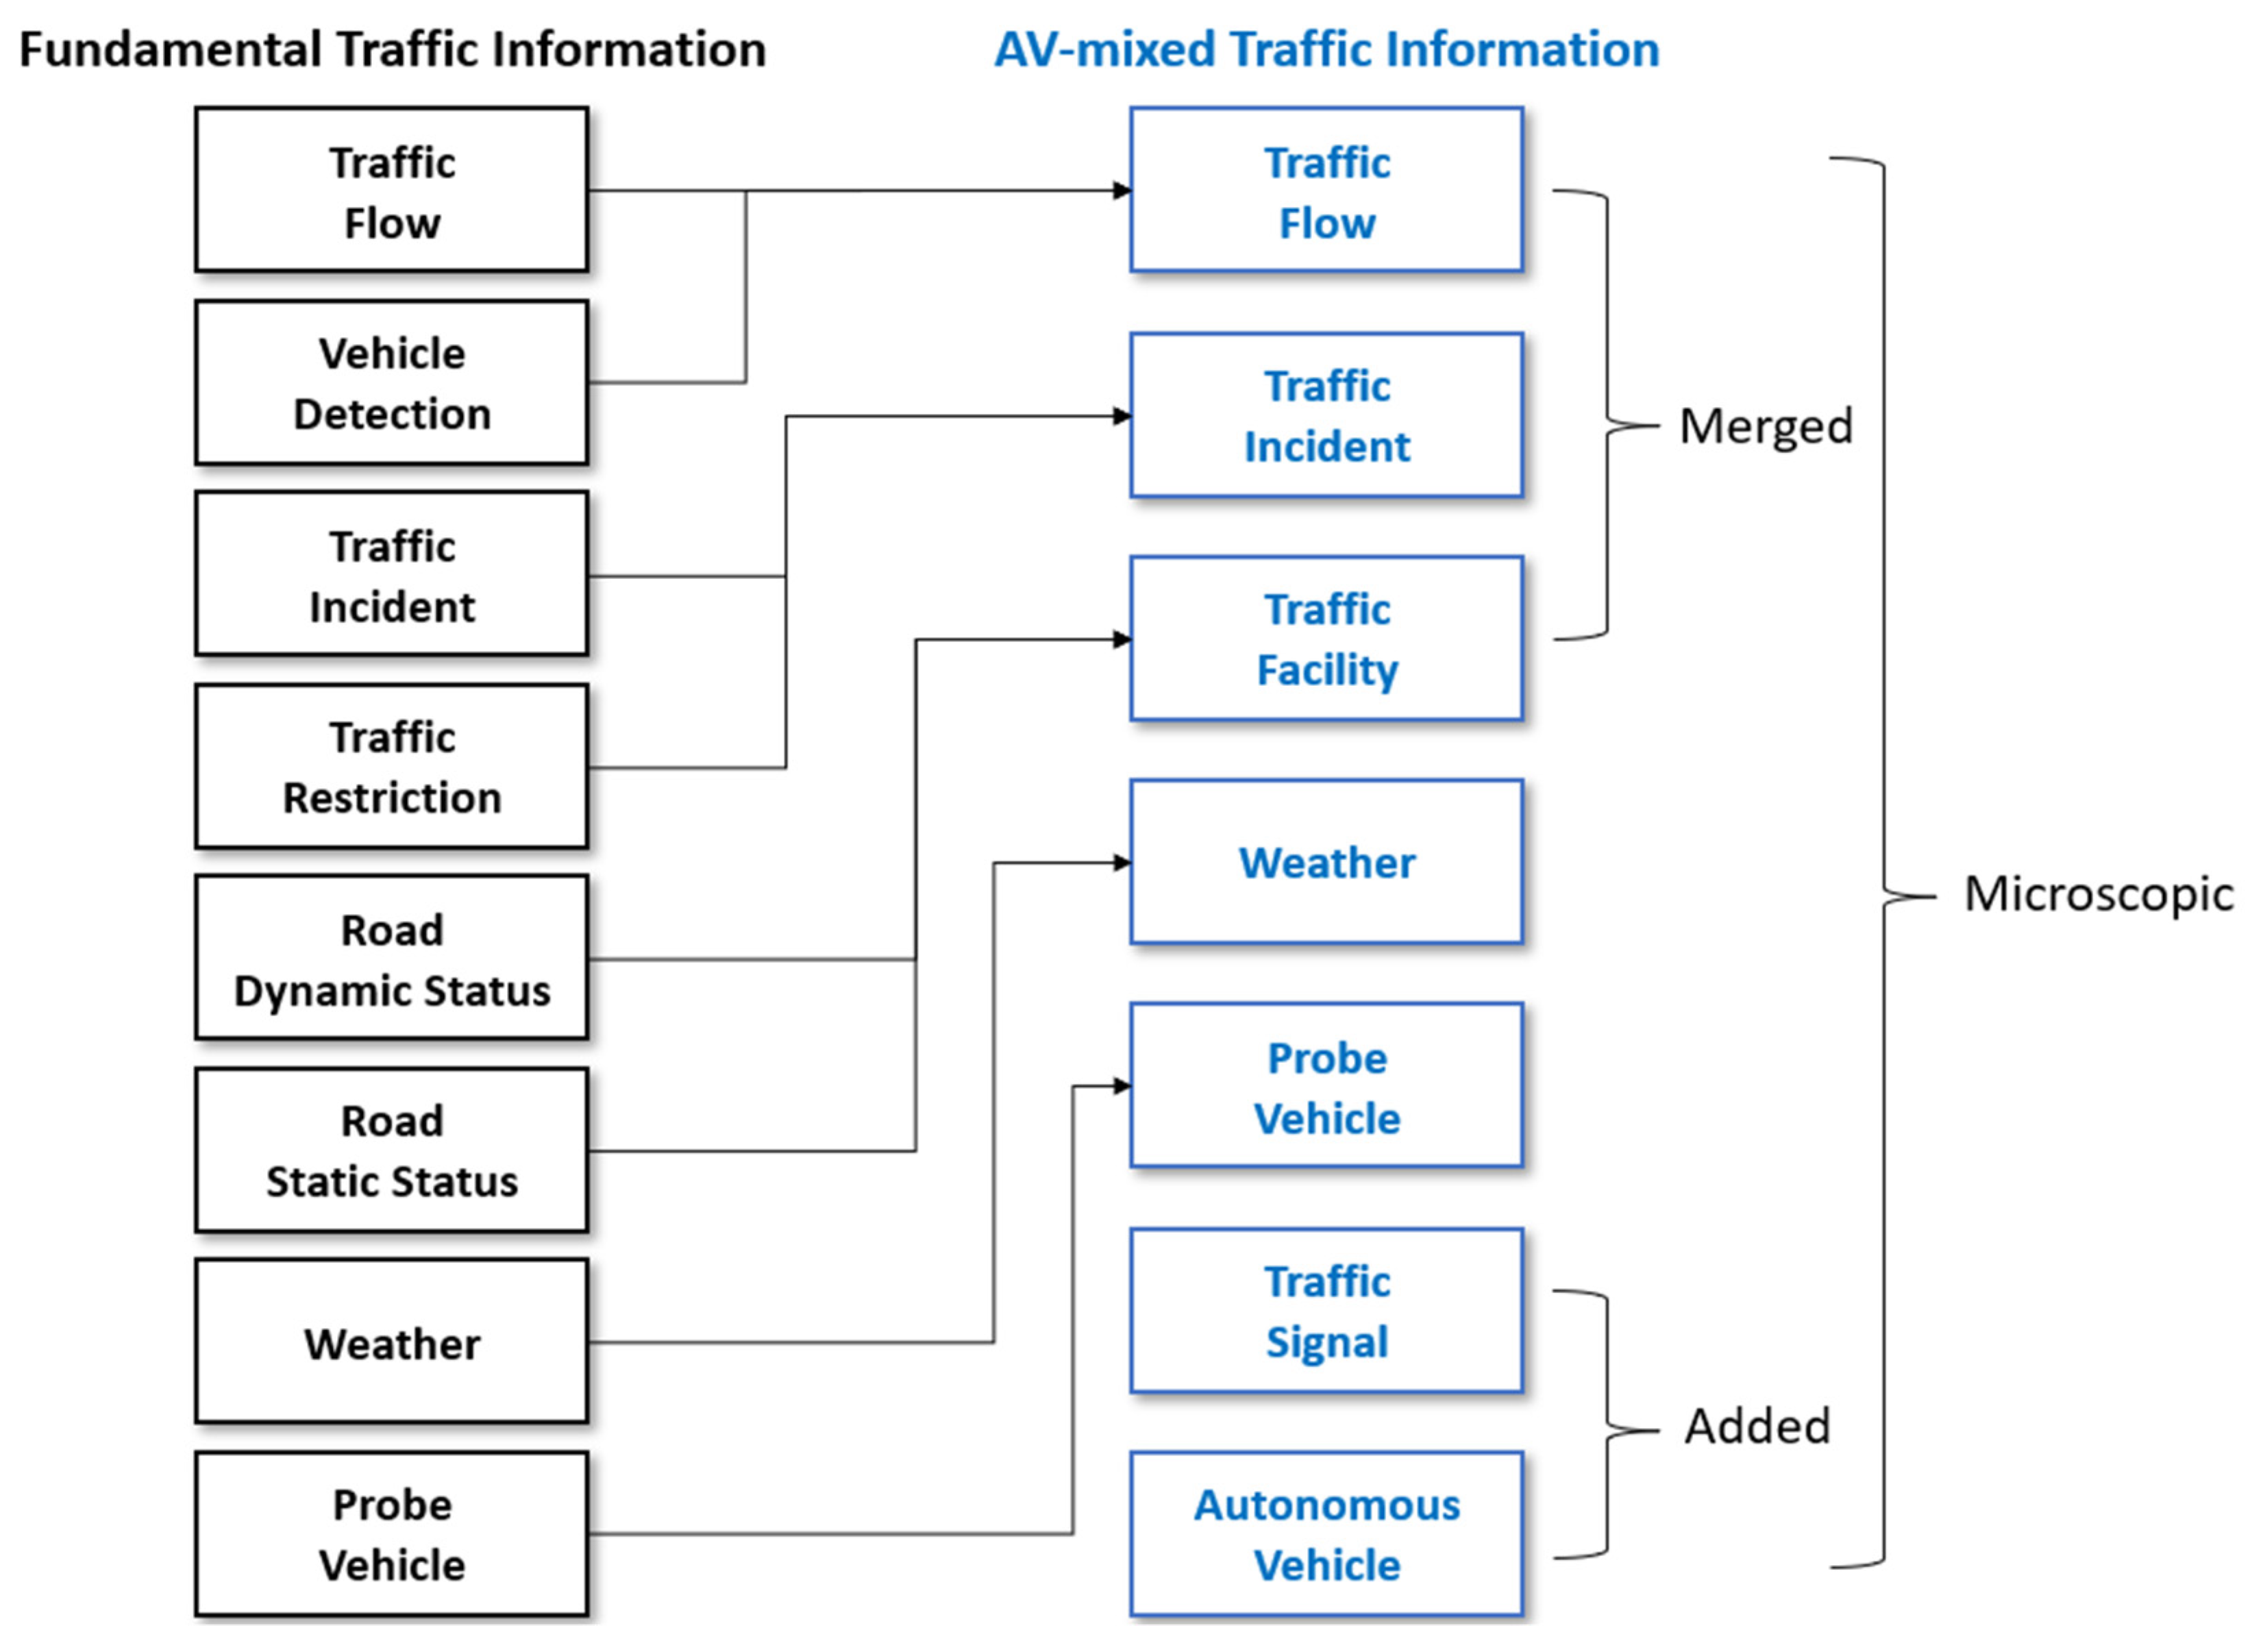
3.1. Definition of AV-Mixed Traffic Information

Before defining the AV-mixed Traffic Information, first, the Fundamental Traffic Information presented by MOLIT of Korea is elaborated. The Fundamental Traffic Information is the information promulgated by MOLIT Announcement No. 2016-206 for exchanging the basic traffic information required to build and operate ITS for traffic facilities, such as expressways and national highways. The Fundamental Traffic Information consists of the following types: (1) Traffic Flow, (2) Vehicle Detection, (3) Traffic Incident, (4) Traffic Restriction, (5) Road Dynamic Status, (6) Road Static Status, (7) Weather, and (8) Probe Vehicle.
The AV-mixed Traffic Information is defined by spatially subdividing traffic information provided by conventional traffic information centers. It includes the concept and types of the Fundamental Traffic Information defined by MOLIT and traffic object information that needs to be provided by traffic control centers of the future.
Definition. 
AV-mixed Traffic Information
AV-mixed Traffic Information refers to
the Primitive Traffic Information of traffic control centers of the future,
derived by spatially subdividing the Fundamental Traffic Information
and adding the dynamic information of traffic objects.
Spatially subdividing involves going beyond the traffic information provided by conventional traffic information centers in units of node-link and providing detailed traffic information in units of lane/cell and/or longitude/latitude. The dynamic information of traffic objects refers to the states (e.g., location, signal, and facility status) of traffic objects (e.g., vehicles, pedestrians, and road infrastructure) that change with time. As shown in Figure 1, the AV-mixed Traffic Information defined in this study consists of the following types: (1) Traffic Flow, (2) Traffic Incident, (3) Traffic Facility, (4) Weather, (5) Probe Vehicle, (6) Traffic Signal, and (7) Autonomous Vehicle.
The AV-mixed Traffic Information types defined in Figure 2 show prominent features. First, conventional Traffic Flow and Vehicle Detection types, Traffic Incident and Traffic Restriction types, and Road Dynamic Status and Road Static Status types have the same source that provides information. Therefore, they have been merged into Traffic Flow, Traffic Incident, and Traffic Facility types, respectively, in the AV-mixed Traffic Information. Second, the Traffic Signal and Autonomous Vehicle types, which did not exist previously, have been added. Finally, the spatial unit of all AV-mixed Traffic Information types is lane/cell and/or longitude/latitude. Consequently, the AV-mixed Traffic Information types have microscopic features.
Figure 3 visualizes the proposed AV-mixed Traffic Information. It consists of primitive types exhibiting different heterogeneous features and comprises tensor-like multi-dimensional traffic information using time, space, and type as each axis. In addition, the AV-mixed Traffic Information not only uses individual types but also combines individual types and identifies correlations between types to reproduce analytical information (projected onto a sphere) through high-order analyses such as statistics, diagnosis, and prediction.

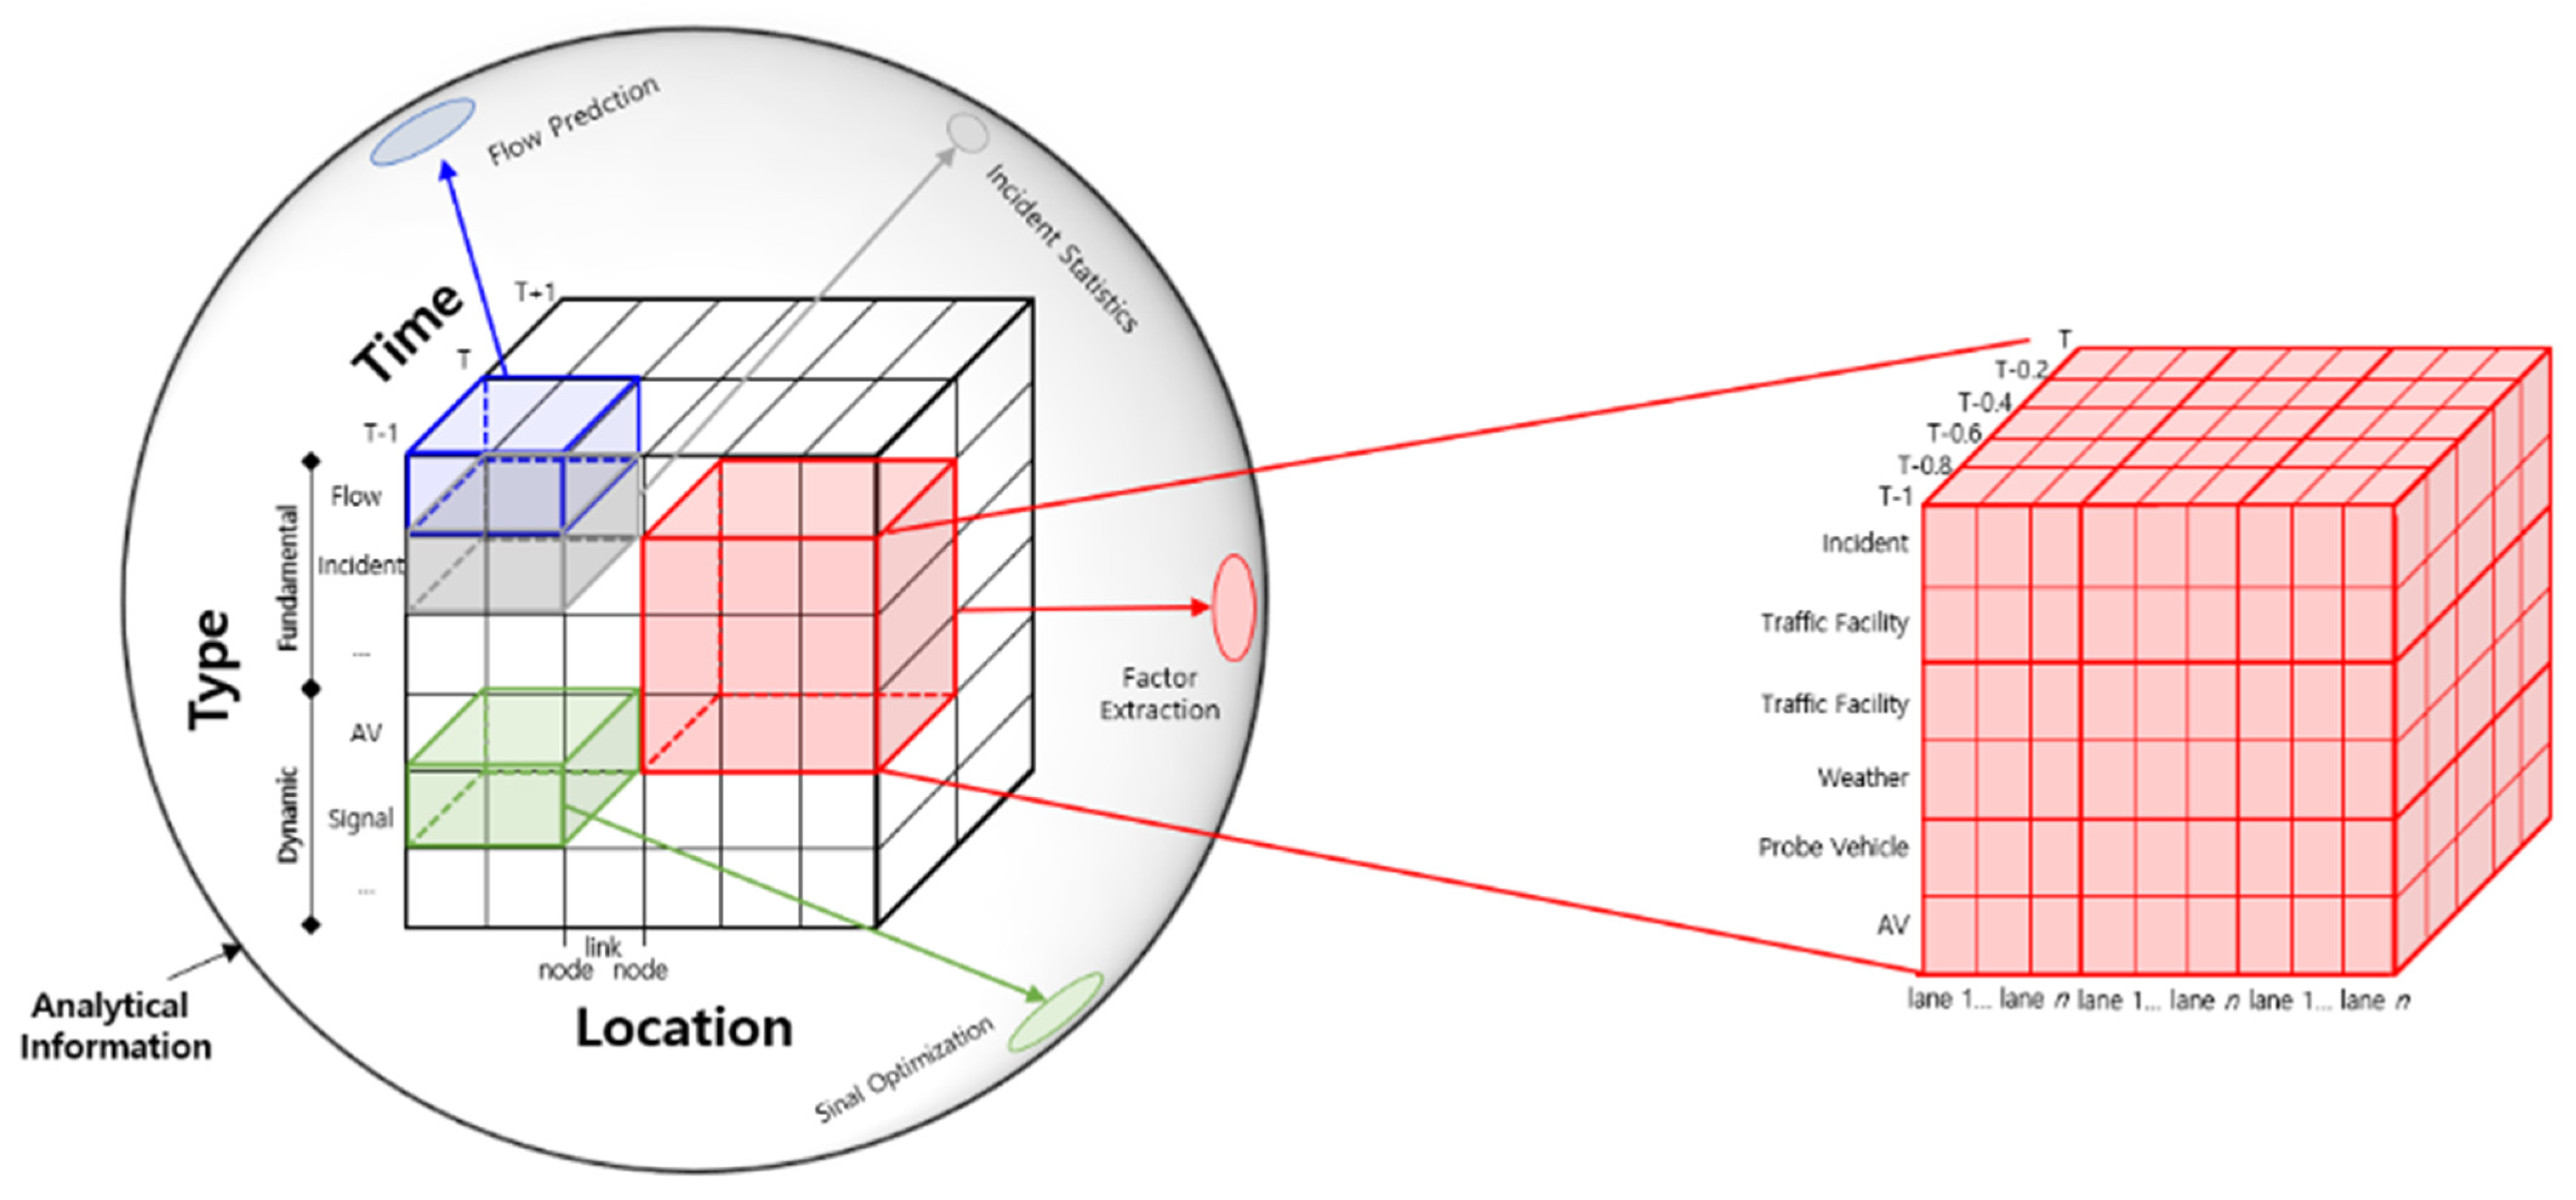
3.2. Notation for AV-Mixed Traffic Information

To express the defined AV-mixed Traffic Information as a logical model, the concept of trajectory, which is a sequence of chronologically ordered points generated by moving objects, is applied. It can contain various types of information, including the location, direction, and speed of moving objects [45]. Therefore, a trajectory can be described as T r = { p 1 , p 2 , , , p n |   p = ( m o , t , l , a ) } ; m o is the moving object, t is the timestamp of the point; l is the location (longitude, latitude) of the moving object; a is a list of additional information for moving objects. In the future, information related to moving objects (e.g., AVs and conventional vehicles), immovable objects (e.g., traffic flow detectors and traffic lights), and non-physical objects, such as the traffic control center controlling the moving and immovable objects, will be provided for roads where AVs and conventional vehicles interact. Therefore, in this study, the notation of a trajectory is used and extended in a broad sense to express the AV-mixed Traffic Information types as logical models. Types of the AV-mixed Traffic Information presented in this study are expressed using the following notation.
Notation. 
AV-mixed Traffic Information Type ( T r I n f o T y p e )
T r I n f o T y p e = { O , T , L , C }
where,
  • O : o b j e c t ,   O = { o b j I D , o b j A t t r }
  • T :   t i m e ,   T { c r t T i m e , r e c T i m e , s t r t T i m e , e n d T i m e }
  • · c r t T i m e : t i m e   t h a t   i n f o r m a t i o n   w a s   c r e a t e d
  • · r e c T i m e : t i m e   t h a t   i n f o r m a t i o n   w a s   r e c o r d e d
  • · s t r t T i m e :   t i m e   t h a t   e v e n t   w a s   s t a r t e d
  • · e n d T i m e :   t i m e   t h a t   e v e n t   w a s   e n d e d
  • L : l o c a t i o n ,   L { l i n k , λ ( l i n k ) , n o d e , c o o r d }
  • · l i n k = { l i n k I D , l i n k A t t r }
  • · λ ( l i n k ) : l i n k l a n e ,   l a n e = { l a n e I D ,   p a r e n t L i n k , l a n e A t t r }
  • · n o d e = { n o d e I D , n o d e A t t r }
  • · c o o r d = { l o n g i t u d e , l a t i t u d e ,   a l t i t u d e }
  • C :   a   s e t   o f   c o n t e x t   a t t r i b u t e s   s p e c i f i e d   b y   T r I n f o T y p e ,   C = { c o n t e x t A t t r }
  • · O × T × L c o n t e x t A t t r
Since the link has one or more lanes, the notation < > is introduced, which implies the list that can conation multiple values. Note that the element list of C is determined by the type of AV-mixed Traffic Information ( T r I n f o T y p e C ), and the value(s) in each element of C ( c o n t e x t A t t r ) is specified by combining O , T , and L ( O × T × L c o n t e x t A t t r ). It is also of note that the value(s) in attributes ( o b j A t t r , l i n k A t t r , l a n e A t t r , n o d e A t t r , c o n t e x t A t t r ) can be any value, data type, length, and dimension.

3.3. Result of AV-mixed Traffic Information Modeling

The AV-mixed Traffic Information is modeled based on the predefined information and notations. Table 2 shows the result of modeling the AV-mixed Traffic Information. As mentioned above, it consists of seven types, and each type has common elements ( O , T , L ,   and   C ). Notably, individual types can have the attribute list C , and the value(s) in each attribute of C is specified by the combination of the corresponding type’s O ,   T , and L .

4. Modeling of AV-Mixed Traffic Information Services

In this section, the primitive types of the AV-mixed Traffic Information are provided. Further, these primitive types are used to derive services that provide the reproduced analytical traffic information and derive the operations of each service. Next, the notations defined in Section 3 are used to model each service and evaluate the importance of the operations through a survey.

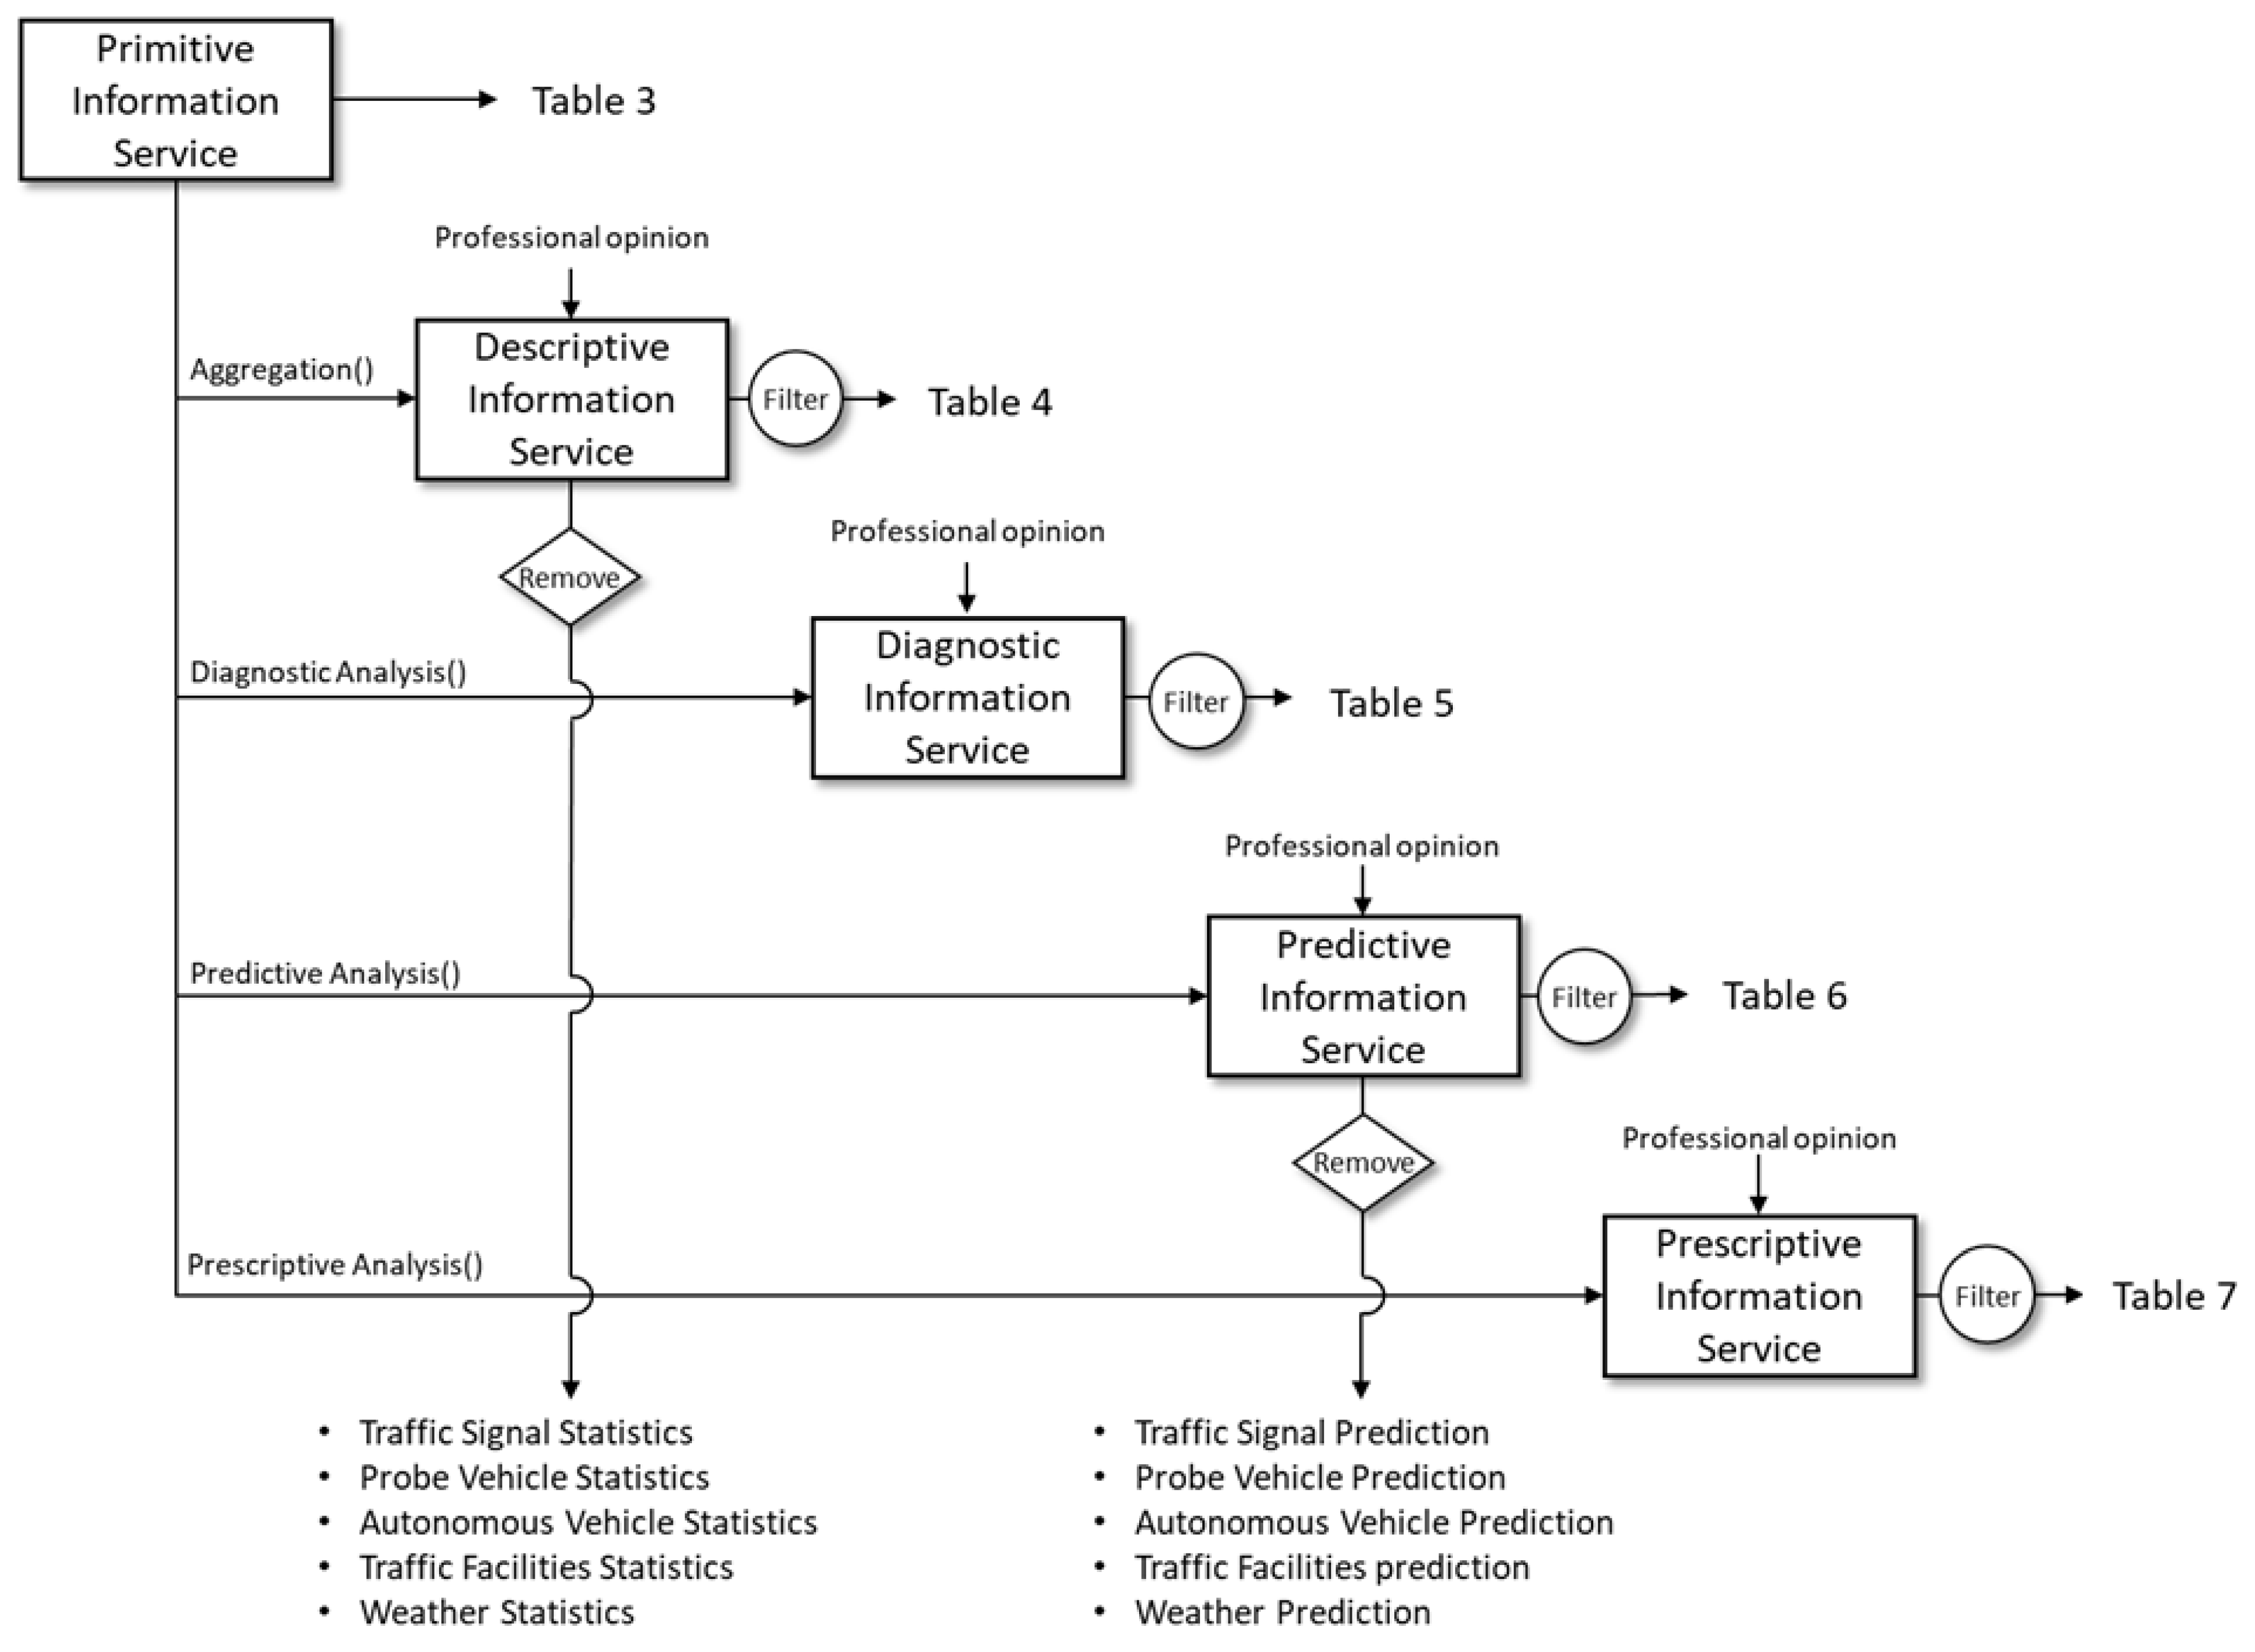
4.1. Derivation of Services

The AV-mixed Traffic Information types presented in Section 3.3 are primitive information that future traffic control centers need to provide. They can be used as the output message of each operation included in the primitive traffic information service (Table 3). Furthermore, services that provide reproduced information by processing and analyzing traffic information can be proposed. In this study, descriptive, diagnostic, predictive, and prescriptive information services are added by referring to the analytic ascendancy model, which listed the data analysis types in order of difficulty and value. The descriptive information service (Table 4) provided descriptive statistics of the AV-mixed Traffic Information that could be aggregated, whereas the diagnostic information service (Table 5) explained the causes of major incidents (e.g., traffic incidents). Moreover, the predictive information service (Table 6) provided information that could be predicted using each AV-mixed Traffic Information type. Finally, the prescriptive information service (Table 7) provided the analysis information for optimal traffic conditions using the simulation of each AV-mixed Traffic Information. Figure 4 shows the process of deriving the AV-mixed Traffic Information services and the information that each service needs to provide. This process was derived through brainstorming by a group of 10 experts comprising the providers and users of traffic information center systems and police officers. The traffic information that did not require statistical diagnosis prediction was excluded, and the analysis information for traffic indices required from a comprehensive road operation perspective was added.

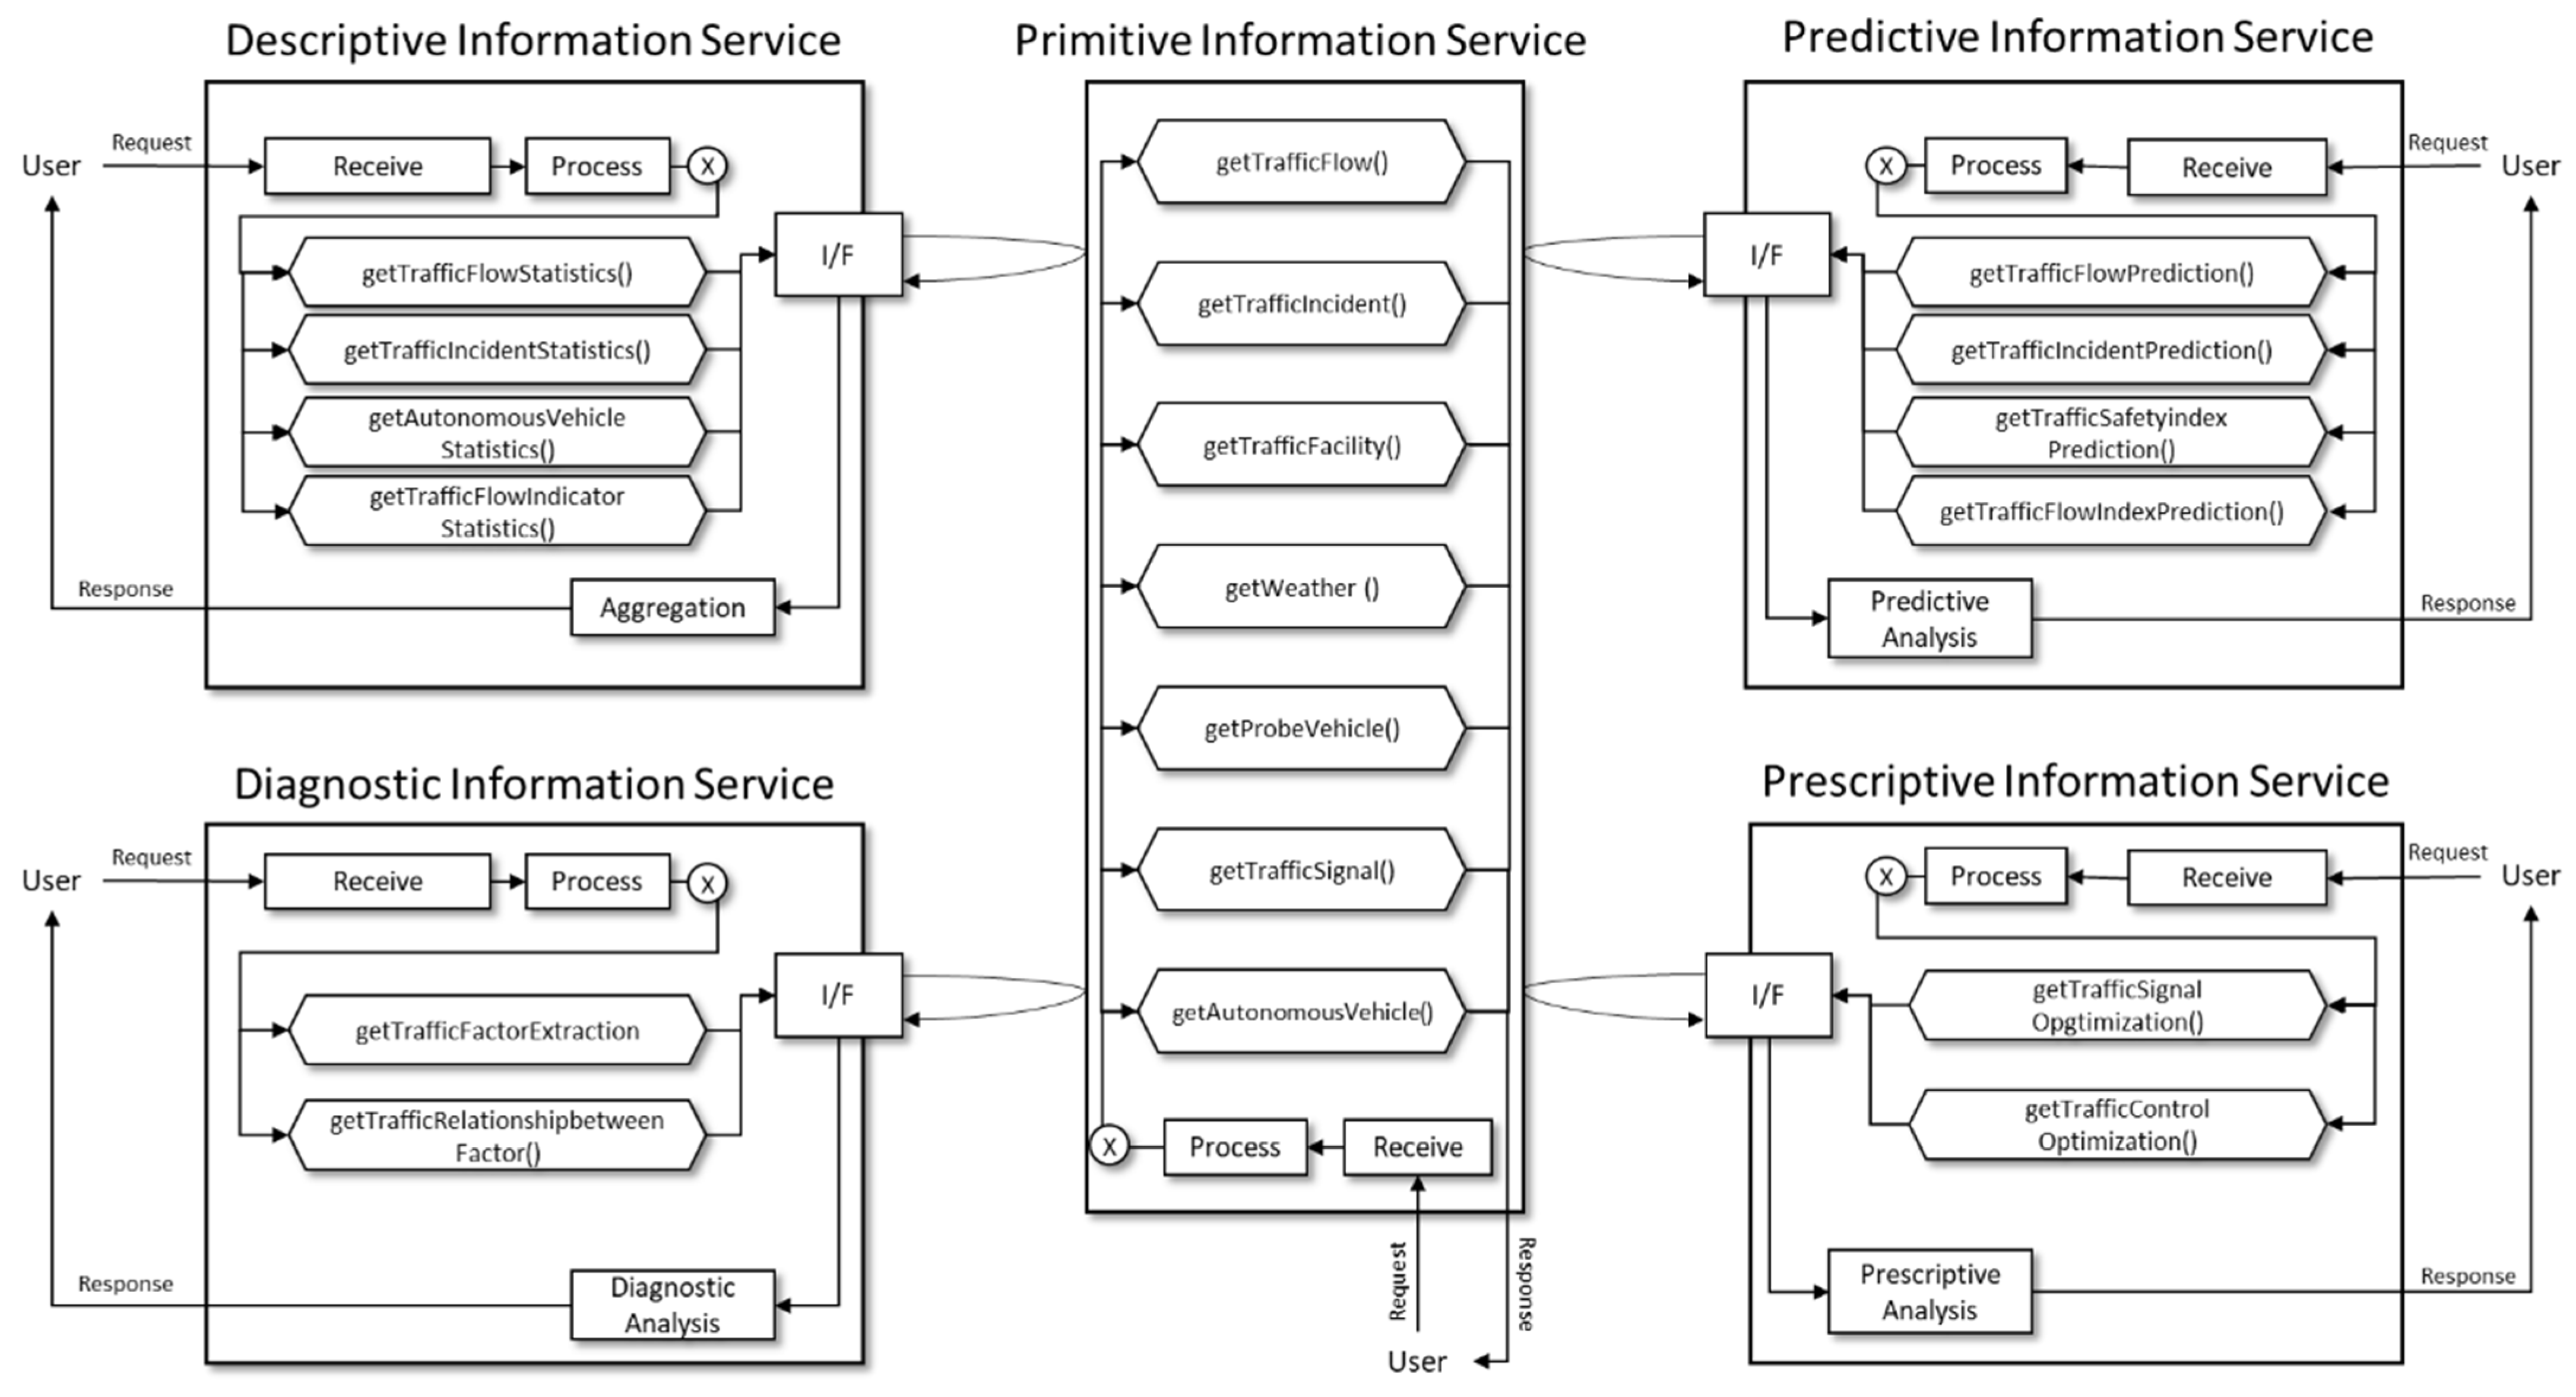
4.2. Modeling of Services

In this sub-section, traffic information services are modeled via the notation proposed in Section 3.2, including the operations’ name for each service and the input parameters/output for each operation.
As presented in Table 3, the primitive information service provides seven types of AV-mixed traffic information. The input parameters for each operation consist of time/location conditions. Time condition ( { f r o m T i m e , t o T i m e } ) refers to a time range, and location condition ( { m i n i m u m L o n g t i t u d e , m a x i m u m L o n g t i t u d e , m i n i m u m L a t i t u d e , m a x i m u m L a t i t u d e } ) refers to a location range. The output of each operation is the list of T r I n f o T y p e ( T r I n f o T y p e ).
Table 3. Specification of Primitive Information Service.
NamePrimitive Information Service
DescriptionA service consisting of operations that provide predefined
types of AV-mixed Traffic Information
OperationInputOutput
getTrafficFlow() [ { f r o m T i m e , t o T i m e } ,
{ m i n i m u m L o n g i t u d e ,  
m a x i m u m L o n g i t u d e ,
m i n i m u m L a t i t u d e ,
m a x i m u m L a t i t u d e } ]
< T r I n f o F l o w >
getTrafficIncident() < T r I n f o I n c i d e n t >
getTrafficFacility() < T r I n f o F a c i l i t y >
getWeather() < T r I n f o W e a t h e r >
getProbeVehicle() < T r I n f o P r o b e V e h i c l e >
getTrafficSignal() < T r I n f o S i g n a l >
getAutonomousVehicle() < T r I n f o A u t o V e h i c l e >
Table 4 presents the descriptive information service. It has four operations that are filtered and removed based on professional opinions, as shown in Figure 4. These operations provide the descriptive statistics (minimum, q1, median, q3, maximum, standard deviation, mean) of information type. The input parameters of each operation consist of time/location conditions. δ is a function that calculates the descriptive statistics of values in the elements of C in T r I n f o T y p e . The output of each operation is the list of descriptive statistics.
Table 4. Specification of Descriptive Information Service.
NameDescriptive Information Service
DescriptionA service providing descriptive statistics
δ :   l i n k   o r   l a n e  
d e s c r i p t i v e   s t a t s t i c s   o f   v a l u e ( s )   i n   e l e m e n t s   o f   C   i n   T r I n f o T y p e
OperationInputOutput
getTrafficFlowStatistics()[ { f r o m T i m e , t o T i m e } ,
{ m i n i m u m L o n g t i t u d e ,
m a x i m u m l o n g i t u d e ,
m i n i m u m L a t i t u d e ,
m a x i m u m L a t i t u d e } ]
{ l i n k ,   δ ( l i n k ) ,   { l a n e , δ ( l a n e ) } }
getTrafficIncidentStatistics()
getAutonomousVehicleStatistics()
getTrafficFlowIndexStatistics()
Table 5 presents the diagnostic information service. It has two operations that are filtered based on professional opinions, as shown in Figure 4. These operations provide the results of diagnostic analysis (e.g., regression and correlation analysis). The input parameters of the first operation consist of one any T r I n f o T y p e ( T r I n f o A n y ), which is the dependent variable, any multiple T r I n f o T y p e ( T r I n f o A n y ), which are the independent variables, and time/location conditions. ζ is a function that derives the multiple important T r I n f o T y p e that influence an event (e.g., traffic accidents) and the importance values. The output of this operation is the list of important factors and their importance values (< { i m p o r t a n t F a c t o r ,   i m p o r t a n c e V a l u e } >).
The input parameters of the second operation consist of any two T r I n f o T y p e ( { T r I n f o A n y , T r I n f o A n y } ) and time/location conditions. η is a function that calculates the Pearson correlation coefficient between two T r I n f o T y p e . The output of this operation is the list of the Pearson correlation coefficients ( { c o r r e l a t i o n V a l u e } ).
Table 5. Specification of Diagnostic Information Service.
NameDiagnostic Information Service
DescriptionA service providing the results of diagnostic analysis
ζ : l i n k   o r   l a n e   <{ i m p o r t a n t F a c t o r ,   i m p o r t a n c e V a l u e }>
η :   l i n k   o r   l a n e   { c o r r e l a t i o n V a l u e }
OperationInputOutput
getTrafficFactorExtraction() [ { T r I n f o A n y ,   T r I n f o A n y } ,
{ f r o m T i m e , t o T i m e } , { m i n i m u m L o n g t i t u d e ,
m a x i m u m l o n g i t u d e ,
m i n i m u m L a t i t u d e ,
m a x i m u m L a t i t u d e } ]
{ l i n k , ζ ( l i n k ) , { l a n e , ζ ( l a n e ) } }
getTrafficRelationshipBetweenFactors() [ { T r I n f o A n y ,   T r I n f o A n y } ,
{ f r o m T i m e , t o T i m e } ,
{ m i n i m u m L o n g t i t u d e ,
m a x i m u m l o n g i t u d e ,
m i n i m u m L a t i t u d e ,
m a x i m u m L a t i t u d e } ]
{ l i n k , η ( l i n k ) , { l a n e , η ( l a n e ) } }
Table 6 presents the predictive information service. It has four operations that are filtered and removed based on professional opinions, as shown in Figure 4. These operations provide the predicted value, which is predictable among the elements of T r I n f o T y p e . The input parameters of each operation consist of the analysis target time range ( { a n a l y s i s S t a r t T i m e , a n a l y s i s E n d T i m e } ) and location conditions. ϑ is a function that calculates the predicted values in the elements of C in T r I n f o T y p e . The output is the list of the predicted values.
Table 6. Specification of Predictive Information Service.
NamePredictive Information Service
DescriptionA service that provides predicted value
ϑ : l i n k   o r   l a n e   { p r e d i c t e d V a l u e }
OperationInputOutput
getTrafficFlowPrediction() [ { analysisStartTime , analysisEndTime ,
{ m i n i m u m L o n g t i t u d e ,
m a x i m u m l o n g i t u d e ,
m i n i m u m L a t i t u d e ,
m a x i m u m L a t i t u d e } ]
{ l i n k , ϑ ( l i n k ) ,   { l a n e , ϑ ( l a n e ) } }
getTrafficIncidentPrediction()
getTrafficSafetyindexPrediction()
getTrafficFlowIndexPrediction()
Table 7 presents the prescriptive information service. It has two operations that are filtered based on professional opinions, as shown in Figure 4. These operations provide the results of optimization. The input parameters of the first operation consist of time/location conditions. The output of this operation is the list of traffic lights and their signal schedules ( { s i g n a l I D ,   { o p t i m i z e d T i m e O f D a y } } ). The input parameters of the second operation consist of time/location conditions. The output indicates lanes, vehicles occupying the lanes, and time duration of occupying the lanes ( { l a n e ,   l a n e O c c u p a n c y A u t h o r i t y ,   s t r t T i m e ,   e n d T i m e > } ).
Table 7. Specification of Prescriptive Information Service.
NamePrescriptive Information Service
DescriptionA service that provides optimal solutions for signal and lane operations.
OperationInputOutput
getTrafficSignalOptimization() { f r o m T i m e , t o T i m e } ,
{ m i n i m u m L o n g t i t u d e ,
m a x i m u m l o n g i t u d e ,
m i n i m u m L a t i t u d e ,
m a x i m u m L a t i t u d e }
{ s i g n a l I D ,   { o p t i m i z e d T i m e O f D a y } }
getTrafficControlOptimization() < { l a n e ,   l a n e O c c u p a n c y A u t h o r i t y ,
s t r t T i m e ,   e n d T i m e } >
Figure 5 illustrates the operations for each service and the relationships between services. In the primitive information service, users can retrieve traffic information by invoking the corresponding operation for each function. The description, diagnostic, predictive, and prescriptive information services derive results by performing aggregation, diagnostic analysis, predictive analysis, and prescriptive analysis. When users call the operations of these services, they receive the corresponding traffic information through the interface module with the primitive information service. Then, they provide the results derived by performing the aggregation, diagnostic analysis, predictive analysis, and prescriptive analysis.

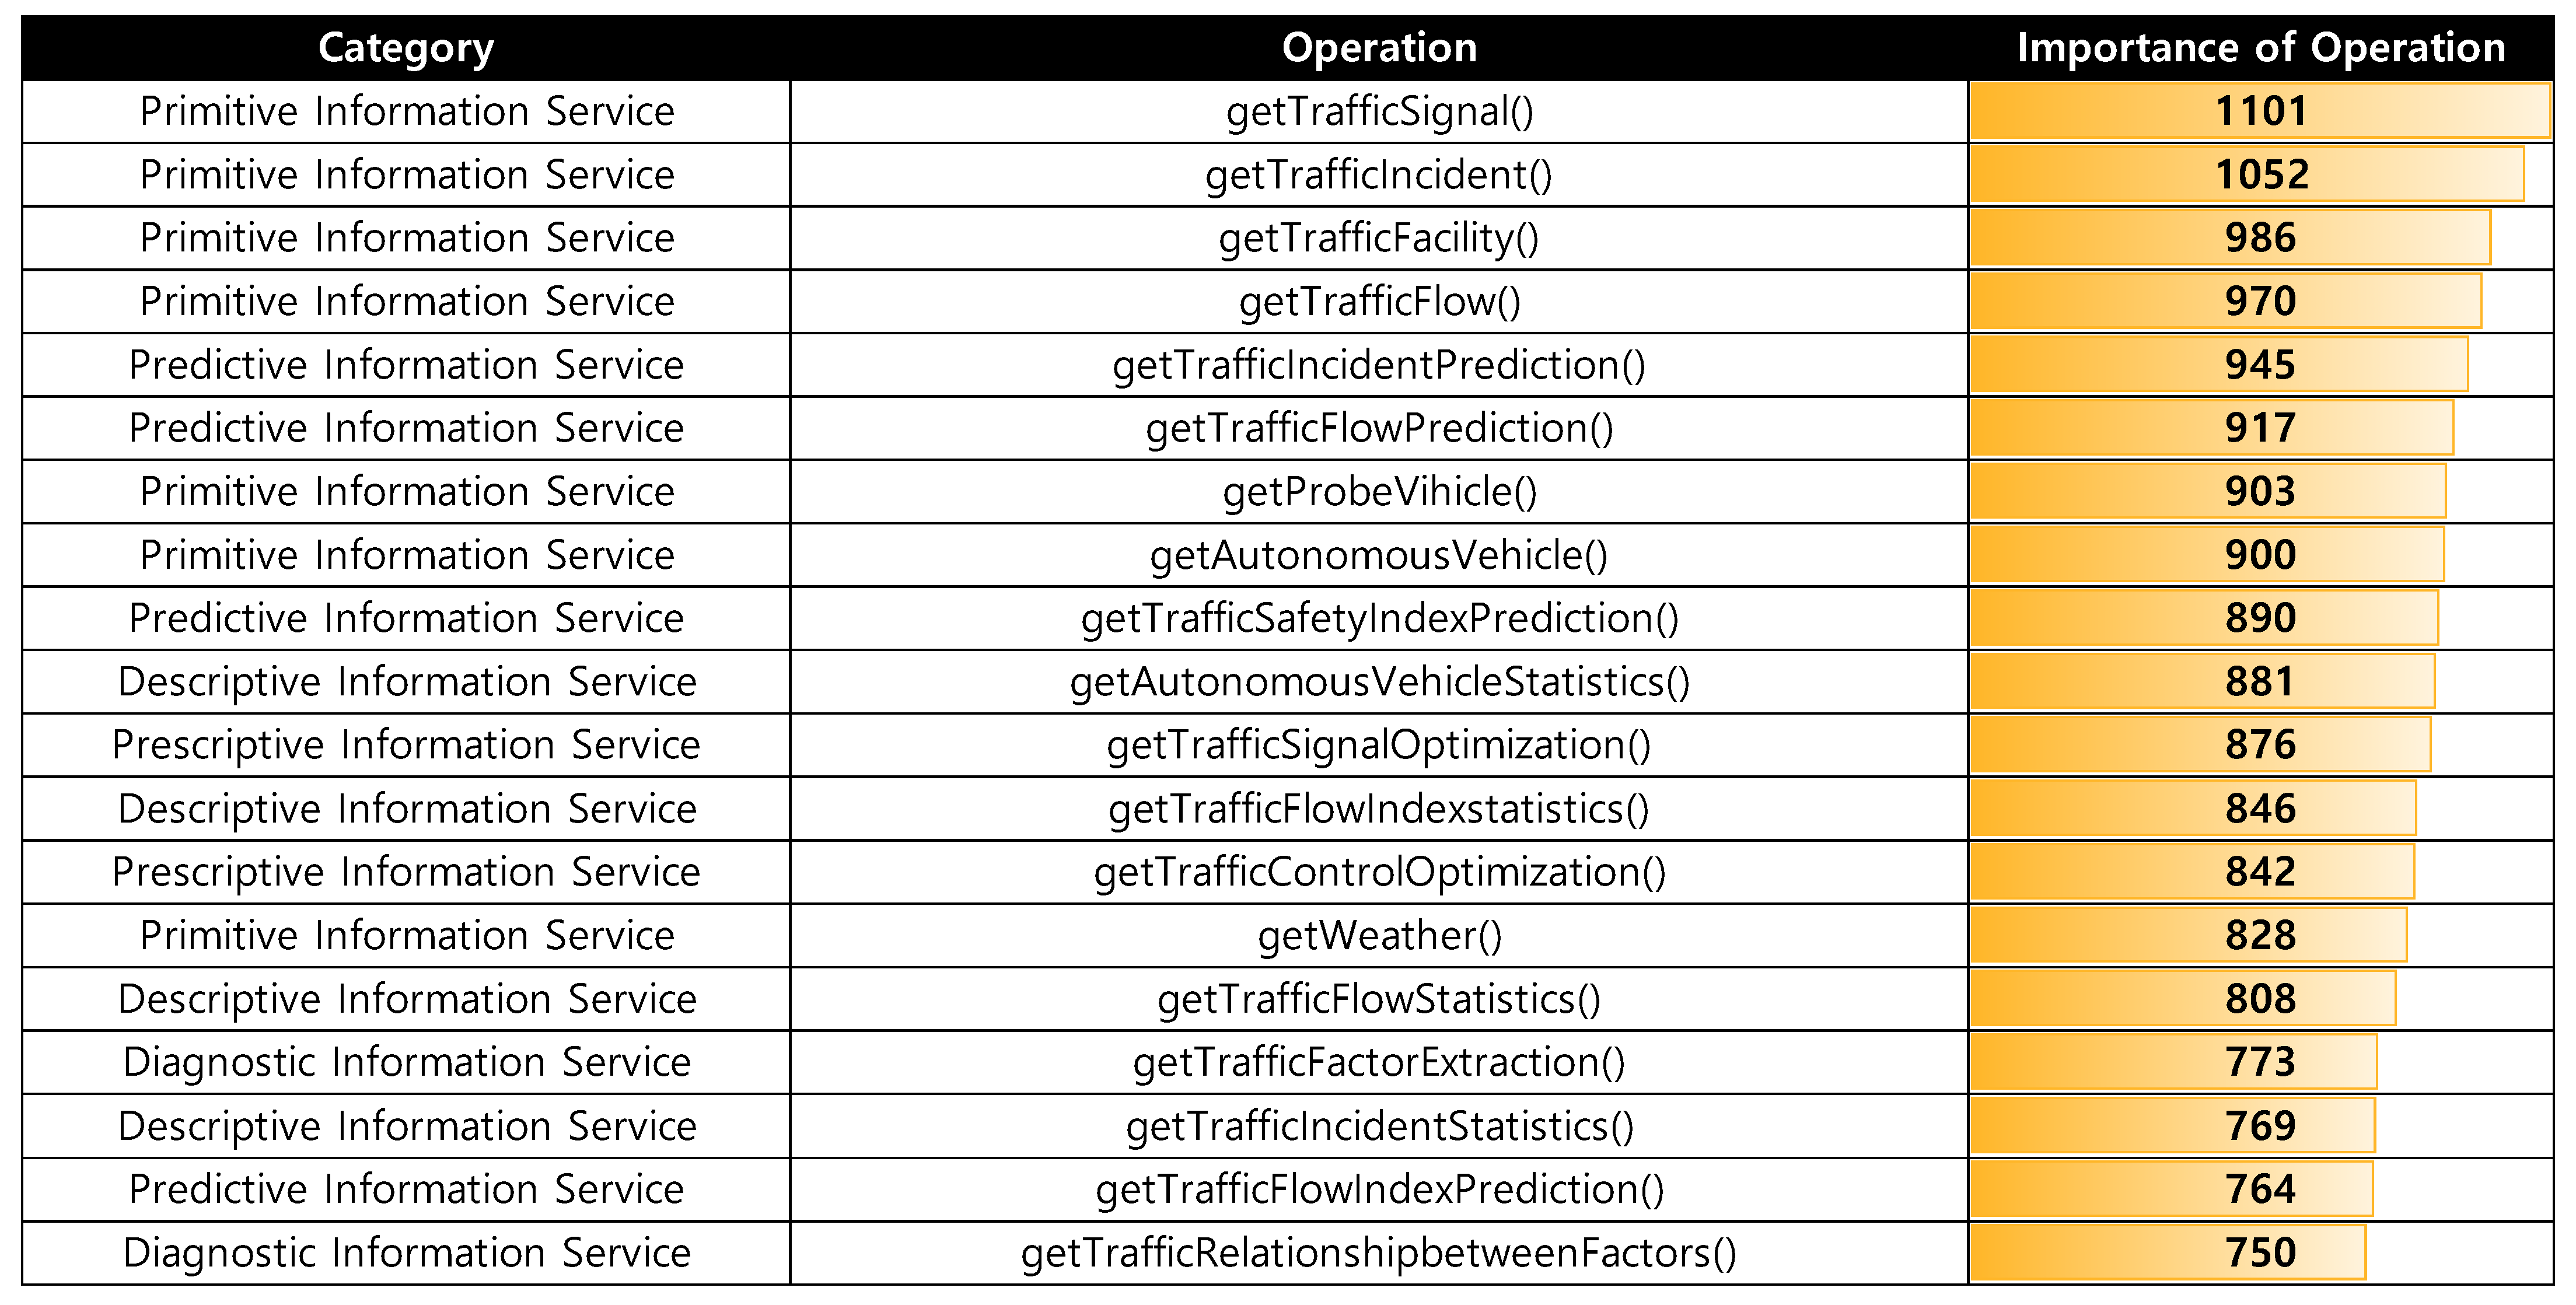
4.3. Evaluation of the Importance of Service Operations

To evaluate the importance of each operation of the derived services, a survey was conducted with 22 traffic experts. First, to evaluate the importance of each operation in terms of three scales (urgency, necessity, and applicability), relative superiority was evaluated for each scale. Moreover, the importance of each operation was evaluated using a Likert scale of five points for each category. Below is the equation for calculating the evaluation score for the importance of each operation.
Equation. 
Importance of Operation ( o p e r I m p )
  o p e r I m p i = j ( u r g W e i g h t   i j × u r g E v a l S c o r e i j + n e c e s s W e i g h t   i j × n e c e s s E v a l S c o r e i j + a p p l i c W e i g h t   i j × a p p l i c E v a l S c o r e i j )
where,
  u r g W e i g h t   i j : t h e   u r g e n c y   w e i g h t   a s s i g n e d   t o   t h e   i t h   o p e r a t i o n   b y   t h e   j t h   e x p e r t
    u r g E v a l S c o r e i j :   t h e   u r g e n c y   L i k e r t   s c o r e   a s s i g n e d   t o   t h e   i t h   o p e r a t i o n   b y   t h e   j t h   e x p e r t
    n e c e s s W e i g h t   i j :   t h e   n e c e s s i t y   w e i g h t   a s s i g n e d   t o   t h e   i t h   o p e r a t i o n   b y   t h e   j t h   e x p e r t
    n e c e s s E v a l S c o r e i j :   t h e   n e c e s s i t y   L i k e r t   s c o r e   a s s i g n e d   t o   t h e   i t h   o p e r a t i o n   b y   t h e   j t h   e x p e r t
    a p p l i c W e i g h t   i j :   t h e   a p p l i c a b i l i t y   w e i g h t   a s s i g n e d   t o   t h e   i t h   o p e r a t i o n   b y   t h e   j t h   e x p e r t
  a p p l i c a E v a l S c o r e i j :   t h e   a p p l i c a b i l i t y   L i k e r t   s c o r e   a s s i g n e d   t o   t h e   i t h   o p e r a t i o n   b y   t h e   j t h e x p e r t
        i = 1 , 2 , , N u m b e r   o f   o p e r a t i o n s
        j = 1 ,   2 ,   ,   N u m b e r   o f   e x p e r t s
Figure 6 describes the results of the evaluation proceeded by experts. The four operations that received the lowest operation importance are getTrafficSignal(), getTrafficIncident(), getTrafficFacility(), and getTrafficFlow(). These operations correspond to the primitive types of AV-mixed Traffic Information defined in Section 3. The five operations that received the lowest importance are getTrafficFlowStatistics(), getTrafficFactorExtraction(), getTrafficIncidentStatistics(), getTrafficFlowIndexPrediction(), getTrafficRelationship-betweenFactors(). The information provided by these operations is the “analyzed” traffic information, which is not provided by conventional traffic information centers. Therefore, it is assumed that unfamiliarity with this information and uncertainty regarding the reliability of the analysis results contributed to this outcome.

5. Conclusions

This study presented a model of essential traffic information and traffic information services that should be provided by traffic control centers for roads where autonomous and traditional vehicles interact. First, to define traffic information, the fundamental traffic information provided by MOLIT for Korea was temporally and spatially extended. Then, dynamic traffic information was added by referring to the data provided by each level of LDM. In addition, a notation was proposed such that the defined traffic information could be used generically and each defined traffic information type was modeled using the notation. Services for providing traffic information were also defined using the analytic ascendancy model and the functional importance of each service was evaluated through a survey.
The results of this research can contribute to academic and industrial perspectives. From an academic perspective, the proposed generic traffic information notation can also effectively model both moving and unmovable objects and contexts determined by the specific object, time, and location; so that the integrated traffic control center can employ real-time/microscopic data collected from various data sources to ensure the safety of vehicles and pedestrians moving around traffic sites. From an industrial perspective, the proposed traffic information notation described in this research can be used to model the traffic information collected in the integrated traffic control center generically, contributing to effective communication between related parties operating the integrated traffic control centers so that the cost occurred from misunderstandings can be reduced.
The limitation of this study is that it only covers the traffic information and service models from a logical perspective. As the proposed logical model can be used as the standard (e.g., V2X message), the database schema that can store the traffic information and input/output messages may be necessary. Therefore, the novel physical model of each model and the reference model of the future integrated traffic control center should be investigated. In addition, as V2X communication technology will be improved over time, sensing devices (e.g., 3d LiDAR and camera) and results generated from them are also worth modeling. Finally, a generic study on specific data processing and analysis methods for analytical traffic information derived from primitive traffic information is also required. As was the case with smart factories that marked the beginning of the Fourth Industrial Revolution era, studies may also be conducted to redefine the level of autonomous driving that includes advanced transportation infrastructure and traffic control centers.

Author Contributions

Conceptualization, Y.-S.K.; methodology, D.-H.Y. and S.-S.C.; software, D.-H.Y. and S.-S.C.; validation, D.-H.Y. and S.-S.C.; formal analysis, D.-H.Y. and S.-S.C.; investigation, D.-H.Y. and S.-S.C.; resources, D.-H.Y. and S.-S.C.; data curation, D.-H.Y. and S.-S.C.; writing—original draft preparation, D.-H.Y. and S.-S.C.; writing—review and editing, D.-H.Y., S.-S.C., and Y.-S.K.; visualization, D.-H.Y. and S.-S.C.; supervision, Y.-S.K.; project administration, Y.-S.K.; funding acquisition, Y.-S.K. All authors have read and agreed to the published version of the manuscript.

Funding

This work was supported by a Korea Institute of Police Technology (KIPoT) grant funded by the Korea government (KNPA) (No.092021C28S01000, development of integrated road traffic control system and operation technology when autonomous driving is mixed with normal vehicles).

Data Availability Statement

Not applicable.

Conflicts of Interest

The authors declare no conflict of interest.

References

  1. Yurtsever, E.; Lambert, J.; Carballo, A.; Takeda, K. A survey of autonomous driving: Common practices and emerging technologies. IEEE Access 2020, 8, 58443–58469. [Google Scholar] [CrossRef]
  2. J3016_201401; Taxonomy and Definitions for Terms Related to On-Road Motor Vehicle Automated Driving Systems. SAE International: Warrendale, PA, USA, 2014; pp. 1–12.
  3. Naveen, M.K.; Lokesh, M.; Varma, K.N.J.L.; Teja, P.S.V. A Review On Autonomous Vehicles And Its Components. J. Pharm. Negat. Results. 2023, 13, 6916–6922. [Google Scholar]
  4. Badue, C.; Guidolini, R.; Carneiro, R.V.; Azevedo, P.; Cardoso, V.B.; Forechi, A.; De Souza, A.F. Self-driving cars: A survey. Expert Syst. Appl. 2021, 165, 113816. [Google Scholar] [CrossRef]
  5. Malik, S.; Khan, M.A.; El-Sayed, H. Collaborative autonomous driving—A survey of solution approaches and future challenges. Sensors 2021, 21, 3783. [Google Scholar] [CrossRef] [PubMed]
  6. Zhu, F.; Lv, Y.; Chen, Y.; Wang, X.; Xiong, G.; Wang, F.Y. Parallel transportation systems: Toward IoT-enabled smart urban traffic control and management. IEEE Trans. Intell. Trans. Syst. 2019, 21, 4063–4071. [Google Scholar] [CrossRef]
  7. Yang, Z.; Pun-Cheng, L.S. Vehicle detection in intelligent transportation systems and its applications under varying environments: A review. Image Vis. Comput. 2018, 69, 143–154. [Google Scholar] [CrossRef]
  8. Al-Dweik, A.; Muresan, R.; Mayhew, M.; Lieberman, M. IoT-based multifunctional scalable real-time enhanced road side unit for intelligent transportation systems. In Proceedings of the 2017 IEEE 30th Canadian conference on electrical and computer engineering (CCECE), Windsor, ON, Canada, 30 April–3 May 2017; pp. 1–6. [Google Scholar]
  9. Eiter, T.; Füreder, H.; Kasslatter, F.; Parreira, J.X.; Schneider, P. Towards a semantically enriched local dynamic map. Int. J. Intell. Transp. Syst. Res. 2019, 17, 32–48. [Google Scholar] [CrossRef]
  10. Qureshi, K.N.; Abdullah, A.H. A survey on intelligent transportation systems. Middle-East J. Sci. Res. 2013, 15, 629–642. [Google Scholar]
  11. Ghosal, A.; Conti, M. Security issues and challenges in V2X: A survey. Comput. Netw. 2020, 169, 107093. [Google Scholar] [CrossRef]
  12. Iskandarova, S.; El-Tawab, S. System Leadership: Self-Driving Vehicles Regulation and the Role of Government. In Proceedings of the 2023 IEEE International Conference on Smart Mobility, Detroit, MI, USA, 17–19 May 2023; pp. 191–196. [Google Scholar]
  13. Zhang, R.; Zhong, W.; Wang, N.; Sheng, R.; Wang, Y.; Zhou, Y. The innovation effect of intelligent connected vehicle policies in China. IEEE Access 2022, 10, 24738–24748. [Google Scholar] [CrossRef]
  14. Force, E.T. Automated Driving Roadmap; European road Transport Research Advisory Council: Brussel, Belgium, 2015. [Google Scholar]
  15. Alanazi, F. Development of Smart Mobility Infrastructure in Saudi Arabia: A Benchmarking Approach. Sustainability 2023, 15, 3158. [Google Scholar] [CrossRef]
  16. Deemantha, R.G.S.; Hettige, B. Autonomous Car: Current Issues, Challenges and Solution: A Review. In Proceedings of the 15th International Research Conference, Beijing, China, 1–6 September 2019. [Google Scholar]
  17. Jun, W.K.; An, M.H.; Choi, J.Y. Impact of the connected & autonomous vehicle industry on the Korean national economy using input-output analysis. Technol. Forecast. Soc. Chang. 2022, 178, 121572. [Google Scholar]
  18. Bae, J.; Hur, N.; Choi, D.J. Study on mobile TV services for autonomous vehicles based on terrestrial broadcasting system incorporating broadcast core network. In Proceedings of the 2022 IEEE International Conference on Consumer Electronics-Asia (ICCE-Asia), 26–28 October 2022; pp. 1–4. [Google Scholar]
  19. Kulabukhova, N. The Survey of Self-driving Car Challenges in Smart City Infrastructures. In Proceedings of the International Conference on Computational Science and Its Applications, Athens, Greece, 3–6 July 2023; pp. 290–301. [Google Scholar]
  20. ISO 14823; 2017 Intelligent Transport Systems–Graphic Data Dictionary. ISO: Geneva, Switzerland, 2017.
  21. Sakai, H.; Nishiyama, S. Activities toward International Standardization of Dynamic Maps. SIP Results Rep. 2018, 2018, 214–216. [Google Scholar]
  22. FHWA-JPO-13-046; Sumner, R.; Eisenhart, B.; Baker, J. SAE J2735 standard: Applying the systems engineering process. United States. Department of Transportation. Intelligent Transportation Systems Joint Program Office: Washington, DC, USA, 2013.
  23. Guo, X.Y.; Zhang, G.; Jia, A.F. Study on mixed traffic of autonomous vehicles and human-driven vehicles with different cyber interaction approaches. Veh. Commun. 2023, 39, 100550. [Google Scholar] [CrossRef]
  24. Mohajerpoor, R.; Ramezani, M. Mixed flow of autonomous and human-driven vehicles: Analytical headway modeling and optimal lane management. Transp. Res. Part C Emerg. Technol. 2019, 109, 194–210. [Google Scholar] [CrossRef]
  25. New York City Traffic Management Center. Available online: https://www.nyc.gov/html/dot/html/motorist/atis.shtml (accessed on 25 August 2023).
  26. Traffic Control Centre (VKRZ). Available online: https://www.berlin.de/sen/uvk/en/mobility-and-transport/traffic-management/traffic-control-centre (accessed on 25 August 2023).
  27. Kostakos, V.; Ojala, T.; Juntunen, T. Traffic in the smart city: Exploring city-wide sensing for traffic control center augmentation. In Proceedings of the IEEE Internet Computing, Washington, DC, USA, 5 December 2013; Volume 17, pp. 22–29. [Google Scholar]
  28. Kotsialos, A.; Vassilakopoulou, P. Fleet management enterprise systems and traffic control synergies: A literature review and research agenda. Procedia Comput. Sci. 2023, 219, 529–536. [Google Scholar] [CrossRef]
  29. Benmessaoud, Y.; Cherrat, L.; Ezziyyani, M. Real-Time Self-Adaptive Traffic Management System for Optimal Vehicular Navigation in Modern Cities. Computers 2023, 12, 80. [Google Scholar] [CrossRef]
  30. Japan Road Traffic Information Center. Available online: https://www.jartic.or.jp (accessed on 25 August 2023).
  31. National Transport Information Center. Available online: https://www.its.go.kr (accessed on 25 August 2023).
  32. Urban Traffic Information Center. Available online: https://www.utic.go.kr/main/main.do (accessed on 25 August 2023).
  33. Brakatsoulas, S.; Pfoser, D.; Tryfona, N. Modeling, storing and mining moving object databases. In Proceedings of the International Database Engineering and Applications Symposium, IDEAS′04, Washington, DC, USA, 7–9 July 2004; pp. 68–77. [Google Scholar]
  34. Du Mouza, C.; Rigaux, P. Mobility patterns. GeoInformatica 2005, 9, 297–319. [Google Scholar] [CrossRef]
  35. Güting, R.H.; De Almeida, V.T.; Ding, Z. Modeling and querying moving objects in networks. VLDB J. 2006, 15, 165–190. [Google Scholar] [CrossRef]
  36. Timko, I.; Pedersen, T.B. Capturing complex multidimensional data in location-based data warehouses. In Proceedings of the 12th Annual ACM International Workshop on Geographic Information Systems, Arlington, VA, USA, 12–13 November 2004; pp. 147–156. [Google Scholar]
  37. Jensen, C.S.; Kligys, A.; Pedersen, T.B.; Timko, I. Multidimensional data modeling for location-based services. In Proceedings of the 10th ACM international symposium on Advances in geographic information systems, McLean, VA, USA, 8–9 November 2002; pp. 55–61. [Google Scholar]
  38. Jensen, C.S.; Lu, H.; Yang, B. Graph model based indoor tracking. In Proceedings of the 2009 Tenth International Conference on Mobile Data Management: Systems, Services and Middleware, Taipei, Taiwan, 18–20 May 2009; pp. 122–131. [Google Scholar]
  39. Jensen, C.S.; Lu, H.; Yang, B. Indexing the trajectories of moving objects in symbolic indoor space. In Proceedings of the Advances in Spatial and Temporal Databases: 11th International Symposium, SSTD 2009, Aalborg, Denmark, 8–10 July 2009; Proceedings 11. pp. 208–227. [Google Scholar]
  40. Xu, J.; Güting, R.H. A generic data model for moving objects. GeoInformatica 2013, 17, 125–172. [Google Scholar] [CrossRef]
  41. Maoz, M. How IT should deepen big data analysis to support customer-centricity, ID: G00248980, Gartner, 26 June 2013. Available online: https://www.gartner.com/en/documents/2531116/how-it-should-deepenbig-data-analysis-tosupport-custom (accessed on 25 February 2022).
  42. Groggert, S.; Wenking, M.; Schmitt, R.H.; Friedli, T. Status quo and future potential of manufacturing data analytics—An empirical study. In Proceedings of the 2017 IEEE International Conference on Industrial Engineering and Engineering Management (IEEM), Singapore, 10–13 December 2017; pp. 779–783. [Google Scholar]
  43. Motlagh, N.H.; Zaidan, M.A.; Lovén, L.; Fung, P.L.; Hänninen, T.; Morabito, R.; Tarkoma, S. Digital Twins for Smart Spaces-Beyond IoT Analytics. IEEE Internet Things J. 2023. [Google Scholar] [CrossRef]
  44. Uskov, V.L.; Bakken, J.P.; Shah, A.; Hancher, N.; McPartlin, C.; Gayke, K. Innovative InterLabs system for smart learning analytics in engineering education. In Proceedings of the 2019 IEEE Global Engineering Education Conference (EDUCON), Dubai, United Arab Emirates, 8–11 April 2019; pp. 1363–1369. [Google Scholar]
  45. Wang, D.; Miwa, T.; Morikawa, T. Big trajectory data mining: A survey of methods, applications, and services. Sensors 2020, 20, 4571. [Google Scholar] [CrossRef] [PubMed]
Figure 1. Analytic Ascendancy Model.
Applsci 13 10719 g001
Figure 2. Characteristics of AV-mixed Traffic Information.
Applsci 13 10719 g002
Figure 3. Schematic of AV-mixed traffic Information.
Applsci 13 10719 g003
Figure 4. Process of Service Derivation.
Applsci 13 10719 g004
Figure 5. Operations for each service and relationships between services.
Applsci 13 10719 g005
Figure 6. Result of the evaluation proceeded by experts.
Applsci 13 10719 g006
Table 1. Comparison of the proposed model with conventional models.
IndexObjectTimeLocationAttributes of (Object × Time × Location)
MovingUnmovable
This studyOOOOO
(State of moving and unmovable objects,
such as speed of vehicles and signal of traffic lights)
[33]OXOOO
(Speed of moving objects)
[34]OXOOX
[35]OXOOO
(Speed of moving objects)
[36]OXOOO
(Speed and direction of moving objects)
[37]OXOOX
[38]OXOOX
[39]OXOOX
[40]OXOOO
(Duration time of moving objects)
O: addressed; X: not addressed.
Table 2. Result of AV-mixed Traffic Information Modeling.
Type
( T r I n f o T y p e )
O T L C
Traffic Flow
( T r I n f o F l o w )
{ d e t e c t o r I D } { c r t T i m e ,
r e c T i m e }
{ l i n k ,
λ ( l i n k ) }
{ l i n k V e l o c i t y ,   l i n k V o l u m e , l i n k O c c u p a n c y R a t e , l i n k T r a v e l T i m e ,
< l a n e V e l o c i t y ,   l a n e V o l u m e , l a n e O c c u p a n c y R a t e , l a n e T r a v e l T i m e > }
Traffic Incident
( T r I n f o I n c i d e n t )
{ } { s t r t T i m e ,
e n d T i m e ,
r e c T i m e }
{ l i n k ,
λ ( l i n k ) ,
c o o r d }
{ l i n k I n c i d n e t C o d e , l i n k P r o g r e s s S t a t u s , l i n k I n c i d e n t T i t l e ,   l i n k I n c i d e n t I n f o r m a t i o n ,
< l a n e I n c i d n e t C o d e , l a n e P r o g r e s s S t a t u s , l a n e I n c i d e n t T i t l e ,   l a n e I n c i d e n t I n f o r m a t i o n > }
Traffic Facility
( T r I n f o F a c i l i t y )
{ f a c i l i t y I D ,
f a c i l i t y T y p e }
{ c r t T i m e ,
r e c T i m e }
{ l i n k ,
λ ( l i n k ) ,
c o o r d }
{ f a c i l i t y S t a t u s C o d e }
Weather
( T r I n f o W e a t h e r )
{ w e a t h e r S t a t i o n I D } { c r t T i m e ,
r e c T i m e }
{ c o o r d } { t e m p e r a t u r e ,   h u m i d i d t y , a i r V o l u m e , w i n d S p e e d , r a i n F a l l , s n o w F a l l }
Probe Vehicle
( T r I n f o P r o b e V e h i c l e )
{ v e h i c l e I D ,
w i d t h ,
l e n g t h }
{ c r t T i m e ,
r e c T i m e }
{ l i n k ,
λ ( l i n k ) ,
c o o r d }
{ a c c u r a c y ,   t r a n s m i s s i o n ,   s p e e d ,   h e a d i n g ,   a n g l e ,
a c c e l e r a t i o n L o n g t i t u d e ,   a c c e l e r a t i o n L a t i t u d e , a c c e l e r a t i o n A l t i t u d e , w h e e l B r a k e ,   t r a c t i o n , a n t i L o c k B r a k e ,   b r a k e B o o s t ,   a u x i l i a r y B r a k e }
Traffic Signal
( T r I n f o S i g n a l )
{ s i g n a l G r o u p I D } { s t r t T i m e ,
e n d T i m e ,
r e c T i m e }
{ n o d e } { d e s c r i p t i v e N a m e ,   s i n g a l S t a t u s ,
m o v e m e n t N a m e , m o v e m e n t P h a s e S t a t u s }
Autonomous
Vehicle
( T r I n f o A u t o V e h i c l e )
{ a u t o V e h i c l e I D ,
w i d t h ,
l e n g t h }
{ c r t T i m e ,
r e c T i m e }
{ l i n k ,
λ ( l i n k ) ,
c o o r d }
{ a c c u r a c y ,   t r a n s m i s s i o n ,   s p e e d ,   h e a d i n g ,   a n g l e ,
a c c e l e r a t i o n L o n g t i t u d e ,   a c c e l e r a t i o n L a t i t u d e , a c c e l e r a t i o n A l t i t u d e ,
w h e e l B r a k e ,   t r a c t i o n , a n t i L o c k B r a k e ,   b r a k e B o o s t ,   a u x i l i a r y B r a k e }
Disclaimer/Publisher’s Note: The statements, opinions and data contained in all publications are solely those of the individual author(s) and contributor(s) and not of MDPI and/or the editor(s). MDPI and/or the editor(s) disclaim responsibility for any injury to people or property resulting from any ideas, methods, instructions or products referred to in the content.

