Article

Dynamic Reliability Assessment Method for a Pantograph System Based on a Multistate T-S Fault Tree, Dynamic Bayesian

School of Urban Railway Transportation, Shanghai University of Engineering Science, No. 333, Long-teng Road, Shanghai 201620, China
*
Author to whom correspondence should be addressed.
Appl. Sci. 2023, 13(19), 10711; https://doi.org/10.3390/app131910711
Submission received: 20 July 2023 / Revised: 19 September 2023 / Accepted: 21 September 2023 / Published: 26 September 2023
(This article belongs to the Special Issue Intelligent Fault Diagnosis and Monitoring)

Abstract

:
The operational reliability of rail vehicle pantograph systems is evaluated by transforming T-S multistate fault trees into dynamic Bayesian networks (DBNs), which take into account system multistability, long-lasting operation, dynamic failure, and maintenance recovery. The T-S multistate fault tree structure is constructed by the content validity ratio and content validity index; the T-S gate rule expressing causal uncertainty is constructed by using fuzzy theory and dependent uncertain ordered weighted averaging expert scoring, and finally, the pantograph T-S multistate fault tree is transformed into a DBN model characterizing the dynamic interaction and time dependence of the system. The dynamic evolution laws of reliability of a pantograph system in maintenance and maintenance-free states over time are inferred, compared and analyzed. The results show that the system availability of a pantograph system decreases continuously during 720 days of operation. The system availability without maintenance decreases to 0.881, and the system availability with maintenance is 0.952. The reliability of a pantograph system can be effectively ensured with maintenance during the operation period; the sensitivity analysis is performed by changing the failure rate of the equipment to 120% or 80%; the fall indicator, the electrical control box, and the elevating bow motor are the weak links in the system, and the impact of fault escalation on the reliability of a pantograph system is analyzed. It is then verified that the system reliability can be further improved by using a preventive maintenance strategy, and the steady-state reliability can be gradually reached, which is about 0.9968, providing a reference for the maintenance of a pantograph system.

1. Introduction

1.1. Motivation

A pantograph system is a key component of rail vehicle traction receiving equipment, which obtains electrical energy directly from the contact network to provide traction power for the vehicle. Pantograph failure will seriously affect the normal operation of the vehicle, and subsequent maintenance will take up a lot of maintenance resources, so it is necessary to analyze the reliability of a pantograph system during vehicle operation. The method in this paper can provide a reference for the functional design and maintenance work, to a certain extent, to realize the subway vehicle maintenance cost reduction and operational safety enhancement.

1.2. Background and Literature Review

A portion of the study involved a pantograph reliability analysis [1]. The reliability indexes and reliability of the structural strength of pantographs were analyzed using simulated sample data extracted from Latin hypercube sampling with a single-arm pantograph as the object of study [2]. Combining the rain flow counting method, the life prediction method and the reliability prediction method, the reliability analysis of the V500 pantograph was carried out, and the fatigue life results under different working intensities were predicted, which provided data support for the structure, material, design and operation management of the device [3]. A dynamic model was developed for the pantograph of the TSG19 type, and the contact stresses were analyzed to obtain the fatigue life and reliability of the component, and its structural model was analyzed based on the stress data.
Currently, there are fewer studies on pantograph reliability alone, and most of them are based on structural reliability rather than actual operation data. Therefore, this paper will draw on the data-driven [4] reliability research method to study the dynamic reliability of pantographs.
Fault tree analysis (FTA) is a powerful tool for assessing the reliability of complex systems [5]. When using the traditional fault tree analysis method to analyze the reliability of pantograph systems, in addition to the common problem of few component failure data and difficulty in calculating the failure rate, there is also the problem that the failure states are only based on two-state assumptions and cannot accommodate the multiple failure states that exist in the practical system. Therefore, the T-S fuzzy fault tree analysis method is generated [6] by introducing the fuzzy theory and uses fuzzy numbers to describe the failure rate and failure probability; the polymorphic representation of fault states is realized by T-S gates in the T-S fault tree. When using the T-S fuzzy fault tree for reliability assessment, a large number of calculations are generated when finding the top event state (forward inference), and reverse inference is not possible. In addition, the fault tree analysis method is not suitable for dynamic reliability analysis of the system, which leads to its limitation in practical engineering applications. Many studies have applied optimized fault trees to reliability analysis. Rania A. et al. [7] Introduced the concept of Dynamic fault tree (DFT) by defining additional gates (called dynamic gates) on the traditional fault tree, which overcame the shortcomings of the traditional static fault tree in not being able to adequately simulate the dynamic failures of a complex system and effectively assessed the reliability of real complex systems. In [8], an extended approach for collaborative data-driven fault tree analysis (DDFTA) of a system is presented, which extracts repairable fault trees from time series data streaming from multiple systems/machines sharing similar functionalities. This method is not limited to binary (two states) components nor to exponential distributions. Iram Akhtar et al. [9] proposed fault tree analysis based on fuzzy set theory and applied it to wind energy systems; this technique combines the effects of operational failures of wind energy system configurations and errors in fuzzy environments using fuzzy risk indices combining probabilistic inaccuracy and engineering inaccuracy for greater flexibility and adaptability. Haonan Jiang et al. [10] established a polymorphic fuzzy fault tree for the high-voltage power battery system of a pure electric commercial vehicle based on the combination of polymorphic theory, fuzzy mathematical theory, group decision-making theory, and fault tree and carried out qualitative and quantitative analyses to determine the system’s weak links. In [11], the dynamic reliability model of the hydraulic system is established by using the continuous-time T-S Dynamic fault tree to solve the fault rate of the system, and the results are compared with the traditional analysis method and the probability importance and key importance of the system unit are calculated.
Bayesian networks (BN) are increasingly used in system safety and reliability analysis [12]. As a graphical inference method, Bayesian networks represent the causal relationships between events. A BN has some characteristics and advantages over reliability methods such as fault tree analysis, Petri nets, Markov chains, etc. A BN can be used to predict the probability of unknown variables or update the probe of known variables by evidence to achieve two-way reasoning [13]. A dynamic Bayesian network (DBN) carries out extensions on dynamic attributes such as time based on a BN [14] and combined with the state transfer probability table of the components to establish a dynamic reliability model of the system, giving full play to the advantages of BN while achieving dynamic reliability analysis of the system [15]. BN construction focuses on determining the network structure and conditional probability table. The usual method is to transform the traditional FT model of the system into a BN model to achieve BN construction, but some drawbacks in the traditional FT still pass into the BN. Due to the power of Bayesian networks, they have a wide range of applications in the field of reliability analysis. In [16], the author proposes a Bayesian network modeling framework that systematically combines design life estimates, operational data, and expert judgment for the reliability prediction of aircraft subsystems. The model predicts the reliability of a large aircraft fleet by using failure and maintenance data provided by a large fleet operator. In [17], reliability characteristics such as failure probability, failure rate, and mean time to failure of the floating offshore wind turbine are determined according to the Bayesian network predictive analysis. In [18], the fault tree mapping dynamic Bayesian network (DBN) method is applied to the reliability research study of centrifugal compressor units, and its usability and reliability are evaluated dynamically. In [19], in order to deal with epistemic uncertainty and dynamic characteristics in the reliability assessment process of controllable pitch propeller hydraulic systems, the D-S evidence theory and dynamic Bayesian network were applied to establish a novel approach for assessing its reliability and availability. In [20], to deal with the uncertain knowledge and various information in the safety assessment, characteristic indicators are extracted from marine environment systems and discretized with the Cloud model. The dynamic evaluation and risk zoning of navigation safety is realized based on Bayesian probabilistic reasoning and Dempster–Shafer (DS) evidence theory. In [21], the author develops a new dynamic Bayesian network (DBN) framework for fault diagnosis and reliability analysis of OWT gearbox systems by incorporating components’ degradation information and a condition-based maintenance (CBM) strategy. The reliability, availability, and mean time between failures (MTBF), as well as the failure criticality index (FCI) for each subassembly, are estimated.

1.3. Paper Organization

In response to the above problems, a reliability assessment method of a pantograph system based on the T-S polymorphic fault tree and dynamic Bayesian network is proposed. The T-S multistate fault tree is utilized to solve the problem that the fault states are only based on the two-state assumption, and multiple fault states cannot exist [22]. The fuzzy theory is used to obtain the T-S gate rule probability parameter in the T-S polymorphic fault tree to characterize the uncertainty of the causal relationship between events [6]. Moreover, constructing Bayesian networks using T-S polymorphic fault trees addresses the shortcomings of traditional fault tree construction of Bayesian networks [18]. Additionally, using Bayesian networks for bidirectional inference to solve the problem of T-S polymorphic fault tree forward inference is computationally complex and unable to reverse inference [23]. A dynamic Bayesian network is constructed using a Bayesian network and the multistate transfer probability table to realize the dynamic reliability analysis of a pantograph system, and it is verified that the system can effectively improve reliability by adopting preventive maintenance on the basis of the original maintenance strategy. The objective of this study is to propose a dynamic reliability assessment method for the dynamic characteristics of pantograph systems, including dynamic interactions, time dependence, and uncertainty of causality, so as to provide a reference for the pre-functional design and subsequent maintenance of pantograph systems.
The rest of the paper is structured as follows: Section 2 presents a system reliability analysis model based on the T-S polymorphic fault tree and the dynamic Bayesian network. Section 3 takes the pantograph as the object for modeling. Specific analysis results and conclusions are presented in Section 4 and 
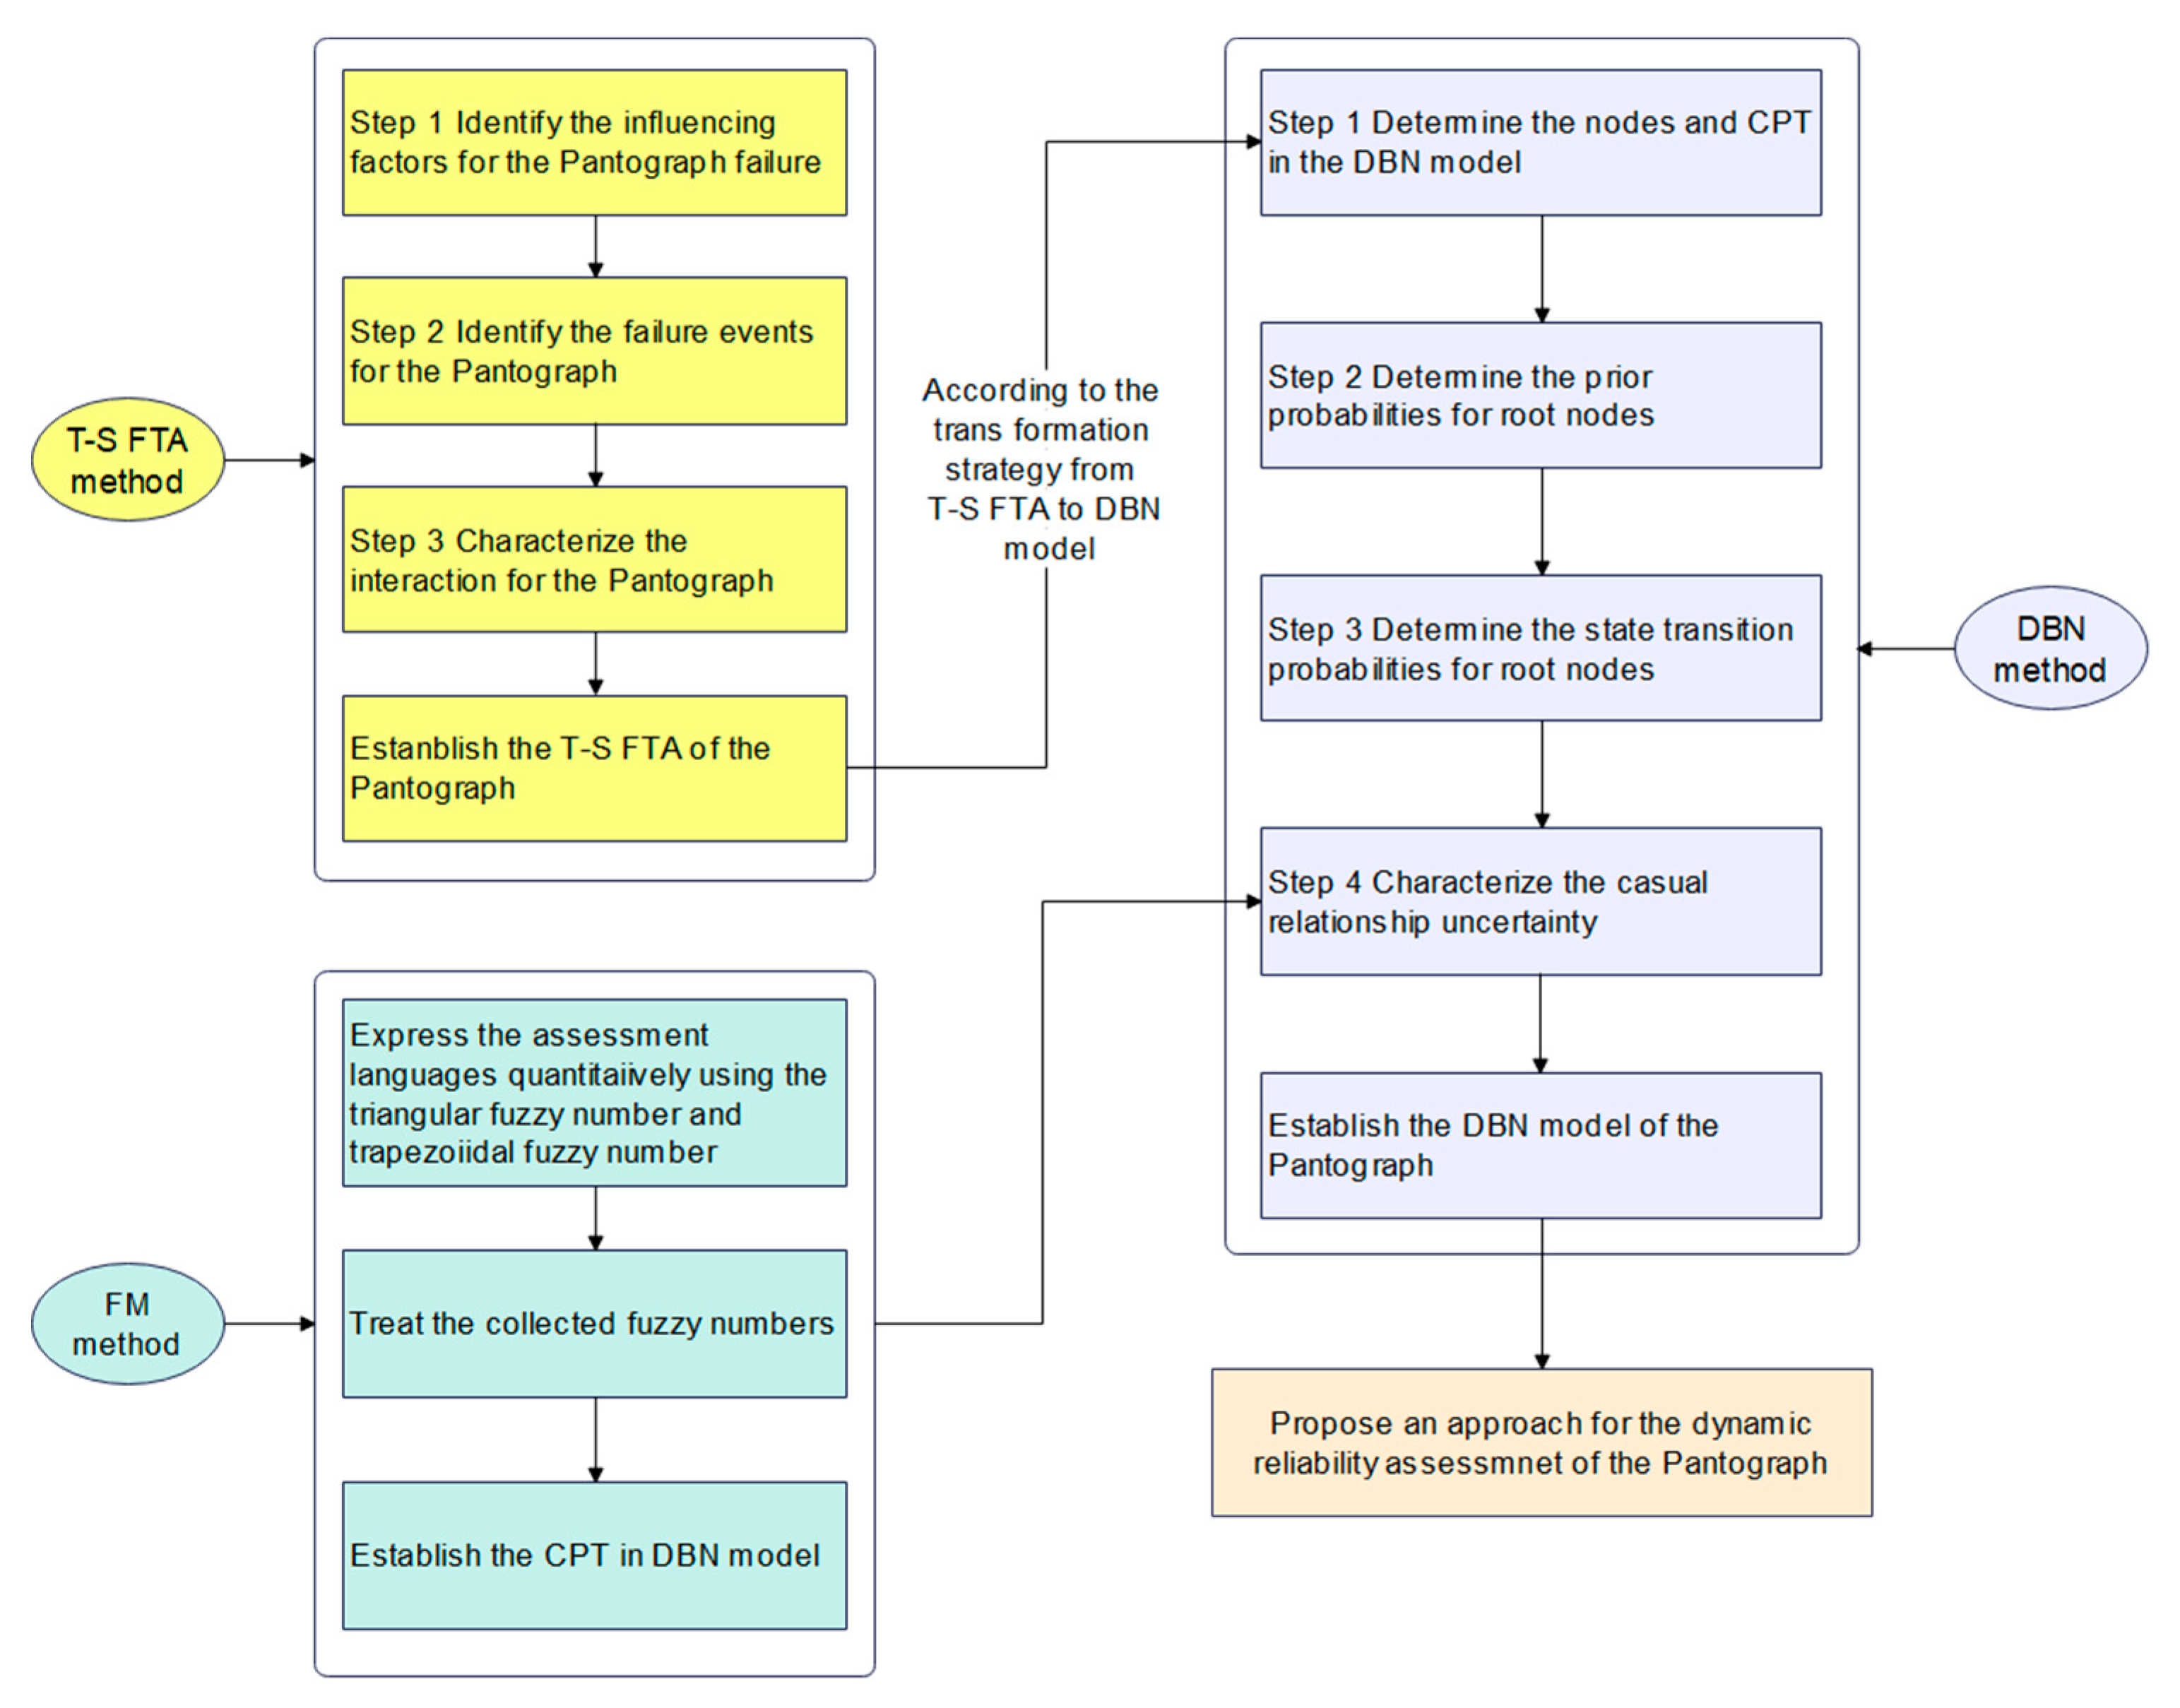
Section 5. The theoretical framework of the dynamic reliability assessment method for pantographs is established using FTA, DBN, and FM methods, as shown in Figure 1.

2. Basic Theories

2.1. T-S Multistate Fault Tree

T-S multistate fault trees are inverted tree-like diagrams consisting of top events, intermediate events, and basic events that map the potential causes of system failures using a hierarchical deductive framework that can quantitatively or qualitatively estimate the probability of top events. Compared with the traditional fault tree, the T-S multistate fault tree uses a series of T-S gates with IF-THEN rules instead of the logic gates in the traditional fault tree. T-S gates allow events to have multiple fault states, making them more suited to complex components with multiple fault states or with escalating faults. T-S gate input events are multiple fault states or with escalating faults [24,25].
The T-S gate input event is x i ( i = 1 , 2 , , n ) , the corresponding multiple fault state can be expressed as x i a i ( a i = 1 , 2 , , k i ) , [6] and its output event corresponds to the multiple fault state as y b j ( b j = 1 , 2 , , η j ) .
In the case of a known IF-THEN rule l, the input event x i fault state in the T-S gate corresponds to: x 1 = x 1 a 1 , x 2 = x 2 a 2 , , x n = x n a n , then y is a possible representation of state y b j as P l ( y b j ) . Number r of rule l is determined by the total number k i of states of x i . The calculation is given in Equation (1):
r = k 1 k 2 k n = i = 1 n k i
In addition, the T-S gate rule can be used to assign values to the conditional probability tables of the corresponding nodes in the Bayesian network [26]. The specific process of constructing a Bayesian network based on a T-S multistate fault tree is shown in Figure 2.

Fault Tree Structural Validity Verification

Verifying the validity of the fault tree structure is essential for the subsequent reliability analysis method based on this fault tree [27]. By collecting expert knowledge, the content validity ratio (CVR) and content validity index (CVI) of the fault tree structure are calculated to measure the relevance and necessity of primary and intermediate events in the fault tree. The content validity ratio (CVR) is a measure of validity proposed by Lawshe [28]. Using expert knowledge to calculate this value, experts classify each essential event according to a three-level Likert scale (1 = unnecessary, 2 = helpful but unnecessary, 3 = necessary). Then, they were calculated using Equation (2).
C V R = n E N 2 N 2
The n is the necessary number of experts selected (3), and N is the total number of experts.
The calculated content validity ratio (CVR) value is compared with the standard parameters in Lawshe’s table. If it is higher than the standard, the content validity of the fault tree structure is accepted.
The content validity index (CVI), where the item-level CVI (I-CVI) evaluates the content validity of each item [29], and the method is used to measure the relevance of each event in the fault tree. In this method, experts are required to determine the relevance of each event. A 4-level Likert scale was used (1 = not relevant, 2 = slightly relevant, 3 = strongly relevant, 4 = very relevant). For each event, the number of experts who gave a rating of 3 or 4 divided by the total number of experts who participated was the corresponding I-CVI, and the I-CVI determined the content validity of the fault tree structure.

2.2. Fuzzy Theory

The T-S gate rules in the T-S fault trees are usually formulated by expert knowledge [30], and the T-S gate rules correspond to conditional probability tables in subsequent Bayesian networks. Since experts cannot precisely calculate the probability parameters P l ( y b j ) in the T-S gate rule, natural language, such as “possible” and “impossible”, is usually used to describe the probability parameters. However, these languages are fuzzy, so the fuzzy theory deals with this uncertain information.
However, these languages carry fuzziness, so fuzzy theory is used to deal with this uncertain information. In this paper, fuzzy theory and expert linguistic judgments are used to estimate the conditional probability parameter P l ( y b j ) in the T-S gate rule.
It is first necessary to determine the linguistic rating levels and to replace the expert linguistic rating values with triangular or trapezoidal fuzzy numbers [31]. Table 1 gives the corresponding fuzzy number forms and λ-cut sets for the evaluated languages.
After obtaining the evaluation information from fuzzy numbers from multiple experts, the arithmetic averaging method and the combination of expert weights are often used to synthesize the evaluation information. In order to avoid the intense subjectivity of experts, the objective weighting method of Depended Uncertain Ordered Weighted Averaging [32] (DUOWA) is used; this method determines the weights according to the degree of difference between the evaluation information of each expert and the average evaluation information, avoiding the uncertainty caused by subjective weighting.
If n experts are evaluating the probability parameter P l ( y b j ) of the T-S gate rule l, the trapezoidal fuzzy number of the evaluation information using the DUOWA operator to synthesize the expert evaluation information is:
F k , l , y b j = ( F k , l , y b j 1 , F k , l , y b j 2 , F k , l , y b j 3 , F k , l , y b j 4 )
Each expert’s evaluation weight values are calculated and obtained by the following Equation (3):
w ( F k , l , y b j , F a ) = s ( F k , l , y b j , F a ) k = 1 n s ( F k , l , y b j , F a )
where F a is the arithmetic mean of n trapezoidal fuzzy numbers and s ( F k , l , y b j , F a ) is the similarity between F k , l , y b j and F a .
Comprehensive expert evaluation based on the evaluation weights of the experts:
W l , y b j = k = 1 n w k , l , y b j F k , l , y b j
where w k , l , y b j is the evaluation weight of each expert calculated by Equation (3).
The information obtained by combining the expert evaluation information is still a fuzzy number. It is necessary to fuzzify the fuzzy number solution [33] into a clear T-S gate rule l with probability parameter p. The area-mean method is shown in Equation (5):
P l ( y W b j ) = a W + b W + c W + d W 4
The P l ( y W b j ) obtained above will be applied to the subsequent Bayesian network conditional probability table as the probability parameter P l ( y b j ) in the T-S gate rule l. The P l ( y b j ) sum must be 1. Therefore, it is necessary to normalize P l ( y W b j ) , which can be obtained from Equation (6):
P l ( y W b j ) = a W + b W + c W + d W 4
The above fuzzy theoretical approach to transform the expert fuzzy judgment information into the probability parameter P l ( y b j ) of the T-S gate rule l can effectively reduce the uncertainty of the conditional probability table in the subsequent Bayesian network.

2.3. Dynamic Bayesian Network

A dynamic Bayesian network (DBN) is a temporal extension of a static Bayesian network. By combining the static Bayesian network with temporal information, the DBN model’s transition between two adjacent time segments can be modeled as follows [34]:
P ( X t | X t 1 ) = i = 1 N P ( X t , i | P a ( X t , i ) )
where X t and X t 1 denote the nodes in time slice t and t−1; X t , i is the ith node in time slice t; and P a ( X t , i ) is the set of parent nodes of the node.
In the DBN model, the joint probability distribution of multiple time segments can be calculated by the following Equation (8):
P ( X 1 : T ) = i = 1 T i = 1 N P ( X t i | P a ( X t i ) )
where T is the number of time segments; P ( X 1 : T ) is the joint probability distribution of time segments 1:T.

Multistate Modeling of Dynamic Bayesian Networks

In order to guarantee reliable vehicle operation, the maintenance department will regularly repair and maintain the vehicle equipment and the vehicle equipment to carry out a comprehensive overhaul and repair the equipment in the existence of faults or potential problems. City metro vehicle equipment mainly takes cycle maintenance and after-the-fact maintenance. Cycle maintenance is divided into equalization repair and frame overhaul, with equalization repair cycles ranging from 1 to 12 months. The frame overhaul is a comprehensive vehicle repair with an active life of 5/10 years. After-the-fact repair is for the vehicle equipment in the main line after failure, affecting the operation of direct repair.
A city subway for the vehicle equipment according to the impact of the failure of its fault state is divided, respectively, for the average working state (0), for no impact on the vehicle operation of the minor fault state (0.5), and the vehicle cannot continue to operate in the severe fault state (1). Therefore, the essential event state x i a i , representing the equipment in the T-S fault tree, is divided into three states. The corresponding intermediate and top events x i a i are also three states ( k i = η j = 3 ).
Equipment fault states in dynamic Bayesian networks are established as three states through T-S polymorphic fault trees [35]: regular operation (0), minor fault (0.5), and severe fault (1). Furthermore, as the vehicle is in operation, the equipment state may randomly shift to a worse state, i.e., fault escalation.
In this paper, the following assumptions are made when DBN is used to analyze the reliability of multistate systems: (1) if the actual events in the system T-S multistate fault tree are considered as the root nodes in DBN, then there are three states of 0, 0.5 and 1 at the root nodes in DBN; (2) the actual events may randomly transition to worse states during operation; (3) the state transfer rate is constant and exponentially distributed; (4) repair of equipment in a severe fault and restoration of equipment to regular operation after repair; (5) the system can also perform planned maintenance to avoid escalation of minor faults. The system is in as-new condition after planned maintenance, i.e., after planned maintenance, the state of the equipment can be repaired from a minor fault state and severe fault state to a regulation operation state (Section 4.4 analyzes the impact of planned maintenance on system reliability). The state transfer process of the root node in DBN is shown in Figure 3. λ is the failure rate in the state transfer process of this node and u is the maintenance rate in the multistate process of this node. When equipment is being maintained, planned maintenance is often carried out at the same time in order to save resources. Therefore, for the purpose of subsequent calculations, it is assumed that a severe fault to a regular operation and a minor fault to a regular operation have the same maintenance rate u [14].
The system state satisfies the discretization according to the above assumptions and after dividing the time segments by a dynamic Bayesian network, the process complies with the Markov assumption and the chi-squaredness assumption; (1) The state of the current moment is only related to the state of the previous moment; (2) For any moment t, the state transfer probability P ( X t | X t 1 ) is constant [35]. The number of state spaces is limited to three states. Thus, system state modeling can be performed by using Markov chains in dynamic Bayesian networks [14].
According to the assumption that the node failure state obeys the exponential distribution of failure rate λ, the corresponding transfer relationship table of the vehicle operation process without and with maintenance state can be obtained [1], as shown in Table 2 below. Planned maintenance is not included in the Consider maintenance. The logical relations in the table are the transfer probability calculation formulas for the transfer of each state of the node under t moments to each state under (t + Δt) moments.
T-S polymorphic fault trees transform the structure learning in DBN, and the specific rules are shown in Figure 2. The next-level input events in the T-S gate are similar to the parents in the conditional probability table of the Bayesian network. The upper-level output events are similar to the children. In contrast, the T-S gate rule satisfies the conditional probability and independence, so the T-S gate rule is used to assign the conditional probability table to the corresponding nodes in the Bayesian network. The dynamic changes of nodes in T-S gates in T-S multistate fault trees can be directly added with directed edges between time segments to complete the expansion from moment t to (t + Δt) moment, as shown in Figure 4.
The conditional probability table (CPT) in DBN can express the correlation between devices and the impact of different failure states of devices on system reliability. The CPT of DBN in this method is converted from the T-S gate rule, and the probability of failure of the output event can be calculated by the probability of failure of the T-S gate input event, which corresponds to the CPT in DBN.
Assuming that the probability of failure of the various fault states of the T-S gate input event is P 0 l = P ( x 1 a 1 ) P ( x 2 a 2 ) P ( x n a n ) , assuming that the probability of rule l getting executed is [30]:
P 0 l = P ( x 1 a 1 ) P ( x 2 a 2 ) P ( x n a n )
Thus, the probability of the output event y is:
P y b j = l = 1 r P 0 l P l ( y b j )
where P l ( y b j ) is the probability that the output event y is in state b j when the input event x 1 = x 1 a 1 , x 2 = x 2 a 2 , , x n = x n a n is in its respective state when rule l is executed, the value is obtained by processing expert fuzzy judging information through fuzzy theory.

3. Pantograph System Reliability Analysis Model

3.1. T-S Multistate Fault Tree of Pantograph System

Based on the vehicle failure log of the whole line network of a city’s rail transit vehicles in 2019–2021, combined with the selection of the pantograph-related failure data therein as the data source of the reliability indexes, and taking the single-arm type pantographs as the object of system analysis, combined with the experts in the field of rail transit vehicle repair and maintenance, the corresponding system T-S polymorphic failure tree was constructed and used for the subsequent dynamic reliability analysis.

3.1.1. Pantograph System

The typical single-arm pantograph structure is shown in Figure 5 [30], and a four-link mechanical mechanism is used to realize the action of lifting the pantograph; related electrical and pneumatic equipment provides power for the mechanical structure.

3.1.2. Pantograph T-S Multistate Fault Tree

Based on the rules of functional structure division of a city metro equipment and the typical fault components of a pantograph system with high frequency during the operation period of 2018–2021, after drawing the fault tree, the CVI and CVR assessment opinions of six experts for the event structure validity of a pantograph system were collected. After the modification of expert opinions, the T-S polymorphic fault tree was established, as shown in Figure 6. According to the Lawshe table, the minimum CVR value of 0.99 for six experts is required; the I-CVI value corresponding to six experts in the CVI evaluation needs to be greater than 0.83 to accept the event. From Equation (2), the CVI value of 1 is more significant than 0.99. The I-CVI value of each primary and intermediate event is also greater than 0.83. Therefore, 14 primary events and five intermediate events are identified.
The fault tree in x is the primary event; y is the intermediate event; T is the top event; and T-S gate 1 to gate 6 expresses the correlation between each gate input and output events. The meaning of each event is shown in Table 3.

3.1.3. Fuzzy Theory Constructs T-S Gate Rule

The construction of T-S gate rules requires establishing the number r of rules l and the probability P l ( y b j ) when the output event y is in state b j . This paper invites four experts to be fuzzy to evaluate the conditional probability parameter P l ( y b j ) for all T-S gates in the T-S multistate fault tree. The expert profiles are shown in Table 4, and the experts perform a fuzzy evaluation of the likelihood of state occurrence based on the Evaluation Language in Table 1 for the nodes that have a conditional probability table (in the form of Table 5) in the pantograph T-S polymorphic fault tree (Figure 5).
Due to the space limitation, the T-S gate 4 rule table construction process is listed in this paper. Establish the number l of rule r: the fault state k 6 = k 7 = k 8 = 3 of the input event x 6 , x 7 , x 8 , which is calculated by Equation (1) to obtain r = 27.
Collecting experts’ fuzzy evaluation information in rule l of r: For rule l ( x 6 k 6 = 0 , x 7 k 7 = 0 , x 8 k 8 = 1 ) as an example, the collected experts’ evaluation information is shown in Table 5.
Using the DUOWA operator to synthesize expert evaluation information, the data in Table 5 are calculated from Equations (3)–(7) to obtain the integrated fuzzy value W l , y b j = 0 :
W l , y b j = 0 = ( 0.027 , 0.053 , 0.127 , 0.227 ) W l , y b j = 0.5 = ( 0.198 , 0.298 , 0.324 , 0.424 ) W l , y b j = 1 = ( 0.525 , 0.625 , 0.675 , 0.775 )
Fuzzy removal of the integrated fuzzy value W l , y b j yields the exact probability parameter and normalizes it to obtain P l ( y b j ) from Equations (8) and (9) to obtain:
P l ( y b j = 0 ) = 0.101 , P l ( y b j = 0.5 ) = 0.291 , P l ( y b j = 1 ) = 0.608 .
Repeat steps 1 to 4 one by one to obtain P l ( y b j ) and the 27 rules l in T-S gate 4 to obtain the T-S gate 4 rules, shown in Table 6. Obtain the remaining T-S gate parameters one by one by the above method.

3.2. Dynamic Bayesian Network

This paper’s reliability data are obtained from a city metro 2018~2021 vehicle fault log and metro vehicle equalization repair manual for the whole network. The failure rate λ1, λ2, and the state repair rate u for equipment states from 0 to 0.5 and 0 to 1 are collated in Figure 2. In addition, the escalation of faults during equipment operation states from 0.5 to 1 cannot be observed practically, so λ3 = λ1 [14] is assumed, and the specific parameters are shown in Table 7.
According to the principle of constructing a Bayesian network for T-S polymorphic fault tree construction in Figure 2, the T-S polymorphic fault tree of a pantograph system (Figure 6) is transformed into a DBN (shown in Figure 7). The conditional probability table of each node in the DBN can be output according to the T-S gate rule constructed in Section 2.2. The interval Δt is set to 1 day in the DBN inference process. Each device’s initial time interval t = 0 is entirely reliable, i.e., the prior probability of the root node is 1.

4. Reliability Analysis of Pantograph System

4.1. System Reliability Assessment

A pantograph system’s reliability reflects the ability of the system components and subsystems to maintain regular operation within a specified period, and the DBN model can be used to positively infer the immediate reliability of the system to measure the system reliability. According to the equipment’s failure rate and maintenance rate in Table 7, substitute the formula in Table 2 to obtain the state transfer table without and with the maintenance of each root node of DBN during the vehicle operation, respectively. The state transfer table without maintenance and with maintenance will be substituted into the root node, and the operation time will be set to obtain the system reliability curve with time, as shown in Figure 8. The system reliability of a pantograph system declined continuously during 720 days of operation. On day 720, the system reliability dropped to 0.881 for the system without maintenance and 0.952 for the system with maintenance.
The dynamic reliability of the pantograph, arch frame, electrical parts, pneumatic parts, arch body, and frame are compared and analyzed, and the results are shown in Figure 9.
By comparing the reliability of the overall system and intermediate components without and with maintenance in Figure 8 and Figure 9, it is found that the reliability with maintenance is significantly higher than the reliability without maintenance. Therefore, different overhaul cycles can be formulated according to the reliability change curves of different sub-components so as to improve the maintenance rate of the system and reduce the probability of upgrading the fault state, thus improving the reliability of a pantograph system. The results of this reliability analysis can be used as a reference for the subsequent optimization of the maintenance of system components.

4.2. Sensitivity Analysis

Since the state transfer input of DBN is mainly calculated based on the equipment failure rate and maintenance rate, the sensitivity analysis can be achieved by ensuring that the failure rate of other equipment remains unchanged and adjusting the failure rate of individual equipment to 120% and 80% of the initial failure rate to obtain the reliability of the system after the change of failure rate of this equipment [35]. The results are shown in Figure 10. The sensitivity of each piece of equipment is analyzed by the values change.
Figure 10 shows that equipment failure rates change individually to affect system reliability in the following order: x4Drop bow indicator > x5Electrical control box > x3Lifting bow motor > x6Valve box > x8Solenoid Valve > x7Lifting bow cylinder > x1Underframe insulator > x2Lifting bow spring assembly > x11Horn > x10Spring Box > x12Upper and lower frames > x9Bracket > x13Bearing > x14Damper. The weak equipment is the drop bow indicator, the electrical control box, and the lifting bow motor.
A comparative analysis of the serviced and non-serviced systems showed that the change in reliability of the serviced system was less than the change in reliability of the non-serviced system when the failure rate of an identical device was changed to 120% or 80%. Therefore, for a maintenance-free system, the change in the failure rate of a single device has a more significant impact on its reliability.
Birnbaum’s probabilistic importance is one of the important parameters in reliability analysis. It is used to describe the impact of the state change of each root node in the network on the overall reliability of the system. Birnbaum probabilistic importance is based on the static failure behavior, and based on the method of calculating the Birnbaum probability of importance of the T-S polymorphic fault tree [6], we obtain the Birnbaum probabilistic importance from x1~x14, which are shown in Table 8.
The events with greater probabilistic importance are x4Drop bow indicator, x5Electrical control box, and x3Lifting bow motor. The comparison in Figure 9 reveals that the results of the weak components of the system obtained by sensitivity analysis and Birnbaum’s probabilistic importance analysis are consistent.

4.3. Failure Escalation Probability Impact Analysis

For each device of the pantograph system, the fault escalation probability λ3 is increased by 25% over the value given in Table 7, and the reliability analysis of the system is performed to obtain the system reliability, as shown in Figure 11. The results show that the system reliability decreases as the probability of fault escalation increases; the effect of fault escalation on a maintenance-free system is more pronounced than that of a system with maintenance. Therefore, the probability of fault escalation should be reduced as much as possible to improve the pantograph system’s performance.

4.4. System Preventive Maintenance Strategy Analysis

In order to further enhance the reliability of the pantograph system, preventive system maintenance can be adopted based on the original maintenance strategy [35], and this maintenance method can effectively reduce the escalation of failure of system components. The state transfer relationship table with maintenance cases in Table 2 is amended as follows:
P ( X ( t + Δ t ) = 0 | X ( t ) = 0.5 ) = u ( 1 e ( λ 3 + u ) Δ t ) λ 3 + u P ( X ( t + Δ t ) = 0 . 5 | X ( t ) = 0.5 ) = e ( λ 3 + u ) Δ t P ( X ( t + Δ t ) = 1 | X ( t ) = 0.5 ) = λ 3 ( 1 e ( λ 3 + u ) Δ t ) λ 3 + u
According to the modified state transfer relationship table with the maintenance situation, the dynamic reliability analysis of the pantograph system is performed, and the system reliability is obtained in Figure 12.
The graph shows that the system’s reliability gradually decreases at the beginning of the operation and reaches a steady-state reliability of about 0.9968 after preventive maintenance is applied, proving that preventive maintenance can effectively avoid equipment failure and fault escalation. The reliability of the pantograph system is significantly improved.

5. Conclusions

This study proposes a dynamic reliability assessment method for a pantograph system based on a multistate T-S fault tree, dynamic Bayesian and fuzzy theory, involving its time dependence and causality uncertainty. The system reliability of pantographs during operation is analyzed, and the following conclusions are obtained.
(1)
The system reliability of pantographs without and with maintenance during 720 days of operation is analyzed, and the system reliability decreases continuously during this period. At day 720, the system reliability decreases to 0.881 for the no-maintenance case and 0.952 for the with-maintenance case. Maintenance during operation can effectively improve the system reliability of pantographs and reduce the system affected by equipment failure escalation; the sensitivity of the no-maintenance pantograph system to equipment failure rate is greater than that of the with-maintenance pantograph system;
(2)
According to the equipment sensitivity analysis, the order of concern for equipment in the pantograph system should be: Drop bow indicator > Electrical control box > Lifting bow motor > Valve box > Solenoid Valve > Lifting bow cylinder > Underframe insulator > Lifting bow spring assembly > Sheep’s horn > Spring Box > Upper and lower frames > Bracket > Bearing > Damper. The weak equipment is the drop bow indicator, the electrical control box, and the lifting bow motor;
(3)
The impact of fault escalation on the pantograph system reliability is analyzed and verified that the use of a preventive maintenance strategy can further improve the pantograph system reliability and gradually reach the steady-state reliability of about 0.9968.
The above analysis results verify that the system reliability curve obtained based on the DBN model is mainly affected by the failure rate and maintenance rate; therefore, the system reliability can be improved from these two aspects. The weak links in the system can be designed with redundancy and derating in the early design stage of the system to reduce the failure rate; the overhauling cycle of these components can also be shortened, or real-time status monitoring can be carried out to improve the maintenance rate, thus realizing the goal of improving the reliability of a pantograph system.

Author Contributions

Conceptualization, Y.C. and J.W.; methodology, Y.C.; software, Y.C.; validation, Y.C., J.W. and Y.T.; formal analysis, Y.C.; investigation, Y.C.; resources, J.W.; data curation, J.W.; writing—original draft preparation, Y.C.; writing—review and editing, Y.C., J.W., Y.T., S.Z., Q.Z. and X.C.; visualization, Y.C.; supervision, J.W., S.Z., Q.Z. and X.C.; project administration, J.W. and Q.Z. All authors have read and agreed to the published version of the manuscript.

Funding

Supported by National Natural Science Foundation of China (Grant No. 51975347).

Institutional Review Board Statement

Not applicable.

Informed Consent Statement

Not applicable.

Data Availability Statement

The data presented in this study are available on re-quest from the corresponding author. The data are not publicly available due to data is internal information of the cooperation organization.

Conflicts of Interest

The authors declare no conflict of interest.

References

  1. Zhou, F.; Wu, C.; Zhang, Z. Research on Structural reliability and reliability sensitivity of EMU pantograph. IOP Conf. Ser. Mater. Sci. Eng. 2021, 1043, 052060. [Google Scholar] [CrossRef]
  2. Song, D.; Zhang, W.; Zhou, N.; Mei, G. Fatigue Lifetime Design Method and Program Development of Pantograph V500 Based on Reliability. J. Comput. 2012, 7, 1252–1260. [Google Scholar] [CrossRef]
  3. Song, D.; Zhang, W.; He, P.; Jiang, Y.; Zhou, N. Reliability analysis ofTSG19-type pantograph based on time-dependent parameters. Eng. Fail. Anal. 2013, 35, 153–163. [Google Scholar] [CrossRef]
  4. Sahu, A.R.; Palei, S.K.; Mishra, A. Data-driven fault diagnosis approaches for industrial equipment: A review. Expert Syst. 2023, e13360. [Google Scholar] [CrossRef]
  5. Luo, X.; Li, Y.; Bai, X.; Tang, R.; Jin, H. A novel approach based on fault tree analysis and Bayesian network for multi-state reliability analysis of complex equipment systems. Proc. Inst. Mech. Eng. Part O J. Risk Reliab. 2023; in print. [Google Scholar] [CrossRef]
  6. Zhang, X.; Deng, Z.; Jian, Y.; Huang, Q.; Peng, H.; Ma, Q. Reliability analysis of nuclear safety-class DCS based on T-S fuzzy fault tree and Bayesian network. Nucl. Eng. Technol. 2023, 55, 1901–1910. [Google Scholar] [CrossRef]
  7. Fahmy, R.A.; Selim, H.K. Application of dynamic fault tree technique in safety assessment for the containment spray system of nuclear power plant. Electr. Eng. 2023, 105, 1–11. [Google Scholar] [CrossRef]
  8. Niloofar, P.; Lazarova-Molnar, S. Collaborative data-driven reliability analysis of multi-state fault trees. Proc. Inst. Mech. Eng. Part O J. Risk Reliab. 2022, 237, 886–896. [Google Scholar] [CrossRef]
  9. Akhtar, I.; Kirmani, S. An Application of Fuzzy Fault Tree Analysis for Reliability Evaluation of Wind Energy System. IETE J. Res. 2020, 68, 4265–4278. [Google Scholar] [CrossRef]
  10. Jiang, H.; Lin, C.; Feng, G.; Xu, E.; Zheng, W. Reliability Analysis of the High-Voltage Power Battery System Based on the Polymorphic Fuzzy Fault Tree. J. Sens. 2022, 2022, 2455345. [Google Scholar] [CrossRef]
  11. Sun, H.; Xu, L.; Jiang, G.; Chen, H. Reliability Analysis of Tape Winding Hydraulic System Based on Continuous-Time T-S Dynamic Fault Tree. Math. Probl. Eng. 2022, 2022, 8499605. [Google Scholar] [CrossRef]
  12. Gui, M.; Sui, Y.; Ding, R.; Xing, S.; Yu, T.; Xu, J.; Yang, B.; Meng, F. An Approach for the Dynamic Reliability Assessment of the Digital Power Control System for Nuclear Reactor. Front. Energy Res. 2022, 10, 877933. [Google Scholar] [CrossRef]
  13. Weber, P.; Medina-Oliva, G.; Simon, C.; Iung, B. Overview on Bayesian networks applications for dependability, risk analysis and maintenance areas. Eng. Appl. Artif. Intell. 2012, 25, 671–682. [Google Scholar] [CrossRef]
  14. Cai, B.; Liu, Y.; Zhang, Y.; Fan, Q.; Yu, S. Dynamic bayesian networks based performance evaluation of subsea blowout preventers in presence of imperfect repair. Expert Syst. Appl. 2013, 40, 7544–7554. [Google Scholar] [CrossRef]
  15. Ding, R.; Liu, Z.; Xu, J.; Meng, F.; Sui, Y.; Men, X. A novel approach for reliability assessment of residual heat removal system for HPR1000 based on failure mode and effect analysis, fault tree analysis, and fuzzy Bayesian network methods. Reliab. Eng. Syst. Saf. 2021, 216, 107911. [Google Scholar] [CrossRef]
  16. Küçüker, F.U.; Yet, B. Reliability prediction for aircraft fleet operators: A Bayesian network model that combines supplier estimates, maintenance data and expert judgement. J. Oper. Res. Soc. 2022, 2022, 2129486. [Google Scholar] [CrossRef]
  17. Li, H.; Soares, C.G.; Huang, H.-Z. Reliability analysis of a floating offshore wind turbine using Bayesian Networks. Ocean Eng. 2020, 217, 107827. [Google Scholar] [CrossRef]
  18. Gao, Y.; Zhang, L.; Zhou, J.; Wei, B.; Yan, Z. Research on reliability of centrifugal compressor unit based on dynamic Bayesian network of fault tree mapping. J. Mech. Sci. Technol. 2023, 37, 2667–2677. [Google Scholar] [CrossRef]
  19. Bai, X.; Ling, H.; Luo, X.-F.; Li, Y.-S.; Yang, L.; Kang, J.-C. Reliability and availability evaluation on hydraulic system of ship controllable pitch propeller based on evidence theory and dynamic Bayesian network. Ocean Eng. 2023, 276, 114125. [Google Scholar] [CrossRef]
  20. Li, M.; Zhang, R.; Chen, X.; Liu, K. Assessment of underwater navigation safety based on dynamic Bayesian network facing uncertain knowledge and various information. Front. Mar. Sci. 2022, 9, 1069841. [Google Scholar] [CrossRef]
  21. Liu, K.; Qi, J.; Zhou, Z.; Sun, Y.; Guo, K. Multistate time lag dynamic Bayesian networks model for reliability prediction of smart meters. Microelectron. Reliab. 2022, 138, 114606. [Google Scholar] [CrossRef]
  22. Zha, Y.; Liu, J.; Zhang, R.; Liu, T.; He, Q. Multi-state system reliability analysis methods based on Bayesian networks merging dynamic and fuzzy fault information. Int. J. Reliab. Saf. 2019, 13, 44. [Google Scholar] [CrossRef]
  23. Zheng, W.; Jiang, H.; Li, S.; Ma, Q. Reliability Analysis of High-Voltage Drive Motor Systems in Terms of the Polymorphic Bayesian Network. Mathematics 2023, 11, 2378. [Google Scholar] [CrossRef]
  24. Bi, Z.; Li, C.; Li, X.; Gao, H. Research on Fault Diagnosis for Pumping Station Based on T-S Fuzzy Fault Tree and Bayesian Network. J. Electr. Comput. Eng. 2017, 2017, 6175429. [Google Scholar] [CrossRef]
  25. Pa, J. A New Dynamic Fault Tree Analysis Method of Electromagnetic Brakes Based on Bayesian Network Accompanying Wiener Process. Symmetry 2022, 14, 968. [Google Scholar] [CrossRef]
  26. Chen, W.; Wang, H.; Zhang, G.; Wang, C.; Zhong, G. Evaluation of Tunnel Collapse Susceptibility Based on T-S Fuzzy Fault Tree and Bayesian Network. J. Shanghai Jiaotong Univ. 2020, 54, 820–830. [Google Scholar]
  27. Fereydoon, L.; Mostafa, P.; Javad, J.M.; Nourai, F.; Hosseini, A.A.; Khanteymoori, A. Technical, human, and organizational factors affecting failures of firefighting systems (fss) of atmospheric storage tanks: Providing a risk assessment approach using fuzzy bayesian network (fbn) and content validity indicators. J. Loss Prev. Process Ind. 2020, 65, 104157. [Google Scholar]
  28. Lawshe, H.C. A quantitative approach to content validity1. Pers. Psychol. 1975, 28, 563–575. [Google Scholar] [CrossRef]
  29. Almanasreh, E.; Moles, R.; Chen, T.F. Evaluation of methods used for estimating content validity. Res. Soc. Adm. Pharm. 2019, 15, 214–221. [Google Scholar] [CrossRef]
  30. Song, L.-L.; Wang, T.-Y.; Song, X.-W.; Xu, L.; Song, D.-G. Research and Application of FTA and Petri Nets in Fault Diagnosis in the Pantograph-Type Current Collector on CRH EMU Trains. Math. Probl. Eng. 2015, 2015, 169731. [Google Scholar] [CrossRef]
  31. Yazdi, M. A Question on Using Fuzzy Set Theory and Its Extensions in Safety and Reliability. CRPASE Trans. Ind. Eng. 2020, 6, 203–209. [Google Scholar]
  32. Xu, Z. Dependent uncertain ordered weighted aggregation operators. Inf. Fusion 2008, 9, 310–316. [Google Scholar] [CrossRef]
  33. Daas, S.; Innal, F. Unavailability Assessment Based on Improved-Dependent Uncertain Ordered Weighted Averaging Operator and Fault Tree Analysis. Int. J. Reliab. Qual. Saf. Eng. 2023, 23, 2350018. [Google Scholar] [CrossRef]
  34. Murphy, K.P. Dynamic Bayesian Networks: Representation, Inference and Learning; University of California: Berkeley, CA, USA, 2002. [Google Scholar]
  35. Wang, C.; Liu, Y.; Hou, W.; Wang, G.; Zheng, Y. Reliability and availability modeling of Subsea Xmas tree system using Dynamic Bayesian network with different maintenance methods. J. Loss Prev. Process Ind. 2020, 64, 104066. [Google Scholar] [CrossRef]
Figure 1. Theoretical framework for the approach.
Applsci 13 10711 g001
Figure 2. T-S multistate fault tree construction Bayesian network flow chart.
Applsci 13 10711 g002
Figure 3. Root node multistate transition diagram.
Applsci 13 10711 g003
Figure 4. T-S gate conversion.
Applsci 13 10711 g004
Figure 5. Pantograph structure diagram.
Applsci 13 10711 g005
Figure 6. Pantograph T-S multistate fault tree.
Applsci 13 10711 g006
Figure 7. Pantograph system DBN.
Applsci 13 10711 g007
Figure 8. Pantograph system reliability. (a) No maintenance. (b) Maintenance.
Applsci 13 10711 g008
Figure 9. Pantograph mid-component reliability. (a) No maintenance. (b) Maintenance.
Applsci 13 10711 g009
Figure 10. Sensitivity analysis of pantograph equipment. (a) No maintenance. (b) Maintenance.
Applsci 13 10711 g010
Figure 11. Effect of failure escalation probability on system reliability.
Applsci 13 10711 g011
Figure 12. Pantograph reliability with preventive maintenance.
Applsci 13 10711 g012
Table 1. Fuzzy number form and λ-cut set.
Evaluation LanguageFuzzy Number Formλ-Cut Set
Very low f 1 = ( 0 , 0 , 0.1 , 0.2 ) f 1 λ = [ 0 , 0.1 λ + 0.2 ]
Low f 2 = ( 0.1 , 0.2 , 0.3 ) f 2 λ = [ 0.1 λ + 0.1 , 0.1 λ + 0.3 ]
Comparatively low f 3 = ( 0.2 , 0.3 , 0.4 , 0.5 ) f 3 λ = [ 0.1 λ + 0.2 , 0.1 λ + 0.5 ]
Moderate f 4 = ( 0.4 , 0.5 , 0.6 ) f 4 λ = [ 0.1 λ + 0.4 , 0.1 λ + 0.6 ]
Comparatively high f 5 = ( 0.5 , 0.6 , 0.7 , 0.8 ) f 5 λ = [ 0.1 λ + 0.5 , 0.1 λ + 0.8 ]
High f 6 = ( 0.7 , 0.8 , 0.9 ) f 6 λ = [ 0.1 λ + 0.7 , 0.1 λ + 0.9 ]
Very high f 7 = ( 0.8 , 0.9 , 1 , 1 ) f 7 λ = [ 0.1 λ + 0.8 , 1 ]
Table 2. Root node state transfer relationship table.
No Consideration for Maintenance
t00.51
t + Δt
0 e ( λ 1 + λ 2 ) Δ t 00
0.5 λ 1 λ 1 + λ 2 ( 1 e ( λ 1 + λ 2 ) Δ t ) e λ 3 Δ t 0
1 λ 2 λ 1 + λ 2 ( 1 e ( λ 1 + λ 2 ) Δ t ) 1 e λ 3 Δ t 1
Consider maintenance
t00.51
t + Δt
0 e ( λ 1 + λ 2 ) Δ t 0 1 e u Δ t
0.5 λ 1 λ 1 + λ 2 ( 1 e ( λ 1 + λ 2 ) Δ t ) e λ 3 Δ t 0
1 λ 2 λ 1 + λ 2 ( 1 e ( λ 1 + λ 2 ) Δ t ) 1 e λ 3 Δ t e u Δ t
Table 3. Meaning of each event in the pantograph T-S multistate fault tree.
Event CodeEvent NameEvent CodeEvent Name
TPantograph failurex5Electrical control box failure
y1Damage to the bow framex6Valve box failure
y2Electrical component failurex7Lifting bow cylinder failure
y3Pneumatic component failurex8Solenoid valve failure
y4Bowhead damagex9Bracket broken deformation
y5Frame deformation failurex10Spring box failure
x1Bottom frame insulator brokenx11Horn damage
x2Lifting bow spring assembly failurex12Deformation failure of upper and lower frames (upper and lower frames, lower arm bars, tension bar)
x3Lifting bow/dropping bow motor failurex13Bearing failure
x4Drop bow indicator failurex14Damper failure
Table 4. Expert profile.
ExpertJob TitleLevel of EducationWork Experience (Years)Age (Years)
1Mechanical EngineerBEng20–2940–49
2Service EngineerBEng20–2940–49
3Electrical EngineerMEng20–2940–49
4System EngineerMEng20–2940–49
Table 5. Expert fuzzy evaluation information.
Rule l Corresponds to the p Fuzzy Evaluation
Expert y b j = 0 y b j = 0.5 y b j = 1
1 f 1 = ( 0,0 , 0.1,0.2 ) f 2 = ( 0.1,0.2,0.3 ) f 5 = ( 0.5,0.6,0.7,0.8 )
2 f 1 = ( 0,0 , 0.1,0.2 ) f 3 = ( 0.2,0.3,0.4,0.5 ) f 5 = ( 0.5,0.6,0.7,0.8 )
3 f 2 = ( 0.1,0.2,0.3 ) f 4 = ( 0.4,0.5,0.6 ) f 6 = ( 0.7,0.8,0.9 )
4 f 1 = ( 0,0 , 0.1,0.2 ) f 2 = ( 0.1,0.2,0.3 ) f 4 = ( 0.4,0.5,0.6 )
Table 6. T-S gate 4 rules.
Rule l x 6 x 7 x 8 y 3
y b j = 0 y b j = 0.5 y b j = 1
1000100
2000.50.7610.1360.103
30010.1310.5080.361
400.500.7690.1310.100
500.50.50.2000.6440.156
600.510.0970.5270.376
70100.1970.4960.307
¦¦¦¦¦¦¦
27111001
Table 7. Pantograph basic component reliability parameters.
EventFailure Transfer Rate/hMaintenance Rate/h
λ1λ2u
x15.492 × 10−64.145 × 10−70.004006
x23.938 × 10−63.11 × 10−70.004004
x34.87 × 10−64.145 × 10−70.004006
x45.907 × 10−616.58 × 10−70.004007
x53.731 × 10−610.363 × 10−70.004004
x65.389 × 10−65.181 × 10−70.001339
x78.808 × 10−67.254 × 10−70.001343
x812.23 × 10−610.363 × 10−70.004013
x93.109 × 10−61.036 × 10−70.004004
x103.523 × 10−61.036 × 10−70.004006
x115.596 × 10−63.109 × 10−70.004007
x124.56 × 10−62.073 × 10−70.004005
x132.964 × 10−61.036 × 10−70.001337
x142.383 × 10−63.109 × 10−70.004004
Table 8. Importance probability of each root node.
Serial No.Event No.Importance Rating
1x40.141770062
2x50.128267513
3x30.120981474
4x60.104270695
5x80.099751569
6x70.093909716
7x10.089855377
8x20.081308671
9x110.056126967
10x100.055185346
11x120.04983954
12x90.04948821
13x130.048852713
14x140.048052733
Disclaimer/Publisher’s Note: The statements, opinions and data contained in all publications are solely those of the individual author(s) and contributor(s) and not of MDPI and/or the editor(s). MDPI and/or the editor(s) disclaim responsibility for any injury to people or property resulting from any ideas, methods, instructions or products referred to in the content.

