
Performance of the Dual-Chamber Fungal Fuel Cell in Treating Tannery Wastewater

 ,
,  , ,
, ,  ,
,  and
and
Abstract
:1. Introduction
2. Materials and Methods
2.1. Fungal Communities in Tannery Wastewater
2.2. Training of Fungal Strains on Hexavalent Chromium Solution
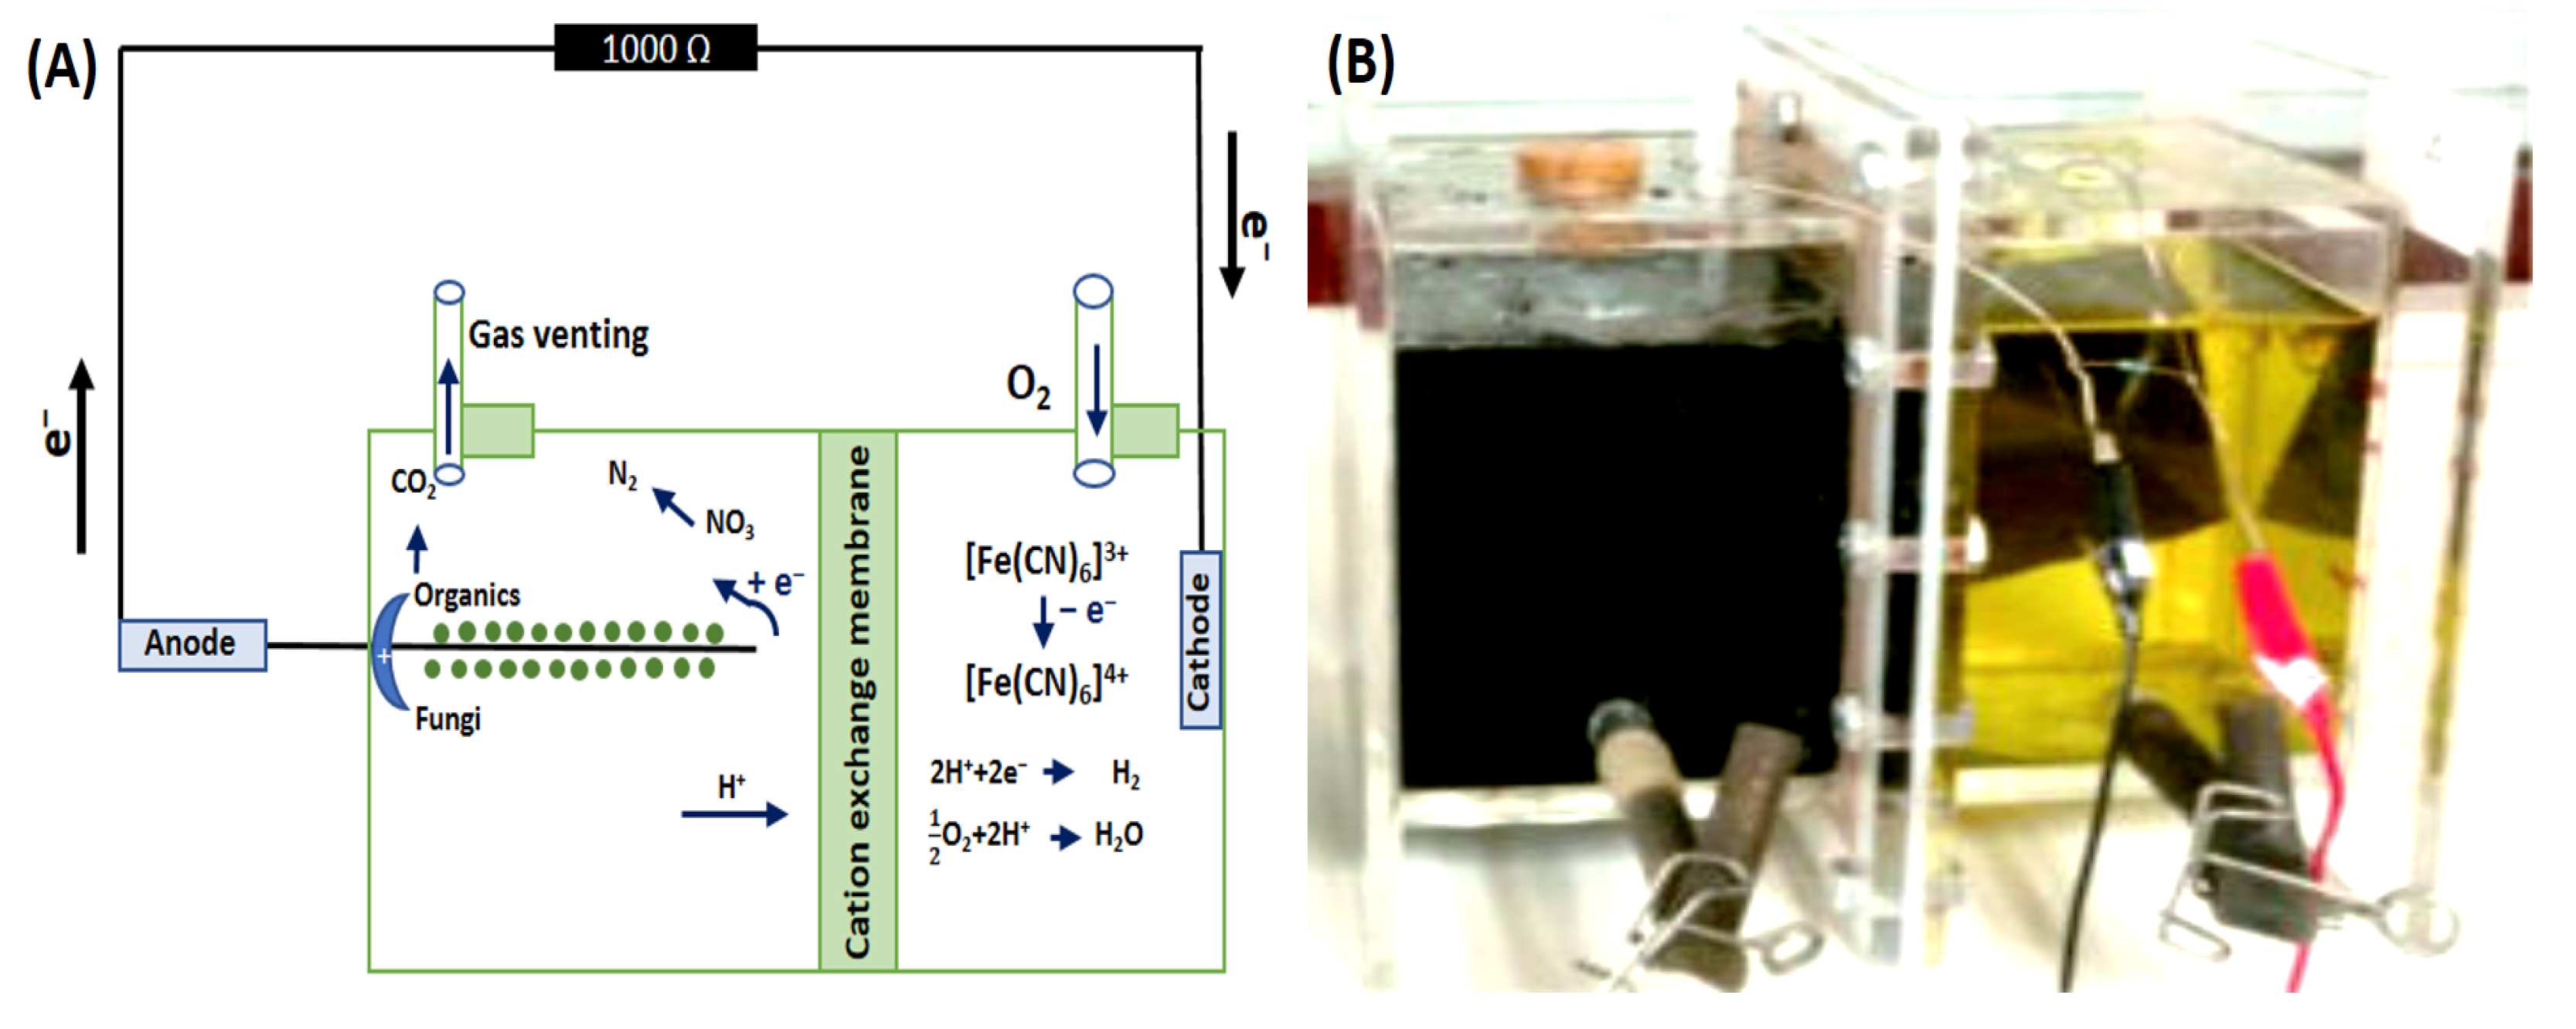
2.3. FFCs Operational Set-Up
2.4. Analytical Methods
2.5. Statistical Analysis
3. Results and Discussion
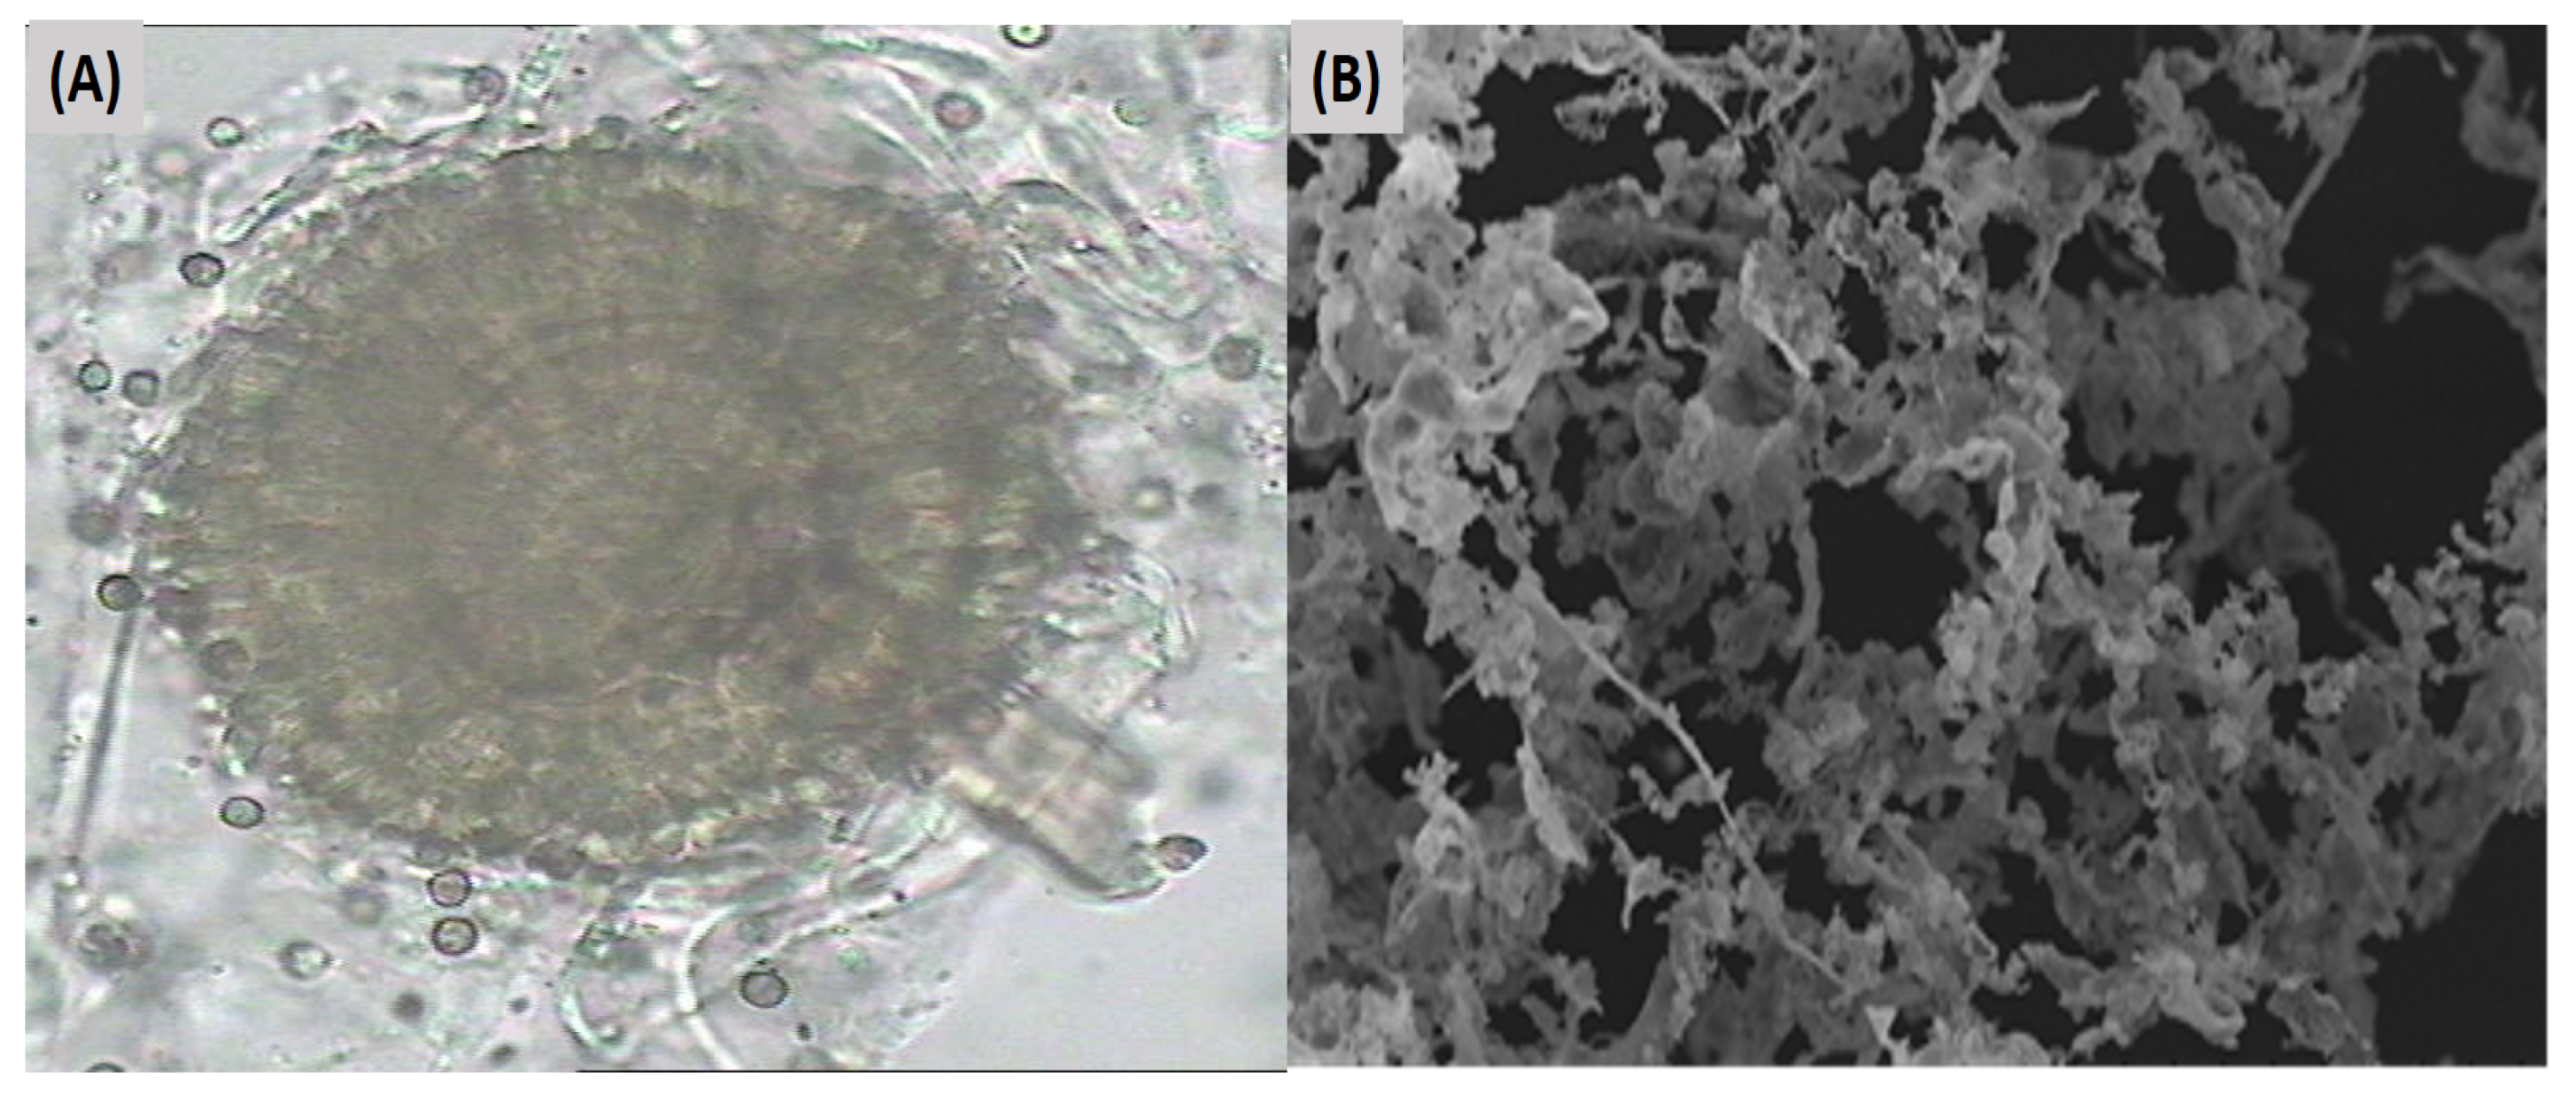
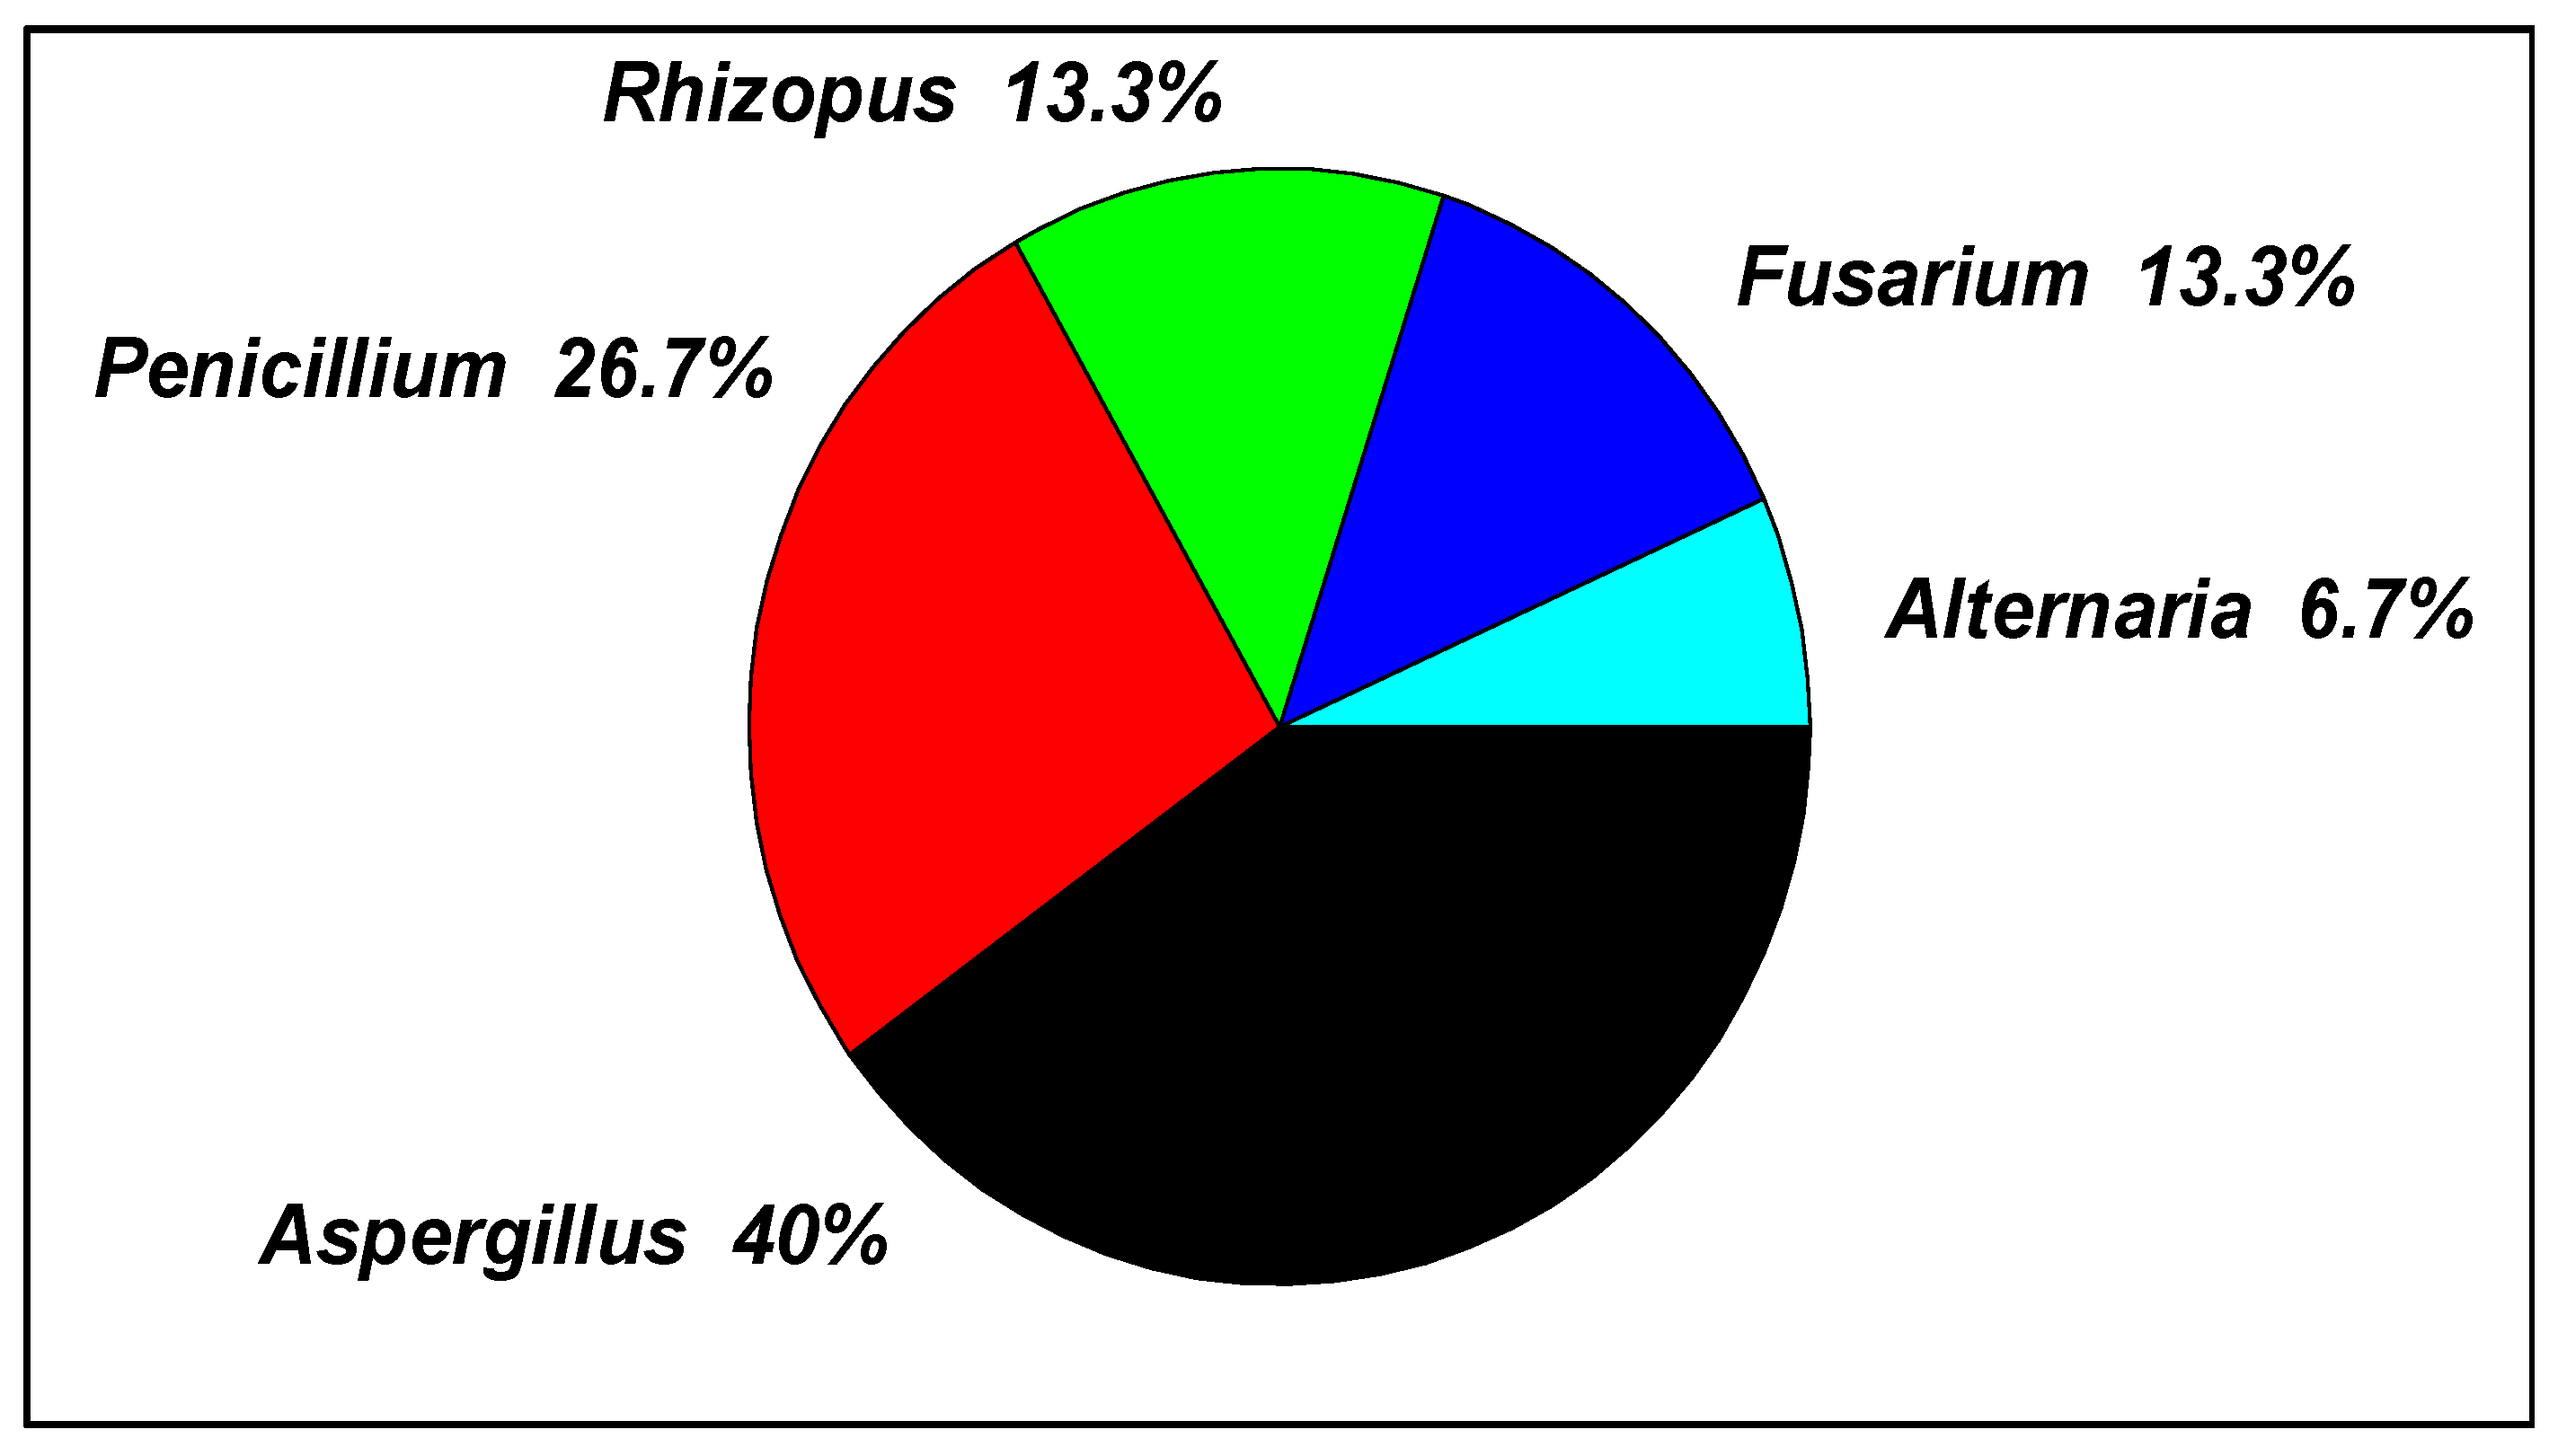
3.1. Fungal Communities in Tannery Wastewater
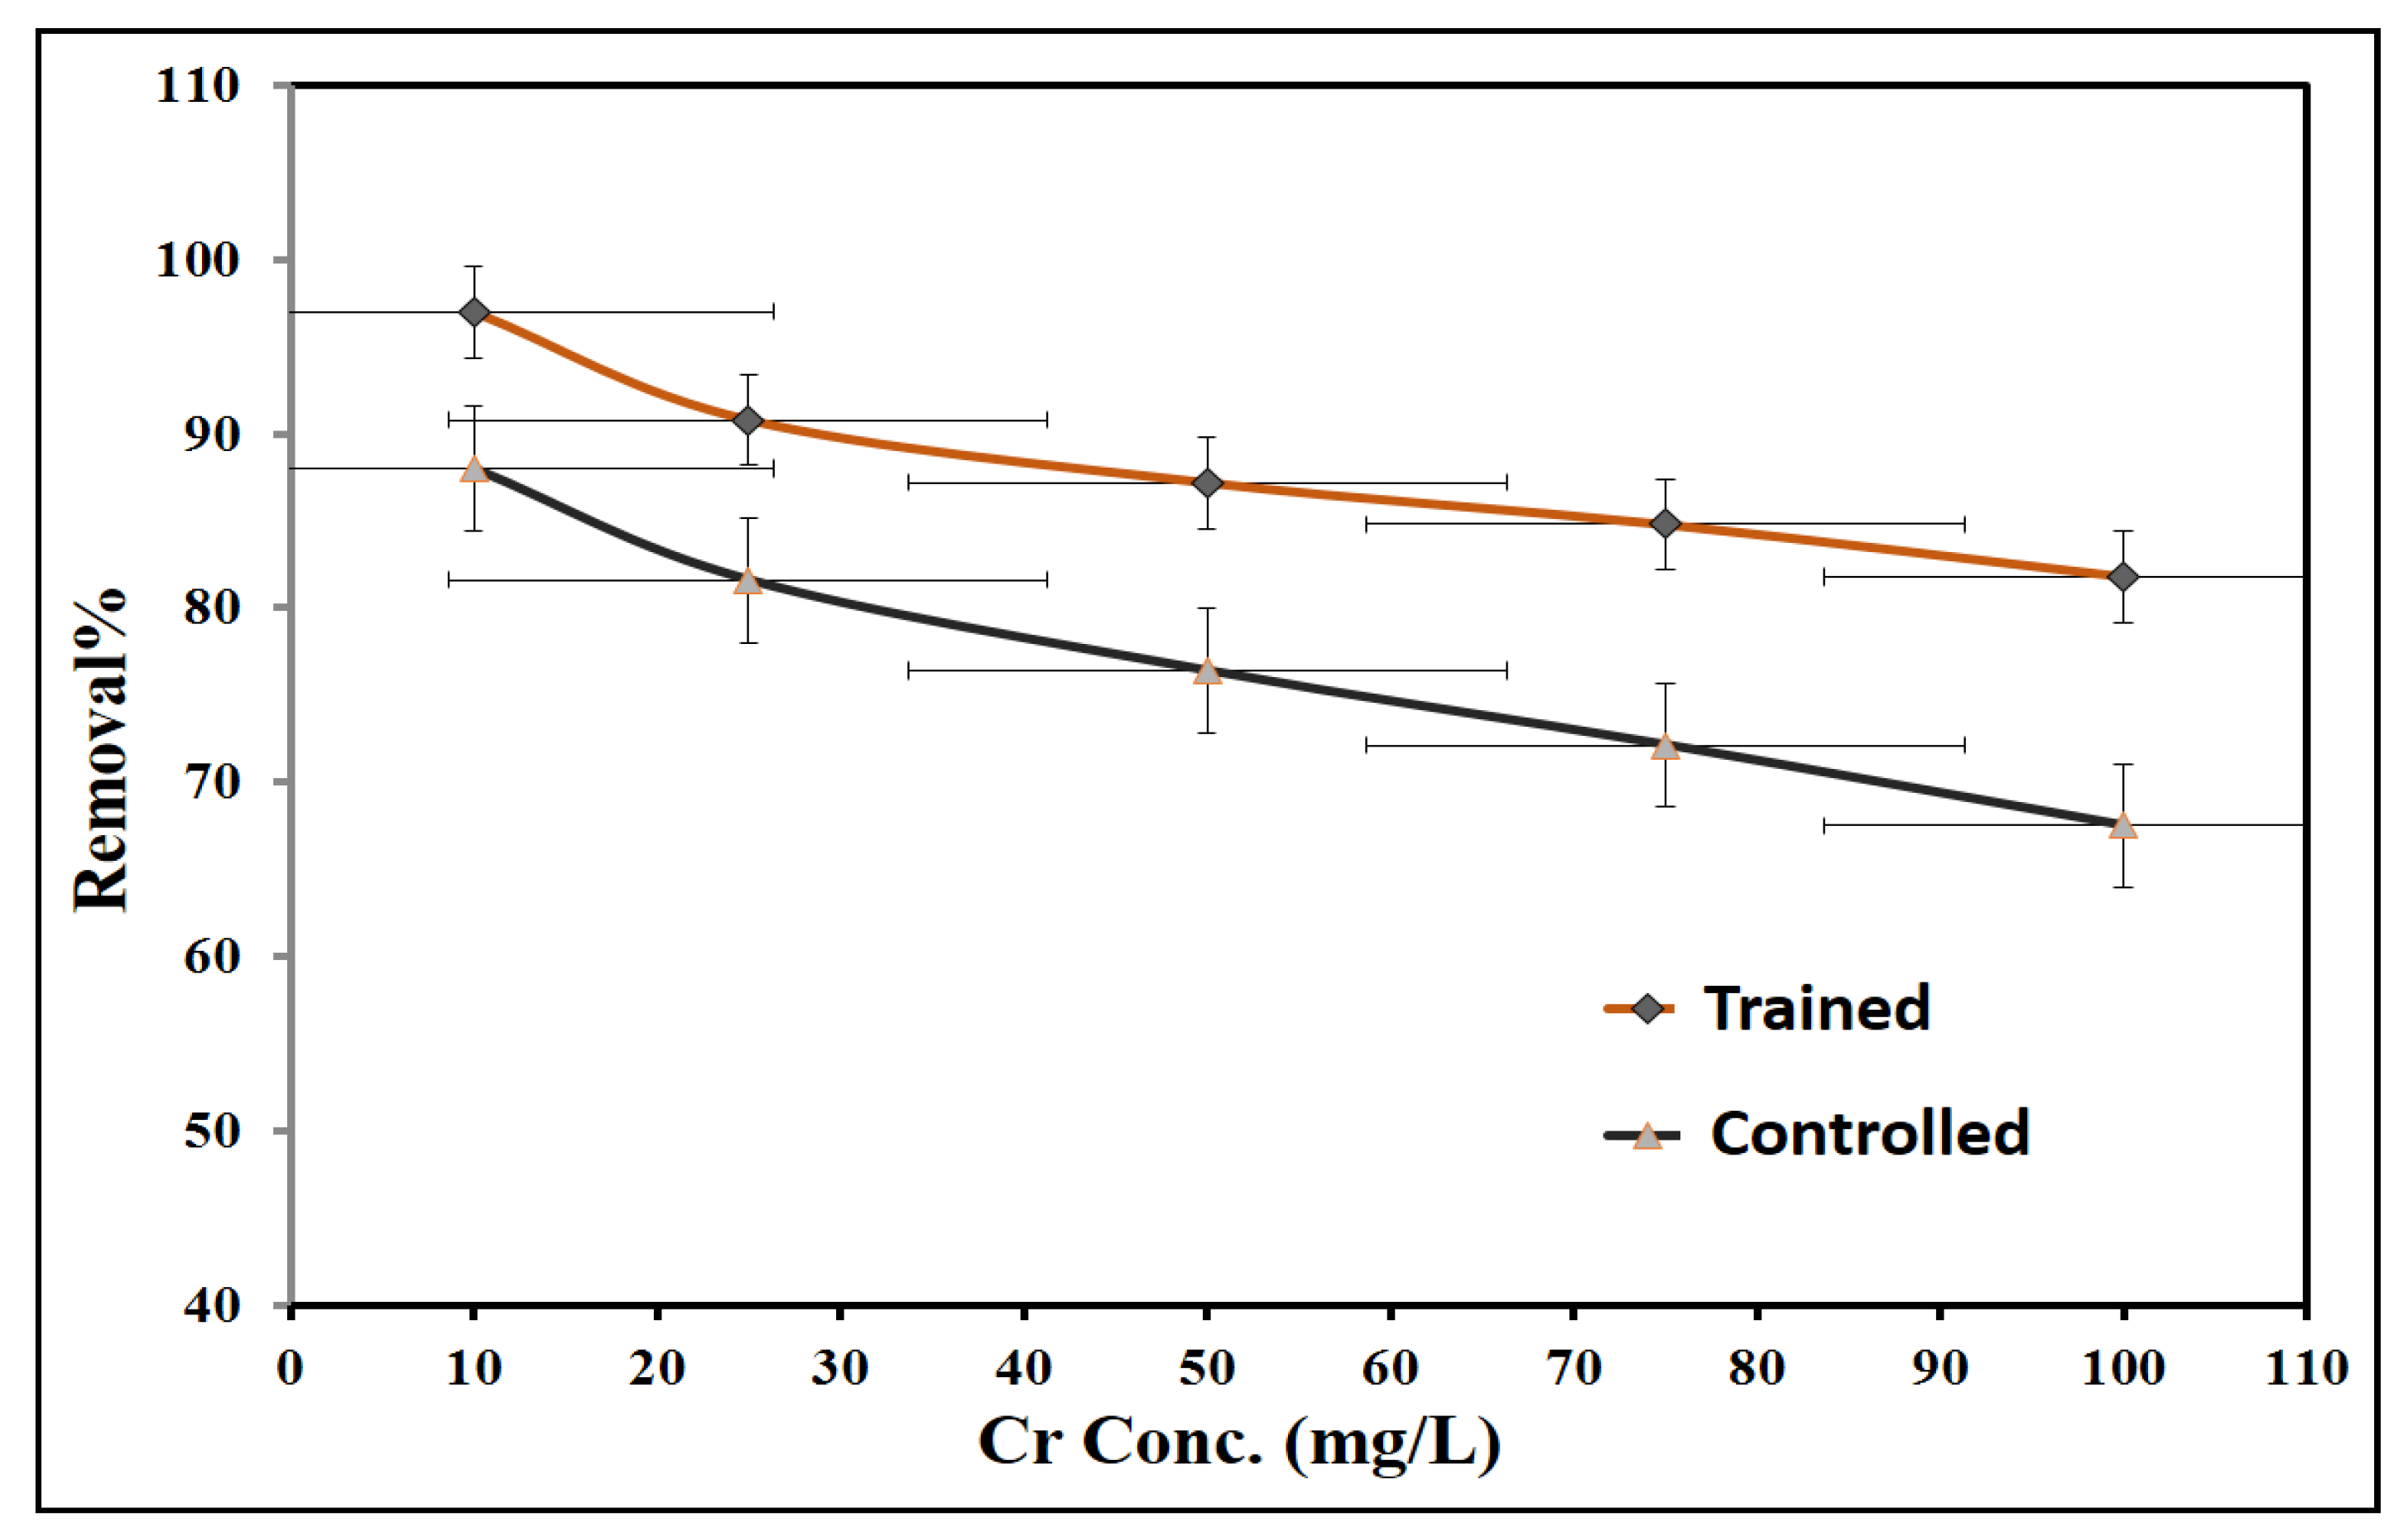
3.2. Training of Fungal Strains on Hexavalent Chromium Solution
3.3. Adsorption Isotherm
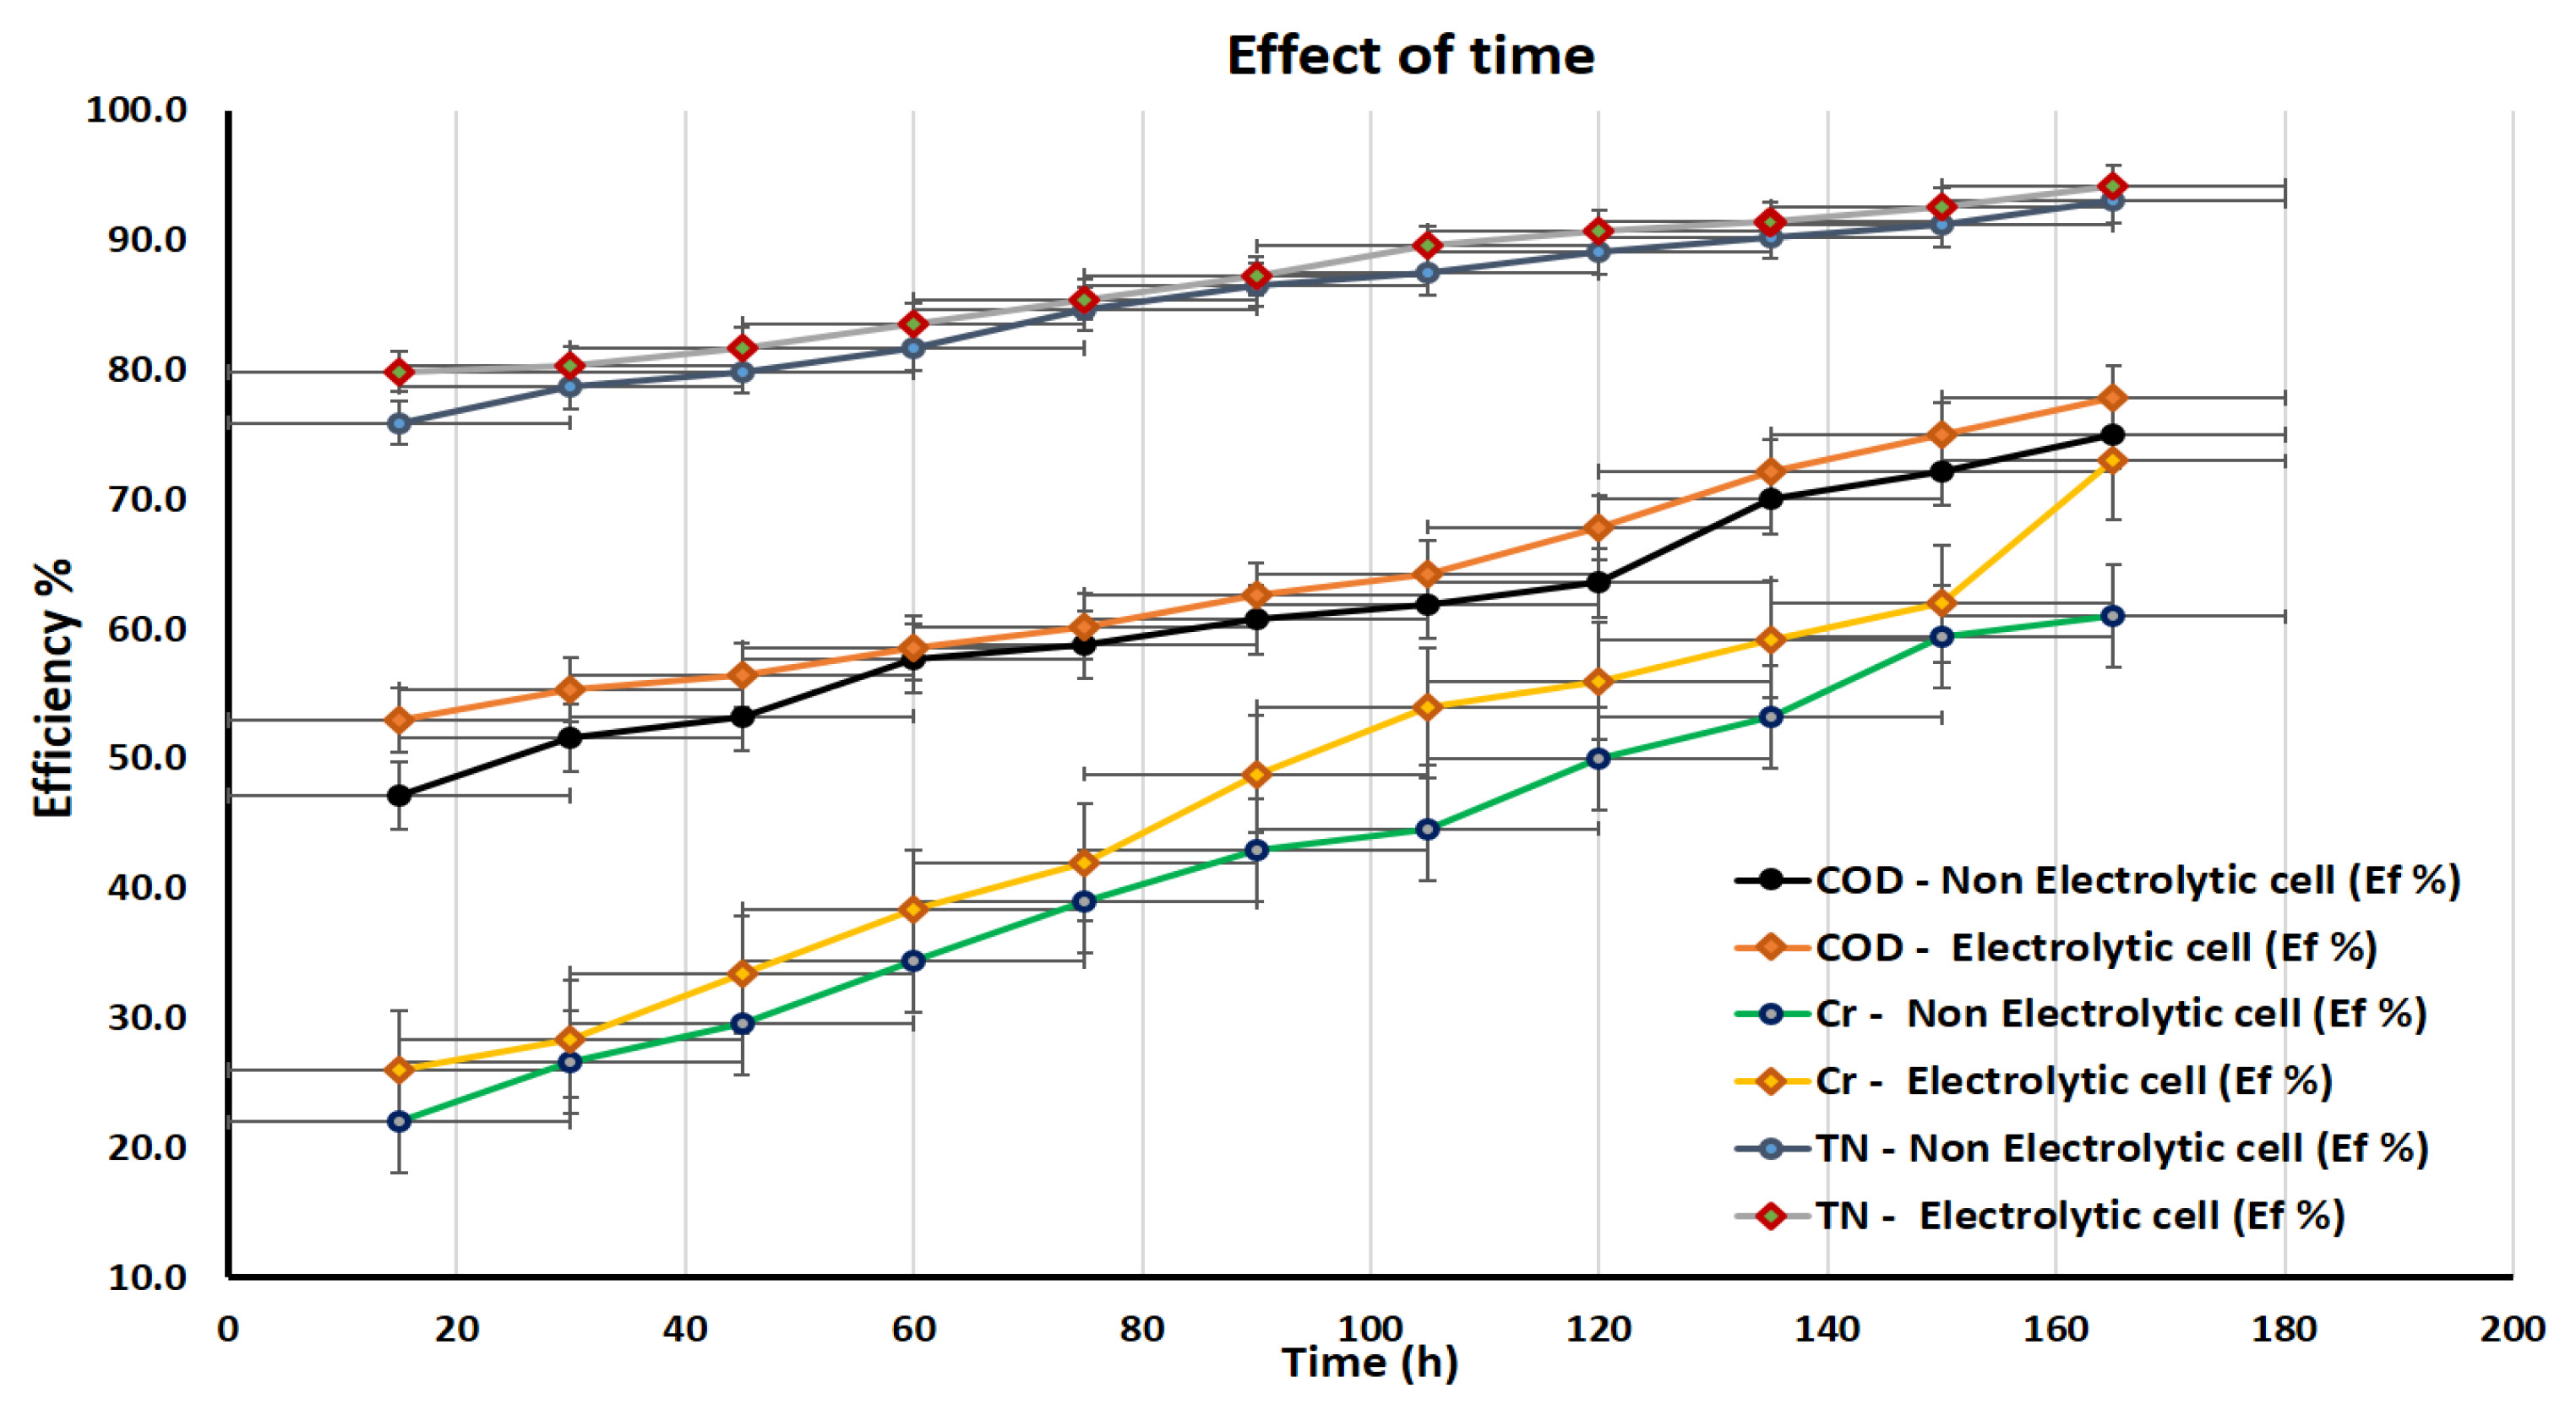
3.4. FFC Performance
3.5. Statistical Analysis
4. Conclusions
Supplementary Materials
Author Contributions
Funding
Institutional Review Board Statement
Informed Consent Statement
Data Availability Statement
Acknowledgments
Conflicts of Interest
References
- Lefebvre, O.; Moletta, R. Treatment of organic pollution in industrial saline wastewater: A literature review. Water Res. 2006, 40, 3671–3682. [Google Scholar] [CrossRef] [PubMed]
- Fei, Y.; Liu, C. Detoxification and resource recovery of chromium-containing wastes. In Environmental Materials and Waste; Elsevier: Amsterdam, The Netherlands, 2016; pp. 265–284. [Google Scholar]
- Forbes, R.J. Studies in Ancient Technology Vol V; Brill Archive: Leiden, The Netherlands, 1966. [Google Scholar]
- Sreeram, K.; Ramasami, T. Sustaining tanning process through conservation, recovery and better utilization of chromium. Resour. Conserv. Recycl. 2003, 38, 185–212. [Google Scholar] [CrossRef]
- Gupta, V.K.; Gupta, M.; Sharma, S. Process development for the removal of lead and chromium from aqueous solutions using red mud—An aluminium industry waste. Water Res. 2001, 35, 1125–1134. [Google Scholar] [CrossRef] [PubMed]
- Kurniawan, A.; Sisnandy, V.O.A.; Trilestari, K.; Sunarso, J.; Indraswati, N.; Ismadji, S. Performance of durian shell waste as high capacity biosorbent for Cr (VI) removal from synthetic wastewater. Ecol. Eng. 2011, 37, 940–947. [Google Scholar] [CrossRef]
- Chowdhury, M.; Mostafa, M.; Biswas, T.K.; Saha, A.K. Treatment of leather industrial effluents by filtration and coagulation processes. Water Resour. Ind. 2013, 3, 11–22. [Google Scholar] [CrossRef]
- Szpyrkowicz, L.; Kaul, S.N.; Neti, R.N.; Satyanarayan, S. Influence of anode material on electrochemical oxidation for the treatment of tannery wastewater. Water Res. 2005, 39, 1601–1613. [Google Scholar] [CrossRef] [PubMed]
- Umar, M.; Yusuf, G.; Yaya, A.; Bello, H.; Uwakwe, V.; Mohammed, I.; Tashi, U. Comparative analysis and quality assessment of treated and untreated tannery effluents discharged from NILEST Tannery, Zaria, Kaduna, Nigeria. Int. J. Sci. Res. Eng. Stud. IJSRES 2016, 3, 29–34. [Google Scholar]
- Appiah-Brempong, M.; Essandoh, H.M.K.; Asiedu, N.Y.; Dadzie, S.K.; Momade, F.W.Y. Artisanal tannery wastewater: Quantity and characteristics. Heliyon 2022, 8, e08680. [Google Scholar] [CrossRef]
- Lefebvre, O.; Habouzit, F.; Bru, V.; Delgenès, J.-P.; Godon, J.-J.; Moletta, R. Treatment of hypersaline industrial wastewater by a microbial consortium in a sequencing batch reactor. Environ. Technol. 2004, 25, 543–553. [Google Scholar] [CrossRef]
- Vidal, G.; Aspé, E.; Marti, M.C.; Roeckel, M. Treatment of recycled wastewaters from fishmeal factory by an anaerobic filter. Biotechnol. Lett. 1997, 19, 117–122. [Google Scholar] [CrossRef]
- Roeckel, M.; Aspé, E.; Martí, M.C. Achieving clean technology in the fish-meal industry by addition of a new process step. J. Chem. Technol. Biotechnol. Int. Res. Process Environ. Clean Technol. 1996, 67, 96–104. [Google Scholar] [CrossRef]
- Li, H.; Zhou, B.; Tian, Z.; Song, Y.; Xiang, L.; Wang, S.; Sun, C. Efficient biological nitrogen removal by Johannesburg-Sulfur autotrophic denitrification from low COD/TN ratio municipal wastewater at low temperature. Environ. Earth Sci. 2015, 73, 5027–5035. [Google Scholar] [CrossRef]
- Karam, A.; Mostafa, M.; Elawwad, A.; Zaher, K.; Mahmoud, A.S.; Peters, R. Small-pilot plant for tertiary treatment of domestic wastewater using algal photo-bioreactor, with artificial intelligence. In Proceedings of the 2019 AIChE Annual Meeting, Orlando, FL, USA, 13 November 2019. [Google Scholar]
- Kundu, D.; Dutta, D.; Samanta, P.; Dey, S.; Sherpa, K.C.; Kumar, S.; Dubey, B.K. Valorization of wastewater: A paradigm shift towards circular bioeconomy and sustainability. Sci. Total Environ. 2022, 848, 157709. [Google Scholar] [CrossRef] [PubMed]
- Mahmoud, A.S. Effect of nano bentonite on direct yellow 50 dye removal; Adsorption isotherm, kinetic analysis, and thermodynamic behavior. Prog. React. Kinet. Mech. 2022, 47, 14686783221090377. [Google Scholar] [CrossRef]
- Lefebvre, O.; Vasudevan, N.; Torrijos, M.; Thanasekaran, K.; Moletta, R. Halophilic biological treatment of tannery soak liquor in a sequencing batch reactor. Water Res. 2005, 39, 1471–1480. [Google Scholar] [CrossRef] [PubMed]
- Heberling, J.; Adewuyi, Y.; Mahmoud, A.S.; Mostafa, M.; Peters, R.W. AOP Performance at Wastewater Treatment Plants. In Proceedings of the 2018 Annual AIChE Meeting, Pittsburgh, PA, USA, 28 October–2 November 2018. [Google Scholar]
- Naguib, A.M.; Abdel-Gawad, S.A.; Mostafa, M.K.; Peters, R.W.; Mahmoud, A.S. Critical Review of the Fenton Oxidation Process for Industrial Wastewater Treatment. In Proceedings of the Annual AIChE Meeting, Phoenix, AZ, USA, 13–18 November 2022; pp. 1–9. [Google Scholar]
- Ellouze, E.; Amar, R.B.; Boufi, S.; Salah, A. Coagulation-flocculation performances for cuttlefish effluents treatment. Environ. Technol. 2003, 24, 1357–1366. [Google Scholar] [CrossRef] [PubMed]
- Bae, B.-U.; Jung, Y.-H.; Han, W.-W.; Shin, H.-S. Improved brine recycling during nitrate removal using ion exchange. Water Res. 2002, 36, 3330–3340. [Google Scholar] [CrossRef] [PubMed]
- Afonso, M.D.; Borquez, R. Review of the treatment of seafood processing wastewaters and recovery of proteins therein by membrane separation processes—Prospects of the ultrafiltration of wastewaters from the fish meal industry. Desalination 2002, 142, 29–45. [Google Scholar] [CrossRef]
- Church, J.; Hwang, J.-H.; Kim, K.-T.; McLean, R.; Oh, Y.-K.; Nam, B.; Joo, J.C.; Lee, W.H. Effect of salt type and concentration on the growth and lipid content of Chlorella vulgaris in synthetic saline wastewater for biofuel production. Bioresour. Technol. 2017, 243, 147–153. [Google Scholar] [CrossRef]
- Jang, D.; Hwang, Y.; Shin, H.; Lee, W. Effects of salinity on the characteristics of biomass and membrane fouling in membrane bioreactors. Bioresour. Technol. 2013, 141, 50–56. [Google Scholar] [CrossRef]
- Wang, X.; Cheng, S.; Zhang, X.; Li, X.-Y.; Logan, B.E. Impact of salinity on cathode catalyst performance in microbial fuel cells (MFCs). Int. J. Hydrogen Energy 2011, 36, 13900–13906. [Google Scholar] [CrossRef]
- Malik, A. Metal bioremediation through growing cells. Environ. Int. 2004, 30, 261–278. [Google Scholar] [CrossRef] [PubMed]
- You, S.J.; Zhang, J.N.; Yuan, Y.X.; Ren, N.Q.; Wang, X.H. Development of microbial fuel cell with anoxic/oxic design for treatment of saline seafood wastewater and biological electricity generation. J. Chem. Technol. Biotechnol. 2010, 85, 1077–1083. [Google Scholar] [CrossRef]
- Logan, B.E.; Rabaey, K. Conversion of wastes into bioelectricity and chemicals by using microbial electrochemical technologies. Science 2012, 337, 686–690. [Google Scholar] [CrossRef]
- Fan, Y.; Hu, H.; Liu, H. Enhanced Coulombic efficiency and power density of air-cathode microbial fuel cells with an improved cell configuration. J. Power Sources 2007, 171, 348–354. [Google Scholar] [CrossRef]
- Karuppiah, T.; Uthirakrishnan, U.; Sivakumar, S.V.; Authilingam, S.; Arun, J.; Sivaramakrishnan, R.; Pugazhendhi, A. Processing of electroplating industry wastewater through dual chambered microbial fuel cells (MFC) for simultaneous treatment of wastewater and green fuel production. Int. J. Hydrogen Energy 2022, 47, 37569–37576. [Google Scholar] [CrossRef]
- Lefebvre, O.; Tan, Z.; Kharkwal, S.; Ng, H.Y. Effect of increasing anodic NaCl concentration on microbial fuel cell performance. Bioresour. Technol. 2012, 112, 336–340. [Google Scholar] [CrossRef] [PubMed]
- Gil, G.-C.; Chang, I.-S.; Kim, B.H.; Kim, M.; Jang, J.-K.; Park, H.S.; Kim, H.J. Operational parameters affecting the performannce of a mediator-less microbial fuel cell. Biosens. Bioelectron. 2003, 18, 327–334. [Google Scholar] [CrossRef]
- Logan, B.; Cheng, S.; Watson, V.; Estadt, G. Graphite fiber brush anodes for increased power production in air-cathode microbial fuel cells. Environ. Sci. Technol. 2007, 41, 3341–3346. [Google Scholar] [CrossRef]
- Prathiba, S.; Kumar, P.S.; Vo, D.V. Recent advancements in microbial fuel cells: A review on its electron transfer mechanisms, microbial community, types of substrates and design for bio-electrochemical treatment. Chemosphere 2022, 286, 131856. [Google Scholar] [CrossRef]
- Nam, J.-Y.; Kim, H.-W.; Lim, K.-H.; Shin, H.-S.; Logan, B.E. Variation of power generation at different buffer types and conductivities in single chamber microbial fuel cells. Biosens. Bioelectron. 2010, 25, 1155–1159. [Google Scholar] [CrossRef] [PubMed]
- Feng, Y.; Wang, X.; Logan, B.E.; Lee, H. Brewery wastewater treatment using air-cathode microbial fuel cells. Appl. Microbiol. Biotechnol. 2008, 78, 873–880. [Google Scholar] [CrossRef] [PubMed]
- Huang, L.; Logan, B.E. Electricity generation and treatment of paper recycling wastewater using a microbial fuel cell. Appl. Microbiol. Biotechnol. 2008, 80, 349–355. [Google Scholar] [CrossRef] [PubMed]
- Balch, W.; Fox, G.E.; Magrum, L.J.; Woese, C.R.; Wolfe, R. Methanogens: Reevaluation of a unique biological group. Microbiol. Rev. 1979, 43, 260–296. [Google Scholar] [CrossRef] [PubMed]
- Jayashree, R.S.; Egas, D.; Spendelow, J.S.; Natarajan, D.; Markoski, L.J.; Kenis, P.J.; Letters, S.-S. Air-breathing laminar flow-based direct methanol fuel cell with alkaline electrolyte. Electrochem. Solid-State Lett. 2006, 9, A252. [Google Scholar] [CrossRef]
- Ambler, J.R.; Logan, B.E. Evaluation of stainless steel cathodes and a bicarbonate buffer for hydrogen production in microbial electrolysis cells using a new method for measuring gas production. Int. J. Hydrogen Energy 2011, 36, 160–166. [Google Scholar] [CrossRef]
- Fan, Y.; Hu, H.; Liu, H. Sustainable power generation in microbial fuel cells using bicarbonate buffer and proton transfer mechanisms. Environ. Sci. Technol. 2007, 41, 8154–8158. [Google Scholar] [CrossRef]
- Liu, H.; Ramnarayanan, R.; Logan, B.E. Production of electricity during wastewater treatment using a single chamber microbial fuel cell. Environ. Sci. Technol. 2004, 38, 2281–2285. [Google Scholar] [CrossRef]
- Shahbeig, H.; Bagheri, N.; Ghorbanian, S.A.; Hallajisani, A.; Poorkarimi, S. A new adsorption isotherm model of aqueous solutions on granular activated carbon. World J. Model. Simul. 2013, 9, 243–254. [Google Scholar]
- Mandal, A.; Singh, N.J.; Health, P.B. Kinetic and isotherm error optimization studies for adsorption of atrazine and imidacloprid on bark of Eucalyptus tereticornis L. J. Environ. Sci. Health 2016, 51, 192–203. [Google Scholar] [CrossRef]
- Cheng, S.; Liu, H.; Logan, B.E. Power densities using different cathode catalysts (Pt and CoTMPP) and polymer binders (Nafion and PTFE) in single chamber microbial fuel cells. Environ. Sci. Technol. 2006, 40, 364–369. [Google Scholar] [CrossRef] [PubMed]
- Fan, Y.; Sharbrough, E.; Liu, H. Quantification of the internal resistance distribution of microbial fuel cells. Environ. Sci. Technol. 2008, 42, 8101–8107. [Google Scholar] [CrossRef] [PubMed]
- Yuan, Y.; Zhao, B.; Zhou, S.; Zhong, S.; Zhuang, L. Electrocatalytic activity of anodic biofilm responses to pH changes in microbial fuel cells. Bioresour. Technol. 2011, 102, 6887–6891. [Google Scholar] [CrossRef] [PubMed]
- Sukkasem, C.; Xu, S.; Park, S.; Boonsawang, P.; Liu, H. Effect of nitrate on the performance of single chamber air cathode microbial fuel cells. Water Res. 2008, 42, 4743–4750. [Google Scholar] [CrossRef] [PubMed]
- Li, J.-T.; Zhang, S.-H.; Hua, Y.-M. Performance of denitrifying microbial fuel cell subjected to variation in pH, COD concentration and external resistance. Water Sci. Technol. 2013, 68, 250–256. [Google Scholar] [CrossRef] [PubMed]
- Raghavulu, S.V.; Mohan, S.V.; Reddy, M.V.; Mohanakrishna, G.; Sarma, P. Behavior of single chambered mediatorless microbial fuel cell (MFC) at acidophilic, neutral and alkaline microenvironments during chemical wastewater treatment. Int. J. Hydrogen Energy 2009, 34, 7547–7554. [Google Scholar] [CrossRef]
- He, Z.; Huang, Y.; Manohar, A.K.; Mansfeld, F. Effect of electrolyte pH on the rate of the anodic and cathodic reactions in an air-cathode microbial fuel cell. Bioelectrochemistry 2008, 74, 78–82. [Google Scholar] [CrossRef]


| Color (Pt-Co) | pH | TDS (mg/L) | COD (mg/L) | TN (mg/L) | EC (ms × Cm−9) | Total Cr (mg/L) | |
|---|---|---|---|---|---|---|---|
| Tannery Wastewater Constituents | 836 ± 39 | 4.12 ± 0.015 | 21,000 ± 144.9 | 1400 ± 37.4 | 432 ± 20.8 | 37.7 ± 6.1 | 500 ± 22.4 |
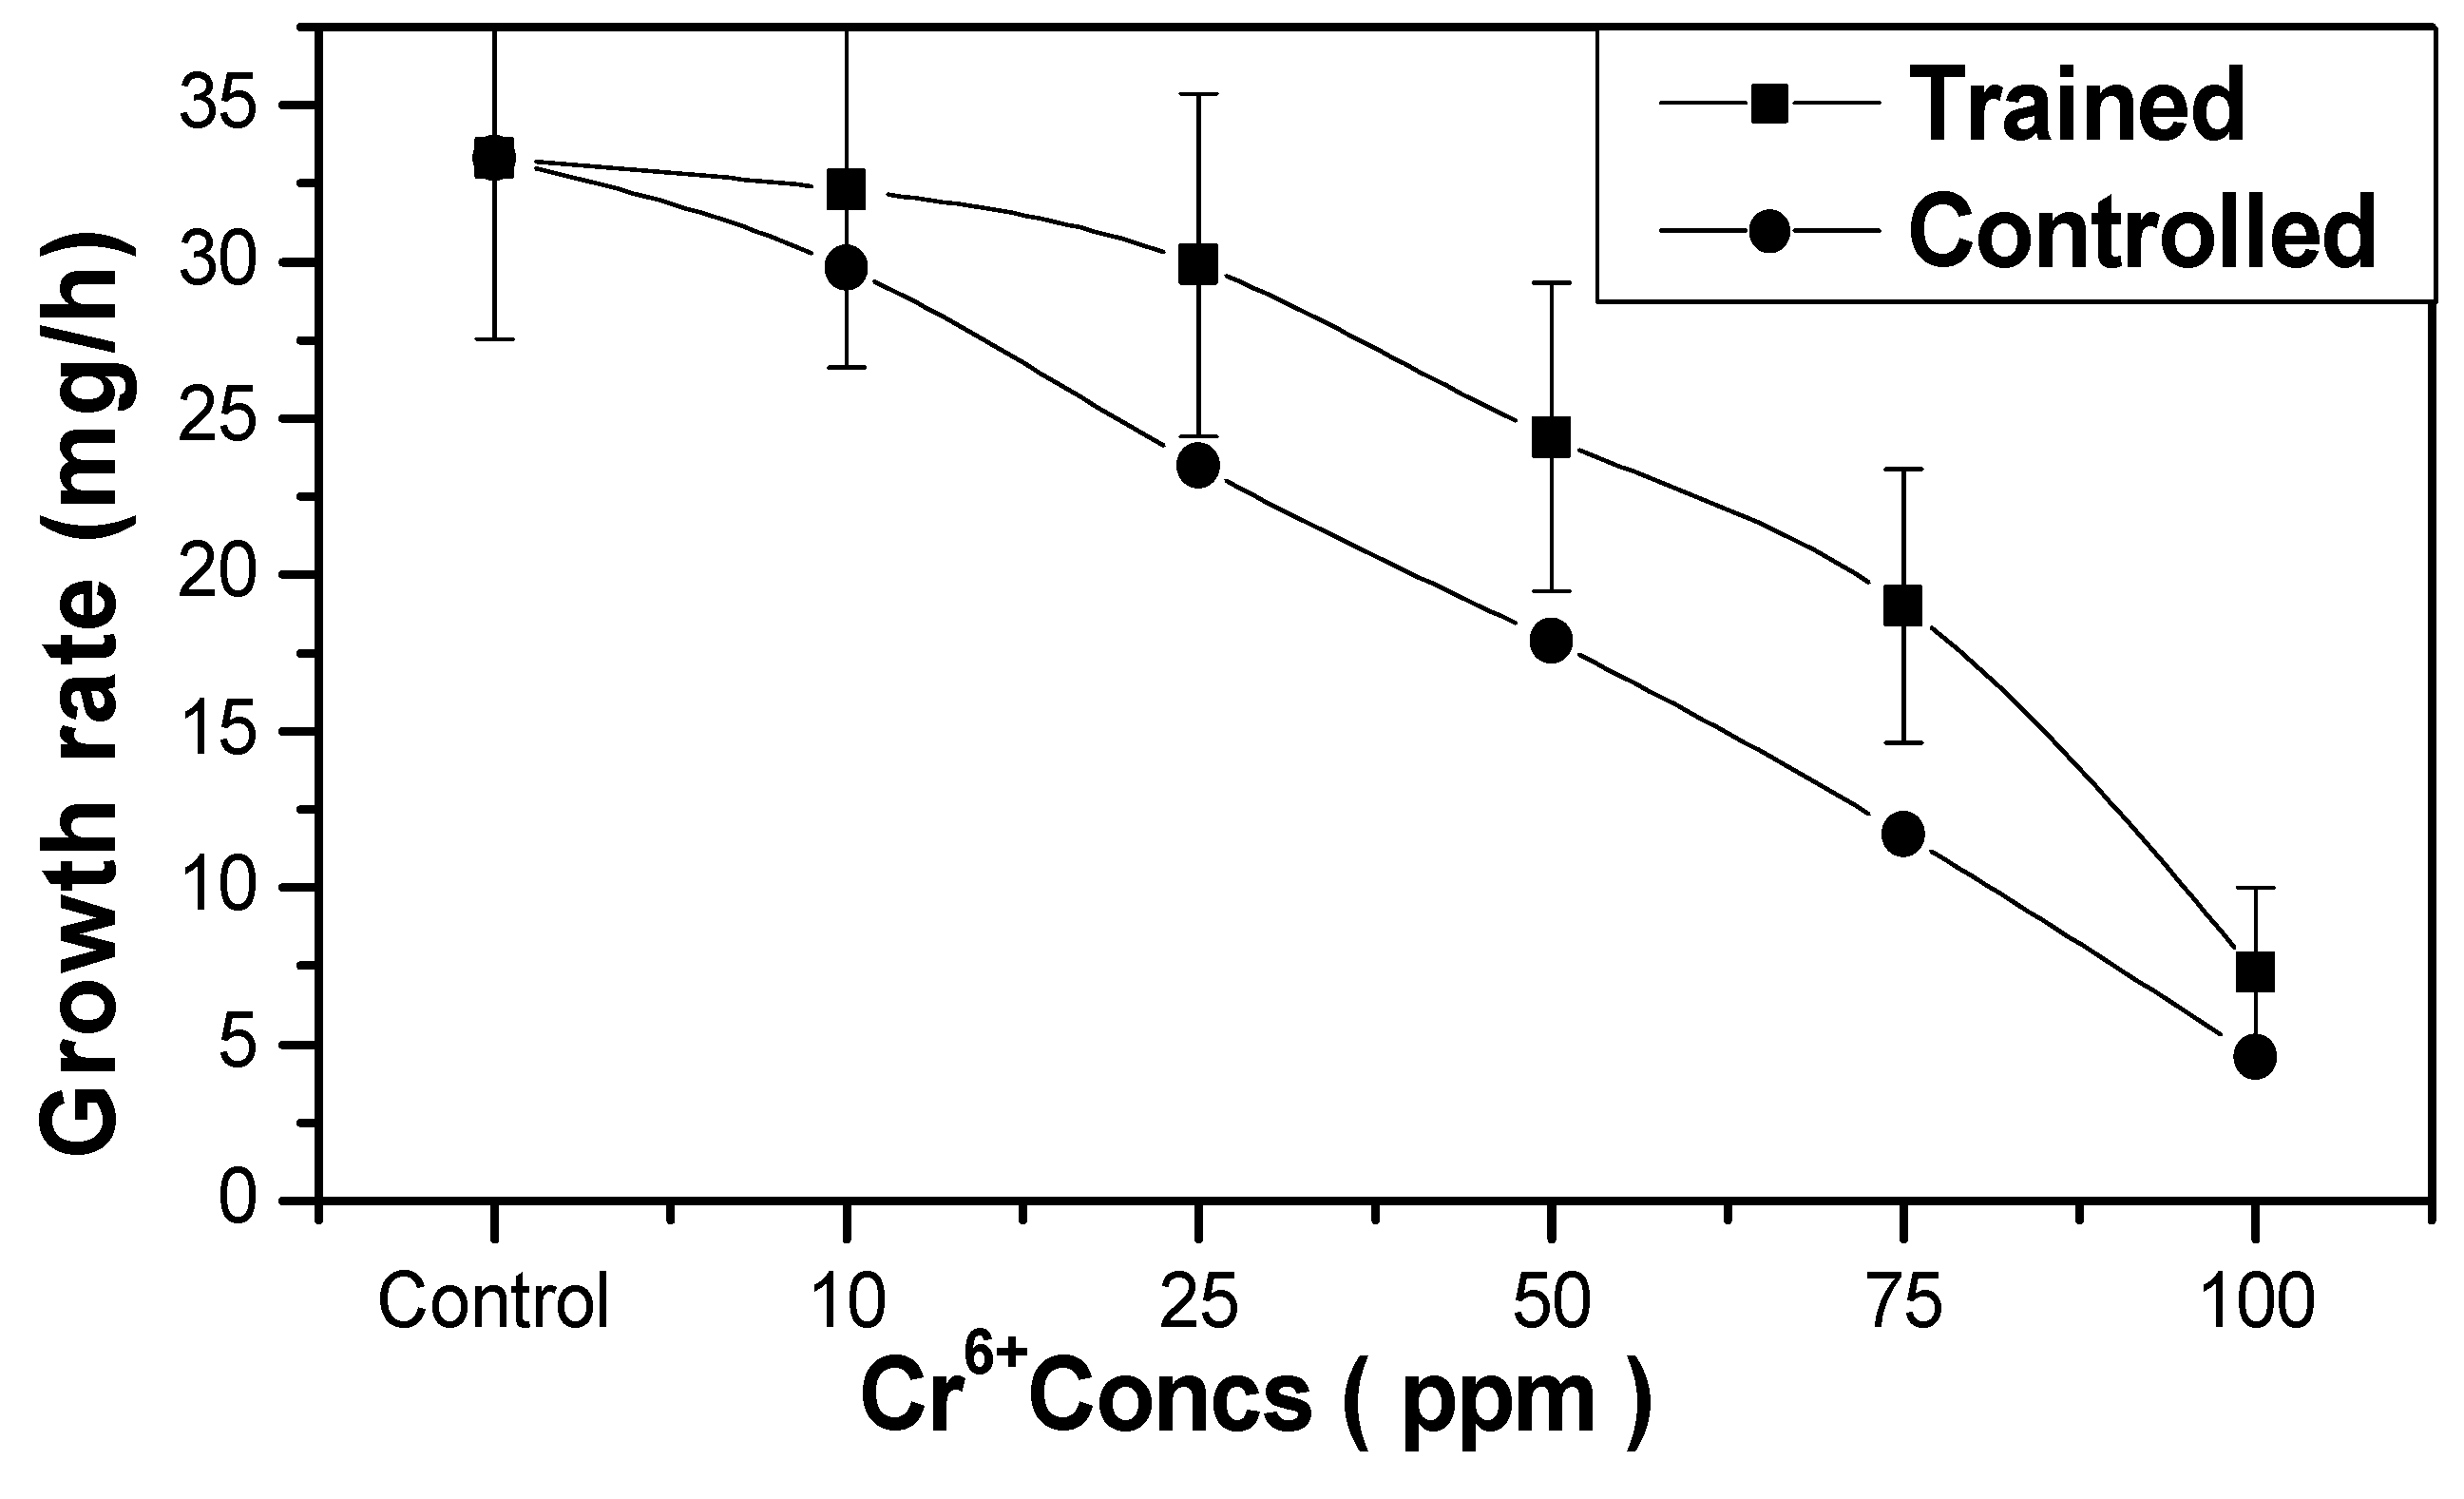
| Cr6+Conc., (mg/L) | Trained Strain | Control Strain | ||||
|---|---|---|---|---|---|---|
| Total Growth (G), (mg/L) | Growth Rate (µ), (mg/h) | Cr6+ Removed, (%) | Total Growth (G), (mg/L) | Growth Rate (µ), (mg/h) | Cr6+ Removed, (%) | |
| 0 | 5600 ± 74.8 | 33.3 ± 5.8 | --- | 5600 ± 74.8 | 33.3 ± 5.8 | ---- |
| 10 | 5420 ± 73.6 | 32.3 ± 5.7 | 97.0 | 5000 ± 70.7 | 29.8 ± 5.5 | 88.0 |
| 25 | 5030 ± 70.9 | 29.9 ± 5.5 | 90.8 | 3950 ± 62.8 | 23.5 ± 4.8 | 81.6 |
| 50 | 4100 ± 64.0 | 24.4 ± 4.9 | 87.2 | 3000 ± 54.8 | 17.9 ± 4.2 | 76.4 |
| 75 | 3200 ± 56.6 | 19.0 ± 4.4 | 84.8 | 1970 ± 44.4 | 11.7 ± 3.4 | 72.1 |
| 100 | 1220 ± 34.9 | 7.3 ± 2.7 | 81.8 | 780 ± 27.9 | 4.6 ± 2.1 | 67.5 |
| A. niger | Qe | Redlich | Hill | Toth | Freundlich | Koble | Langmuir | Sip | Khan | Javanovic |
|---|---|---|---|---|---|---|---|---|---|---|
| Trained | 9.7 | 5.2 | 7.2 | 7.2 | 7.3 | 2.6 | 3.1 | 6.3 | 6.1 | 2.8 |
| 22.7 | 23.4 | 24.2 | 24.2 | 24.2 | 18.2 | 20.7 | 23.8 | 24.0 | 19.6 | |
| 43.6 | 44.8 | 44.4 | 44.4 | 44.3 | 42.1 | 45.5 | 44.9 | 44.4 | 45.2 | |
| 63.6 | 62.9 | 62.4 | 62.4 | 62.3 | 62.1 | 64.6 | 62.9 | 62.3 | 65.2 | |
| 81.8 | 81.8 | 82.1 | 82.1 | 82.1 | 80.1 | 80.7 | 81.3 | 81.9 | 80.6 | |
| Control | 8.8 | 8.0 | 9.4 | 5.9 | 9.5 | 8.1 | 5.9 | 7.8 | 9.5 | 5.4 |
| 20.4 | 21.0 | 21.2 | 19.7 | 21.3 | 20.9 | 19.7 | 20.9 | 21.3 | 18.7 | |
| 38.2 | 38.5 | 37.5 | 39.4 | 37.4 | 38.4 | 39.4 | 38.6 | 37.4 | 39.3 | |
| 54.1 | 53.6 | 52.8 | 54.7 | 52.7 | 53.6 | 54.7 | 53.7 | 52.7 | 55.4 | |
| 67.5 | 67.8 | 68.5 | 66.7 | 68.6 | 67.6 | 66.7 | 67.2 | 68.6 | 66.5 |
| Time/h | CD/mA·m−2 | PD/mW·m−2 | U/V | |||
|---|---|---|---|---|---|---|
| Non-Electrolytic FFC | Electrolytic FFC | Non-Electrolytic FFC | Electrolytic FFC | Non-Electrolytic FFC | Electrolytic FFC | |
| 0 | 0 | 0 | 0 | 0 | 0 | 0 |
| 15 | 0.1061 | 0.1194 | 0.0800 | 0.0972 | 0.754 | 0.814 |
| 30 | 0.1050 | 0.1165 | 0.0783 | 0.0925 | 0.746 | 0.794 |
| 45 | 0.1042 | 0.1150 | 0.0771 | 0.0902 | 0.740 | 0.784 |
| 60 | 0.1011 | 0.1127 | 0.0726 | 0.0865 | 0.718 | 0.768 |
| 75 | 0.0957 | 0.1086 | 0.0651 | 0.0803 | 0.680 | 0.740 |
| 90 | 0.0892 | 0.1046 | 0.0566 | 0.0746 | 0.634 | 0.713 |
| 105 | 0.0678 | 0.0899 | 0.0327 | 0.0551 | 0.482 | 0.613 |
| 120 | 0.0508 | 0.0704 | 0.0183 | 0.0338 | 0.361 | 0.480 |
| 135 | 0.0338 | 0.0506 | 0.0081 | 0.0175 | 0.240 | 0.345 |
| 150 | 0.0165 | 0.0276 | 0.0019 | 0.0052 | 0.117 | 0.188 |
| 165 | 0.0089 | 0.0156 | 0.0006 | 0.0016 | 0.063 | 0.106 |
| Regression Model | ||||||
|---|---|---|---|---|---|---|
| Electrolytic Cell Model Summary | Non-Electrolytic Cell Model Summary | |||||
| Method | Enter | |||||
| Variables | Time, and Volt | |||||
| Dependent | COD | Cr | TN | COD | Cr | TN |
| R | 0.999 | 0.993 | 0.995 | 0.988 | 0.998 | 0.998 |
| R2 | 0.998 | 0.985 | 0.990 | 0.976 | 0.996 | 0.995 |
| Adjusted R2 | 0.997 | 0.982 | 0.987 | 0.970 | 0.994 | 0.994 |
| Std. error of the estimate | 0.426 | 2.028 | 0.579 | 1.502 | 0.978 | 0.428 |
| ANOVA | ||||||
| Significance | <0.001 | <0.001 | <0.001 | <0.001 | <0.001 | <0.001 |
| F | 1910 | 269 | 384 | 165 | 895 | 857 |
| Coefficient | ||||||
| Time “Beta” | 0.099 | 0.315 | 0.116 | 0.166 | 0.271 | 0.152 |
| Time “t” | 13.2 | 8.785 | 11.317 | 5.332 | 13.409 | 17.111 |
| Time “Significance” | <0.001 | <0.001 | <0.001 | <0.001 | <0.001 | <0.001 |
| Volt “Beta” | −13.6 | 3.292 | 2.905 | −1.537 | 1.682 | 7.830 |
| Volt “t” | −9.361 | 0.475 | 1.470 | −0.264 | 0.444 | 4.712 |
| Volt “Significance” | <0.001 | 0.647 | 0.180 | 0.799 | 0.669 | 0.002 |
| Estimated removal Equation | ||||||
| COD removal Eqn. | % = 62.8 + 0.099X1 − 13.596X2 | % = 46.922 + 0.166X1 − 1.537X2 | ||||
| Cr removal Eqn. | % = 17.1 + 0.315X1 + 3.2926X2 | % = 16.795 + 0.271X1 + 1.6826X2 | ||||
| TN removal Eqn. | % = 74.857 + 0.116X1 + 2.905X2 | % = 67.736 + 0.152X1 + 7.830X2 | ||||
Disclaimer/Publisher’s Note: The statements, opinions and data contained in all publications are solely those of the individual author(s) and contributor(s) and not of MDPI and/or the editor(s). MDPI and/or the editor(s) disclaim responsibility for any injury to people or property resulting from any ideas, methods, instructions or products referred to in the content. |
© 2023 by the authors. Licensee MDPI, Basel, Switzerland. This article is an open access article distributed under the terms and conditions of the Creative Commons Attribution (CC BY) license (https://creativecommons.org/licenses/by/4.0/).
Share and Cite
Mahmoud, M.S.; Wang, J.-H.; Shen, Y.; Guo, Z.-W.; Yang, Y.; Zhu, D.-C.; Peters, R.W.; Mostafa, M.K.; Mahmoud, A.S. Performance of the Dual-Chamber Fungal Fuel Cell in Treating Tannery Wastewater. Appl. Sci. 2023, 13, 10710. https://doi.org/10.3390/app131910710
Mahmoud MS, Wang J-H, Shen Y, Guo Z-W, Yang Y, Zhu D-C, Peters RW, Mostafa MK, Mahmoud AS. Performance of the Dual-Chamber Fungal Fuel Cell in Treating Tannery Wastewater. Applied Sciences. 2023; 13(19):10710. https://doi.org/10.3390/app131910710
Chicago/Turabian StyleMahmoud, Mohamed S., Jian-Hui Wang, Yu Shen, Zhi-Wei Guo, Yan Yang, Dao-Chen Zhu, Robert W. Peters, Mohamed K. Mostafa, and Ahmed S. Mahmoud. 2023. "Performance of the Dual-Chamber Fungal Fuel Cell in Treating Tannery Wastewater" Applied Sciences 13, no. 19: 10710. https://doi.org/10.3390/app131910710
APA StyleMahmoud, M. S., Wang, J.-H., Shen, Y., Guo, Z.-W., Yang, Y., Zhu, D.-C., Peters, R. W., Mostafa, M. K., & Mahmoud, A. S. (2023). Performance of the Dual-Chamber Fungal Fuel Cell in Treating Tannery Wastewater. Applied Sciences, 13(19), 10710. https://doi.org/10.3390/app131910710