1. Introduction
Pause fillers, also known as filled pauses, are brief pauses or meaningless interjections inserted in speech to simulate pauses and thinking processes in human speech expression. Pause fillers are widely used in the fields of speech synthesis and natural language processing with the aim of improving the naturalness and fluency of synthesized speech. The purpose of pause fillers is to mimic the natural habits of human speech during conversations and make synthesized speech more akin to real human speech expression. In human communication, people employ pauses of varying lengths to convey meaning, engage in thinking, and regulate speech pace, among other reasons. For instance, common pause fillers in English include “uh”, “um”, “well”, and “you know”, while in Chinese, common pause fillers include “啊”, “呃”, “嗯”, and “那个”. These pause fillers are inserted between sentences or phrases to serve as separators and connectors in speech.
In speech synthesis, the appropriate insertion of pause fillers can enhance the naturalness and fluency of synthesized speech. This provides better speech rhythm and intonation, making it easier for listeners to understand and accept the synthesized speech. The prediction of pause fillers plays a crucial role in speech synthesis systems, requiring the identification of suitable positions to insert pause fillers based on input text and context.
Methods for predicting pause fillers include rule-based approaches, statistical models, and deep learning methods. In recent years, with the advancement of deep learning technologies, neural network models such as LSTM, BERT, and XLNet have been widely employed in pause filler prediction tasks, achieving favorable results. However, the accuracy of existing pause filler prediction modules still has room for improvement, necessitating the adoption of more effective strategies and more efficient natural language processing models for further advancements.
The main contribution of this study lies in the significant practical importance of the proposed method for enhancing the robustness of speech synthesis systems, especially when facing the challenge of increased text length. Traditionally, researchers tend to train personalized speech synthesis models applicable to everyone. However, our paper introduces a novel approach by grouping speakers based on the positions and usage frequencies of pause fillers, allowing the training of personalized pause filler prediction modules for each individual. This method effectively reduces the data and time required to train models for each speaker, thereby improving model practicality. Through this approach, we have successfully addressed multiple challenges in pause filler prediction, laying a solid foundation for achieving more natural and high-quality speech synthesis.
2. Related Works
The speech-to-text system is an important natural language processing technology designed to convert spoken language signals into written text. In recent years, with the rapid development of natural language processing and machine learning, researchers have started to pay attention to the details within speech-to-text systems, including a specific focus on research related to pauses and hesitations. Pauses and hesitations refer to brief interruptions in speech, typically reflecting a speaker’s thought process, language organization, or emotional expression. These pauses are crucial for the accuracy of speech-to-text and speech understanding systems. Consequently, researchers are devoted to developing algorithms and models to better capture and process pause information, thereby improving the performance of speech-to-text systems. Research in this field spans multiple disciplines, including speech processing, natural language processing, and machine learning, and aims to achieve smoother and more accurate speech-to-text technology to meet the growing demands of various applications. In the following section, we will introduce recent research efforts in speech-to-text systems and pauses and hesitations.
2.1. Prediction of Pause Fillers
Over the years, numerous scholars have extensively researched the prediction of pause fillers using various methods, which has resulted in more natural and authentic text generation. For instance, Nakanishi R. et al. proposed a method based on analyzing human–robot interaction data and machine learning models to predict the occurrence and appropriate forms of pause fillers, aiming to generate them at the beginning of system utterances in humanoid robot spoken dialog systems, indicating turn-taking or turn-holding intentions [
1]. Balagopalan A. et al. compared two common methods for AD detection on a matched dataset, assessing the advantages of domain knowledge and BERT pre-trained transfer models in predicting pauses and interruptions [
2]. Sabrina J. M. et al. obtain a dialog agent with greatly improved linguistic calibration by incorporating such metacognitive features into the training of a controllable generation model [
3]. Ryan L. B. et al. discuss the trajectory of interdisciplinary research on language and the challenges of integrating analysis methods across paradigms, recommending promising future directions for the field along the way [
4], and Jennifer E. A. et al. found that in online language processing, disfluent expressions affect listeners’ understanding of subsequent nouns, making them more inclined to form associations with objects that have not been previously mentioned, revealing that the fundamental process of decoding language input is influenced by disfluent expressions [
5]. These scholars’ research in linguistics highlights the importance of pauses, and we aim to enhance linguistic fluency by training a well-versed pause fillers model.
However, due to individual speaking habits, it is challenging to train a universal pause filler prediction module. To address personalized needs, Matsunaga et al. proposed a personalized pause filler generation method based on a group prediction model and explored an alternative group prediction approach [
6]. It should be noted that there are significant differences between the Chinese and Japanese languages, making the aforementioned models unsuitable for Chinese. To train a Chinese-specific model, new datasets must be sought, and the grouping conditions for pause fillers need to be reexamined. Furthermore, many pause filler prediction models, including those in Japanese, have not considered integration with mainstream speech synthesis systems and overall performance, necessitating further exploration and improvement in practicality [
7].
An accurate and appropriate pause fillers prediction model can automatically predict suitable pause fillers in Text-to-Speech (TTS) systems, simulating the fluency and coherence of natural human speech. This makes the synthesized speech sound more natural and reduces the artificiality of the machine-generated voice. A pause fillers prediction model helps TTS systems better simulate human communication and expression in dialogs [
8]. By inserting pause fillers at appropriate positions, TTS systems can better mimic human-to-human conversations, enhancing user experience and making interactions more natural and friendly [
9]. Accurately predicting pause fillers can avoid unnecessary pauses and redundancies, thereby improving the efficiency of TTS systems. Speech synthesis can proceed more smoothly, reducing unnecessary delays and waiting times. The pause fillers prediction model can be customized based on individuals’ speaking habits and speech characteristics, making the speech synthesis more personalized and adaptable. Different speakers’ pause habits can be incorporated into the model, making the synthesized speech more in line with individuals’ styles and traits. Combining the pause fillers prediction model with TTS systems significantly enhances the quality, naturalness, and personalization of speech synthesis, making the synthesized speech more closely resemble authentic human expression, ultimately improving user experience and satisfaction.
2.2. TTS
TTS is a technology that converts text into speech. It takes input text and transforms it into audible speech output using speech synthesis techniques [
10,
11,
12]. TTS systems find wide applications in speech synthesis, accessibility technologies, education, and various other fields. A typical TTS system consists of two main components: the front-end and the back-end. The front-end is responsible for analyzing the input text and extracting linguistic information and speech features, and then generating an intermediate representation in the form of a phoneme sequence. The back-end utilizes these phoneme sequences and acoustic models to generate the final speech output using speech synthesis algorithms.
In a TTS system, the pause fillers prediction module plays a crucial role [
13]. It automatically determines and inserts appropriate pause fillers based on the input text and contextual information, aiming to enhance the naturalness and fluency of the synthesized speech. By incorporating the pause fillers prediction module, the TTS system can better simulate the pauses and thinking processes in human speech expression, making the synthesized speech more realistic and easier to comprehend.
In recent years, more and more TTS systems have been used in Chinese. For example, Tacotron2 system, parallel WaveNet system, Fastspeech system, and so on. Qin et al. proposed Myanmar TTS synthesis [
14] using an end-to-end model. Luz et al. used text context embedding to directly predict the prosodic features of reference audio, and text context embedding is calculated by BERT (a pre-trained language representation model). Luz’s improved system could generate richer prosodic speech during the inference stage with limited training data [
15]. Zhang and Ling proposed a speech synthesis model based on fine-grained style representation, called word-level style variation (WSV) [
16]. In order to improve the accuracy of WSV prediction and the naturalness of synthesized speech, Zhang and Ling used a pretrained BERT model and speech information to derive semantic descriptions. Liu et al. proposed a speech synthesis method [
17] based on LPCNet. Qiu et al. proposed an end-to-end speech synthesis method based on WaveNet [
18]. Zhang and Ling designed two context encoders [
19], the sentence window context encoder and the paragraph-level context encoder. The context representation is extracted by BERT from multiple sentences through an additional attention module. They also proposed a deep learning method using BERT to provide a wide range of contextual representations for statistical parametric speech synthesis (SPSS) [
20,
21,
22]. In order to explore the problem of zero-shot TTS, Casanova E et al. proposed a speaker-conditional architecture [
23] that includes a flow-based decoder. The speaker-conditional architecture achieved state-of-the-art results for similarity with new speakers using video of only eleven speakers. Wu Y et al. developed Ada-Speech 4 [
24], a zero-shot adaptive TTS system for high-quality speech synthesis. It could achieve better voice quality and similarity than baselines in multiple datasets without any fine-tuning. Kumar N et al. presented a novel zero-shot multi-speaker speech synthesis approach (ZSM-SS) [
25]. Compared to the normalization architecture, ZSM-SS added non-autoregressive multi-head attention between the encoder–decoder architecture [
26,
27,
28].
3. A Group-Dependent Pause Fillers Prediction Module
Most scholars typically choose to train a pause fillers prediction model that can be applied to everyone. However, due to significant differences in people’s habits of using pause fillers, especially among individuals with different personalities, it is challenging to train a model that accurately predicts the pause fillers used by each person. To address this issue, this paper proposed a solution that groups speakers in the MagicData-RAMC dataset based on the positions and usage frequencies of pause fillers using hierarchical clustering. The data from each speaker group, including the frequency and positions of pause fillers, was used to train personalized pause fillers prediction modules.
Firstly, a pause fillers dictionary was created by counting all the pause fillers in the MagicData-RAMC dataset. This dictionary, defined in
Table 1, clearly specifies the range of pause fillers and provides example sentences. To collect information about pause fillers, the text was first segmented into words. To overcome the high cost of manual analysis, the Jiagu function library was used for automatic text analysis, extracting information about the positions and usage frequencies of pause fillers from the pause fillers dictionary. Subsequently, this information, along with the relationships between pause fillers and other words, was utilized to train the RoBERTa model. Finally, based on the pause fillers dictionary and the aforementioned information, the pre-trained RoBERTa model was fine-tuned, enabling the fine-tuned model to complete the task of adding pause fillers in the text. We also compared the pause fillers prediction models trained using the BERT and RoBERTa models with mainstream TTS systems, evaluating the practicality and effectiveness of the pause fillers prediction model.
3.1. Pause Fillers Dictionary
The range of speakers in the MagicData-RAMC dataset is very comprehensive, reflecting real-world dialog scenarios as much as possible. Thus, the MagicData-RAMC dataset was selected as the dataset for the statistical pause fillers dictionary. The MagicData-RAMC dataset was used to train group-dependent pause fillers prediction modules. During the collection process, the dataset was ensured to have gender and geographical balance, as well as a diversity of topics. A total of 663 speakers were collected, including 368 males and 295 females, 334 speakers from the north and 329 speakers from the south. In summary, 351 samples from the MagicData-RAMC dataset were selected. The position and frequency information of pause fillers used by 663 speakers were labeled and collected. The comprehensive score was calculated by weighting to obtain the usage style habits of each speaker.
The extreme situation where a speaker frequently uses pause fillers that are not commonly used by most people was not considered in this paper. After statistical analysis, eleven pause fillers are counted, but the usage frequency of pause fillers is very different. For example, 96% of the people who use “呃” have used it, and the average number of times it has been used is four times. However, only 2% of people used “哎呀”. The pause fillers that were used by at least 30% of the people in the dataset were added to the pause fillers dictionary. From the MagicData-RAMC dataset, eleven commonly used pause fillers in
Table 1 were counted and all the pause fillers that appear in the dictionary in the text were marked. The final pause fillers dictionary was as follows:
Table 1 provides the English translation for each pause filler. Nevertheless, it is important to note that the usage of pause fillers varies across different languages, making a one-to-one correspondence impossible. For instance, some Chinese pause fillers may not have the same pausing effect when directly translated into English. However, a common characteristic of pause fillers in various languages is their lack of actual meaning; instead, they serve the purpose of creating pauses within sentences. To eliminate potential ambiguity, we have opted for a literal translation approach for all examples in
Table 1. Please be aware that the provided translation results are intended solely for reference.
3.2. Group Processing and Basis
The coordinates of each speaker in the MagicData-RAMC dataset according to the position and usage frequency of the pause fillers were calculated. Finally, all the speakers in the dataset were divided into four groups. According to the grouping, four group-dependent pause fillers models were trained. The four groups represent four different styles. Based on this, speech was able to be synthesized with different styles, and the synthesized speech was more accurate and more realistic.
In this paper, four different speaker classification schemes were compared: The first uses only the usage frequency of pause fillers as the criterion for hierarchical clustering. The second uses only the positions of pause fillers as the criterion for hierarchical clustering. The third uses the usage frequency and position of pause fillers as the basis for classification, and in terms of location criteria.
Pause fillers are located at the beginning of sentences;
Pause fillers are located in sentences;
Pause fillers are located at the end of sentences.
Words are classified at the end of the sentence. The fourth uses the usage frequency and position of pause fillers as the basis for classification and introduces the concept of the breath group. A silence of 0.6 s and above is used as a breath group to separate a sentence. Scheme 4 removed the criteria ‘pause fillers are located in sentences’ in Scheme 3, and replaced them with the middle of the breath group and the boundary of the breath group. According to the location criteria, the four groups were separated:
Pause fillers are located at the beginning of the sentence;
Pause fillers are located at the end of the sentence;
Pause fillers are located in the middle of the breath group;
Pause fillers are located at the boundary of the breath group classification.
Each scheme is adopted to a group of speakers. A set of grouped data is used to train the group-dependent pause fillers model. Each model was tested. This article trained four different schemes separately and tested them using one of the dependent pause-filling word models in each scheme. Performance metrics, such as precision, recall, F1 score, and specificity, were computed for each scheme. Precision reflects the proportion of correctly predicted pause-filling words among all predicted pause-filling words; a higher precision indicates more accurate model predictions. Recall indicates the proportion of correctly predicted pause-filling words among the original pause-filling words in the text; a higher recall implies more comprehensive model predictions. The F1 score is a composite measure of precision and recall, indicating a model’s overall predictive capability; a higher F1 score signifies stronger predictive performance. Specificity measures the probability of the model incorrectly predicting pause-filling words; a higher specificity suggests a lower probability of model errors, indicating greater prediction precision.
The results are shown in
Table 2. We can see that the model trained by Scheme 1 and Scheme 2 using a single criterion is not as effective as the model trained by Scheme 3 and Scheme 4 combining the two criteria. Using a standard grouping is not accurate enough. The excessive number of groups increases the difficulty of model training. The group obtained by a criterion poses great difficulties for the recognition of the pause fillers prediction module, and also has a significant impact on the synthesis efficiency of the FWP Tacotron2 system. Compared with Scheme 1 and Scheme 2, Scheme 3 has significant improvements. However, compared to Scheme 4, Scheme 3 has lower accuracy, recall, and F1 scores than Scheme 4, except for specific rate.
Finally, the position of pause fillers is divided into four categories:
Pause fillers are located at the beginning of sentences;
Pause fillers are located at the end of sentences;
Pause fillers are located in the middle of breath groups;
Pause fillers are located at the boundary part of the breath group.
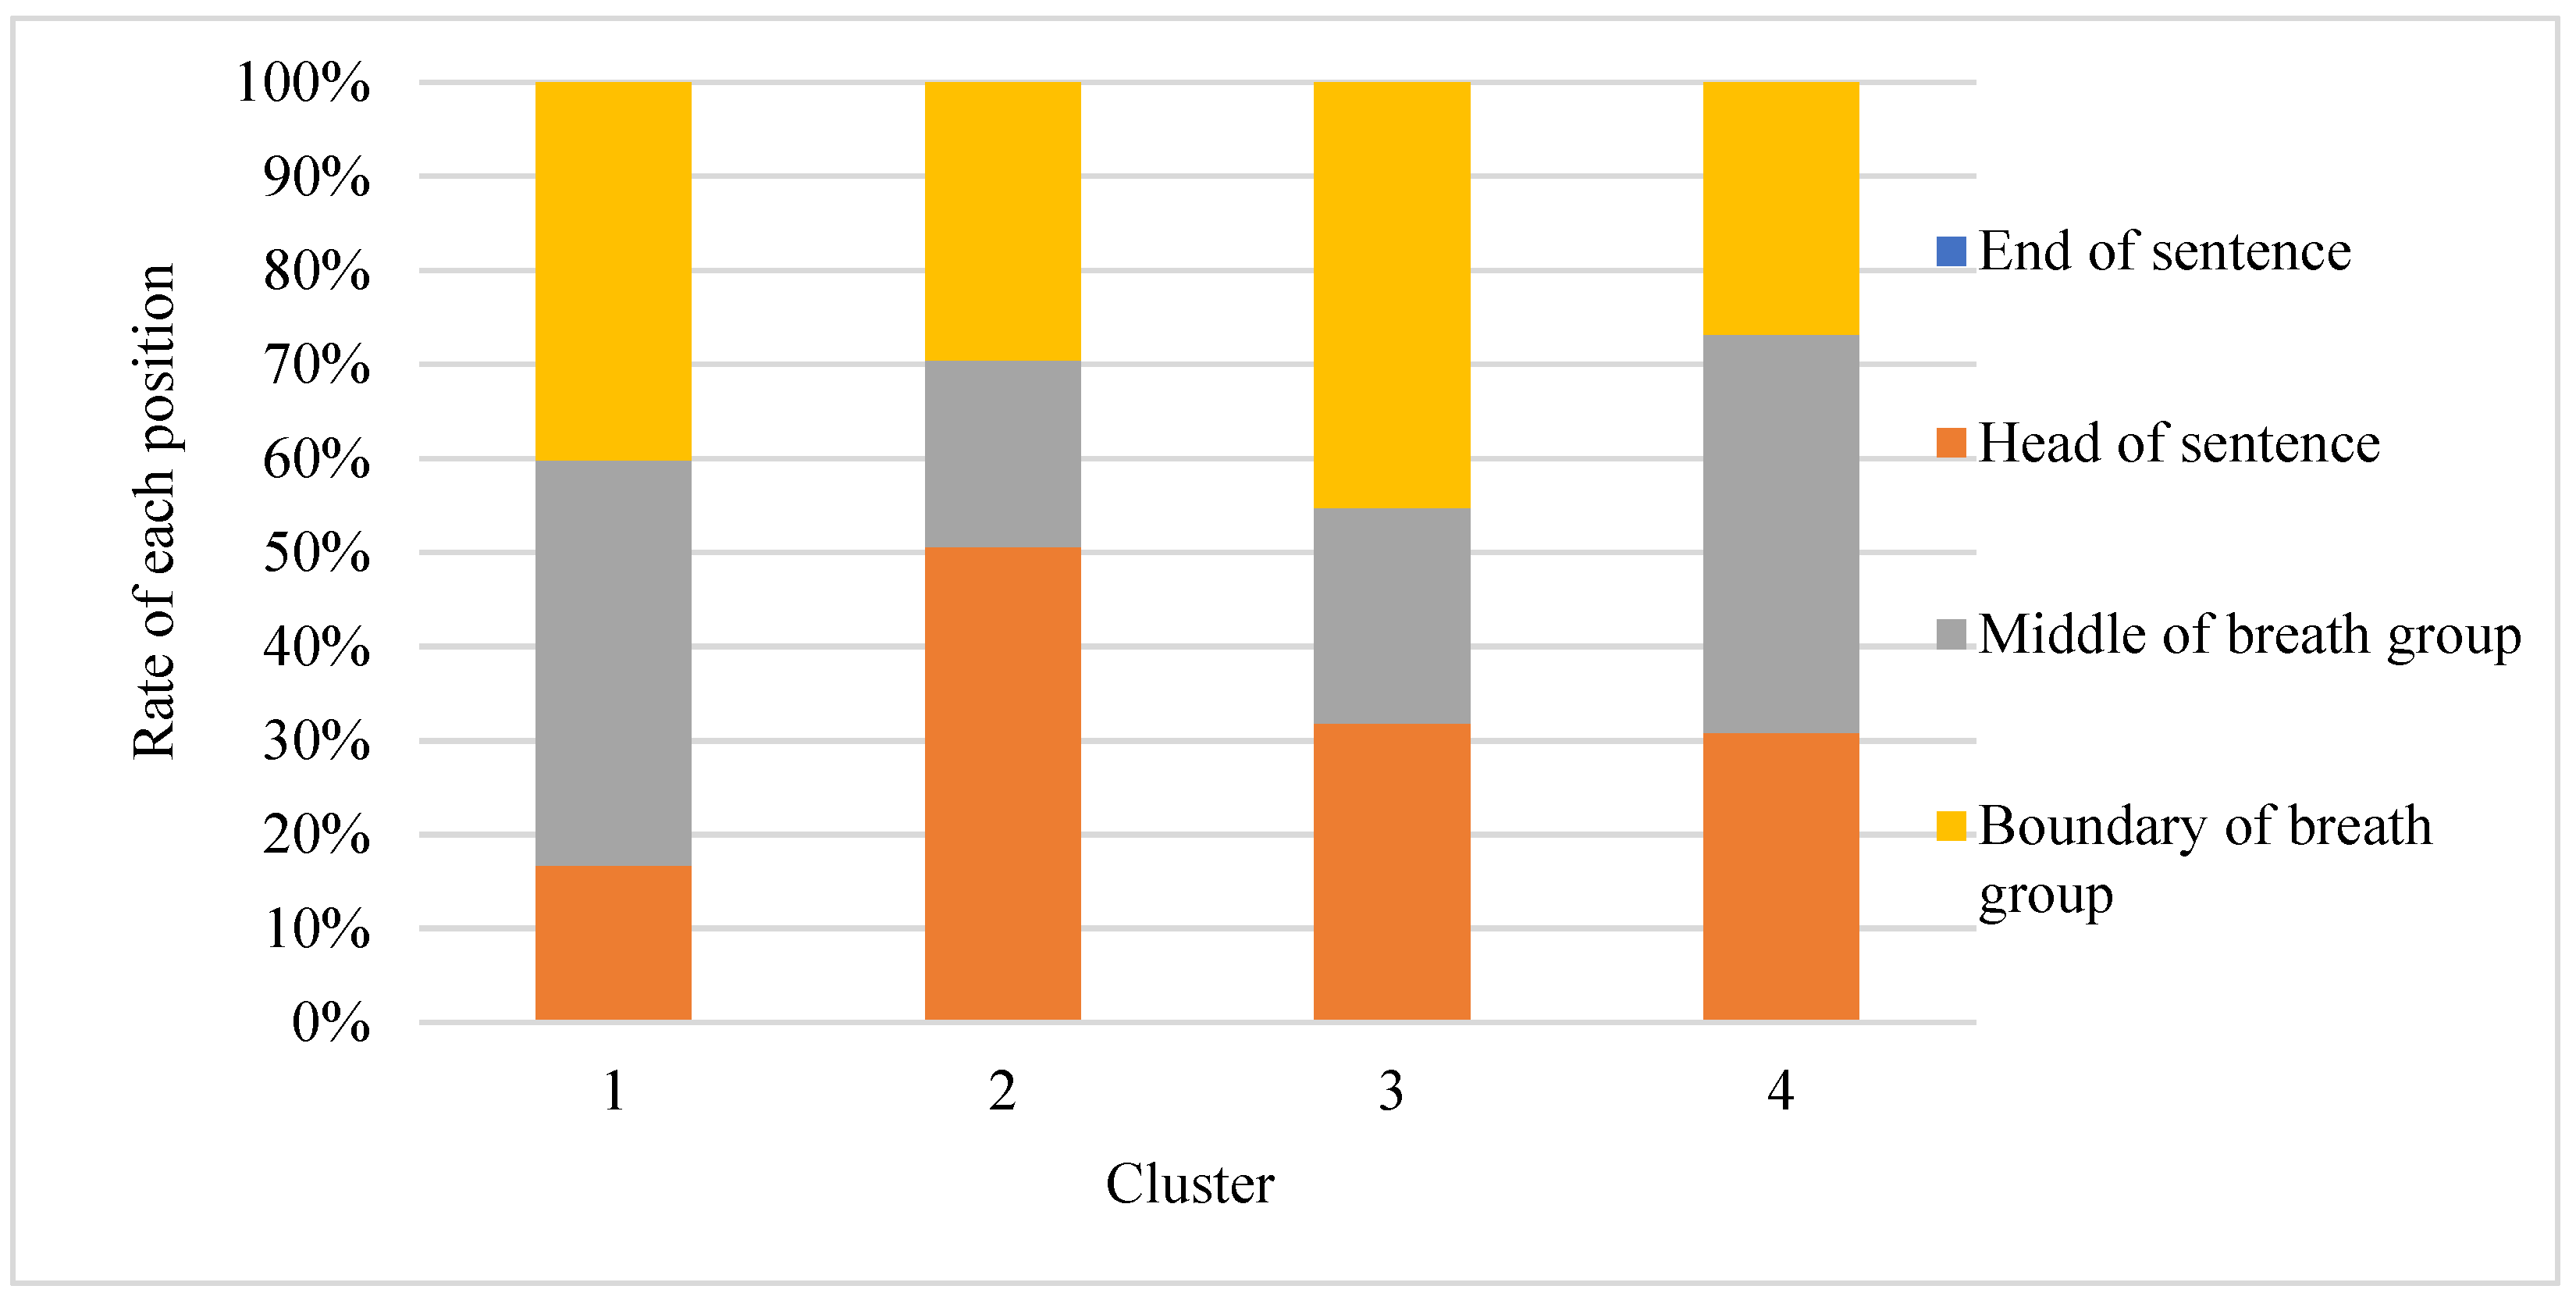
The position of each pause filler in the four groups of people is as shown in
Figure 1. The calculation method for the positional parameters is as follows:
Among them, for , represents the number of pause fillers in position i of the object to be calculated, represents the average number of pause fillers in position i of all people, and represents the number of pause fillers to be calculated. The percentage of pause fillers used by the object at the i-th position is also calculated.
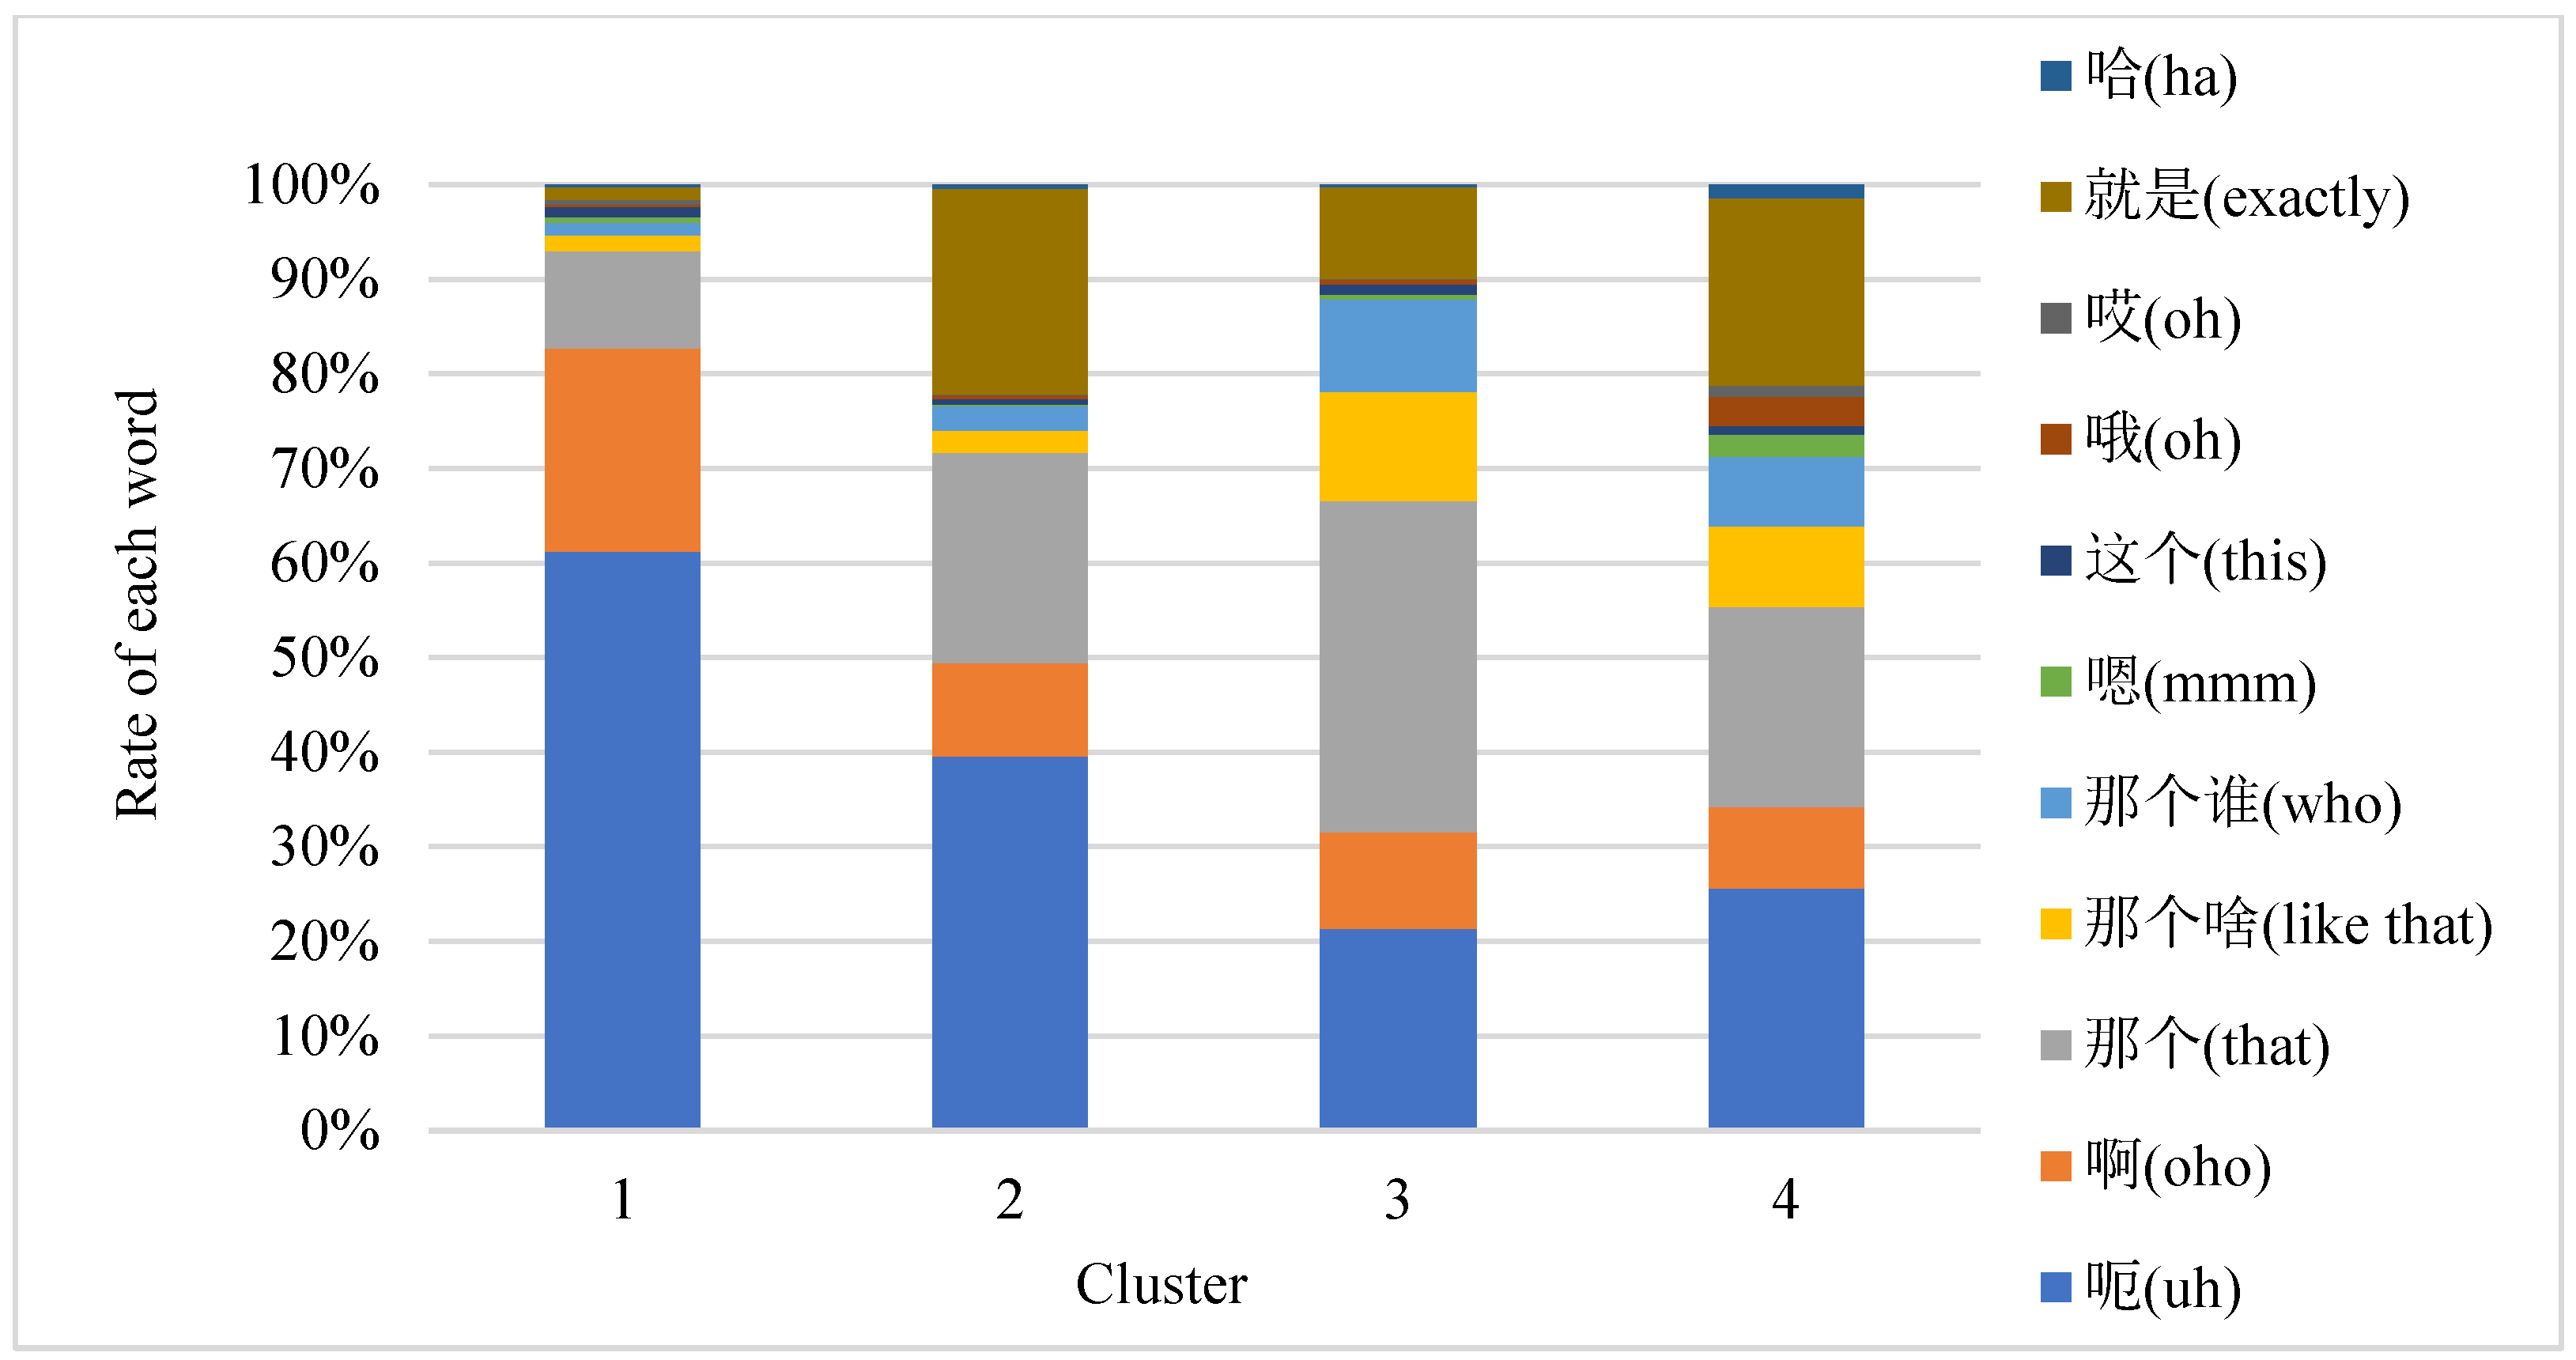
The usage frequency of each pause filler in the four groups of people is as shown in
Figure 2. The calculation method for the frequency parameter is as follows:
Among them, for , represents the number of the i-th pause filler in the pause fillers dictionary of the object to be calculated, and represents the i-th pause filler in the pause filler dictionary of all people. Regarding the average number of pause fillers, represents the percentage of pause fillers used by the object to be calculated on the i-th pause filler in the pause filler dictionary.
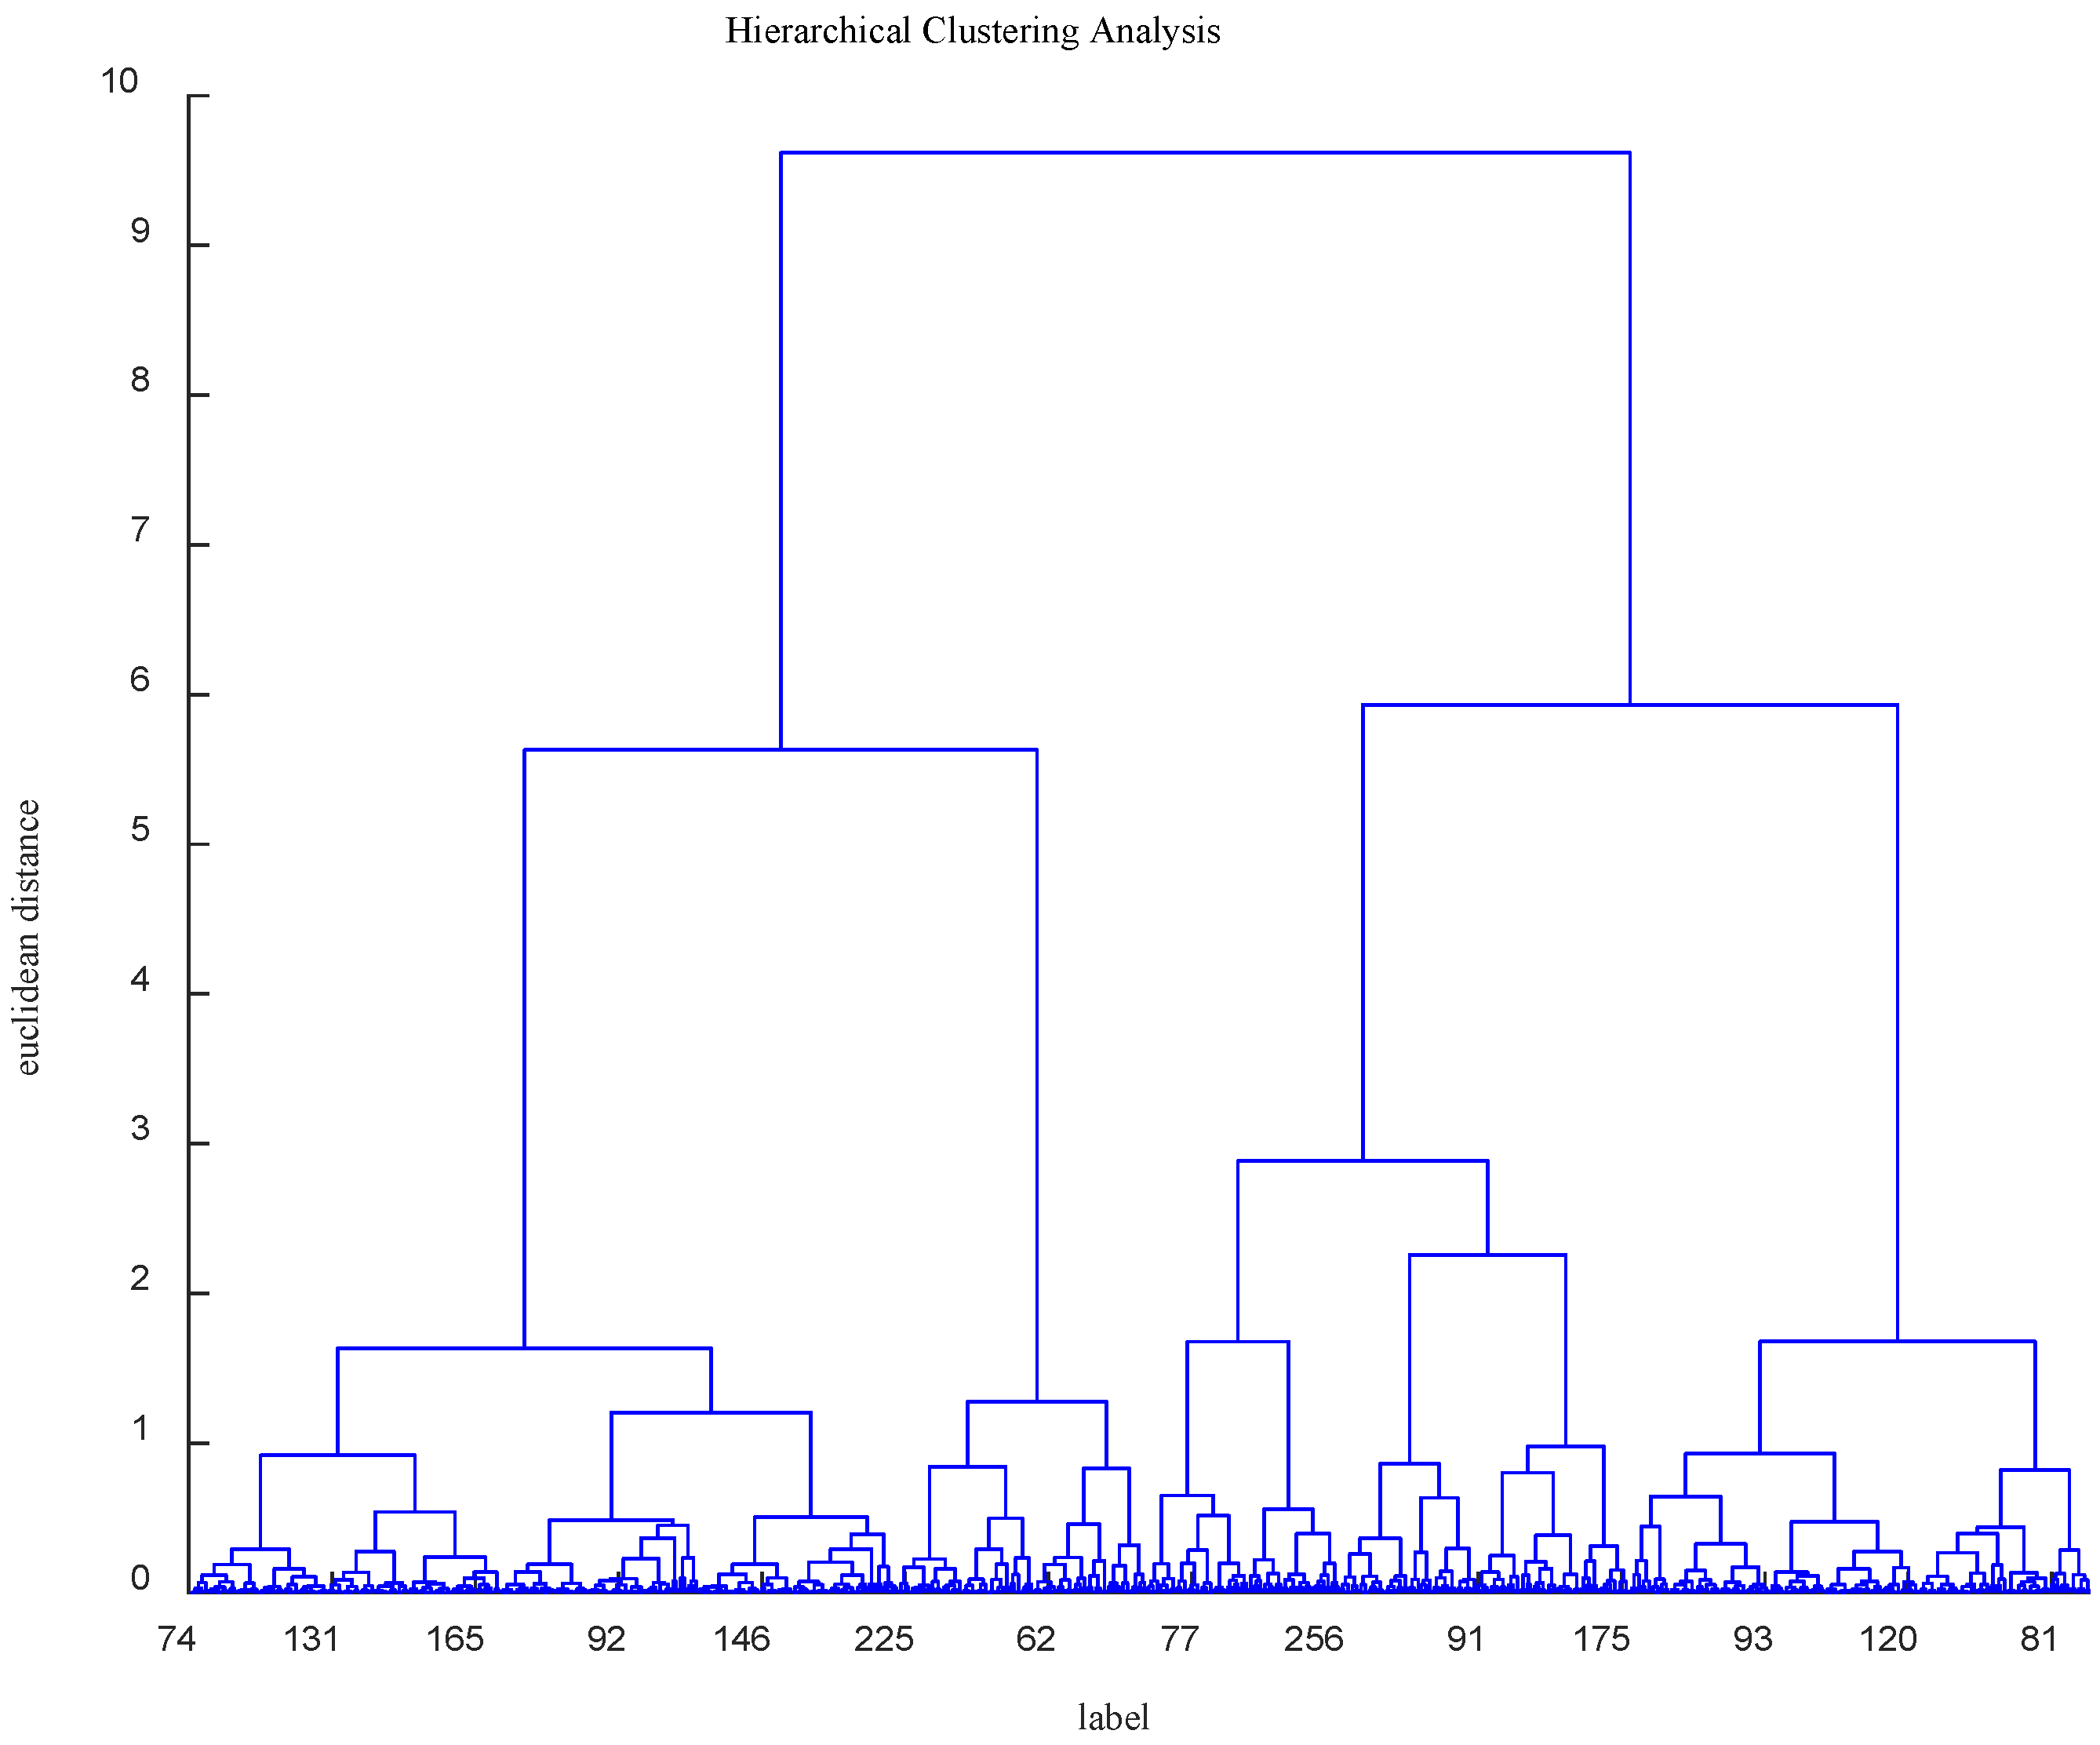
The parameters of location and usage frequency in the MagicData-RAMC dataset were normalized by the maximum and minimum values, and hierarchical clustering was performed. Finally, the 663 speakers were divided into four groups. The final classification result is as shown in
Figure 3. The normalization formula is shown as follows:
3.3. Final Classification Result
We conducted an experiment to construct a dendrogram based on normalized coordinates derived from the location information and usage frequency of 663 speakers. The primary objective of this process was to determine the optimal truncation threshold for effectively partitioning participants into distinct groups.
Initially, a clustering analysis was performed on the 663 coordinate points using hierarchical clustering, which permitted in the construction of a dendrogram. The key feature of hierarchical clustering is the gradual merging of participants into larger groups based on distance metrics until the specified truncation threshold is reached. This process yielded hierarchically organized groupings, necessitating the selection of an appropriate truncation threshold to define the final grouping structure. Based on
Figure 3, three different truncation thresholds were considered: 2, 3, and 6.
In the experiment, the first truncation threshold considered was 2, resulting in the formation of six distinct groups. Subsequently, silhouette coefficients were computed for each group to assess the quality of the clustering. The silhouette coefficient is a metric used to measure the quality of clustering and ranges from −1 to 1, with values above 0 indicating relatively good clustering quality. For a truncation threshold of 2, a silhouette coefficient of 0.1021 was obtained, suggesting relatively lower clustering quality. Next, the truncation threshold of 3 was investigated, leading to the formation of four distinct groups. Once again, silhouette coefficients were calculated for each group, revealing a markedly improved silhouette coefficient of 0.7406 compared to the previous threshold, indicating enhanced clustering quality. Finally, the truncation threshold of 6 was explored, resulting in the creation of two distinct groups. However, at this threshold, the silhouette coefficient was 0.4396, slightly lower than the threshold of 3, suggesting that partitioning participants into four groups might be more appropriate.
Considering both silhouette coefficients and the number of groups, a truncation threshold of 3 was ultimately selected to partition the 663 coordinate points into four groups. This grouping scheme maintains reasonable clustering quality while striking a balance with the number of groups, thereby offering a more accurate representation of underlying structures and distinctions within the dataset.
As shown in
Figure 4, the four groups of people are named as group 1, group 2, group 3, and group 4. The characteristics of group 1 are as follows: pause filler “呃” (‘uh’) is often used; pause fillers are used frequently; the position of the pause fillers is located in the middle and boundary of the breath group; and the personality is relatively introverted. The characteristics of group 2 are as follows: pause fillers “呃” (‘uh’) and “那个” (‘that’) are often used; the use of pause fillers is slightly less than that in group 1; and most of the pause fillers are used at the beginning of the sentence. The characteristics of group 3 are as follows: the pause fillers “呃” (‘uh’) and “那个” (‘that’) are often used; the main reason for using pause fillers is that some nouns have been forgotten; and most of the pause fillers are used at the boundary of the respiratory group. The characteristics of group 4 are as follows: eleven pause fillers are all used; the use of pause fillers is not frequent; and the position of the pause fillers is evenly distributed at the beginning of the sentence, the middle of the breath group, and boundary of the breath group; the use of pause fillers is to connect the context, the personality is relatively extroverted, and this group of speakers has a smoother narrative. The combination of the position and usage frequency of pause fillers is very effective, and the trained model has stronger universality and higher accuracy.
4. Experiments and Analysis
4.1. Data Preprocessing
In terms of text preprocessing, our paper selected the jiagu text analysis library. The commonly used text analysis libraries in Chinese include jieba text analysis library, jiagu text analysis library, HanLP text analysis library, SnowNLP text analysis library, etc. Our paper compared the performance of four text analysis libraries through experiments. Firstly, ten speakers’ texts were randomly selected from the MagicData-RAMC dataset and manually segmented into correct versions. Then, four commonly used Chinese text analysis libraries were used for word segmentation to test their word segmentation abilities in Chinese. The precision, recall, and F1 values of these four Chinese text analysis libraries are shown in
Table 3.
The jiagu text analysis library achieved a word segmentation accuracy of 91.4%, which is 4.8% higher than HanLP, 7.6% higher than SnowNLP, and 10.3% higher than jieba. Its recall rate was also higher than the other three text analysis libraries, by 4.7% to 10.1%, and the F1 score was also higher than the other three text analysis libraries, by 4.8% to 10.2%. In conclusion, extremely high superiority in Chinese word segmentation ability was demonstrated for the jiagu text analysis library. Therefore, this paper selected the jiagu text analysis library for text analysis. With the help of the jiagu text analysis library, pause fillers in the MagicData-RAMC database were labeled, and their position and usage frequency information were extracted for training the RoBERTa model.
4.2. Training of Pause Fillers Prediction Module
This paper selects the MagicData-RAMC dataset to train the pause fillers prediction module and uses the jieba function library to segment, encode, and annotate the text in the dataset. The chosen model for this study is the pre-trained RoBERTa model, which has undergone unsupervised learning on a large corpus and possesses a rich knowledge of language. Based on the loaded RoBERTa model, this paper constructs the task of pause fillers prediction. A new output layer is added on top of the RoBERTa model, using the cross-entropy loss function. Each position of a pause filler is treated as a category, and the model’s objective is to predict whether each position contains a pause filler and the specific category of the pause filler.
The dataset is divided into training, validation, and testing sets in approximately an 8:1:1 ratio. The practice of partitioning a dataset into training, validation, and test sets is widely employed in the field of machine learning. Its primary purpose is to optimize a model’s generalization performance while mitigating overfitting. The training set is used for parameter learning, the validation set serves for hyperparameter tuning and performance monitoring, and the final test set is employed to assess the model’s generalization capabilities. Typically, the training set contains the majority of the data to ensure thorough model learning, while the validation set is used to evaluate model performance and fine-tune hyperparameters. The test set simulates the model’s performance in real-world applications. This practice of splitting the dataset into validation and test sets aids in preventing issues related to information leakage and ensures the accuracy of performance evaluation by avoiding model overfitting during training. To enhance research reproducibility and facilitate result comparisons across different studies, we adopted the same dataset partitioning ratio as cited in [
29]. This standardized approach contributes to the comparability of results among various research endeavors.
During the training process, the RoBERTa model performs forward propagation based on the input text, calculates the prediction results, compares them with the true labels, and then performs backward propagation to update the model’s parameters based on the loss function’s results. We employed random parameter tuning to fine-tune the RoBERTa model, making it better suited to the needs of the pause fillers prediction task.
4.3. Fine-Tuning Based on RoBERTa
In light of the extensive range of hyperparameter values and the efficiency of random search in exploring this hyperparameter space, we opted for a random search approach. The hyperparameters under consideration for optimization included sequence length, batch size, learning rate, and epochs. For sequence length, we chose a uniform distribution spanning from 16 to 256. Regarding batch size, we selected another uniform distribution ranging from 4 to 32. In the case of learning rate, a normal distribution was employed, ranging from 1 × 10⁻⁶ to 5 × 10⁻⁴. Lastly, for the number of training epochs, we utilized a uniform distribution covering the range from 5 to 15. Subsequently, we conducted random sampling within each hyperparameter’s distribution to generate a set of hyperparameter combinations. These combinations were used for model training and evaluation. For each hyperparameter combination, we trained the model and assessed its performance on a validation dataset. Cross-validation was typically employed to ensure accurate performance evaluation.
Based on the F1 score, we identified the hyperparameter combination that exhibited the best performance as the final model configuration. Ultimately, the selected hyperparameter configuration comprised a sequence length of 128, a batch size of 32, a learning rate of 1 × 10⁻⁵, and 8 training epochs.
4.4. Effect Test of Pause Fillers Prediction Module
Our paper compared the pause fillers prediction models trained using BERT and RoBERTa. A text with a length of 5409 words was input into the pause fillers prediction module. It is worth noting that the original text had a length of 5812 words, but after removing pauses, the text length became 5409 words. The output of the pause fillers prediction module was 5794 words. The precision, recall, F1 score, and specificity obtained from the two pause fillers prediction models are shown in
Figure 5.
Figure 5 demonstrates significant accuracy improvements in the pause fillers prediction model when trained with RoBERTa, particularly in word-level accuracy. When considering the positional accuracy, the RoBERTa-trained model achieved an impressive accuracy of 62.2%, indicating a 14% increase compared to the model trained with BERT. Furthermore, it exhibited enhancements in recall by 15.5%, F1 score by 14.7%, and specificity by 0.4%. In terms of word-level accuracy, the RoBERTa-trained pause fillers prediction model reached an accuracy of 48.2%, surpassing the BERT-trained model by a notable 26.7%. Additionally, it improved recall by 29.6%, F1 score by 28.1%, and specificity by 0.9%. These findings underscore the effectiveness of training the pause fillers prediction model with RoBERTa, especially in addressing the accuracy limitations of the BERT-trained model. When integrated into a TTS system, this enhanced model significantly elevates the naturalness of the synthesized speech.
4.5. Performance of Pause Fillers Prediction Module in TTS Systems
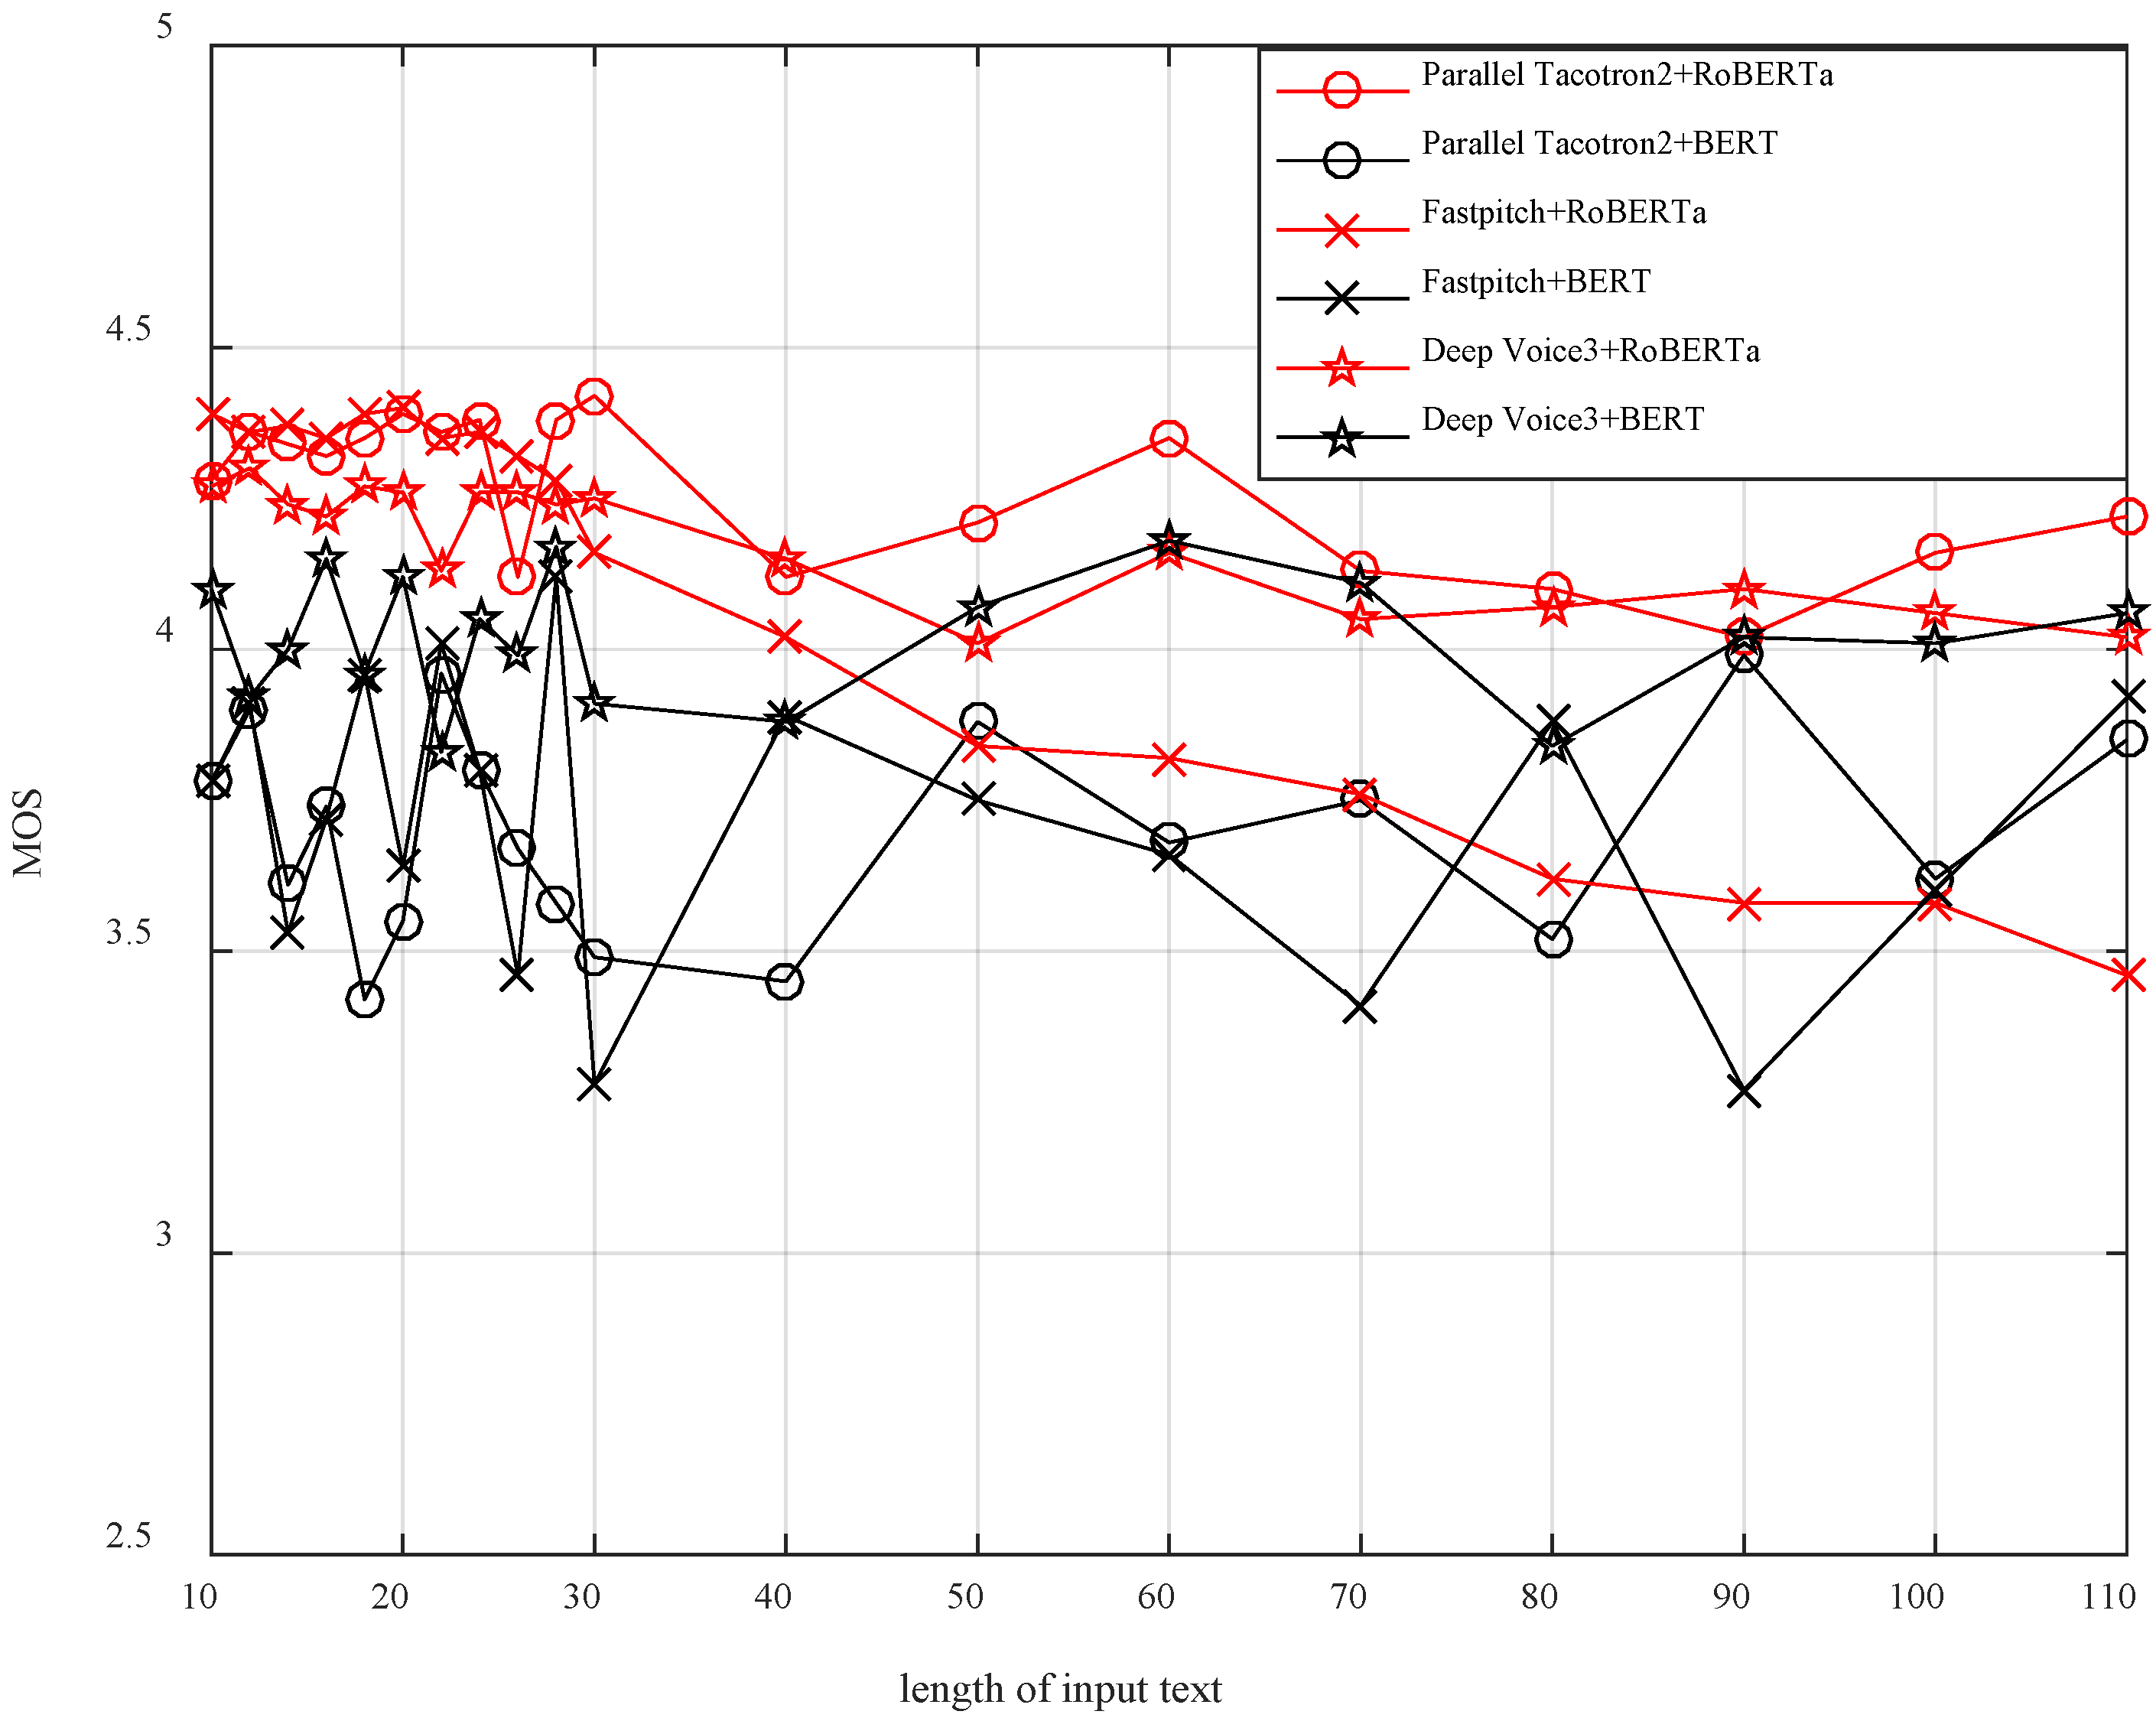
In the experiment, the synthesized speech from the combination of the Parallel Tacotron2 system, FastPitch system, Deep Voice3 system, and two pause fillers prediction modules (BERT version and RoBERTa version) was compared. In order to systematically evaluate the synthesis performance, we meticulously selected a total of 110 text samples from the MagicData-RAMC dataset, including 10 texts with a length of 10 characters, 10 texts with a length of 20 characters, and so on, to ensure comprehensive coverage. Subsequently, we employed two distinct pause-filling word prediction models, namely the BERT version and RoBERTa version, in combination with three different speech synthesis models, namely the Parallel Tacotron2 model, FastPitch model, and Deep Voice3 model, creating various combinations thereof. Finally, we conducted MOS evaluations on the generated speech for these six different combinations.
The main evaluation metric used in the experiment was the Mean Opinion Score (MOS), which represents subjective ratings from listeners. To ensure reliable scoring, we invited 20 participants with good proficiency in Chinese to participate in the evaluation. Each participant received the synthesized speech from different systems and text lengths in different orders to avoid any bias in the scoring process. During the evaluation, participants listened to the synthesized speech and rated it based on aspects such as naturalness, fluency, and coherence, using a five-point scale from 1 (very poor) to 5 (excellent). After collecting and analyzing the ratings from participants, we obtained the MOS values for each system at different text lengths. The MOS values depict the synthesis performance of each system under various text lengths, and the results are presented in
Figure 6.
As shown in
Figure 6, the red line represents the combination of the RoBERTa-trained pause fillers prediction module with three TTS systems, while the black line represents the combination of the BERT-trained pause fillers prediction module with three TTS systems. Overall, it can be observed that the RoBERTa-trained pause fillers prediction module has a greater impact on improving TTS systems compared to the BERT-trained pause fillers prediction module.
5. Discussion
Firstly, the experimental results demonstrate that creating speaker groups based on their pause fillers usage can enhance model performance, especially in predicting F-scores. This finding is significant as it highlights the potential of personalized models in speech recognition. It implies that by better understanding the individual habits and characteristics of speakers, we can improve the prediction of their pause fillers usage, thus enhancing the quality of speech synthesis.
Secondly, we observe that the differences between different speakers have an impact on the model’s performance. Some speakers lead to relatively poor predictive performance, which may be attributed to their distinct pause fillers usage patterns compared to other speakers. This finding suggests the challenges that personalized models may face in dealing with variations among different speakers. It also serves as a reminder that personalized models require more data and fine-tuning to adapt to various speaking styles.
Additionally, we notice that the RoBERTa-trained pause fillers prediction module has a greater influence compared to the BERT-trained module. This indicates the critical role of model selection and training methods in the performance of personalized models. The RoBERTa model’s natural language processing capabilities are more robust, leading to better performance in text comprehension and, consequently, improved speech synthesis quality when faced with extended textual inputs.
Finally, the results of this study hold significant implications for the practical application of speech synthesis systems. It provides a method to enhance the performance of speech synthesis systems and offers valuable insights for future research. By improving the naturalness of synthesized speech, we can better meet user needs, making interactions between users and speech synthesis systems more comfortable and natural. In the future, further research and improvements in personalized models offer opportunities to enhance the performance and user experience of speech synthesis systems.
6. Conclusions
The methods proposed in this paper hold significant practical importance for enhancing the robustness of speech synthesis systems, particularly when addressing the challenge of increasing text length. While scholars typically tend to train models applicable to everyone for personalized speech synthesis, our paper introduces a method that groups speakers based on the positions and usage frequencies of pause fillers, allowing for the training of personalized pause fillers prediction modules for each individual. This approach effectively reduces the data and time costs required to train models for each speaker, thereby improving model practicality. Through this method, we successfully address several challenges in pause fillers prediction, laying a solid foundation for more natural and high-quality speech synthesis.
Furthermore, by introducing the RoBERTa-trained pause fillers prediction module, we significantly enhance the performance of speech synthesis systems, particularly in the synthesis of lengthy texts. The depth and breadth of RoBERTa’s capabilities in natural language processing mean that it excels in pause fillers prediction tasks, providing a strong foundation for improving the naturalness and quality of speech synthesis. This research contributes valuable methods and insights to the field of speech synthesis, offering robust support for the realization of more intelligent and personalized speech synthesis systems. Future research directions include further optimization of personalized models to cater to different individuals’ speech preferences and exploring the potential applications of pause fillers prediction models in real-world speech synthesis scenarios.


