1. Introduction
Melanoma is a form of tumor that emerges when melanocytes experience a malignant alteration. This sort of cancer initiates in the skin, yet as the tumor advances, it can extend across the body as cancerous metastases [
1]. One of the key factors that add to the formation of melanoma is exposure to ultraviolet (UV) radiation, whether from natural sunlight or artificial sources. This radiation can induce skin burns that result in structural changes, potentially leading to scars that could eventually evolve into melanomas. Furthermore, UV radiation can impact the skin’s healing process at a genetic level, causing modifications to the DNA. This, in time, can trigger mutations in normal cells, causing them to become cancerous. Genetic predisposition also plays a vital part, with a history of cancer in the family indicating susceptibility to UV radiation, especially in individuals with characteristics such as fair skin, blue eyes, or a higher number of skin features, such as moles, freckles, or patches. Another contributing factor is the presence of benign growths with an elevated concentration of melanocytes and melanin, presenting as dark areas or moles [
2,
3]. Nevertheless, the most prevalent cause of melanoma is, as previously mentioned, exposure to UV radiation, specifically from sunlight or artificial tanning devices that emit such radiation.
Prolonged or brief yet intense exposure to this form of radiation can lead to mutations within melanocytes, which contributes further to the formation of melanoma. In approximately 25% of instances, melanocytes arise from the transformation of moles, exhibiting characteristics, such as irregular shapes, alterations in color, significant sizes, compromised skin, or itching [
4,
5]. In more advanced cases, there might even be instances of bleeding or inflammation. Melanomas can manifest in areas of the skin devoid of visible indications, on recently formed moles, or other skin marks. While certain moles can surpass a size of 5 mm, certain melanomas can be smaller than 5 mm, and their size does not necessarily indicate malignancy. Interestingly, these melanomas can arise even in regions that have not been exposed to UV radiation [
6]. Melanoma ranks among the leading five causes of death among men and the top seven among women. It develops either from pre-existing lesions that undergo mutations or can originate in healthy skin [
7]. According to [
8], estimates for the year 2023 in the United States indicate around 97,610 new cases of melanoma, with 58,120 occurring in males and 39,490 in females. Additionally, there are projections of approximately 7990 deaths attributed to melanoma, comprising 5420 in males and 2570 in females [
9].
Melanoma undergoes two distinct growth phases: a vertical phase and a radial phase. During the vertical growth phase, cancer cells penetrate deeply into the epidermis and, with time, progress through vertical expansion. At this stage, the cells infiltrate the dermis and give rise to metastasis, spreading throughout the body. Lesions resulting from melanoma are categorized based on their depth: thin (up to one millimeter thick), moderate (between 1–4 mm thick), and thick (exceeding 4 mm in thickness) [
9,
10]. In the study outlined in [
11], it was reported that in 2020, skin lesions in the form of melanoma accounted for 1.3% of all cancer-related deaths in European Union member states. Additionally, this type of cancer constituted 4% of all newly identified cancer cases. These statistics consequently positioned melanoma as the 15th most prevalent cause of cancer-related fatalities within European Union member states [
11].
On a global scale, approximately 57,000 deaths were recorded in 2020, reflecting a mortality rate of 0.4 per 100,000 for women and 0.7 per 100,000 for men [
12]. Presently, the evaluation of such tumors involves a visual examination conducted by a specialized medical professional utilizing a dermatoscope. The diagnostic process takes into account factors such as asymmetry, irregular edges, color variations, size, and thickness. Additionally, blood tests may be conducted to determine the disease’s stage. Biopsy results can also provide insights into potential resection margins [
13]. However, this type of examination is time-consuming and susceptible to human errors.
The survival rate for this form of cancer is heavily dependent on its stage. In stage one, where cancer is immediately detected, the survival rate stands at 90%. In stage two, this rate drops to approximately 45%, and in stage three, it further declines to about 27% [
14]. Consequently, delayed detection significantly increases the risk of fatality. The primary solution in such cases is early detection and analysis of skin damage. Currently, this necessitates a visit to a medical professional and involves a battery of tests for accurate diagnosis. These tests often consume a considerable amount of time and may be invasive, causing inconvenience and anxiety for the patient. Thus, the development of a computer-assisted automatic system for detecting skin lesions with high accuracy becomes imperative. In recent years, researchers have dedicated considerable effort to examining this topic from both clinical and technical perspectives, seeking an optimal approach to skin lesion detection. From a technical standpoint, various methods have been explored, with Deep Learning (DL) techniques emerging as the most effective. In the following sections, we will present the present state of research by delving into some studies conducted between 2020 and 2023 that utilized DL techniques to create systems capable of achieving high-performance automatic detection of skin diseases.
Within the scope of the OPTIM Project (
https://optim.upb.ro, accessed on 2 November 2022), our central aim was to create an Electronic Health Record (EHR) information system seamlessly integrating advanced artificial intelligence (AI)-powered classification solutions for medical images. Moreover, the project sought to introduce novel applications and functionalities tailored to the intricate workflow demands of medical institutions. This initiative was born out of the necessity to establish an information system that houses all the essential modules essential for patient diagnosis and streamlined communication. Given the modern emphasis on efficiency, consolidating interactions within a single platform proves to be advantageous, especially considering the challenges and stress that ailing patients experience while navigating multiple avenues for diagnostic purposes. In essence, this research paper unveils a systematic, criterion-based approach to decision fusion from multiple networks for melanoma detection. This work distinguishes itself through the utilization of F1-score-based weighting, adaptability to dual databases, and a comprehensive empirical assessment, thereby solidifying its superiority over existing applications in the field. In this study, we introduce a multi-network system rooted in decision fusion for melanoma detection, achieved by combining various high-performance Convolutional Neural Networks (CNNs). Subsequently, we juxtapose this system against several web-based tools designed for constructing machine learning models, assessing their compatibility for integration into alternative platforms.
Our primary endeavor centers on the establishment of an EHR system intertwined with an automated melanoma detection mechanism. This involves the creation of a bespoke decision fusion classifier that seamlessly incorporates an array of neural networks, including DarkNet-53, DenseNet-201, GoogLeNet, Inception-V3, InceptionResNet-V2, ResNet-50, and ResNet-101. The core of our research focuses on implementing an EHR system fortified with an automated melanoma detection system. This innovation harmonizes cutting-edge advancements in machine learning, neural networks, and medical diagnostics to address a critical healthcare challenge. The process entails intricately merging a diverse range of neural networks within a tailored decision fusion classifier. The significance of our research emanates from the urgency to enhance melanoma detection’s efficiency and accuracy within the framework of an EHR system. Timely and accurate melanoma detection can profoundly impact patient outcomes, thereby enhancing healthcare interventions. By automating the detection process, we empower medical professionals with a potent tool for swift diagnosis and informed decision-making, ultimately elevating patient care.
Furthermore, our research stands out for its comprehensive approach. It extends beyond crafting the custom decision fusion classifier to encompass a comprehensive comparison with four prominent applications—Google Teachable Machine, Microsoft Azure Machine Learning, Google Vertex AI, and Salesforce Einstein Vision. This comparative analysis serves as a benchmark, affirming the effectiveness and superiority of our approach in automating melanoma detection. In summary, our research introduction shines a light on pivotal components: our ambition to integrate automated melanoma detection within an EHR system, the development of a tailored decision fusion classifier utilizing diverse neural networks, and the profound implications of enhancing medical diagnostics. This is validated through a comprehensive comparison that underscores the efficacy of our system when measured against established applications.
All the abbreviations in this study can be found in Abbreviation.
2. Related Work
In reference to [
15], a CNN classifier was detailed and optimized using metaheuristic techniques for pre-trained network models. The optimization of biases and weights within the CNN models was executed through the implementation of a whale optimization algorithm. Experimental results attained from the application of these algorithms to the Dermquest and DermIS databases showcased superior performance metrics compared to other Deep Learning (DL) techniques. Notably, the achieved metrics included a Sensitivity of 0.95, Specificity of 0.92, and Accuracy of 0.91. Similarly, in the year 2020, Ref. [
16] proposed a system integrating an AlexNet CNN designed to detect four distinct classes: Urticaria, Acne, Eczema herpeticum, and Keratosis. The system’s training on the DermNet database, followed by testing on 69 images, demonstrated a remarkable accuracy ranging from 98.6% to 99.04% [
16].
Another approach surfaced in the work by [
17], which introduced an automatic system that employed hyperspectral data and GoogLeNet CNN. This method entailed utilizing a hyperspectral imager to gather position and wavelength information, and GoogLeNet was employed for the classification of skin lesions into two classes. To accommodate the network’s three input channels, a “Mini Network” layer was added to reduce channel dimensions from 84 to 3. Subsequent evaluation of the system after data augmentation yielded a specificity of 81.2%, accuracy of 77.2%, and sensitivity of 72.3% [
17].
For instance, in [
16], a CNN comprising three hidden layers with 64, 32, and 16 channels for each layer was proposed. Various optimizers, including Nadam, RMSprop, Adam, and SGD Optimizers, were tested using a learning rate of 0.001. The Adam optimizer emerged as the most effective for skin lesion detection. This system successfully differentiated four distinct classes: melanoma, dermatofibroma, squamous cell carcinoma, and nevus pigments. It achieved an accuracy of 99% and an F1 score close to unity when applied to the ISIC database [
18].
In another study, Ref. [
19] employed a ResNet-50 CNN trained on 1072 acral benign nevi images from a Korean hospital. The system aimed to detect acral lentiginous melanoma. A comparative analysis was performed across three survey types: dermoscopic images analyzed solely by 60 physicians, dermoscopic images combined with clinical information, and all previous information supplemented by the CNN’s predictions. The conclusion drawn indicated that detection performance increased progressively across the stages, culminating in an accuracy of 86.9% [
19].
Conducting a comprehensive overview in [
20], researchers analyzed 5112 studies on melanoma detection using DL techniques. Out of these, 55 papers were deemed reputable and selected for in-depth analysis. The study offered insights into recent trends, solutions, opportunities, and challenges concerning melanoma detection via DL techniques. The authors also proposed a taxonomy to summarize various detection solutions [
20].
Furthermore, a study by [
21] delved into CNN models for melanoma detection. The study employed TensorFlow and Keras to build the model, involving varying layers of different network architectures. The system underwent data augmentation, normalization, and transfer learning using CNNs such as InceptionResNet-V2, VGG16, MobileNet, Inception-V3, and ResNet-50. Results demonstrated that InceptionResNet achieved the highest performance, boasting an accuracy, recall, precision, and F1 score of 91%. The system successfully differentiated seven categories of skin lesions [
21].
The evaluation of an approved system in the European market for certain types of skin lesions was conducted by [
22], revealing favorable diagnostic support from the CNN. However, performance limitations were noted for specific lesion types, such as subungual or mucosal lesions. The study used six dermoscopic image sets, including 100 benign lesions and 30 melanoma images each. High specificities and sensitivities were achieved for nodular and superficial melanomas, while subungual and mucosa melanoma detection presented lower performance [
22]. Transitioning to 2021, Ref. [
23] introduced a system incorporating a MobileNet pre-trained CNN for feature extraction. Support Vector Machine (SVM) and linear discriminant analysis (LDA) were utilized for classifying skin lesions into melanoma and non-melanoma classes. By applying cropping and boundary localization to PH2 database images, the proposed system achieved an exceptional specificity of 97.91% and an accuracy of 95% [
23].
In a similar vein, Ref. [
24] proposed two systems involving a CNN model and a combination of CNN and Neural Network NN. The combined model exhibited higher accuracy (92.34%) compared to the standalone CNN model (73.69%). Performance assessments were conducted on 1200 images from the ISIC database [
24]. Additionally, Ref. [
25] assessed the performance of their CNN on the HAM10000 database. The system, incorporating 45 layers and utilizing InceptionResNet-V2, achieved an impressive accuracy of 99.69%, with low false negatives. The system accurately classified images into nevi, non-nevi, and melanoma categories [
25].
In another study, Ref. [
26] focused on pre-processing approaches to enhance a CNN-based skin lesion detection system. Region of interest (ROI) extraction was accomplished using a proposed algorithm, leading to improved CNN model training and evaluation efficiency. InceptionResNet-V2’s performance notably improved by 2.18% when trained on ROI images. ISIC-2019 served as the database for this study [
26]. In a study by [
27], the author employed the EfficientNet-B6 CNN to capture fine-grained features, yielding competitive results with an AUC-ROC score of 0.917 when applied to the ISIC 2020 database [
27].
As research extended into 2022, Ref. [
28] employed Deep Learning to accurately extract skin lesions. A process involving Super-Resolution Generative Adversarial Networks (ESRGAN) improved image quality, followed by the extraction of Regions of Interest (ROI). Employing a CNN and a modified version of ResNet-50, the proposed method displayed high potential with metrics such as F-score, recall, accuracy, and precision, reaching 0.86, 0.86, 0.86, and 0.84, respectively [
28].
Alternatively, Ref. [
29] introduced a novel approach considering a third dimension, namely the depth of the skin lesion. This dimension, captured from light-field images, was combined with two-dimensional (2D) information using Morlet scattering transform and CNN. The combined three-dimensional (3D)–two-dimensional approach yielded the highest accuracy of 94%, while 2D-only and 3D-only dimensions achieved accuracies of 84% and 74%, respectively [
29].
A novel Fuzzy GrabCut-stacked convolutional neural network GC-SCNN-based model was proposed by [
30] for skin lesion detection. Utilizing PH
2 and HAM10000 databases, fuzzy logic enabled boundary detection, and stacked CNNs (GC-SCNN) facilitated feature extraction. Segmentation-enhanced SVMs were then used for segmentation and classification, achieving high metrics, including 100% specificity, sensitivity, and 99.75% accuracy [
30].
Continuing into [
31], the ISIC 2018 database was leveraged to train and test the proposed method. Pre-processing, subsampling, and down-sampling steps were conducted to balance data, and VGG16 and ResNet-50 CNNs were used to detect melanoma. The system demonstrated a dice coefficient of 97.4%, accuracy of 92.3%, recall of 90%, Jaccard index of 99.8%, and precision of 93.3% [
31]. By 2023, Ref. [
32] proposed a CNN strategy for early melanoma detection involving five convolution layers, five pooling layers, a fully connected layer, an input layer, and an output layer. Employing 10,000 and 1000 images for training and testing, respectively, the system achieved an accuracy of 91% [
33].
Lastly, in [
33], two decision fusion methodologies based on CNN models were introduced, involving the extraction of Regions of Interest (ROI) using the Geometric Active Contour (GAC) algorithm. Extracted features were then employed for classification through Random Forest (RF) and NN. The second method included the fusion of features from various CNN models, yielding an accuracy of 96.1%, an ACC of 94.41%, a precision of 88.69%, a sensitivity of 88.9%, and a specificity of 99.44% [
33].
In [
34], a model is presented that utilizes level-set segmentation for effectively segmenting images with non-uniform properties. This model, featured in the current research, boasts exceptional attributes, including high accuracy, speed, rapid convergence, resilience to varying starting contours, and resistance to noise interference. The proposed approach delivers results characterized by a true detection rate of 94%, a false negative rate of 3.62%, and an error rate of 3.3%. The testing outcomes substantiate the assertion that the recommended method for lesion segmentation is robust and remains unaffected by factors such as hair, blood vessels, changes in brightness, and variations in contrast.
In [
35], the authors explore the application of various machine-learning techniques to construct a high-performance ensemble classifier for six distinct skin lesions. Specifically, the researchers utilize Adaboost, voted ensemble, random forest, boosted Gaussian Mixture Model (GMM), voted Convolutional Neural Network (CNN), and boosted Support Vector Machine (SVM). The authors recognize an issue of imbalanced classification across all classes, prompting them to adopt ensemble transfer learning and transfer learning techniques. This strategic choice effectively mitigates the challenge posed by class imbalance.
The study encompasses a total of 19 classifiers, which include 5 ensemble transfer learning models, 6 ensemble models, 4 Machine Learning (ML) and Deep Learning (DL) models, and four transfer learning models. Performance metrics are thoroughly assessed to gauge the effectiveness of each classifier. In the paper’s conclusions, the authors note that the Ensemble voted, GMM, and random forest classifiers exhibit comparatively lower performance than the Adaboost and boosted SVM classifiers. Notably, the ensemble CNN achieves an impressive accuracy rate of 98.67% [
35]. In conclusion, the field of melanoma detection through CNNs and DL techniques has seen significant exploration over the years, with various methodologies offering promising results. However, the challenge remains open due to the need for systems trained on sufficient images that ensure high accuracy and minimal chance of misclassification.
These studies explore various methodologies, architectures, and databases for the purpose of identifying skin lesions, particularly melanoma. Each study tackles the challenge of accurate detection from different angles, often achieving promising results. However, despite the multitude of efforts, the researchers point out that achieving high accuracy and minimizing false detections remains an ongoing challenge due to factors such as dataset size and complexity. In contrast, our paper takes a distinct approach by focusing on enhancing the performance of melanoma detection through a multi-network system utilizing decision fusion. We consider several high-performance CNN architectures, including DarkNet-53, DenseNet-201, GoogLeNet, Inception-V3, InceptionResNet-V2, ResNet-50, ResNet-101, and Xception. The selection of these networks is guided by specific criteria outlined in the methodology section, indicating a methodical approach to network selection.
The key innovation lies in the establishment of decision fusion weights based on F1-scores from each CNN combined with the utilization of specific criteria to select the CNN demonstrating the highest performance based on state-of-the-art analysis. By leveraging these scores, we optimize the performance of our proposed system. We test the system’s effectiveness on two distinct databases, ISIC 2020 and DermIS, highlighting its adaptability to varying datasets. Our approach involves training, validation, and testing on 700, 300, and 200 images, respectively, showcasing rigorous empirical evaluation. Moreover, we conduct a comprehensive comparison of our system’s performance against four other existing applications that utilize CNN combinations, such as Google Teachable Machine, Microsoft Azure Machine Learning (ML), Google Vertex AI, and Salesforce Einstein Vision. This comparison underscores our proposed system’s superior performance.
The structure of this study is as follows:
Section 3 provides insights into the utilized databases and outlines the various CNN architectures applied for skin lesion detection. The methodology employed for validating system performance is also detailed.
Section 4 delves into the experimental results.
Section 5 engages in a discussion of the proposed methodologies and includes a comparison with existing systems. Finally,
Section 6 presents the conclusion of this research.
3. Materials and Methods
To begin, we provide an overview of the databases employed in this study. Subsequently, we delve into the methodologies employed for skin lesion detection. From a hardware perspective, all the software architecture we proposed was executed on a computing device equipped with 16 GB RAM and a 4.5 GHz Core i7 Intel processor. The architecture for our study flow is presented in
Figure 1.
3.1. Databases and Image Pre-Processing
Images from two different dermoscopic image databases, namely, ISIC 2020 and DermIS, were used to test and train the proposed architectures.
3.1.1. ISIC Database
As stated in reference [
36], the complete ISIC database comprises a total of 93,083 images, with 71,372 designated for training purposes and 21,711 earmarked for testing, constituting the most extensive publicly available collection of dermoscopic skin lesion images [
35]. In our previous study conducted in 2022 [
37], we demonstrated that ISIC is the preferred database among researchers for developing high-performance melanoma detection systems. This is due to the meticulous expert labeling of images in the field and the annual challenge that offers monetary rewards.
One of ISIC’s primary objectives is to foster the discovery of optimal computational solutions for skin lesion detection, achieved by offering training and testing databases. The repository primarily encompasses several smaller databases, such as MSK, HAM10000, and BCN2000 [
37,
38]. As previously mentioned, this current paper employs training and testing data drawn from the ISIC 2020 database. This repository contains 33,126 images of skin lesions designated for system training and 10,982 images intended for system testing. These images have been sourced from various institutions situated in diverse global regions and involve over 2000 patients [
36,
39,
40].
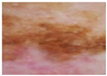
For our study, we selected a subset of 1000 images from the ISIC 2020 database, out of which 700 images were utilized for training the proposed architectures, while the remaining 200 images were used for testing purposes. Examples of images from the ISIC 2020 Database are presented in
Figure 2 and
Figure 3.
3.1.2. DermIS Database
The DermIS database stands as the most comprehensive repository of dermatological information available on the internet. It encompasses a wide array of images depicting nearly all categories of skin conditions and diagnoses, supplemented with differential diagnoses, case reports, and additional pertinent data such as medical journals. This collaborative project is conducted in conjunction with the Department of Socio-Clinical Medicine at the University of Heidelberg and the Department of Dermatology at the University of Erlangen. Within this database, there are 500 images portraying melanoma cases and another 500 images depicting healthy skin conditions [
41,
42].
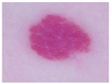
Much like our utilization of the ISIC database, this paper similarly leverages the entire collection of 1000 images within the DermIS database. Out of these images, 700 were allocated for training purposes, while the remaining 200 were dedicated to testing the proposed algorithms. Examples of images drawn from the DermIS Database are showcased in
Figure 4 and
Figure 5.
As commonly understood, the development of a highly effective medical diagnosis system for image classification necessitates the utilization of high-quality input images. Given the absence of suitable databases, image pre-processing becomes an imperative step. Enhancing image quality is pivotal, as it facilitates subsequent processing stages. Initially, this entails adjustments to brightness and contrast, often followed by converting color images to grayscale. The selection of specific image processing techniques hinges on the nature of the classification task at hand. These techniques encompass noise reduction, image resizing, color correction, segmentation, and feature extraction [
43,
44,
45]. In this study, we employ pre-processing techniques that involve adjusting image dimensions through resizing and eliminating hair artifacts. The resizing is tailored to the specific requirements of each CNN utilized. For instance, in the case of the GoogLeNet architecture, images were resized to dimensions of 256 × 256 × 3 pixels, and the aspect ratio was 1:1 (this is the case with all the images we pre-processed). Concerning skin lesion images, certain elements can be regarded as image artifacts, as they impede the computer-aided diagnosis process. Notably, some images suffer from blurriness due to either human movements (by the operator or patient) or the presence of hair or water droplets. Additionally, annotations, such as measuring scales, might be present in certain images, potentially misleading the system.
Our research is dedicated to propelling the field of dermatology and the precise classification and diagnosis of skin conditions through meticulous analysis of skin lesions. In pursuit of this goal, we have deliberately chosen to incorporate the ISIC 2020 and DermIS datasets into our study. The selection of the ISIC 2020 and DermIS datasets for our research is substantiated by a range of factors. Firstly, these datasets hold considerable prominence and are widely employed in the realm of dermatology and the analysis of skin images. They have undergone exhaustive curation and validation by domain experts, instilling confidence in the quality and dependability of the data. Furthermore, the ISIC 2020 dataset centers specifically on images of skin lesions, presenting an extensive compilation of diverse cases encompassing melanoma, nevi, and various other prevalent skin conditions. This dataset showcases a diverse array of images, facilitating the training and assessment of our models across a broad spectrum of skin ailments, thereby amplifying the applicability of our findings. In tandem, the DermIS dataset supplements the ISIC 2020 dataset by furnishing an extensive trove of dermatological images, spanning both clinical and dermoscopic views. This dataset bestows invaluable insights into the visual attributes and patterns of diverse skin disorders, allowing us to delve into and dissect multifaceted aspects of dermatological ailments. Our intent in utilizing these datasets is to harness the collective wisdom and dexterity embedded within the data to engineer robust and accurate algorithms for analyzing skin images. Both the ISIC 2020 and DermIS datasets have undergone rigorous curation procedures, validating the accuracy and authenticity of the data. The involvement of esteemed institutions and experts in dermatology in the compilation of these datasets bolsters their credibility.
Both datasets showcase a diverse array of skin lesions spanning different types, severities, and anatomical locations. This diversity guarantees the precision of our analysis while concurrently ensuring its adaptability to a wide spectrum of skin conditions, thus enhancing the reliability of our conclusions. These datasets have gained substantial recognition as benchmarks within the dermatology community. By incorporating the ISIC 2020 and DermIS datasets, we ensure that our research is benchmarked against established studies, enabling meaningful assessments of the advancements we propose. Moreover, both datasets are openly accessible to the research community, certifying the reproducibility of our experiments and extending the opportunity for fellow researchers to authenticate our findings. This transparent approach bolsters the integrity of our study and cultivates an environment of collaboration.
Fortunately, over time, numerous researchers have addressed the issue of skin lesion image pre-processing, providing effective solutions. In [
46], the authors introduced the DullRazor application, which has gained popularity as a software dedicated to hair removal in skin lesion images. This software employs morphological closing operations followed by the replacement of extracted pixels through bilinear interpolation. The replaced pixels are then smoothed using a median filter. Other techniques encompass various morphological operations along with operators such as bottom-hat [
47], Sobel [
48], Tophat [
49], Laplacian [
50], Radon transform (E-shaver) [
51], and multiscale skeleton-morphological operators (“Virtual Shaver” method) [
52]. In this study, we applied the DullRazor algorithm to eliminate hair artifacts from the selected images sourced from the ISIC 2020 and DermIS databases. This software was chosen due to its superior performance in hair removal, as acknowledged in the current state of the art. The outcomes of employing the DullRazor algorithm on the chosen images are depicted in
Figure 6 and
Figure 7.
The results achieved are notably favorable, although it is worth mentioning that in the case of the ISIC 2020 database, for certain images, we found it necessary to apply the DullRazor algorithm twice. This decision stemmed from the initial outcomes not meeting our satisfaction. The approach involved initially applying the algorithm to the original image. Subsequently, the resulting image underwent the same algorithm again to yield improved outcomes. This two-step process was undertaken because images in the ISIC 2020 database tend to exhibit more noise, annotations, and even thicker hairs intersecting the lesion area. During the initial run, annotations were sometimes eliminated, whereas during the second run, hair removal was the focus. As demonstrated in
Figure 6, due to the thickness of certain hairs, complete removal was not always achieved.
In this research, we will utilize a dataset comprising 1200 images for the purposes of training, validation, and testing. However, this quantity might not provide an ample number of examples for the CNNs to learn effectively. These images have undergone comprehensive labeling, enabling us to possess precise knowledge about each image, including both the predicted and actual labels. Non-random data selection implies that the testing dataset has been intentionally designed to mirror real-world scenarios. This ensures that the model’s performance evaluation is based on data that truly reflect the situations it will encounter in practical use and that we have a robust understanding of the true outcomes for each instance in our testing set. This high-quality ground truth information enables a meaningful assessment of the model’s predictions. Considering these factors, it is possible that the current testing setup, which benefits from non-random data and thorough labeling, may provide reliable insights without the immediate need for larger sample sizes or other validation methods.
3.2. Skin Lesion Detection Using Various CNNs
We employed MATLAB R2023b to implement the various CNN methodologies described. The process of selecting software tools for a project entails a thorough assessment of several factors, which includes analyzing the particular task’s requirements, the availability of relevant functions, and the ease of putting the solution into practice. In our situation, our choice to employ MATLAB and construct the decision fusion classifier within this environment stemmed from a blend of practicality, our existing expertise, and the distinctive features that MATLAB provides. Our team possesses a strong background in MATLAB, which has been developed over years of experience. This familiarity with MATLAB’s programming language, built-in functions, and toolboxes allowed us to expedite the development process and focus on the core aspects of our research.
MATLAB boasts an array of specialized toolboxes catered to diverse scientific and engineering domains. These toolboxes offer a comprehensive selection of functions and algorithms purpose-built for tasks such as data analysis, signal processing, and machine learning. Given the intricate decision fusion techniques involved in our project, the Signal Processing Toolbox and Statistics and Machine Learning Toolbox within MATLAB were invaluable in efficiently implementing these methods. The visual capabilities of MATLAB empower us to visualize and meticulously examine the outcomes of the decision fusion process. The capability to create insightful plots, graphs, and visual presentations enhances our comprehension of the classifier’s performance and aids in conveying our findings to colleagues and stakeholders. MATLAB’s programming environment affords a considerable level of flexibility when it comes to realizing intricate algorithms. This was especially advantageous for our decision fusion classifier, which necessitated complex data manipulation and fusion strategies. The comprehensive array of functions within MATLAB enabled us to fine-tune the implementation to our precise needs. MATLAB’s interactive nature and immediate feedback loop expedite swift prototyping and experimentation. This proved pivotal during the iterative progression of our decision fusion classifier, allowing us to promptly evaluate various approaches, refine parameters, and evaluate performance. Furthermore, MATLAB’s optimization capabilities, which encompass vectorized operations, streamlined the execution of our decision fusion classifier. This efficiency is of utmost significance, particularly when grappling with extensive datasets or algorithms demanding significant computational resources.
The CNNs used were initially pre-trained on the ImageNet database. Therefore, the outcomes we achieved were based on the application of transfer learning techniques. These pre-trained CNNs already possess the ability to differentiate between various fundamental objects. To adapt these CNNs for skin lesion detection, we followed a sequence of steps. Initially, we fine-tuned the pre-trained CNNs to enable the classification of skin lesions into two categories: melanoma and non-melanoma. Subsequently, we initiated the data loading process, specifying the image locations. As elaborated in the preceding section, we partitioned the data into training and testing datasets, each accounting for approximately 70% and 20% of the data, respectively. Following this, we loaded the pre-trained networks. For network retraining, we substituted the final two layers with a new fully connected layer and a classification layer. To accelerate the learning process, we adjusted the weight learn rate factor by increasing its value. To facilitate the training procedure, image resizing was performed. All necessary training options were then configured. Validation images were subjected to classification, and we additionally generated a confusion matrix for each executed architecture [
53,
54].
3.2.1. DarkNet-53
Darknet is an open-source neural network framework specifically designed for tasks related to object detection and recognition in the field of computer vision. Joseph Redmon is the developer behind Darknet, which is renowned for its effectiveness and accuracy in real-time object detection. This framework is coded in C and CUDA languages, rendering it compatible with both CPU and GPU processors. It has widespread applications, spanning surveillance systems, autonomous vehicles, robotics, and more. One of its notable features is the inclusion of pre-trained models, such as YOLO (You Only Look Once), which is used for object detection tasks [
37,
38].
In a study conducted by [
50], a hybrid approach was introduced that combined Residual Network, YOLOv2, and Darknet-19. This network configuration encompasses a total of 53 convolutional layers, employing consecutive 1 × 1 and 3 × 3 convolutional layers. The outcomes presented by [
55] indicate that this architecture outperforms others, including ResNet-152, Darknet-19, and ResNet-101. Darknet is predominantly utilized for YOLO workflows and addressing object detection challenges [
56]. The architectural depiction of DarkNet-53 is illustrated in
Figure 8.
3.2.2. DenseNet 201
DenseNet is a commonly employed architecture in approaches related to Skin Lesion detection due to its remarkable accuracy and efficiency [
37]. The design of DenseNet centers around dense blocks, serving as fundamental components. An illustration of this structure can be observed in
Figure 8. Within each dense block, four densely connected layers are incorporated, characterized by a growth rate of 4. A skip-connection scheme is employed, in which the current layer is connected to all the preceding layers. This configuration efficiently tackles challenges associated with the vanishing gradient problem [
57], Ref. [
58] by aggregating input from previous layers and utilizing it iteratively with fewer convolution kernels. The architectural layout of DenseNet-201 is visualized in
Figure 9.
3.2.3. GoogLeNet
GoogLeNet, also recognized as Inception v1, is a convolutional neural network (CNN) framework crafted by Google researchers. It was developed for the 2014 ImageNet Large-Scale Visual Recognition Challenge (ILSVRC), where it showcased notable performance enhancements compared to prior models. The distinctive feature of GoogLeNet lies in its “Inception module”, which integrates nine such modules side by side. This design choice enables the network to capture information across diverse spatial scales by utilizing multiple filters with varying receptive field sizes. A significant innovation occurs at the culmination of the final Inception module, where global average pooling is employed. This technique adeptly extracts both local and global features from images. Additionally, the Inception module incorporates 1 × 1 convolutions, which serve to reduce the dimensionality of feature maps and enhance computational efficiency.
GoogLeNet is composed of numerous stacked Inception modules, complemented by supplementary layers for classification purposes. In total, the architecture comprises 22 layers and replaces fully connected layers at the network’s end with global average pooling. This strategy curtails the number of parameters within the model and mitigates the risk of overfitting. Despite incorporating 100 independent building blocks, the network retains computational efficiency and adaptability for diverse label sets [
59]. The architectural configuration of GoogLeNet is depicted in
Figure 10.
The Inception architecture is a complex neural network featuring recurrent modules (illustrated in
Figure 11) accompanied by subsequent max-pooling layers, which effectively halve the grid resolution. For the purpose of optimizing training efficiency, Inception modules are exclusively employed in the higher layers, while lower layers incorporate standard convolution layers. This approach permits the augmentation of units at each stage without compounding computational intricacies.
3.2.4. Inception V3
Inception V3 was developed with the aim of reducing the number of parameters and connections while preserving the network’s efficiency. In this iteration, the 7 × 7 convolutional layer has been decomposed into three consecutive 3 × 3 convolutions. Following each convolution, ReLU activation blocks and Batch Normalization are employed. As for the inception blocks within the network, three 35 × 35 inception modules are integrated, each equipped with 288 filters. Additionally, five other grids with dimensions of 17 × 17 and a total of 768 filters, along with two more grids of size 8 × 8 × 1280, are utilized [
37,
60,
61]. The architectural arrangement of Inception V3 is depicted in
Figure 12.
3.2.5. ResNet-50 and ResNet-101
ResNet stands as a widely adopted convolutional neural network architecture that employs residual blocks to construct a network capable of progressively comprehending intricate features as data pass through its layers. This architecture has garnered remarkable success in diverse tasks such as image recognition, object detection, and image segmentation. Originating from the endeavors of Microsoft Research researchers in 2015, ResNet addresses the challenge of training profoundly deep neural networks while evading the performance degradation that often accompanies depth.
The foundational version of ResNet, ResNet-34, encompasses 34 layers and integrates shortcut connections, as depicted in
Figure 13a. These connections imbue the network with residual properties, resulting in fewer filters and a streamlined complexity. Further iterations include ResNet-50 and ResNet-101, housing 50 and 101 layers, respectively, and adopting residual connections [
48]. In ResNet-50, a three-layer bottleneck block supplants each two-layer block found in ResNet-34, yielding a network of 50 layers. Similarly, the integration of more three-layer blocks produces ResNet-101. It is commonly recognized that both ResNet-101 and ResNet-50 exhibit superior accuracy compared to ResNet-34.
Figure 13b visually illustrates the architecture of ResNet [
62].
3.2.6. Xception
Xception, a convolutional neural network architecture unveiled by François Chollet in 2016, stands as a variation of the Inception architecture, dubbed “Extreme Inception.” Designed to enhance the efficiency and effectiveness of conventional Inception models, Xception introduces the concept of depthwise separable convolutions. In conventional convolutional layers, each filter carries out both spatial convolution and channel mixing. However, Xception adopts depthwise separable convolutions, which disentangle these operations into distinct layers.
Depthwise convolutions focus on performing spatial convolution separately for each input channel, while pointwise convolutions execute 1 × 1 convolutions to intermingle the channels. This segmentation of processes mitigates computational intricacies and fosters more streamlined learning. By incorporating depthwise separable convolutions, Xception attains a commendable equilibrium between model intricacy and accuracy. Its adeptness has been demonstrated across a spectrum of image classification tasks, rendering it a staple in numerous computer vision applications [
49]. The architecture of Xception is visually outlined in
Figure 14 [
63].
3.2.7. Inception-ResNet-V2
Inception-ResNet-V2 stands as a sophisticated CNN architecture that amalgamates the attributes of both Inception and ResNet models. Its development aimed at enhancing the efficacy of image recognition endeavors, such as object classification and detection. The essence of Inception-ResNet-V2 revolves around the synergy of inception modules and residual connections as seen in
Figure 15, which collectively facilitate efficient and precise extraction of features from images. This architecture has gained widespread traction in the realm of computer vision applications, consistently attaining cutting-edge results in various image recognition challenges. The structure of Inception-ResNet-V2 encompasses an array of layers and modules that collaborate to extract features from input images. The journey begins with a sequence of convolutional layers dedicated to initial feature extraction. Subsequently, the architecture integrates the Inception module, characterized by parallel convolutional branches equipped with varying filter sizes. This arrangement empowers the network to apprehend features across diverse scales.
Moreover, Inception-ResNet-V2 integrates the ingenious concept of residual connections from the ResNet paradigm. These connections facilitate the learning of residual mappings, which proves instrumental in training deeper networks and mitigating the vanishing gradient predicament. The architectural repertoire extends to encompass other vital components, such as batch normalization, pooling layers, and fully connected layers tailored for classification purposes. Collectively, Inception-ResNet-V2 manifests as an intricate and profound network, capitalizing on the strengths of both Inception and ResNet models to attain remarkable performance in the domain of image recognition tasks [
64].
3.3. Methodology for Skin Lesion Detection Using Web-Based Tools for Machine Learning Models
Our future objective is to research the possibility of integrating a melanoma classification system into an EHR medical information system to optimize the diagnosis and treatment process. As mentioned earlier, we tried four web-based tools for creating machine learning models. This type of application has some advantages:
Ease of Use: Web-based tools are designed to be user-friendly, making them accessible to individuals without extensive programming or technical expertise. Google Teachable Machine, for example, provides a user-friendly interface that allows users to create and train machine learning models using their own data without writing complex code;
Accessibility: Web-based tools are accessible from any device with an internet connection, making them widely available to users worldwide. This accessibility enables researchers, developers, and enthusiasts to access and utilize the tools without the need for specialized hardware or software installations;
Rapid Prototyping: Web-based tools often provide a streamlined process for quickly prototyping and testing machine learning models. These tools offer pre-trained models, pre-processing capabilities, and simplified workflows that facilitate the development and iteration of models for various applications;
Visualization and Interactivity: Web-based tools typically offer visualizations and interactive features that enhance the understanding and exploration of machine learning models. These tools often provide visual feedback, real-time predictions, and interactive controls, enabling users to interact with their models and gain insights into their behavior;
Collaboration and Sharing: Web-based tools foster collaboration and knowledge sharing among users. They often provide functionalities for sharing models, databases, and project files, allowing researchers and developers to collaborate on projects, exchange ideas, and learn from each other’s work;
Cloud Infrastructure: Many web-based tools leverage cloud computing infrastructure, enabling users to offload the computational requirements of training and inference to powerful servers. This eliminates the need for local high-performance hardware and allows users to leverage scalable cloud resources for faster and more efficient model development;
Community Support: Web-based tools often have active communities of users and developers who share resources, provide guidance, and offer support. This community aspect fosters learning, collaboration, and the exchange of best practices;
Integration with Other Tools and Services: Web-based tools, such as Google Teachable Machine, often integrate with other services and platforms, allowing users to incorporate their models into broader applications or workflows seamlessly. These integrations may include exporting models for deployment, connecting to APIs, or integrating with popular frameworks and libraries.
These advantages make web-based tools valuable for individuals and organizations seeking to explore and utilize machine learning without extensive technical barriers. They enable rapid prototyping, collaboration, and accessibility, opening doors for innovation and experimentation in various domains. On the other hand, software-wise, because we used MATLAB to create our classifier, this environment offers several advantages as well:
Comprehensive Toolset: MATLAB provides a comprehensive set of tools, functions, and libraries specifically designed for image processing and analysis. This includes built-in functions for image pre-processing, feature extraction, and machine learning algorithms, making it convenient for developing classifiers for medical images;
Robust Image Processing Capabilities: MATLAB’s image processing toolbox offers a wide range of functions for handling medical images, such as noise removal, image enhancement, segmentation, and feature extraction. These capabilities enable researchers and developers to pre-process and extract relevant features from medical images effectively, improving the performance of classifiers;
Integration with Other MATLAB Toolboxes: MATLAB offers various toolboxes, such as the Statistics and Machine Learning Toolbox, which provide additional algorithms and functionality for machine learning tasks. This integration allows for seamless use of different algorithms and techniques to enhance classifier performance;
Customization and Flexibility: MATLAB provides a flexible environment for developing and customizing classifiers. Users can easily modify and adapt algorithms, fine-tune parameters, and incorporate domain-specific knowledge into their classifiers. This flexibility is particularly valuable in medical imaging, where specific requirements and constraints often exist;
Extensive Documentation and Community Support: MATLAB has a vast community of users and developers, which provides access to comprehensive documentation, tutorials, and forums. This support network facilitates learning, troubleshooting, and sharing knowledge, accelerating the development process and addressing challenges encountered in classifier development for medical images;
Visualization and Analysis Tools: MATLAB offers robust visualization tools that enable users to visualize and analyze medical images and classifier outputs. These tools assist in understanding the behavior of the classifier, validating results, and gaining insights from the classification process;
Deployment Options: MATLAB provides various options for deploying classifiers developed within the MATLAB environment. These include generating standalone executables, creating web applications, or integrating classifiers into other software frameworks or platforms. This flexibility allows for the seamless integration of MATLAB classifiers into existing medical imaging workflows or systems;
Research and Academic Support: MATLAB is widely used in the research and academic communities, and many medical imaging studies and papers employ MATLAB for developing classifiers. This popularity leads to a wealth of research resources, benchmark databases, and code examples that can serve as references or starting points for developing classifiers in medical imaging. The workflow used to evaluate the creation of models for the Google Teachable Machine, Azure Machine Learning, Google Vertex AI, and SalesForce Einstein is in
Figure 16.
3.3.1. Google Teachable Machine
Teachable Machine is a web-based tool for creating machine learning models. The models built with TensorFlow (TensorFlow.js library—open source for machine learning and artificial intelligence) are used to train and run the models in a web browser. The created models use transfer learning techniques. There is a pre-trained CNN where the classes that the end-user works with become the last layer of the CNN. The model used for image classification is MobileNet, and in the end, these models can be incorporated into any application that uses JavaScript as the programming language. The advantage of this tool is that it allows modification of the training parameters of the network for optimal results (learning rate, batch size, number of epochs). Teachable Machine uses three types of models for different types of classifications. It uses MobileNet for image classification, Speech Commands for audio classification, and PoseNet for real-time body position classification from a video capture [
65].
3.3.2. Microsoft Azure Machine Learning
Azure Machine Learning provides various pre-trained CNN models for image classification, including popular architectures such as ResNet, VGG, and DenseNet. The choice of model depends on the specific requirements of the task and the database used.
A huge benefit of using Azure services (functions and APIs such as Computer Vision) is the elimination of the need for companies to use individual servers, therefore reducing implementation costs. Another benefit is that Microsoft-developed services that use image processing on a very large scale can be used through cognitive services.
The algorithm starts with file upload and triggers an event that sends a notification to trigger Azure functions that call the Azure Computer Vision API to analyze the newly uploaded image. Subsequently, Azure functions store the Azure Computer Vision API response, which includes the classification results, along with the metadata of the image. Finally, the results can be reflected in a web interface or a mobile interface [
65]. The main components of the Azure Machine Learning system are [
65,
66]:
Computer Vision API: Retrieves information about the uploaded image;
Azure Functions: Processes the image;
Azure Event Grid: Triggers the Azure functions;
Azure Blob Storage: Stores all uploaded images;
Azure Cosmos DB: Stores metadata about each image and the classification results.
3.3.3. Google Vertex AI
Vertex AI utilizes various neural network architectures, including but not limited to CNNs, RNNs, transformer models, and DNNs. The specific neural network architecture used by Google Vertex AI can vary depending on the task or application being addressed. Google Vertex AI supports various CNN models for image classification tasks [
67].
Some commonly used CNN models in Google Vertex AI include:
EfficientNet: EfficientNet is a family of CNN models that have achieved state-of-the-art performance in image classification tasks while maintaining model size and computational resources efficiency;
ResNet: as already mentioned earlier in this paper, ResNet is a popular CNN architecture known for its deep structure. It uses residual connections to address the vanishing gradient problem and enables the training of very deep networks;
Inception: also described earlier, Inception models are characterized by the use of Inception modules, which allow efficient feature extraction at multiple scales;
MobileNet: MobileNet is a lightweight CNN architecture designed for mobile and embedded devices. It achieves a good balance between model size and accuracy by using depth-wise separable convolutions [
67].
3.3.4. Salesforce Einstein Vision
Einstein Vision and Language Model Builder is an application for automated image analysis that performs image classification based on training a model on a database divided into classes. The application is developed using the Apex, Java, Scala, and Node programming languages. The Einstein Vision application uses a deep learning model based on the API programming language, which allows access to pre-trained classifiers or training custom classifiers to solve various practical cases in the field of computer vision. The Einstein Vision package allows not only image classification but also object detection in an image, optical character recognition (OCR), sentiment prediction from written text, and intent categorization of unstructured texts to understand the user’s objective or desired outcome. All these modules are used to enhance message understanding, conversion, workflow optimization, and automation in the business environment.
Einstein Vision and Language Model Builder is a user interface layered over a REST API (API—Application Programming Interface—a set of definitions and protocols for creating and integrating software applications—specifying the required information content for the consumer (call) and producer (response), REST—Representational State Transfer—a set of architectural constraints) [
68,
69,
70,
71,
72,
73,
74,
75]. When a client makes a request via the REST API, it transfers the representation of the state of the resource to the requester (endpoint). This information is delivered in various formats (JSON—JavaScript Object Notation, XML, Python, PHP, or text) for Einstein, enabling quick dataset uploading, deep learning model training, and model performance testing through an easy-to-use graphical interface. Salesforce Einstein utilizes various neural network architectures such as:
Convolutional Neural Networks: CNNs are often used for image recognition tasks. They consist of multiple layers, including convolutional layers, pooling layers, and fully connected layers. CNNs are designed to learn and automatically extract features from images;
Recurrent Neural Networks: RNNs are suitable for processing sequential data, such as natural language processing. They have recurrent connections that allow information persistence across time steps;
Long Short-Term Memory (LSTM) networks are a type of RNN that can efficiently capture long-term dependencies in sequential data [
75];
These neural networks are used in different components of Salesforce Einstein, such as natural language processing, image recognition, and predictive modeling, to enable advanced AI functionalities. The specific architectures of neural networks used by Salesforce Einstein can vary depending on the task and application and can be customized as needed. The specific details of the neural network architectures and training process used by Salesforce Einstein are not publicly available.
3.4. Methodology for Performance Evaluation
In this paper, we considered the following performance indicators: accuracy (ACC), F1 Score, Sensitivity/Recall, and Specificity, described in
Table 1 with their formulas.
Accuracy—a commonly used metric to assess the overall performance of a melanoma detection system. It measures the proportion of correctly classified melanoma and non-melanoma cases. However, it is important to consider other metrics as well, as accuracy alone may not provide a comprehensive evaluation;
F1 Score—a metric that combines precision and recall. It considers both false positive (FP) and false negative (FN) and provides a balanced measure of a model’s performance. Higher F1 scores indicate better performance in terms of both precision and recall;
Sensitivity/Recall—Sensitivity, also known as recall or true positive rate, measures the proportion of actual melanoma cases correctly identified by the system. It focuses on minimizing false negatives (FN) and is particularly important in medical applications to avoid missing melanoma cases;
Specificity—Specificity measures the proportion of non-melanoma cases correctly identified as such by the system. It focuses on minimizing false positives (FP) and is essential to reducing unnecessary biopsies or false alarms [
76,
77,
78,
79,
80,
81,
82,
83].
In the context of this study, our primary emphasis will be on the assessment of the F1 score as opposed to accuracy. This preference stems from the heightened utility of the F1 score, particularly in scenarios where the costs associated with FN and FP significantly differ. As previously mentioned, the F1 score serves as an amalgamation of both recall and precision, whereby achieving a higher F1 score inherently implies improved precision and recall. Notably, the F1 score does not take into account the count of true negatives that were accurately identified. It is particularly recommended to employ the F1 score in situations where the concern about predicting false negatives is of substantial significance. This approach aligns with our focus on optimizing the performance of our melanoma detection system while considering the potential consequences of missing cases of melanoma.
3.5. Methodology for Skin Lesion Detection Using the Decision Fusion Classifier System
In our previous work [
6], we introduced a decision fusion framework employing diverse classifiers encompassing Neural Networks (NN), feature-based techniques, and CNN. However, the selection process for these classifiers was not addressed. The fusion weights for this system were established solely on the basis of accuracy [
6]. Building upon the insights gleaned from the literature review in Chapter Two, wherein numerous authors demonstrated remarkable outcomes using CNNs, our present endeavor introduces a novel decision fusion classifier. This classifier is designed to amalgamate multiple CNN architectures, thereby striving to attain the utmost performance levels for melanoma detection while also ensuring adaptability to varying databases. The selection of the eight CNN architectures was guided by a comprehensive set of criteria grounded in various considerations:
Performance—the neural network has a proven track record of achieving high accuracy and performance on melanoma detection tasks and on the specific databases we used;
Availability of pre-trained models on large-scale databases, such as ImageNet. Pre-trained models can significantly speed up the training process and provide a good starting point for transfer learning;
Complexity—the neural network is not out of reach complex. The complexity of the CNN architectures should be taken into consideration. Complex models may require more computational resources and longer training times, which can be challenging in practical applications. Hence, it is important to strike a balance between complexity and performance;
Generalization—the network should have a strong ability to generalize to unseen data and can be applied to a variety of different images. Robustness and generalization are crucial for real-world deployment;
Diversity of architectural designs—in the selection of the neural networks, we took into consideration diverse design principles. Each architecture has different features and characteristics, such as the use of residual connections, inception modules, or dense connections. Including diverse architectures can help capture a wider range of melanoma characteristics and improve the chances of detecting different types of melanomas. It is beneficial to choose CNNs that exhibit diverse architectural designs and utilize different techniques. This increases the chances of capturing complementary information and avoiding bias or limitations that might be present in a single architecture;
Previous success—the neural network has demonstrated exceptional performance in melanoma detection or similar medical imaging tasks [
76,
77,
78,
79].
Certainly, these factors are profoundly influenced by the databases utilized for CNN training and the pre-processing methodologies implemented. To ascertain the optimal combination of CNN architectures for our specific application, an iterative approach involving experimentation and refinement is indispensable. In this context, our initial step involves the selection of eight CNNs based on the specified criteria, a process informed by a comprehensive examination of the current state of the field and the demonstrated performance on the extensive ImageNet image database [
83,
84] and pre-processing the images as we mentioned earlier by eliminating the hair and resizing them to fit the input of the CNNs. The chosen CNNs encompass DarkNet-53, DenseNet-201, GoogLeNet, Inception-V3, InceptionResNet-V2, ResNet-50, ResNet-101, and Xception. With the overarching goal of maximizing system performance, we embarked on the exploration of an optimal approach for allocating decision fusion weights to each individual CNN. The resultant architecture of our proposed system is elucidated in
Figure 17.
Where the determination between melanoma and non-melanoma, executed by the decision fusion classifier, is effectuated through the utilization of the following Equations (1) and (2):
where
DM is the decision in case of melanoma, where the false positive is considered as being a non-melanoma predicted as melanoma, and
DNM is the decision in case of non-melanoma, where the false negative is considered as being a melanoma predicted as a non-melanoma,
i represents the image, and
di is the partial decision made by each CNN and
wi the weights calculated from the average mean of the F1 score obtained for ISIC and DermIS database as seen in Expressions (3) and (4).
The ultimate verdict is determined by comparing the values of the Expressions (1) and (2), with the higher value dictating the outcome. For example, if DM > DNM, then the given result is melanoma. In the case of DM < DNM, then the result is non-melanoma. In essence, through (1), we consider the objective melanoma, and through (2), we consider the objective non-melanoma. The choice between using the raw scores before the sigmoid activation function versus the binary decisions (0 or 1) for decision fusion can impact the overall performance and information content of the system.
We took into consideration the advantages and disadvantages before taking the decision to use binary decisions. The advantage of raw scores is that they preserve the continuous nature of the model’s output, providing more nuanced information about the model’s confidence in its predictions. It also maps raw scores to probabilities between 0 and 1, allowing for a gradual transition from very confident negative predictions (close to 0) to very confident positive predictions (close to 1). The disadvantage is that raw scores require additional interpretation to determine decision thresholds, potentially adding complexity to the decision-making process. In addition, choosing appropriate thresholds for raw scores might be subjective and could vary depending on the application and dataset.
The advantage of binary decisions is that they simplify the decision-making process as they provide a clear and immediate answer of whether a lesion is classified as positive (1) or negative (0). They are also straightforward to understand, making them more accessible for medical professionals and users. The downside is that binary decisions discard the nuanced information carried by the raw scores, potentially leading to a loss of subtleties in model confidence. We chose the binary decision in the proposed classifier because it yields some benefits that fit better in our end goal to integrate an automated melanoma detection module into an EHR, such as:
Simplicity and Interpretability: Binary decisions provide a clear and straightforward answer, making it easier for both medical professionals and general users to understand the outcome of the classification. This simplicity is particularly valuable in medical applications where quick and easy interpretation of results is crucial;
Clinical Decision Support: In a clinical setting, where decisions need to be made rapidly, binary outcomes can serve as valuable decision-support tools. For example, a clear positive (1) or negative (0) result can guide medical professionals in determining the next steps for patient care;
Standardization: Binary decisions enable standardized reporting and communication of results. A consistent binary output format simplifies data sharing, communication between different medical institutions, and comparisons across different studies or systems;
Regulatory and Legal Considerations: In medical applications, regulatory agencies often require clear, easily interpretable outcomes. Binary decisions can align with regulatory standards and facilitate compliance;
Reduced Ambiguity: Binary outcomes reduce ambiguity in scenarios where nuanced classifications might lead to confusion or differing interpretations. By providing a direct answer, binary decisions can mitigate potential misunderstandings;
Threshold Adaptation: Binary decisions allow for straightforward threshold adaptation. If specific sensitivity or specificity requirements need to be met, adjusting the threshold for positive predictions can be easily performed to achieve the desired balance;
Efficient Workflow Integration: In automated systems, binary outputs can integrate seamlessly into an HER and other medical record systems, enabling quick and efficient data management and retrieval.
5. Discussion
In this paper, we introduced a multi-network system that employs decision fusion for melanoma detection, utilizing eight high-performance CNNs: DarkNet-53, DenseNet-201, GoogLeNet, Inception-V3, InceptionResNet-V2, ResNet-50, ResNet-101, and Xception. The selection of these CNNs was guided by a thorough analysis of the state-of-the-art. The fusion system’s weights were determined based on the F1 scores achieved by each individual CNN. We evaluated the performance of each architecture on two distinct databases, considering both databases when assigning the fusion weights to enhance adaptability.
As mentioned in our earlier work [
6], the DullRazor algorithm could not completely remove hair from all ISIC 2020 images, partially due to the presence of annotations and thick hair in some images. In Equations (5) and (6), the variables represented by terms such as “d
DarkNet” and “d
Xception” are decisions made by the neural network architectures. The formula essentially represents a weighted combination of these measurements. Each architecture’s measurement is multiplied by a specific weight (such as 0.8543 for DarkNet and 0.7513 for Xception) and then added together. This combination is represented by “
DM” and “
DNM” for two different scenarios.
It is notable that results obtained from the DermIS database tend to be superior to those from the ISIC 2020 database, both in the decision fusion classifier and the web-based applications. This could be attributed to the fact that ISIC 2020 comprises images collected from various sources with different equipment, conditions, and populations. To improve results, a pre-processing step involving hair removal and resizing was necessary for ISIC 2020 images. All results obtained are presented in
Table 7, alongside recent work by other researchers who evaluated their models based on accuracy and F1 score. Our proposed classifier demonstrates superior performance compared to most evaluated classifiers. Although the web-based applications yielded less accurate results, they hold promise in terms of rapid prototyping without the need for pre-processing steps.
Both MATLAB-made classifiers proposed in this paper and web-based tools have their own advantages and use cases. MATLAB offers extensive capabilities, flexibility, and advanced image processing functionalities suitable for complex medical image analysis. On the other hand, web-based tools provide user-friendly interfaces, rapid prototyping, accessibility, collaboration features, and integration with cloud infrastructure. The choice between the two depends on the specific requirements, expertise, and preferences of the user or development team.
Regarding the easiness of integration vs. performance, web-based tools are often designed with simplicity and ease of use in mind. They typically provide user-friendly interfaces and streamlined workflows that make it easy to train and deploy machine learning models. Integration into another platform can be straightforward, as these tools often offer export options or APIs to facilitate model integration. Integrating MATLAB-made classifiers into another platform may require additional steps, as MATLAB is standalone software. Depending on the platform and desired integration method, it may involve exporting the model, converting it to a compatible format, leveraging MATLAB Compiler to create standalone executables, or integrating MATLAB scripts with other programming languages.
Performance comparison between MATLAB-made classifiers and web-based tools, such as Google Teachable Machine, depends on various factors, including the complexity of the problem, database size, and the specific algorithms and techniques employed. Both MATLAB and web-based tools can achieve good performance, but it ultimately depends on the implementation and customization of the classifiers. MATLAB provides extensive capabilities for customization, algorithm selection, and fine-tuning, allowing users to optimize classifiers for specific tasks. This flexibility may result in better performance for complex or domain-specific applications where advanced image processing or tailored algorithms are required.
Web-based tools, such as Google Teachable Machine, are designed for ease of use and rapid prototyping. They often leverage pre-trained models or simplified workflows, which may provide good performance for simpler tasks or generic image classification. However, they may have limitations in terms of customization and adaptability to specific requirements. Ultimately, the choice between MATLAB-made classifiers and web-based tools for integration into another platform depends on the specific requirements, available expertise, and the desired trade-off between ease of integration and performance optimization. If the integration process needs to be simple and streamlined, with a focus on ease of use, web-based tools, such as Google Teachable Machine, may be a more suitable choice. On the other hand, if customization, advanced algorithms, and fine-tuning are critical for achieving optimal performance, MATLAB, with its extensive toolset and flexibility, may be the preferred option.
The novelty and distinctions of this work lie in the fact that this paper focuses on enhancing the performance of a multi-network system through decision fusion for melanoma detection to leverage the strengths of diverse CNN architectures, potentially leading to improved accuracy. The selection of CNN architectures is not arbitrary but guided by specific criteria outlined in the methodology section, and furthermore, instead of treating all networks equally, the paper introduces a weighted decision fusion system. The weights assigned to each network are based on the F1 scores achieved by each CNN. This weighting approach considers the networks’ individual strengths in melanoma detection. This indicates a deliberate and informed approach to choosing networks that are best suited for the task at hand.
On the other hand, the system’s performance optimization takes into consideration two distinct databases, ISIC 2020 and DermIS, that employ real-world data consisting of 1200 images in total for training, validation, and testing. This practical evaluation underscores the system’s applicability to genuine scenarios. The assignment of weights considers both databases, which contributes to the adaptability of the system to varying datasets. This dual-database approach acknowledges the need for robustness across different data sources.
Also, to establish the system’s effectiveness, a comprehensive comparison is conducted against four existing applications: Google Teachable Machine, Microsoft Azure Machine Learning, Google Vertex AI, and Salesforce Einstein Vision. The comparison showcases the superior performance of the proposed system in melanoma image classification. The quantitative comparison substantiates the advancements achieved by the novel approach, positioning it as a valuable contribution to the field of melanoma detection, taking into consideration that the end goal here is to develop an EHR system that has an automated melanoma detection module in order to introduce a way to make melanoma investigations introduced into routine controls in order to improve patient prognosis, disease prevention, reduce treatment costs, improve population management and improve patient empowerment so that patients would take better control of their health and would educate the population that it is better to prevent than to treat. In order to do this, researchers need to give people the means to do so effectively.
6. Conclusions
In conclusion, the incidence of melanoma cases is on the rise, necessitating the need for early detection to prevent further growth. Deep learning has shown promising results in melanoma detection, with increased accuracy observed over time. Our endeavor to develop an EHR system with an automated melanoma detection system has led us to meticulously assess the computational complexity of our approach, which involves the integration of a custom decision fusion classifier utilizing multiple neural networks. This endeavor necessitates a thorough justification, considering the intricate nature of the problem, the significance of accuracy, and the complexities involved in implementation and integration. Addressing the challenge of automating melanoma detection within an EHR system demands a solution that is both sophisticated and accurate. Our custom decision fusion classifier, which combines neural networks such as DarkNet-53, DenseNet-201, GoogLeNet, Inception-V3, InceptionResNet-V2, ResNet-50, and ResNet-101, emerges as a pioneering resolution. This multifaceted approach harmonizes effectively with the intricacies of melanoma detection, enabling us to exploit the strengths of diverse neural networks to enhance accuracy. Our system, built upon a fusion of high-performance CNN architectures including DarkNet-53, DenseNet-201, GoogLeNet, Inception-V3, InceptionResNet-V2, ResNet-50, ResNet-101, and Xception, demonstrates a clear superiority over existing applications in melanoma detection. The decision fusion procedure, optimized based on the F1 scores of each network, exhibits a level of accuracy, precision, and sensitivity that sets a new standard in this critical domain. The experimental evaluation of our proposed multi-network decision fusion system for melanoma detection yields significant implications for both medical research and clinical practice. The outcomes of our rigorous evaluation underscore the remarkable performance and distinct advantages of our approach.
The empirical evaluation, conducted on diverse datasets, including ISIC 2020 and DermIS, reaffirms our system’s adaptability across different image sources, enhancing its potential for real-world deployment. Our careful consideration of two distinct databases in weight assignment contributes to robust and versatile performance. As indicated in
Table 7, our suggested decision fusion classifier displayed the most impressive performance when considering the DermIS database. It achieved a value of 0.9550 for both accuracy and F1 score. Among the other four applications we assessed, Google Vertex AI yielded the next best outcome with an accuracy of merely 0.8333 and an F1 score of 0.8331. This underscores the demonstrated superiority of our proposed system. In the case of ISIC, our system exhibited an accuracy and F1 score of 0.9350.
In light of the decision fusion classifier’s complexity, we conducted an extensive comparison with established applications, namely Google Teachable Machine, Microsoft Azure Machine Learning, Google Vertex AI, and Salesforce Einstein Vision. This comprehensive evaluation substantiated that our approach yields substantial accuracy gains, thereby validating its justification. While the integration complexities presented by the decision fusion classifier are acknowledged, the commendable performance it delivers serves as a counterbalance, accentuating its significance. The implications of these results are substantial. Our proposed multi-network decision fusion system not only advances the state of the art in melanoma detection but also holds immense potential for clinical implementation. By offering superior accuracy and a refined decision-making process, our system stands as a powerful tool for medical practitioners, aiding in early detection and improving patient outcomes.
Given the medical context of melanoma detection, precision is of paramount importance. The combination of neural networks within our custom decision fusion classifier contributes synergistically to elevating accuracy. This heightened accuracy holds direct implications for dependable melanoma detection within the EHR system, potentially assisting medical professionals in prompt diagnosis and treatment decisions. Acknowledging the integration challenges associated with the decision fusion classifier, we are cognizant that incorporating this advanced system may be more intricate compared to alternative options. However, this complexity is offset by the exceptional accuracy it offers. Furthermore, the efficiency and scalability of the decision fusion classifier, despite its complexity, render it aptly suited for the EHR system’s context. The decision to integrate the customized decision fusion classifier bears enduring value. Leveraging multiple neural networks enhances adaptability across a broad spectrum of melanoma cases, ensuring resilience against variations. While the initial integration hurdles are acknowledged, the sustained benefits in terms of accuracy, early detection, and dependable patient care overshadow these challenges.
In conclusion, our work not only introduces a novel methodology but also delivers on the promise of enhanced accuracy and performance. The computational complexity of our tailor-made decision fusion classifier is substantiated by its distinctive and innovative methodology, heightened accuracy in melanoma detection, a well-documented comparative assessment, and the enduring value it brings to the EHR system. Despite the integration challenges, the advantages it confers to medical diagnostics validate this as a prudent and justified choice. The implications of our experimental evaluation point towards a future where melanoma detection can be augmented by our innovative approach, ultimately contributing to more effective and reliable healthcare interventions. The next steps for improving the solution would be to find a way to integrate our classifier obtained using MATLAB to have better accuracy and flexibility to adapt algorithms for an unlimited number of tasks. This will require an integration between MATLAB and the SalesForce Platform.


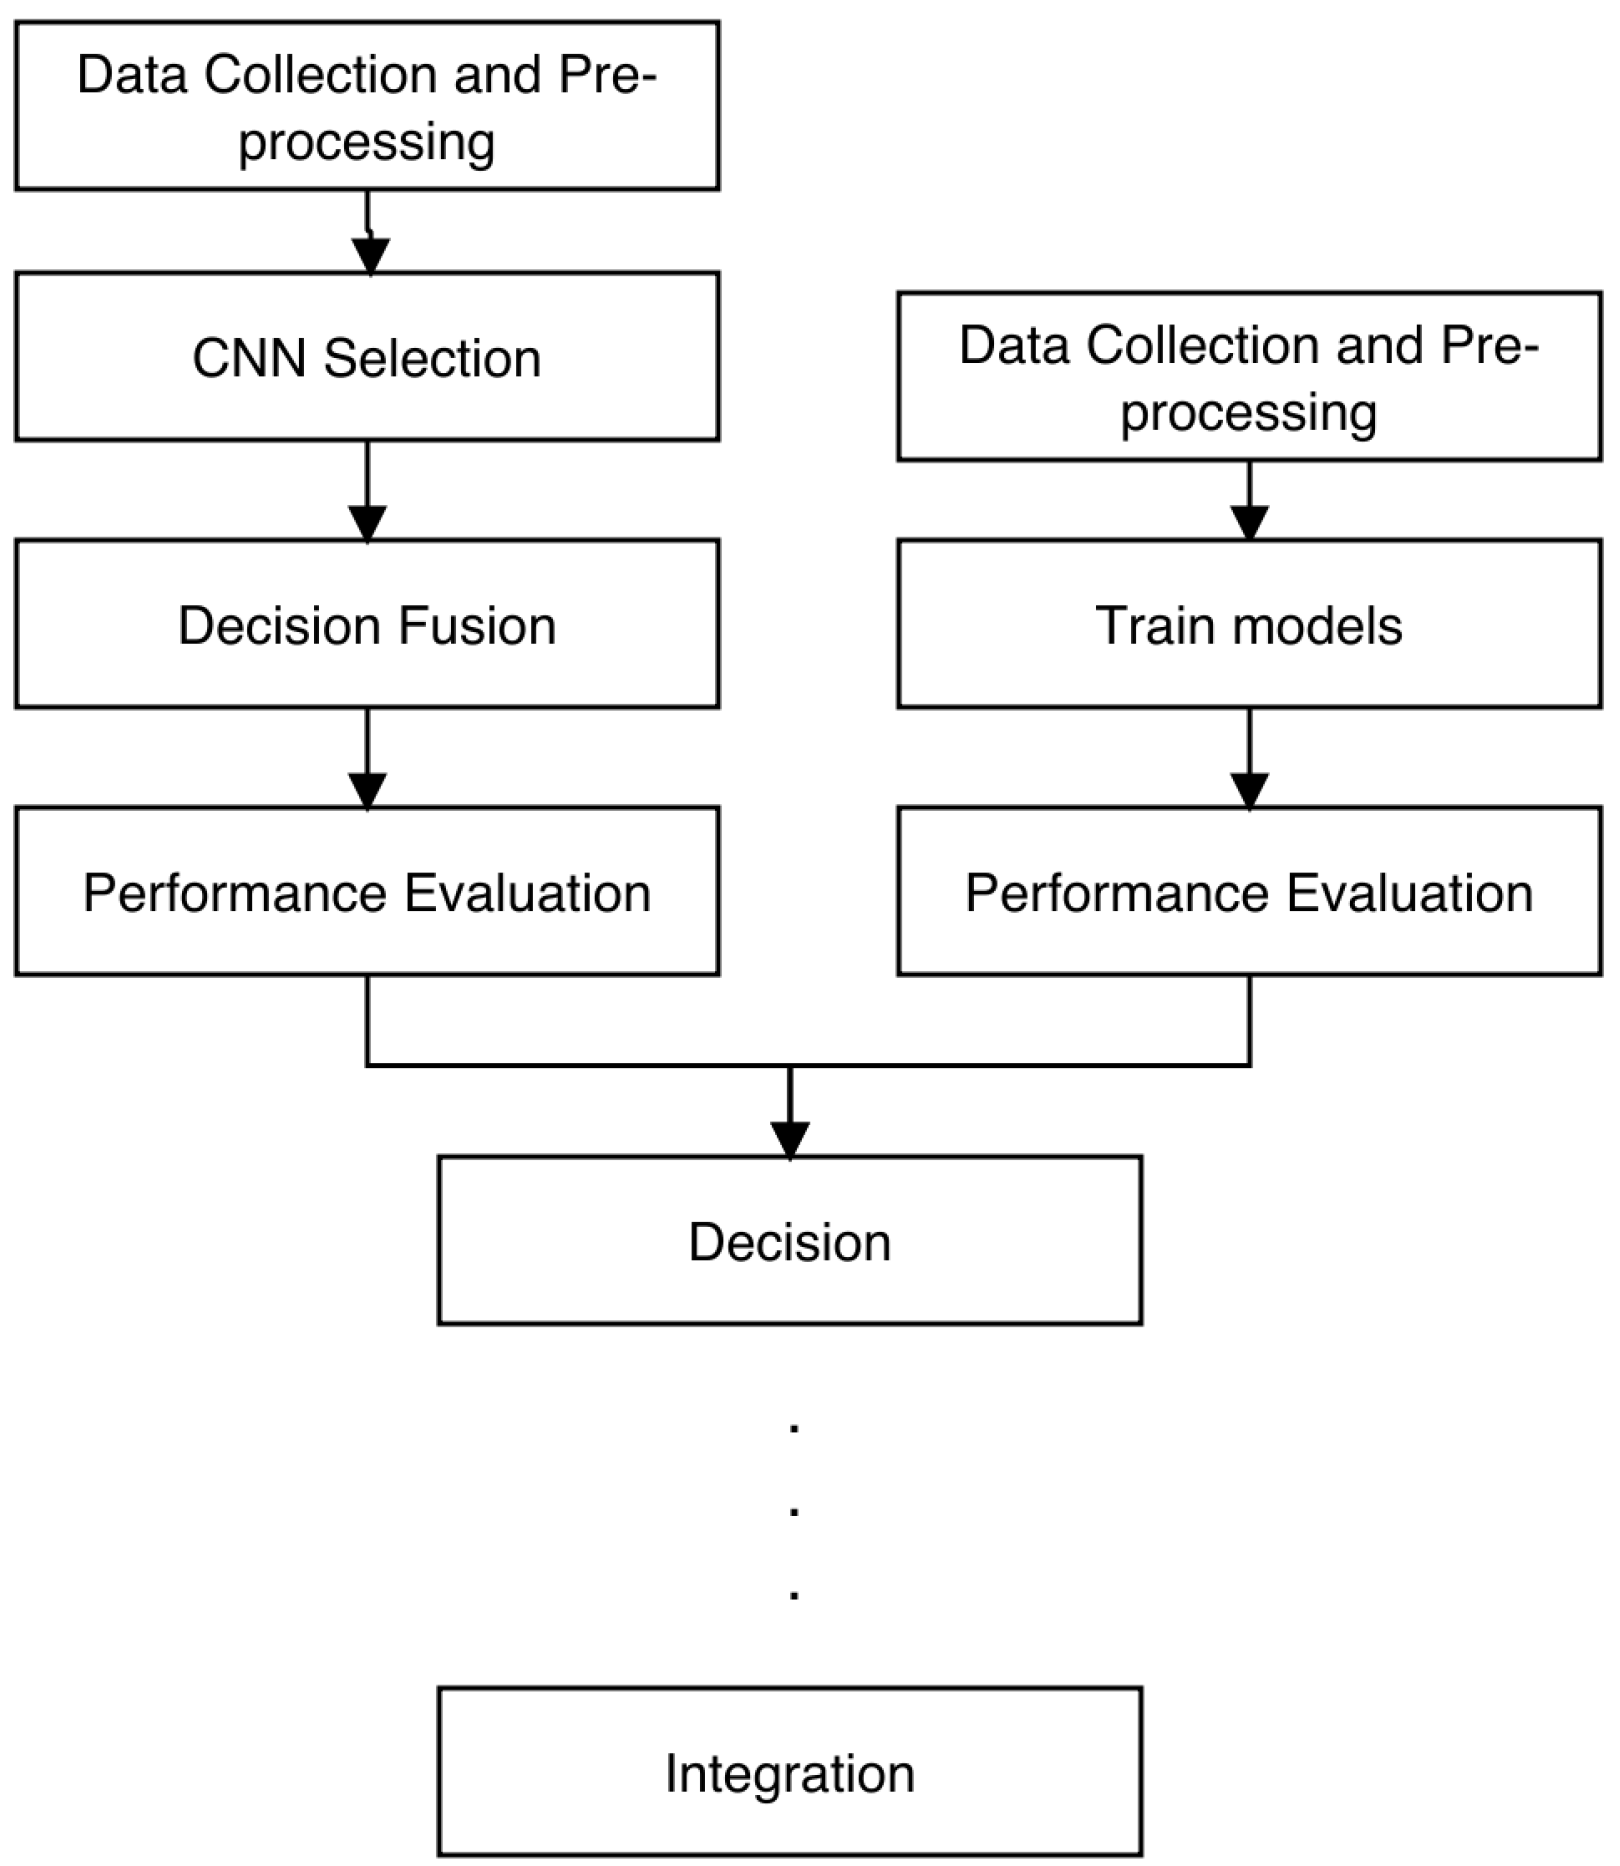


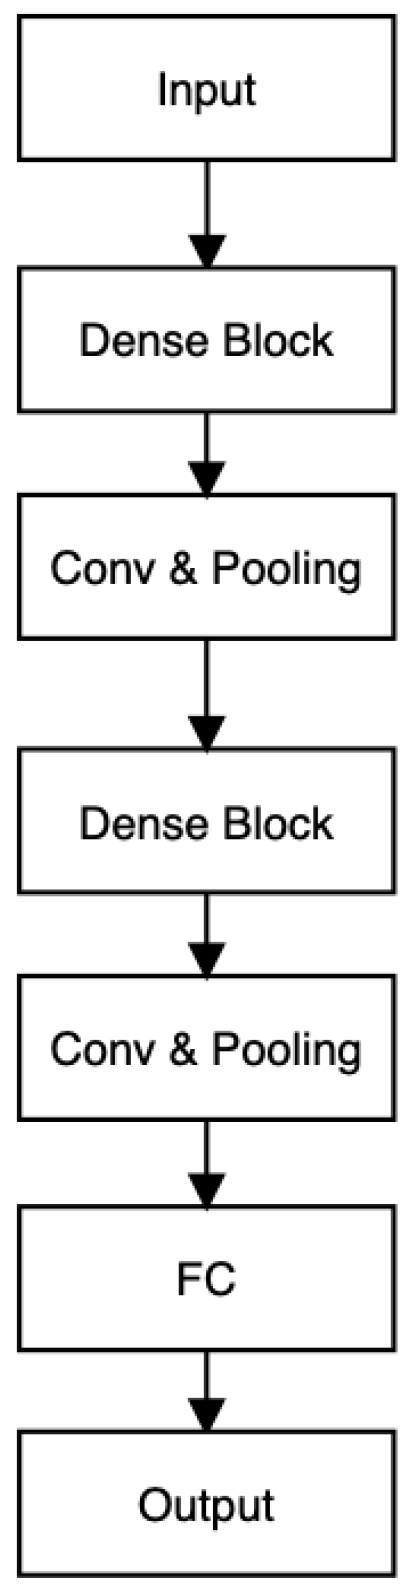


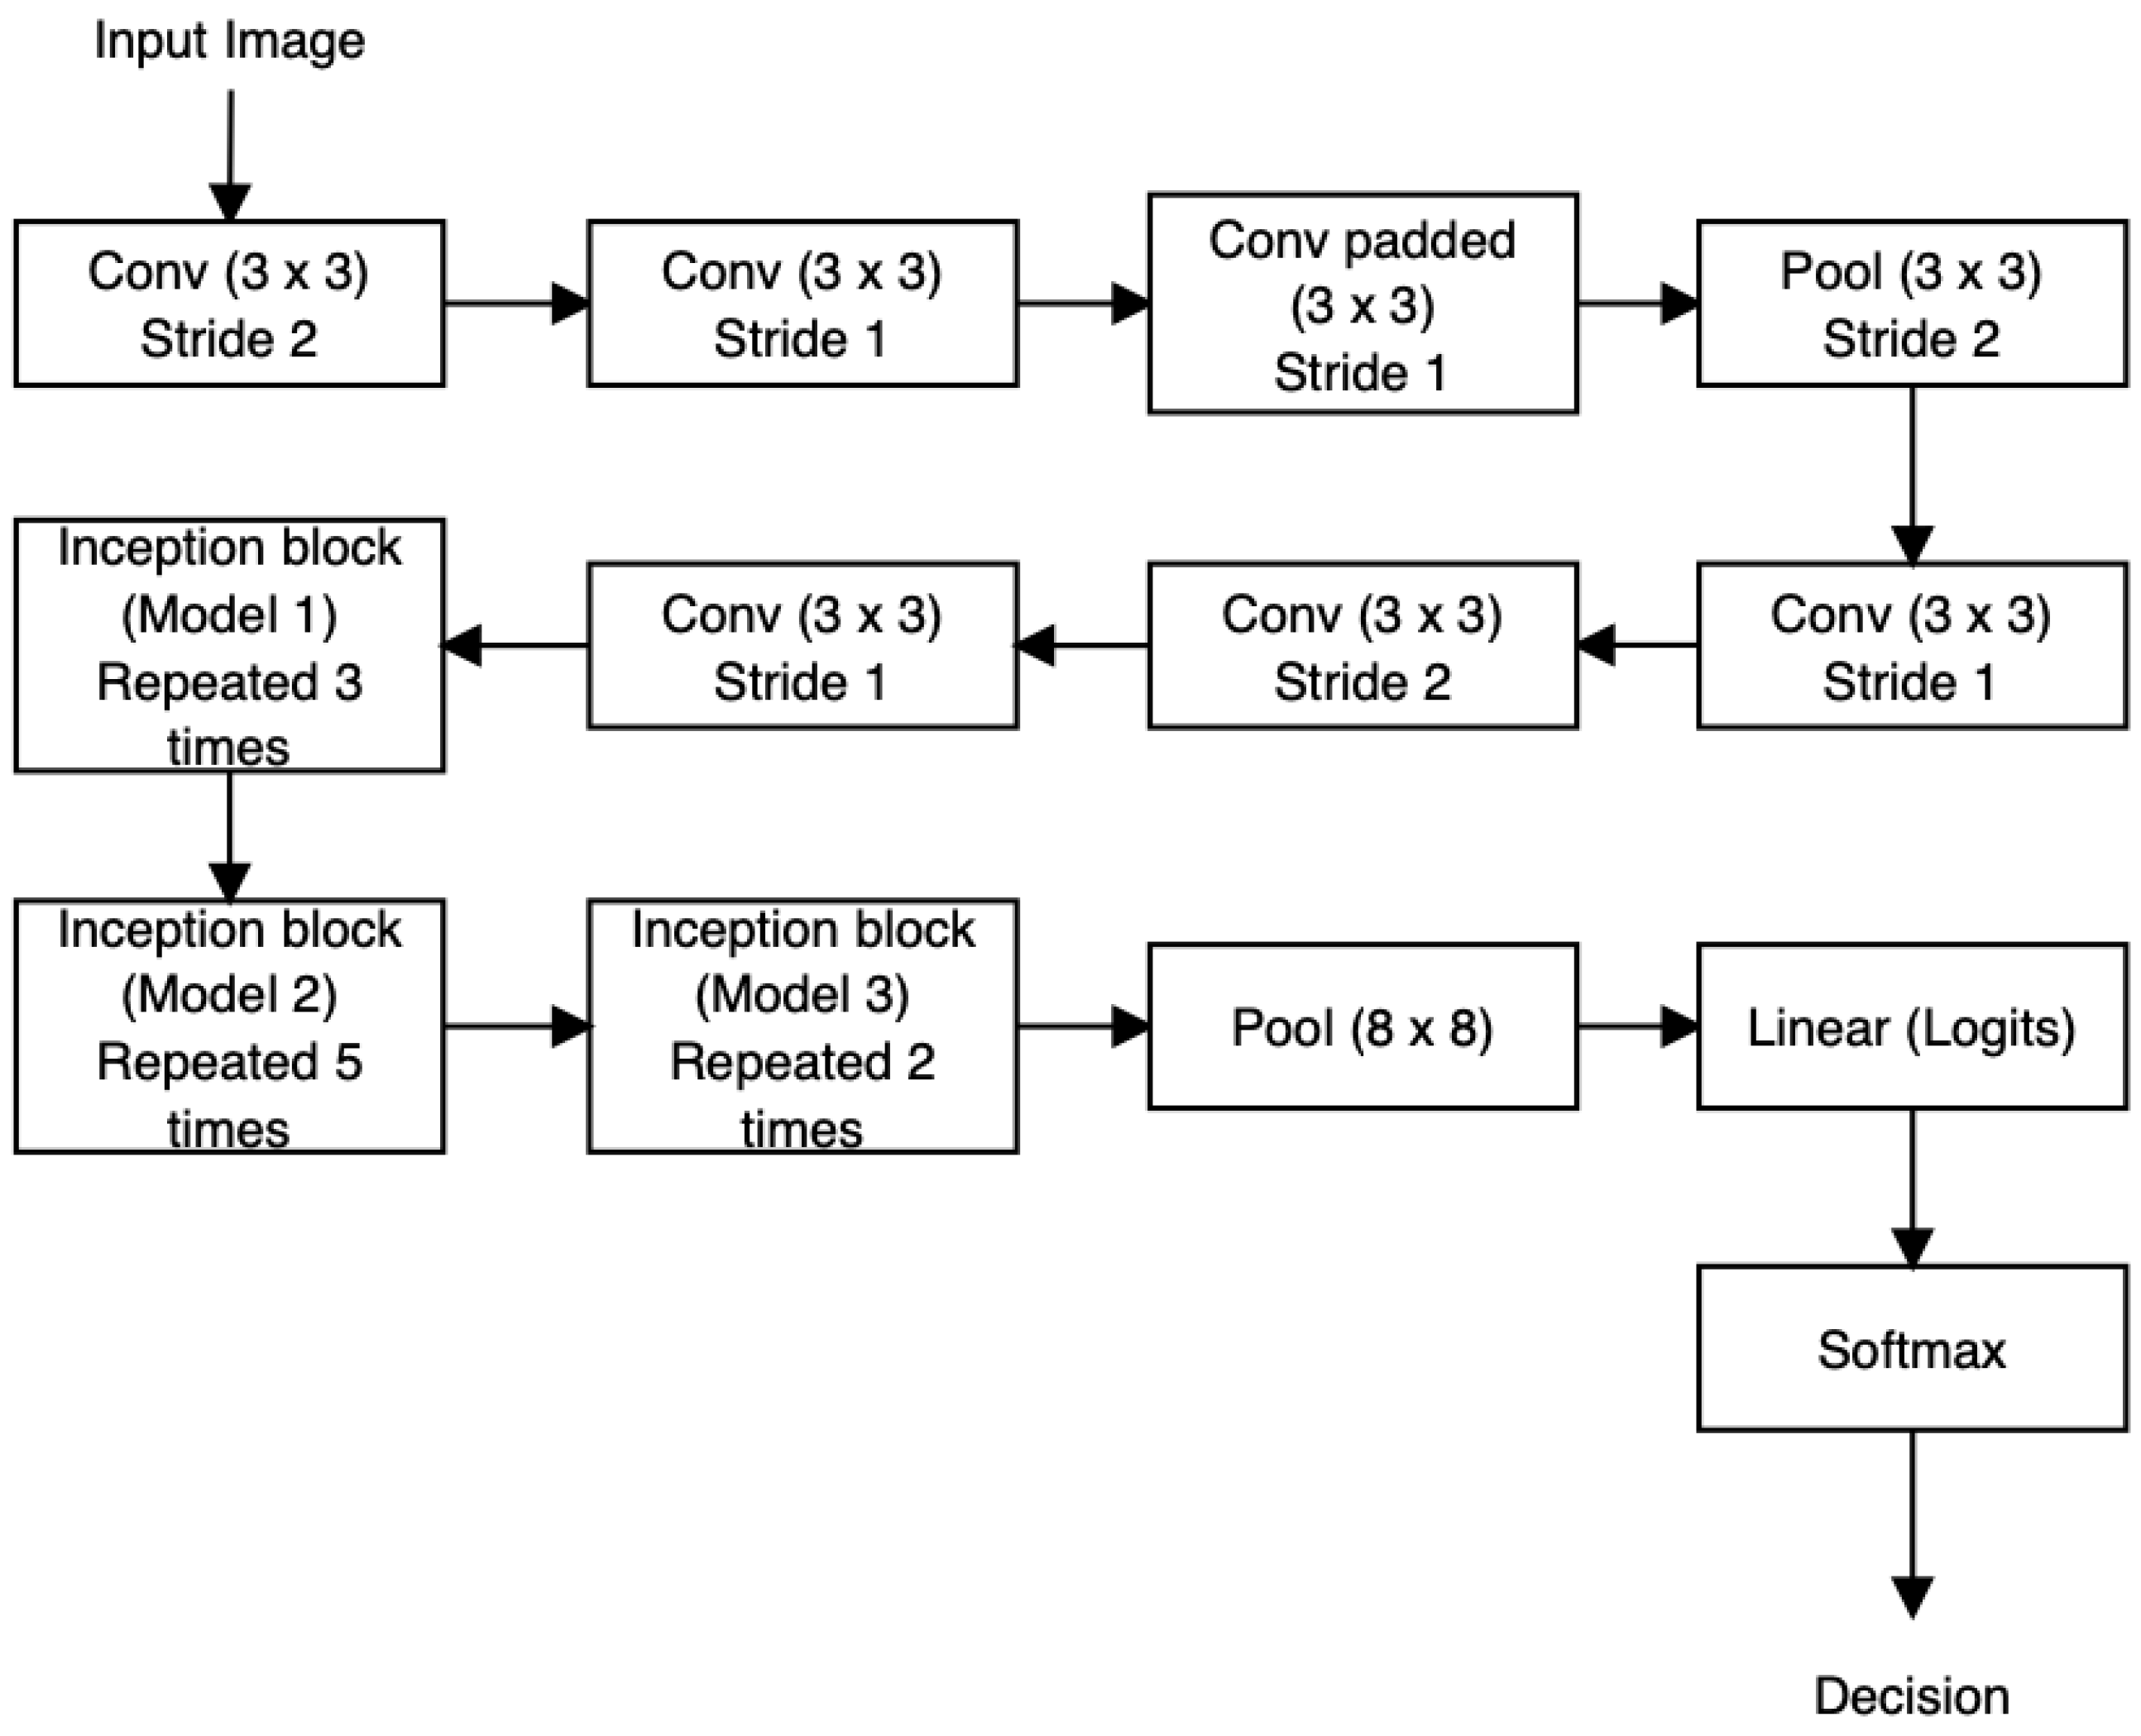
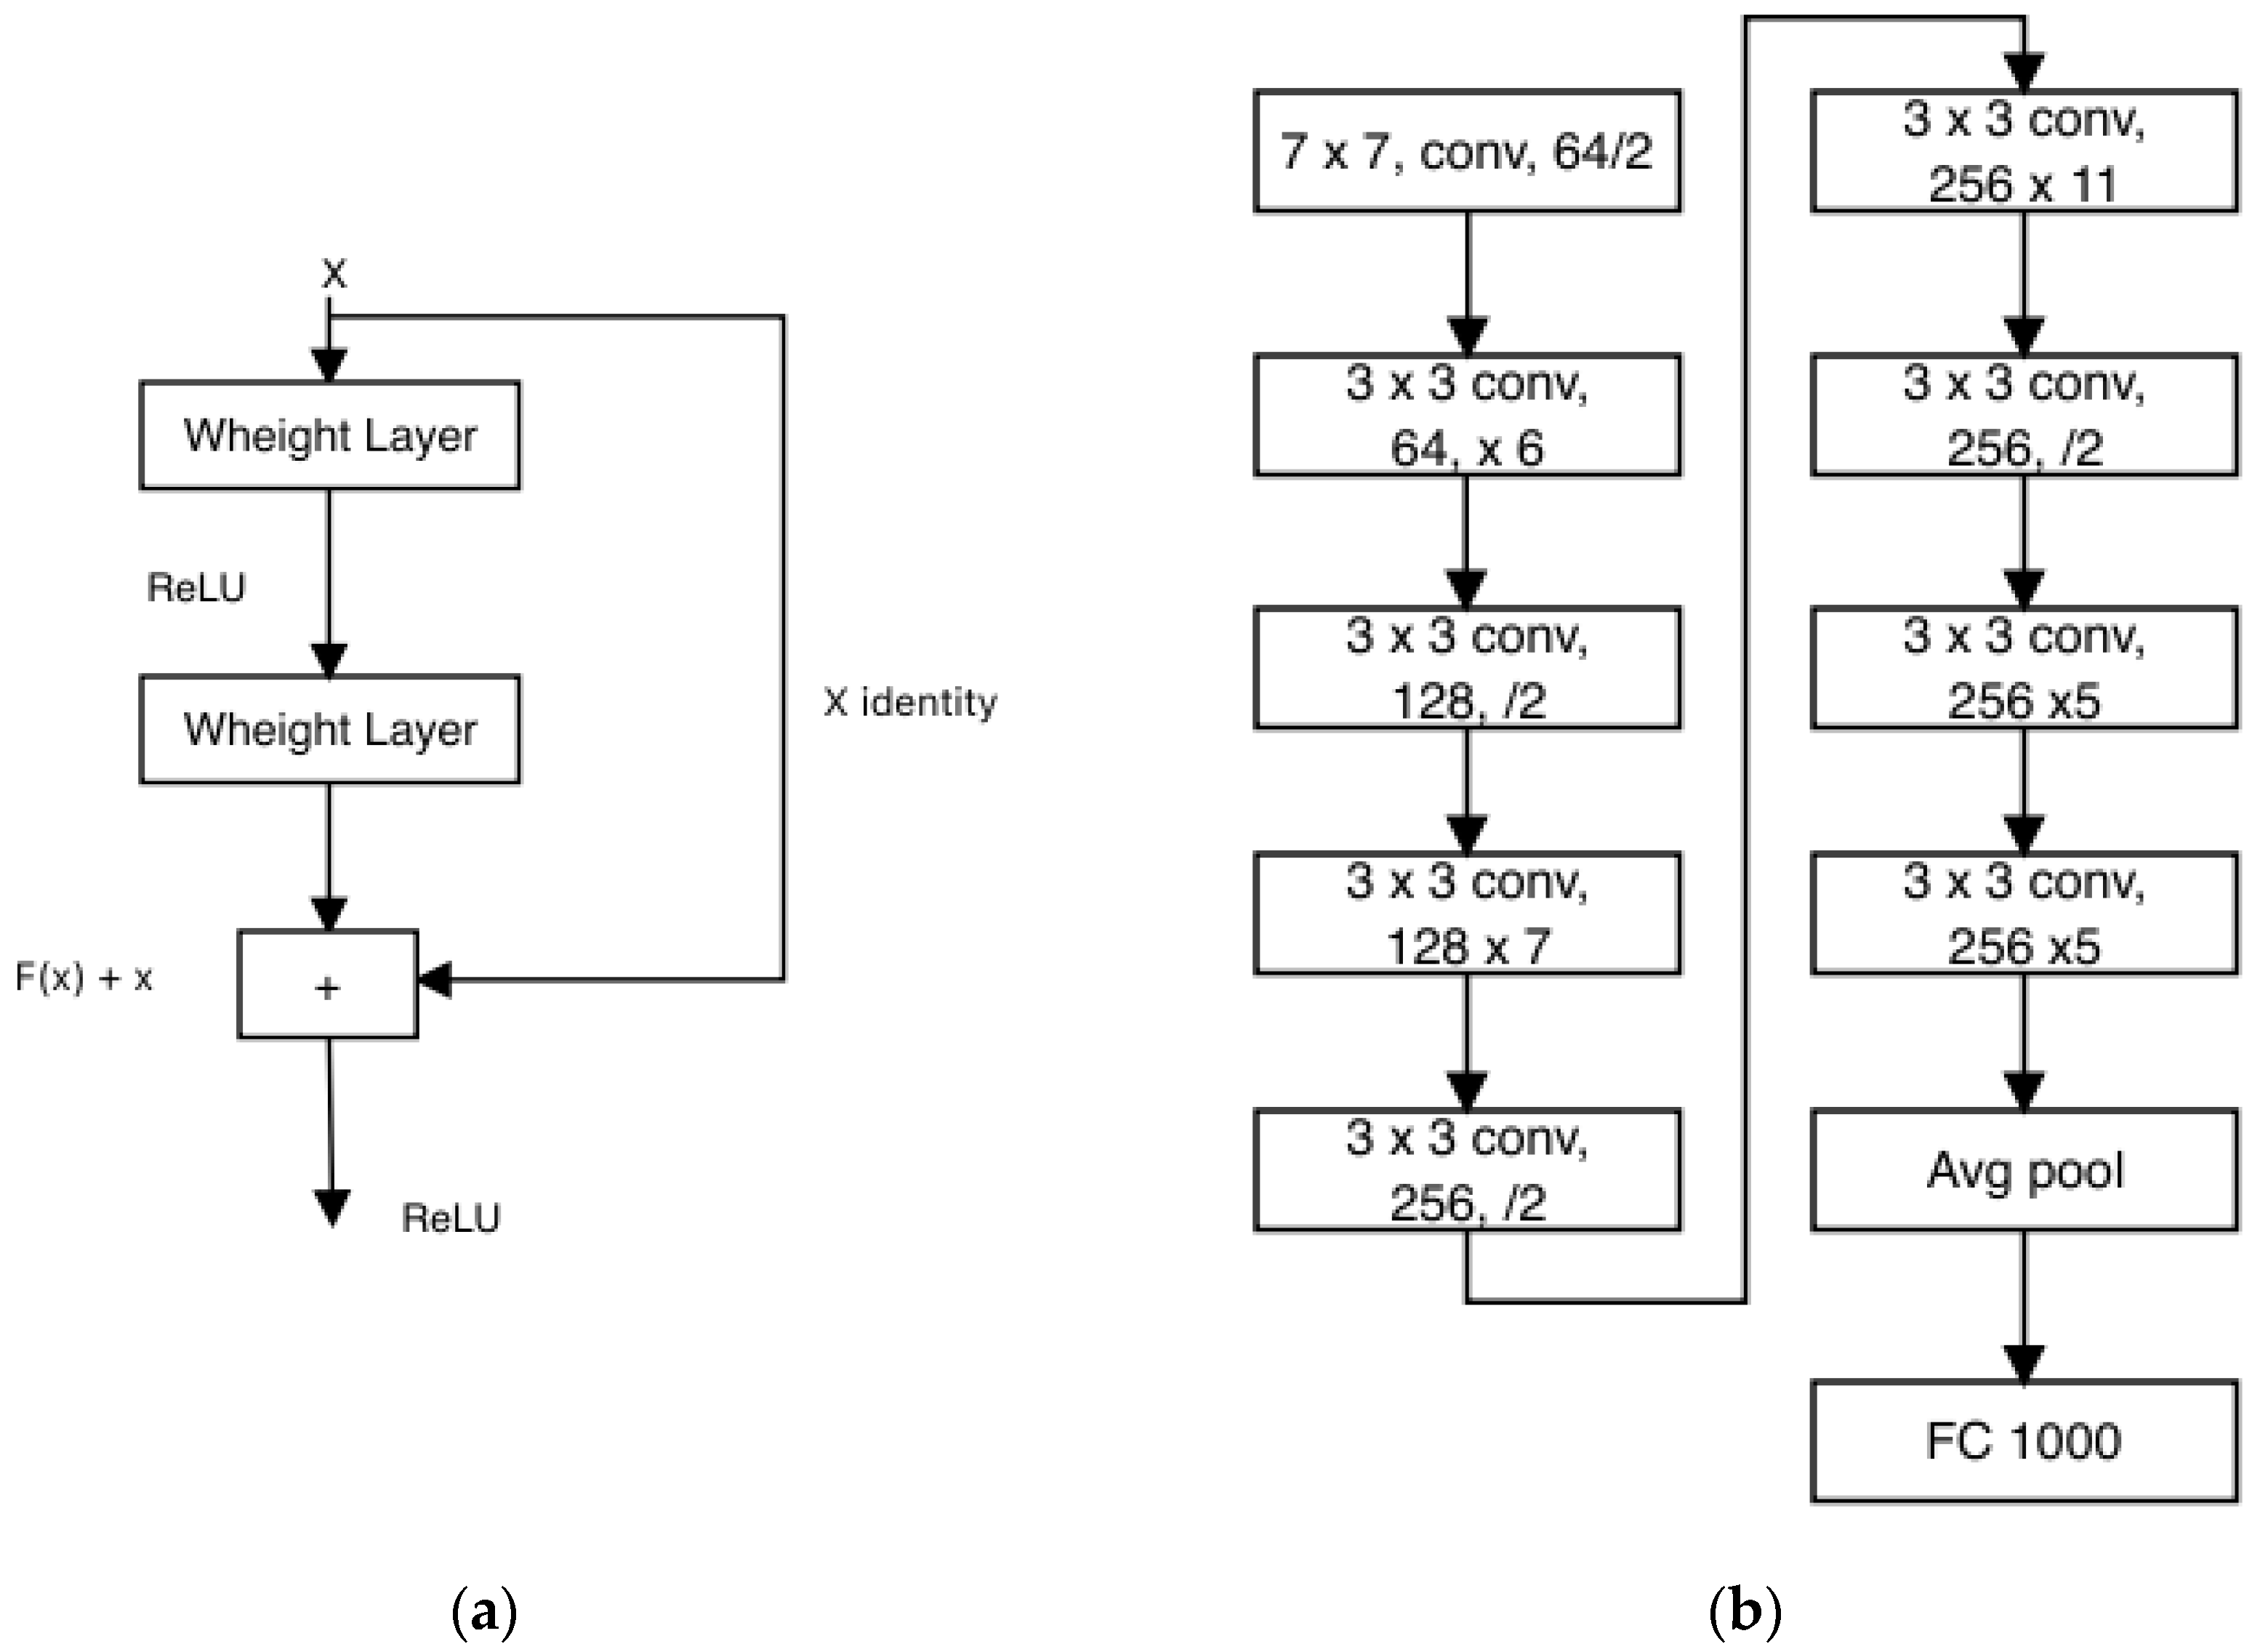
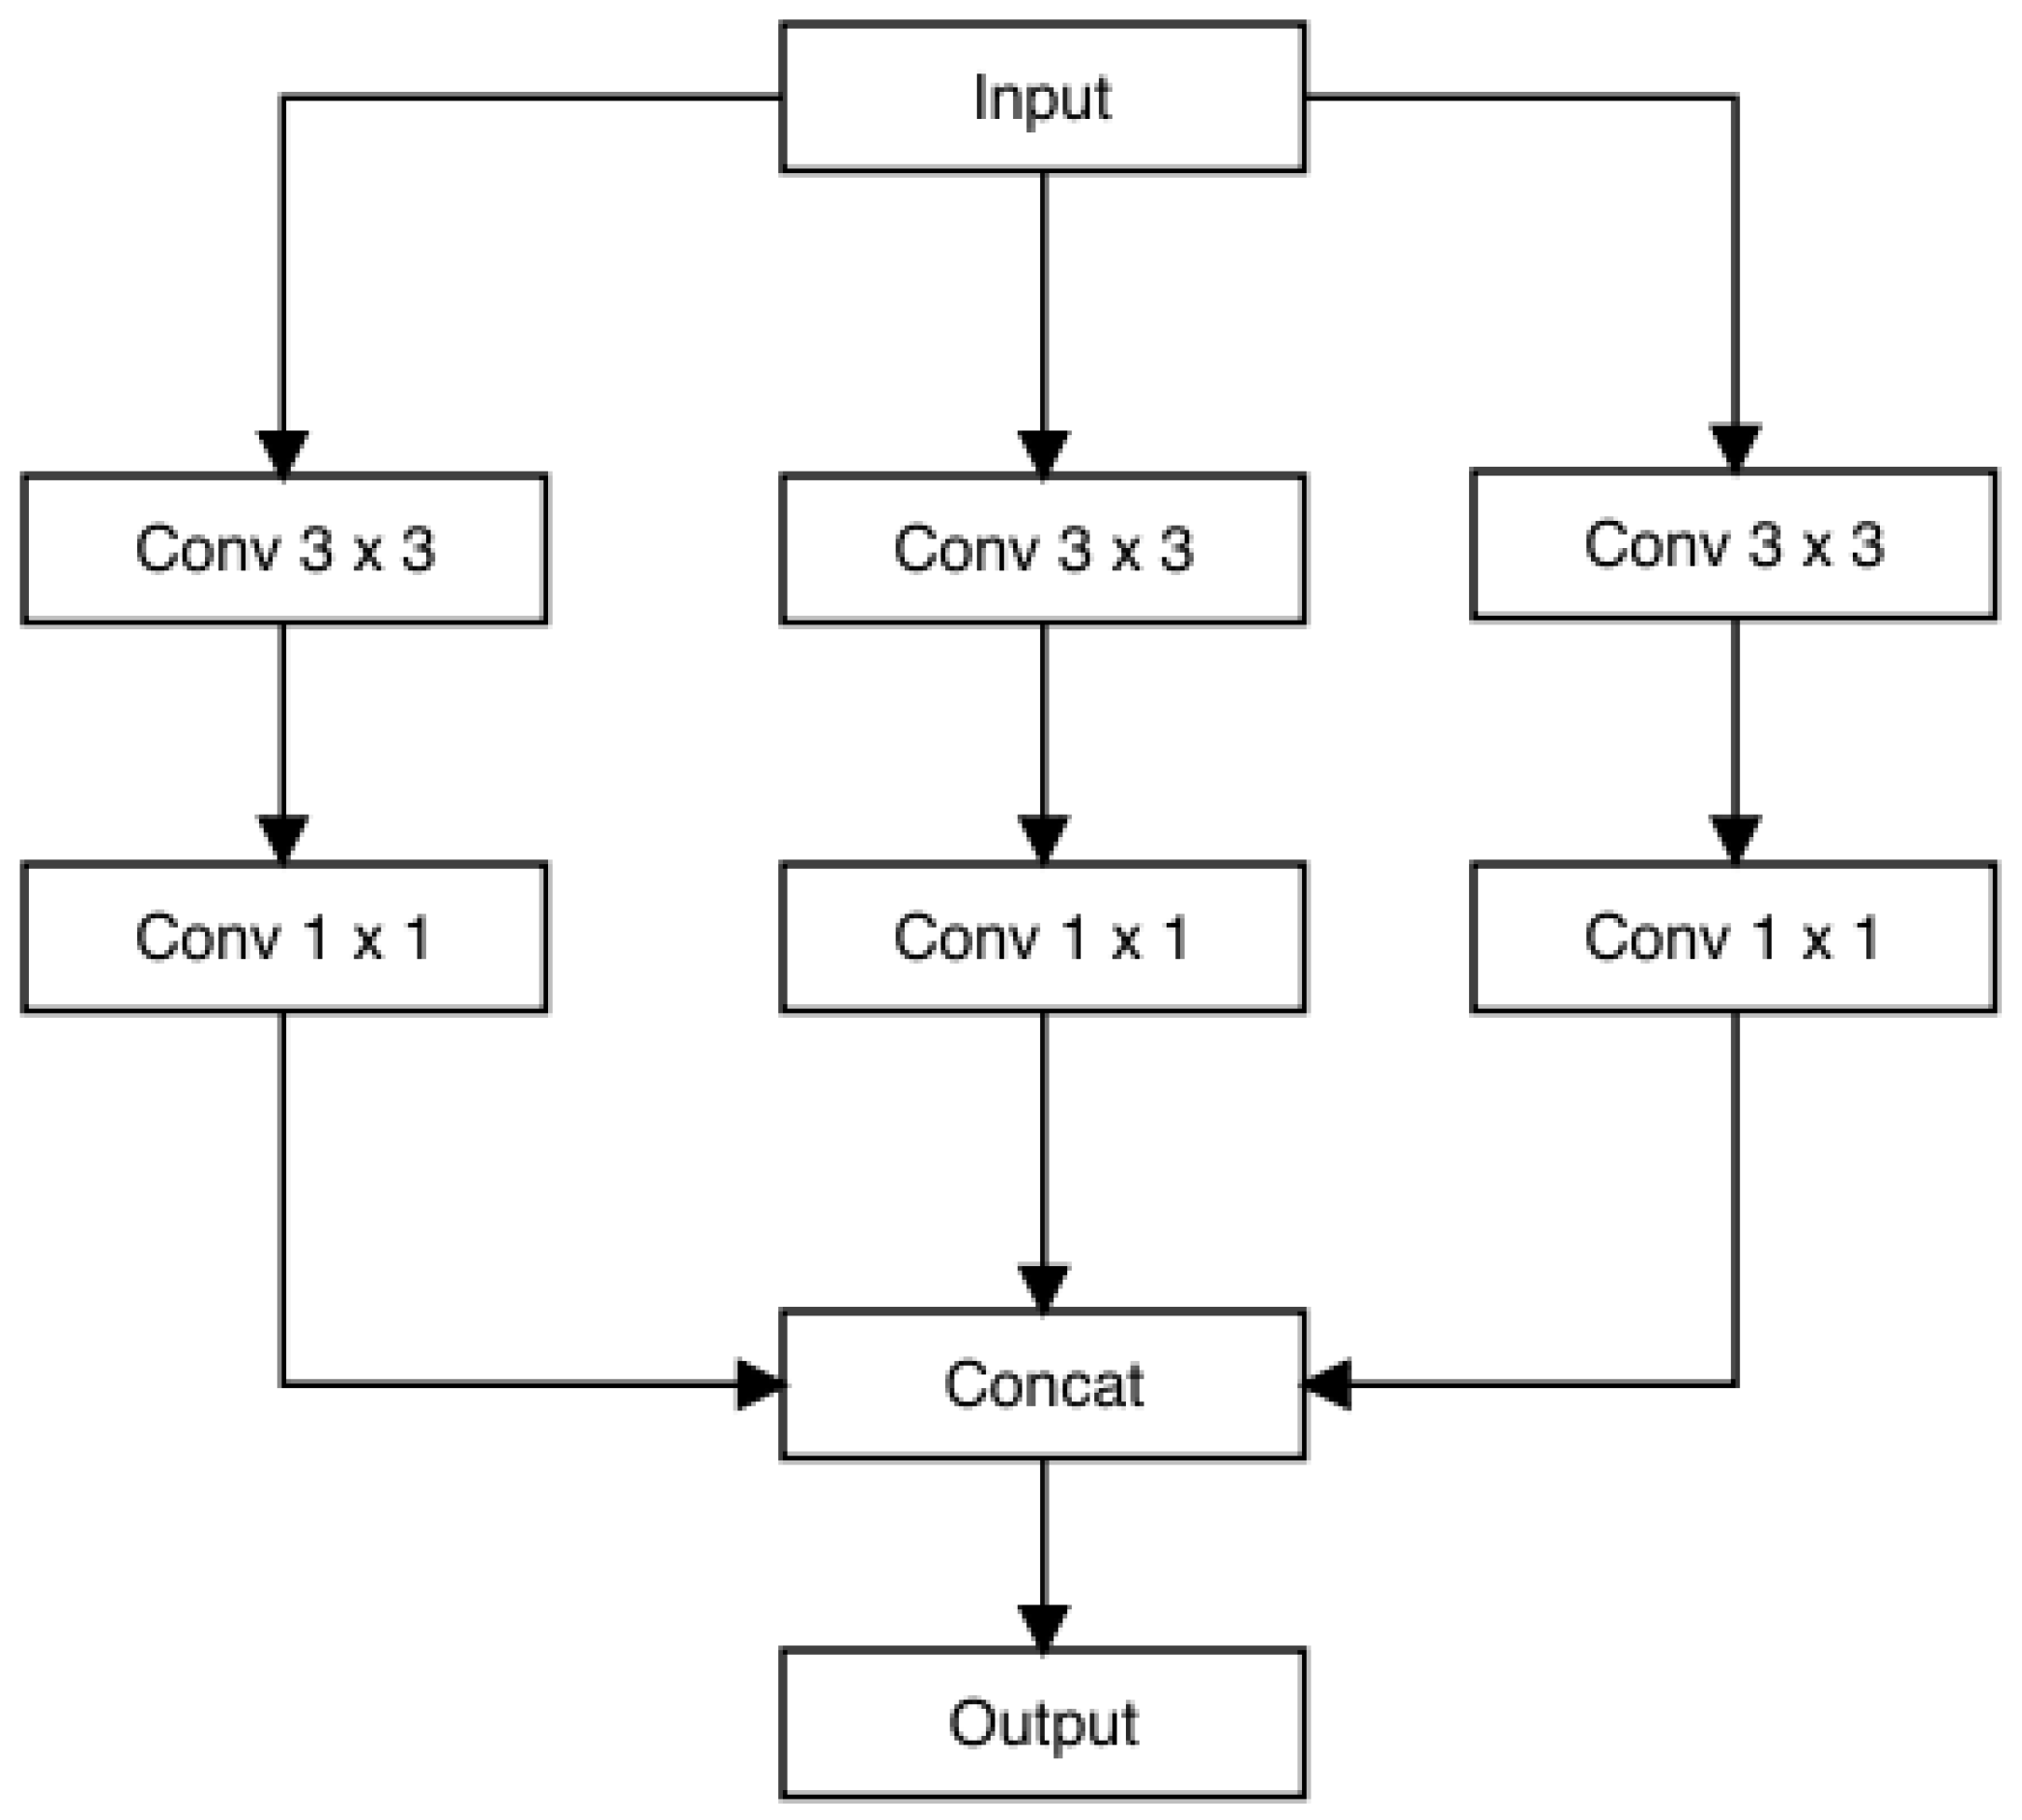


