Article

Study on the Characteristics of Pore Change in Tuff under the Frost and Salt Action Using High-Precision CT Scanning Equipment

1
Key Laboratory of Rock Mechanics and Geohazards of Zhejiang Province, Shaoxing University, Shaoxing 312000, China
2
State Key Laboratory of Frozen Soils Engineering, Northwest Institute of Eco-Environment and Resources, Chinese Academy of Sciences, Lanzhou 730000, China
3
School of Civil Engineering, Institute of Cold-Regions Science and Engineering, Northeast Forestry University, Harbin 150040, China
*
Author to whom correspondence should be addressed.
Appl. Sci. 2023, 13(18), 10483; https://doi.org/10.3390/app131810483
Submission received: 5 August 2023 / Revised: 10 September 2023 / Accepted: 12 September 2023 / Published: 20 September 2023
(This article belongs to the Topic Geotechnics for Hazard Mitigation)

Abstract

:
Using high-precision CT scanning equipment, two series of tests on frost and salt weathering were conducted to investigate the characteristics of pore change in tuff. Experiments on frost and salt aging were performed with pieces of tuff from the same area of southeast China. One set of tuff samples was soaked in saturated sodium sulfate or magnesium sulfate solutions for 60 days. Another set of tuff samples were subjected to 60 freeze–thaw cycles after being submerged in saturated sodium sulfate or magnesium sulfate solutions for 48 h. Our study demonstrates that processes such as salt erosion and freeze–thaw affect the pore evolution of tuffs significantly. Tuff lost 1.56% of its mass after being submerged in magnesium sulfate solutions for 60 days, while tuff submerged in sodium sulfate solutions gained a negative 0.33% of its mass. After 60 freeze–thaw cycles, the mass loss of tuff samples immersed in sodium sulfate, magnesium sulfate, and distilled water solutions was 3.52%, 3.58%, and 3.82%, respectively. The average porosity of the magnesium sulfate and sodium sulfate test groups increased by 6.59% and 4.14%, respectively, when the number of days of salt erosion was extended from 10 to 60 days. The average porosity of tuff samples immersed in magnesium persulfate and sodium sulfate solutions increased by 2.25% and 2.18%, respectively, as the number of freeze–thaw cycles went from 10 to 60.

1. Introduction

The frequency and intensity of extreme weather events (typhoons, heavy rainfall, etc.) are increasing in southeast China against the backdrop of global warming. This has accelerated the weathering process of stone and caused a large amount of deterioration on the surface of many ancient stone bridges (Figure 1). The deterioration of historical stone bridges in coastal regions can be attributed to two primary factors: salt weathering and frost weathering [1,2]. On the one hand, the salt that is present in the ocean gradually seeps into the rock throughout the typhoon and rainy season through the micro-cracks. The process of salt weathering results in the generation of crystallization pressure by the salt, leading to the deterioration of the stone [3,4]. On the other hand, when liquid water freezes into ice in the cracks inside rocks in winter, a 9% volume expansion induced by the phase transition of water to ice can put enough pressure on the rock to worsen the fracture and eventually destroy the boulder [5,6,7,8].
During the past 30 years, year-round field observations or monitoring of rock deformation have revealed that air temperature, moisture content, and salt weathering are significant environmental factors that cause stone degradation in the natural environment [8,9,10,11,12]. The researchers carried out a number of indoor simulation tests in order to undertake a quantitative analysis of the effects of freeze–thaw cycles and salinity on the processes of rock weathering [13]. Typically, frost or salt weathering of a particular stone or rock is evaluated quantitatively by measuring the changes in sample weight, compressive strength, porosity, and other physical parameters under different experimental conditions [14,15,16,17,18]. For example, Ref. [19] performed static and impact mechanical tests on both weathered and un-weathered red sandstones. Furthermore, they developed a mechanical property decay model that incorporated the strain rate effect to better predict the dynamic mechanical degradation of sedimentary rocks following long-term frost weathering. Based on the idea that water freezing and moving through micro-pores induces micro-pore rupture, Ref. [20] developed a micromechanical model of micro-pores, provided an analytical approach to forecast the degradation degree of micro-pores, and established a finite element model for fracture analysis. Twenty dry–wet cycles at temperatures above 0 °C in a laboratory showed that samples of deionized water and sodium chloride remained intact, but those of sodium sulfate crumbled [21]. Even though these studies have advanced our understanding of rock weathering, there have been few quantitative investigations on the evolution of interior pores during coupled frost and slat weathering actions [22].
Porosity is one of the key indicators used to evaluate the extent of rock weathering [23]. Mercury injection test results suggested that micro-pores smaller than 0.05~0.1 μm in radius play a significant role in salt weathering of eight Japanese building stone varieties [24]. However, rocks can have pores of a wide variety of sizes and shapes, which leads to a wide range of possible variations, which in turn results in pores that are exceedingly complicated and irregular in structure. As a result, it is challenging to perform quantitative research on rocks in order to investigate their internal pore structure [25]. Due to their non-destructive nature and ability to reconstruct the 3D spatial structure of objects, X-ray computed micro-tomography or micro-CT have been widely used for observing and quantifying the change in the internal structure of materials under different conditions in recent years [26]. For instance, based on the results of CT detection, Ref. [27] found that the strength and density of rock samples decreased after freezing compared to before freezing. Using interior CT scanning technology to scan and model rock samples before and after freeze–thaw, Ref. [15] investigated the mechanism of damage influence of freezing speed and temperature on the internal structure of rock and the evolution of internal structure damage. Although these studies have laid the framework for the analysis of the internal pore evolution of rocks, there have been few 3D spatial structure evolution analyses of internal pores under coupled frost and salt action.
In this research, a series of freeze–thaw cycles and salt erosion tests were performed on tuff samples. Then, we used industrial CT with high precision to scan and reconstruct the three-dimensional spatial structure of tuff samples under various test conditions. Furthermore, a quantitative analysis was conducted on the evolution of the internal pore structure of tuff under various experimental conditions. The aim of this analysis was to establish a theoretical foundation for the restoration of deteriorating ailments observed in ancient stone tuff bridges.

2. Methods and Materials

The test rock came from Jinhua City, Zhejiang Province. It was mostly made of tuff. All rocks are carved into 100 mm in height and 50 mm in diameter cylindrical specimens. Two distinct series of tests were conducted to examine the pore changes and evolution that emerges from the salt and frost weathering processes in tuff samples. The first batch of tuff samples were immersed in saturated sodium or magnesium sulfate solutions for 60 days to simulate salt weathering. The experimental tuff samples were treated as follows: tuff samples were soaked in one of two saturated salt solutions or distilled water at 25 °C and oven-dried at 120 °C for 24 h. The second group of tuff samples were immersed for two days in saturated solutions of sodium sulfate, magnesium sulfate, and distilled water. Then, each sample was placed in a cabinet set to −20 °C. After 12 h, the samples were taken out of the cabinet and left to defrost for an additional 12 h at room temperature (25 °C). The freeze–thaw cycle was repeated until sixty cycles had been completed. All of the samples in the first and second group were weighted and X-rayed every 10 days or freeze-thaw cycles. (Figure 2).
A high-precision (5 μm) micro-CT scanning system (GE manufactures) including an X-ray detector, carrier rotating stage, two ray emitters, and a data processing system was used to scan tuff samples (Figure 3). Each sample group was divided into 1200 cross-sections for a 45-minute scan to assure 3D reconstruction accuracy. VG Studio Max, one of the most advanced CT image post-processing software platforms, was used to precisely measure, analyze, and calculate 3D volume data sets from the 1200 images captured by the scanner [25]. For the analysis of the evolution of the 3D spatial structure, we only selected the middle portion of the specimen (20 mm in diameter, 60 mm in height) to reduce the influence of the specimen boundary on the results (Figure 3). Since the CT scanner has a spatial resolution of 0.03 mm × 0.03 mm and a scanning layer thickness of 0.08 mm, each pixel cell in the image represents the porosity of 0.03 × 0.03 × 0.08 mm3 cube cells. All of the scanned images were analyzed with the use of the software VG Studio Max, which performed operations such as binaryzation, segmentation, and normalization [25]. Pores were represented in the scanned images by gray values that were more than eight, while particle skeletons were represented by the other values. To quantitatively investigate the change and evolution in the pores, it was necessary to define the porosity of the samples. The calculation of porosity involved the division of the volume of identified pores by the overall volume of the selected region within the three-dimensional model of the specimen. The determination of the porosity of a sample’s cross-section involves calculating the ratio of the total area occupied by recognized pores to the entire area of the specimen section. In our paper, we only focused on the microscopic scale of the internal pores of pumice [28]. In total, four experimental runs were conducted with diverse salt and freeze–thaw cycles to examine the pore change in tuff during frost and salt weathering processes (Table 1).

3. Results and Discussion

Among the two forms of salt weathering, MgSO4 caused the greatest amount of damage and mass loss to tuff samples. Figure 4 demonstrates that as the time of erosion increased, the mass of tuff samples soaked in distilled water and sodium sulfate changed only slightly, whereas the mass loss of tuff samples soaked in magnesium sulfate reached ~10 g. The rate of mass loss was 1.56%. The results suggest that the presence of magnesium sulfate has a notable impact on both the expansion and dissolution of the tuff sample. The primary factor contributing to this phenomenon can be attributed to the process of salt crystallization [29]. The mass of the samples in each group of tests decreased as the freeze–thaw cycles increased in the second series of tuff samples. It revealed that the freeze–thaw cycle caused significant damage to the tuff. After 60 freeze–thaw cycles, the mass loss of tuff in the distilled water, sodium sulfate, and magnesium sulfate groups were 18.5 g, 17.2 g, and 17.3 g, respectively. The mass loss rates of tuff in the solutions of distilled water, sodium sulfate, and magnesium sulfate were 3.82%, 3.52%, and 3.58%, respectively. The observed mass loss rates of specimens immersed in sodium sulfate and magnesium sulfate solutions were marginally lower compared to those immersed in distilled water. This discrepancy may be attributed to the presence of salt crystals adhering to the specimen’s surface, potentially obstructing certain micro-pores, and consequently reducing moisture infiltration into the rock specimen [30,31].
The evolution of the cross-sectional morphology of tuff as a result of salt weathering is depicted in Figure 5. After 10 days, the outer edge of the cross-section does not change significantly. When the number of days of erosion reached 40, the outer margin of the cross-section appeared fragmented due to the strong chemical reaction between the magnesium sulfate solution and the mineral element in tuff, which caused partial dissolution of the outer edge. After 60 days, the cross-section of tuff that had been soaked in sodium sulfate solution revealed severe damage along its upper edge, and a fracture appeared in the lower right region (Figure 5f). Almost the whole edge of the cross-section of tuff that had been soaked in magnesium sulfate solution was damaged after 60 days of erosion (Figure 5c).
To analyze the change and evolution in pore characteristics quantitatively, all layers of scanning images were used to reconstruct the 3D model of the central pore distribution of tuff specimen. In Figure 6, the spectrum of porosity from 0 to 0.3 is represented by the color bar, with red representing locations with high porosity and blue representing regions with low porosity. The pore distribution of the sample exhibits notable heterogeneity in Figure 6. The primary factor contributing to this phenomenon is the diverse composition of the tuff. With an increase in the number of days and freeze–thaw cycles, the areas of high porosity in the specimen increase in each group, indicating that frost and salt weathering have a significant impact on the development of internal pores in the tuff.
To quantify the cross-section pore characteristics, we calculated the porosity of each cross-section of the tuff during the salt and frost weathering process (Figure 7). With an increase in erosion days and freeze–thaw cycles, the porosity of the entire tuff cross-section progressively increased. When the number of erosion days increased from 10 to 60, the maximal porosity change in all cross-sections in the sodium sulfate and magnesium sulfate groups was 3.42% and 5.54%, respectively. As the number of freeze–thaw cycles increased from 10 to 60, the greatest value of porosity change in the sodium sulfate and magnesium sulfate groups was 3.77% and 3.35%, respectively. The average porosity of all the cross-sections in the magnesium sulfate and sodium sulfate test groups increased by 6.59% and 4.14%, respectively, when the number of days of salt erosion was extended from 10 days to 60 days. The average porosity of all the cross-sections in the magnesium sulfate and sodium sulfate test groups increased by 2.25% and 2.18%, respectively, as the number of freeze–thaw cycles increased from 10 to 60.
To examine and describe the variations in pore properties of the tuff, a statistical analysis was performed on the distribution of porosity obtained from the CT scanning images of three distinct cross-sections inside each sample. These cross-sections were selected for analysis because of their noticeable differences in porosity, as illustrated in Figure 8, Figure 9, Figure 10 and Figure 11. Porosity is categorized into three distinct ranges: high porosity area, medium porosity area, and low porosity area, which correspond to values of 0.18~0.3, 0.06~0.18, and less than 0.06, respectively. As shown in Figure 8, after 10 days of erosion, the cross-sections at all three locations are dominated by areas with low porosity. The central local area of the cross-section at Z = 24 mm changed from a low porosity zone to an elongated high porosity zone band as the erosion days increased from 10 to 20. At Z = 46 mm and Z = 74 mm, there are numerous high porosity regions in the area to the lower right of the cross-section and in the area directly above the cross-section, respectively. As the number of erosion days increased from 10 to 60, the distribution of low porosity areas decreased significantly on the 24 mm, 46 mm, and 74 mm cross-sections, while the distribution of high porosity area increased significantly. The porosity of the section increased from 5.22%, 8.49%, and 8.96% to 8.14%, 11.05%, and 10.11%, respectively (Figure 8a). It showed that the saturated sodium sulfate solution corroded the tuff, destroyed its internal pore structure, and increased its porosity.
Figure 9 shows that after 10 days of erosion, the cross-sections at Z = 29 mm and Z = 51 mm were predominantly medium porosity zone, while the cross-section at Z = 76 mm was mostly low porosity zone. The cross-sections of the three sites exhibited a tendency toward steady increases in high porosity area and decreases in low porosity area as the erosion days rose from 10 to 20. After 60 days of erosion, the majority of the cross-section’s medium porosity zones at Z = 29 mm and Z = 51 mm progressively merged and evolved into the high porosity zone, covering practically the whole section with only sporadic low porosity patches. From bottom to top, the cross-sectional porosity of the three places increased from 6.73%, 6.63%, and 2.49%, to 12.27%, 11.9%, and 8.09%, respectively. It showed that the saturated magnesium sulfate solution had a severe corrosive impact on tuff, gradually expanding the microscopic pores within the rock and increasing porosity.
As shown in Figure 10, after 10 freeze–thaw cycles, the majority of the Z = 10 mm and Z = 38 mm cross-sections consist of low and medium porosity regions, with only a few regions containing high porosity parts. In the Z = 62 mm cross-section, the lower right area had almost entirely high porosity areas, while the other regions are dominated by medium porosity areas. When the number of freeze–thaw cycles increases from 10 to 60, the upper left region of the cross-section at Z = 10 mm transforms from a low porosity region to an elongated band of high porosity. At Z = 38 mm, the middle and upper regions of the cross-section become labyrinthine high porosity regions. At Z = 62 mm, the central and lower regions of the cross-section are occupied with zones of high porosity. The porosity of the three cross-sections increased from 3.15%, 5.26%, and 11.4%, respectively, to 7.57%, 9.63%, and 15.24%, respectively. It demonstrates that the porosity of the tuff progressively increased as the number of freeze–thaw cycles increased. This is due to the volume enlargement caused by the phase transition of ice water during the freeze–thaw cycle, which expanded the pores within the rock. When the number of freeze–thaw cycles increased from 40 to 60, there was little change in the porosity distribution of the specimen’s cross-section, indicating that freeze–thaw erosion tended to be stable. Concurrently, a fraction of the saline solution infiltrated the sample by pore seepage [30,31], resulting in the deposition of salt crystals that have the potential to obstruct certain pores and fortify the pore space within the tuff during successive freeze–thaw cycles.
Figure 11 shows that after 10 freeze–thaw cycles, punctate high porosity plaques emerge on the lower left border of the cross-section at Z = 35 mm; the majority of the remaining regions are low and medium porosity regions. At Z = 51 mm, a large high porosity zone appeared in the left part of the cross-section, and a definite band-like high porosity region appeared in the middle region. The lower right of the cross-section at Z = 87 mm shows lumpy areas of high porosity, whereas the middle and upper sections have punctate areas of high porosity. The lower left part of the cross-section at Z = 35 mm evolved from a low porosity zone to a punctate high porosity region as the freeze–thaw cycle increases from 10 to 60. The high porosity zone on the left side of the cross-section at Z = 51 mm gradually expanded, and a punctate high porosity region appears below; the high pore zone on the lower right of the cross-section at Z = 87 mm marginally increased. It demonstrates that freeze–thaw cycles have an influence on the interior pores of tuff. The porosity of the three cross-sections increased from 5.26%, 8.05%, and 7.26% to 7.66%, 10.89%, and 9.24%, respectively.
Frost and salt weathering are two of the primary causes of pore expansion, weathering, and rock deterioration [32,33]. In nature, free Mg2+, SO42−, and other minerals in soil and running water slowly infiltrate the surface layer of the tuff through seepage and diffusion, where they react with the mineral components on the surface, creating gypsum and other compounds and causing volume expansion [30,31]. This process creates microscopic fissures on the surface of the tuff, which are visible macroscopically as the erosion interface forms irregular curves. Ions continue to penetrate the specimen’s microscopic pores over time, driving the expansion and distortion of the pores within the tuff. The volume expansion generated by the ice-water phase transition accelerates pore expansion within the tuff. This study examined the process of pore formation and evolution in tuff subjected to frost and salt weathering by a series of indoor tests. In our preliminary study, we employed CT scanning equipment to investigate the alterations in pore characteristics of tuff quantitatively. Our findings indicate that the porosity of the samples exhibits an increase in response to both freeze–thaw cycles and the duration of salt erosion, as shown by [24]. However, the degradation and failure mechanisms of tuff, resulting from the combined effects of frost and salt weathering, are highly intricate [34]. The present analysis did not account for the variations in temperature, water, and stress fields inside the tuff caused by freeze–thaw cycles and salt erosion due to the limitations of the experimental constraints. In further investigations, it is important to examine a quantifiable relationship between the physical characteristics, such as density, initial porosity, and microstructural changes in tuff under coupled frost and salt weathering [30,31].

4. Conclusions

In this research, high-precision CT scanning equipment was used to study the erosion process of saturated magnesium sulfate, sodium sulfate solution, and freeze–thaw cycles on tuff. We quantitatively examined the pore changes in tuff under frost and salt weathering.
(1)
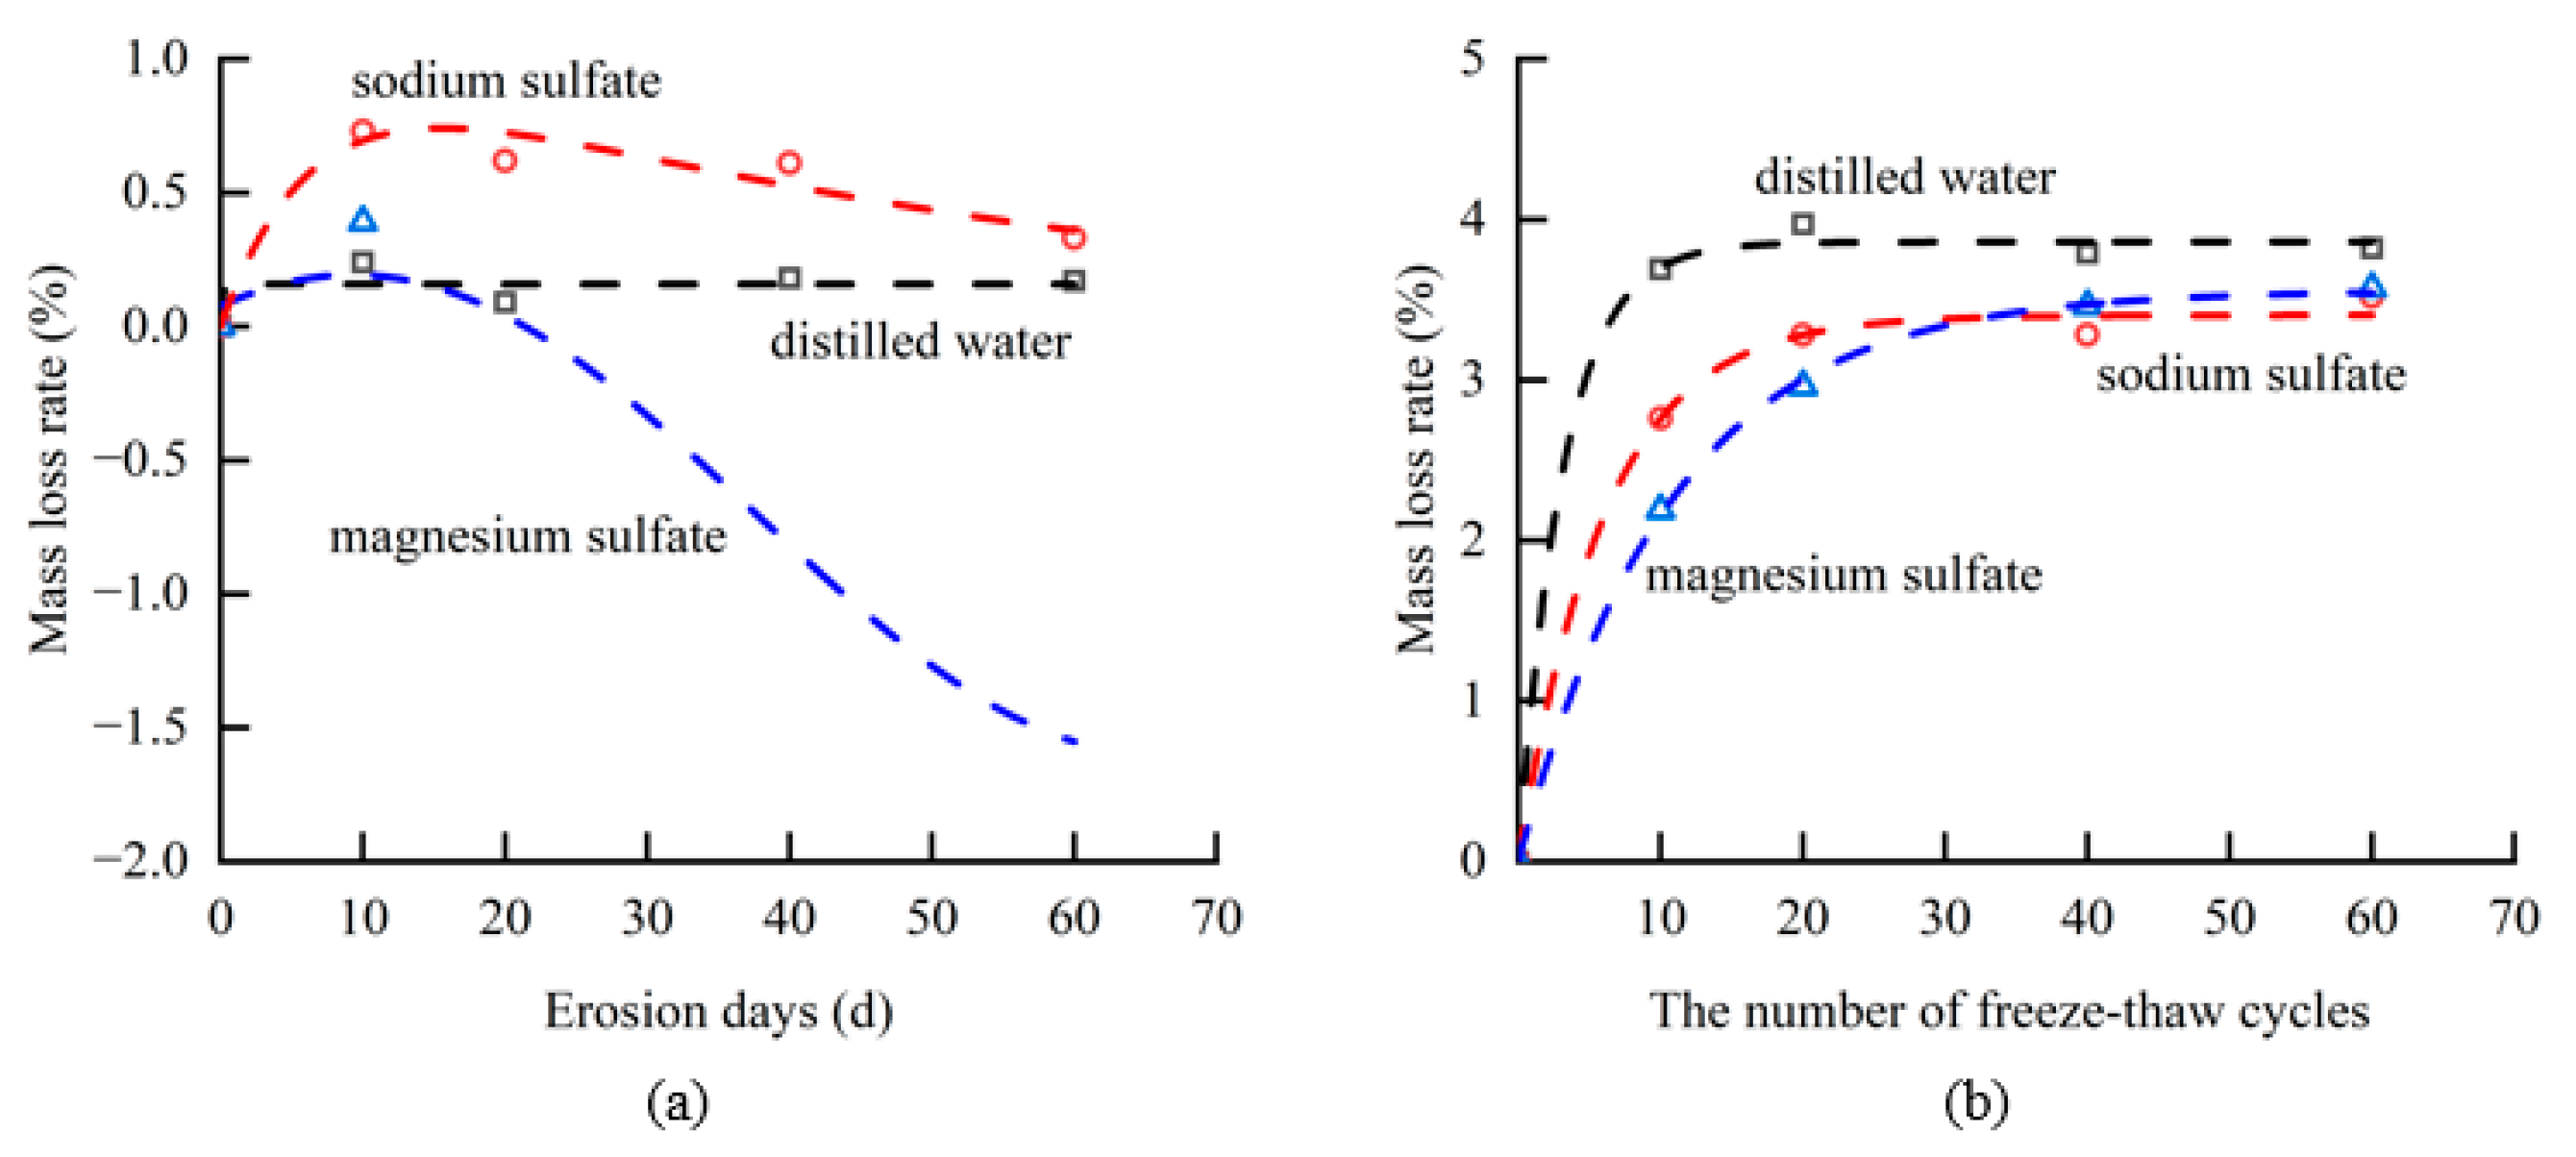
Saturated magnesium sulfate is more corrosive to tuff than sodium sulfate when erosion days reach 60; the quality loss rate of tuff immersed in a saturated magnesium sulfate solution is 1.56%. Sodium sulfate solution increases the mass of tuff by 0.33%.
(2)
Freeze–thaw cycles have a significant influence on tuff’s weathering. After 60 freeze thaw cycles, the mass loss rates of tuff in solutions of distilled water, sodium sulfate, and magnesium sulfate were 3.82%, 3.52%, and 3.58%, respectively.
(3)
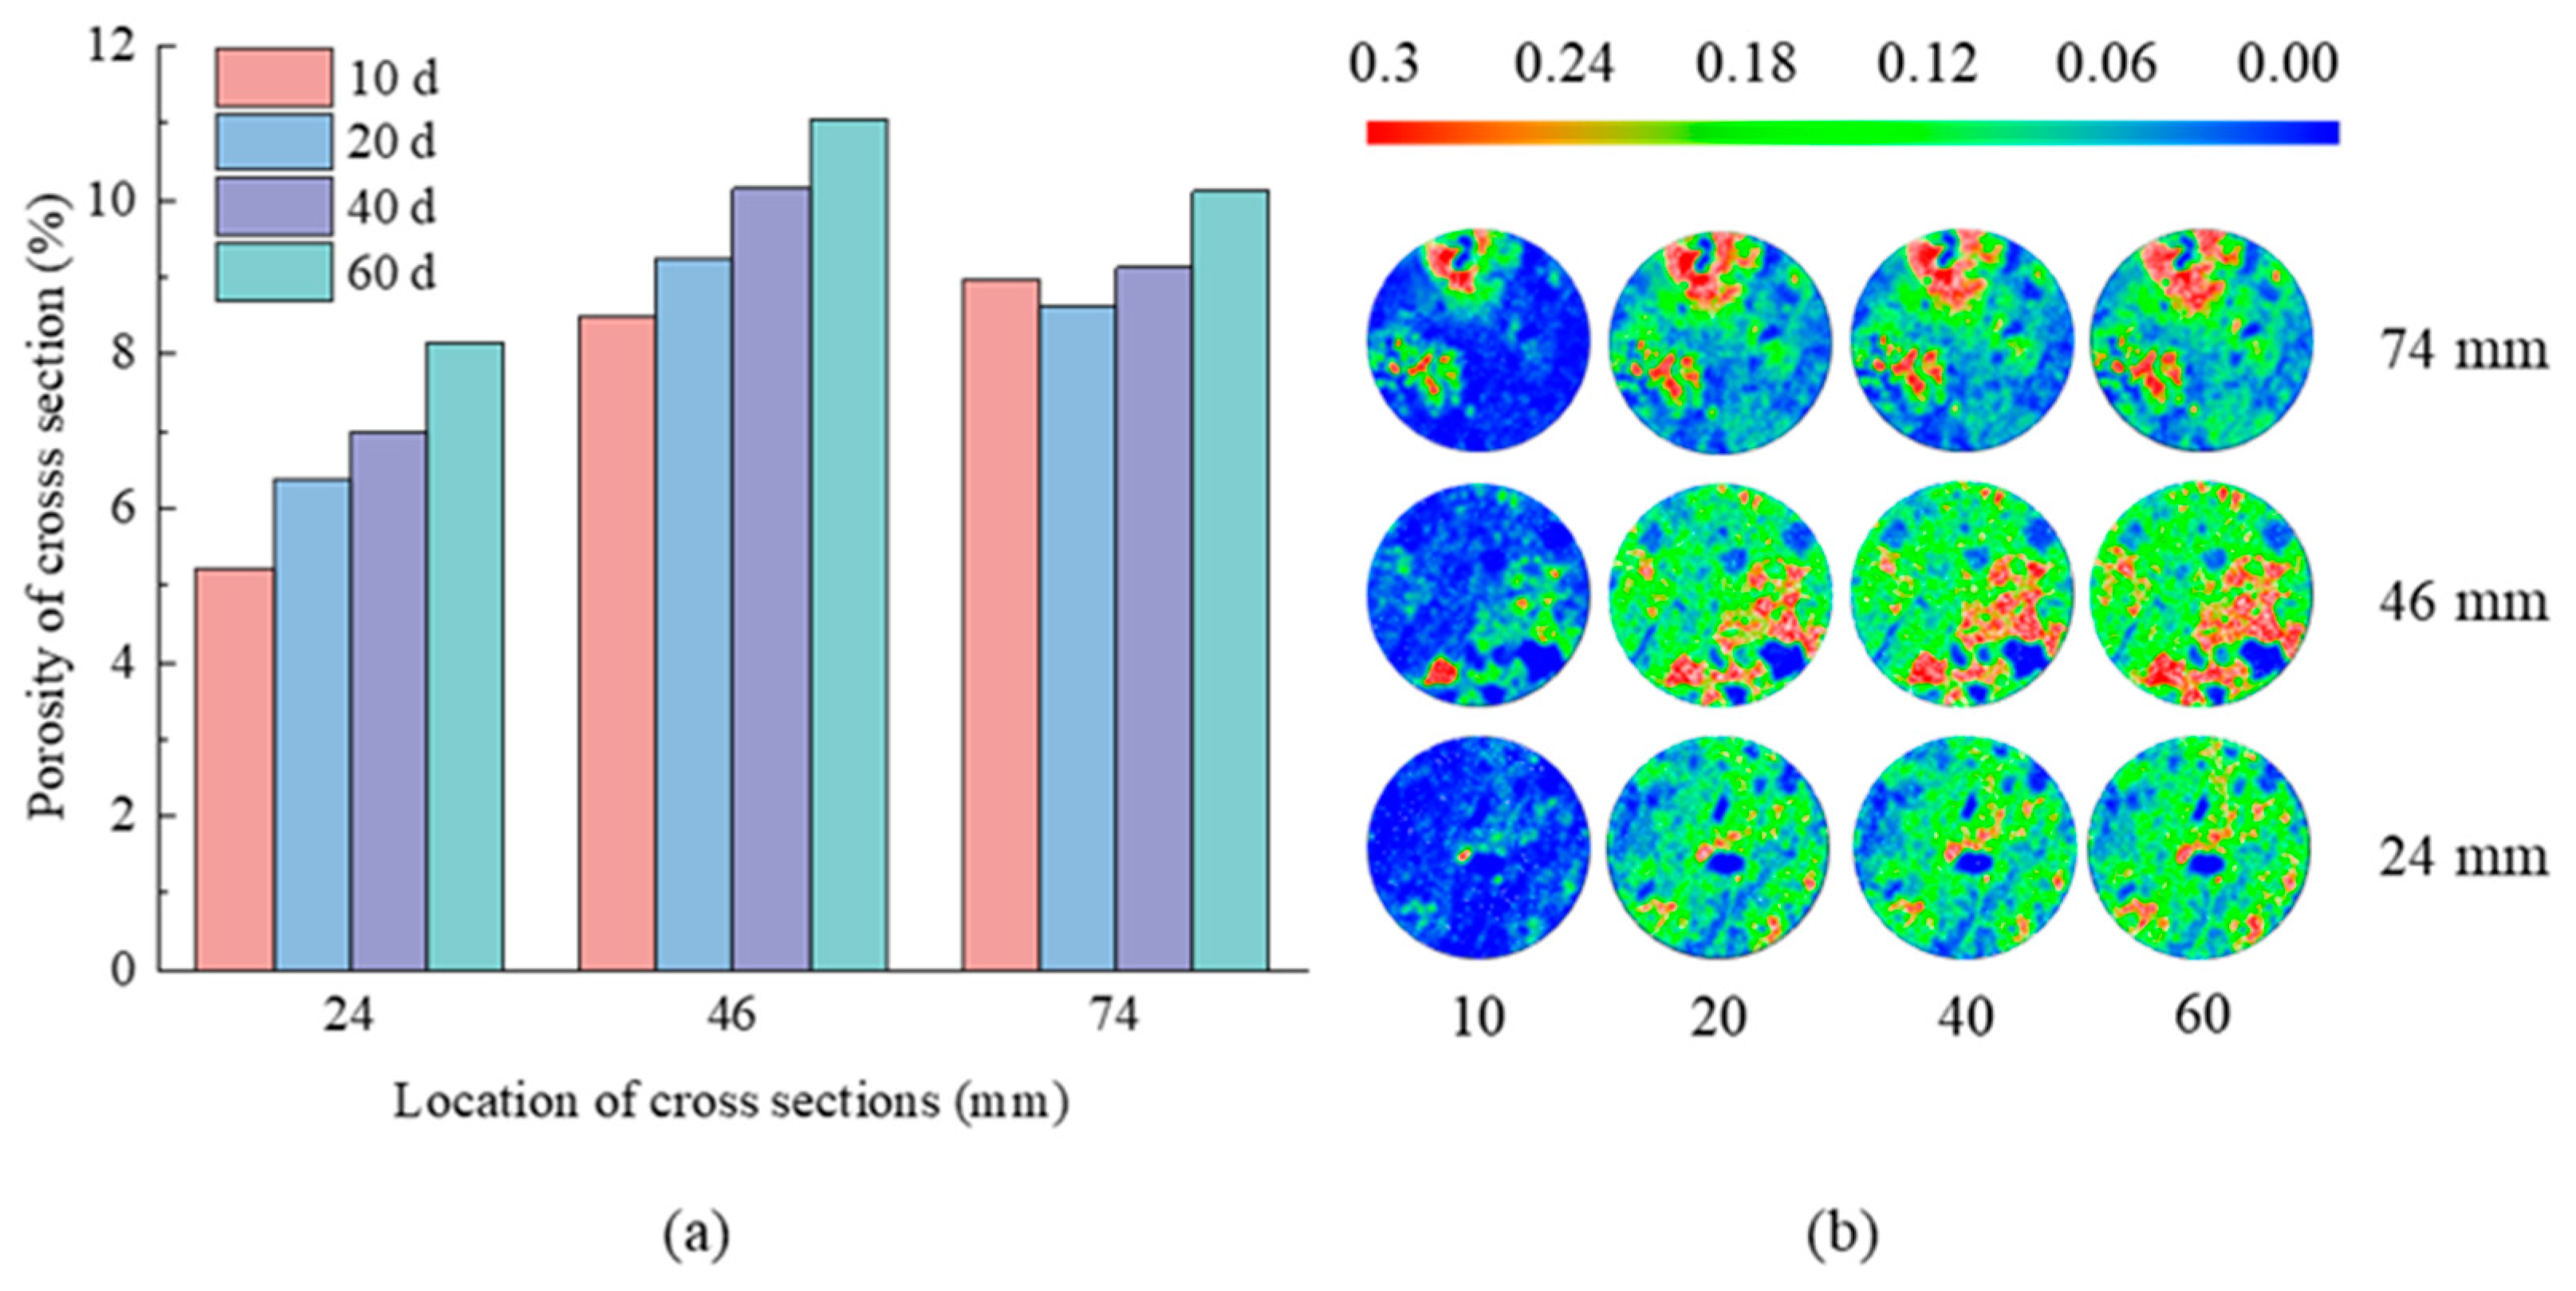
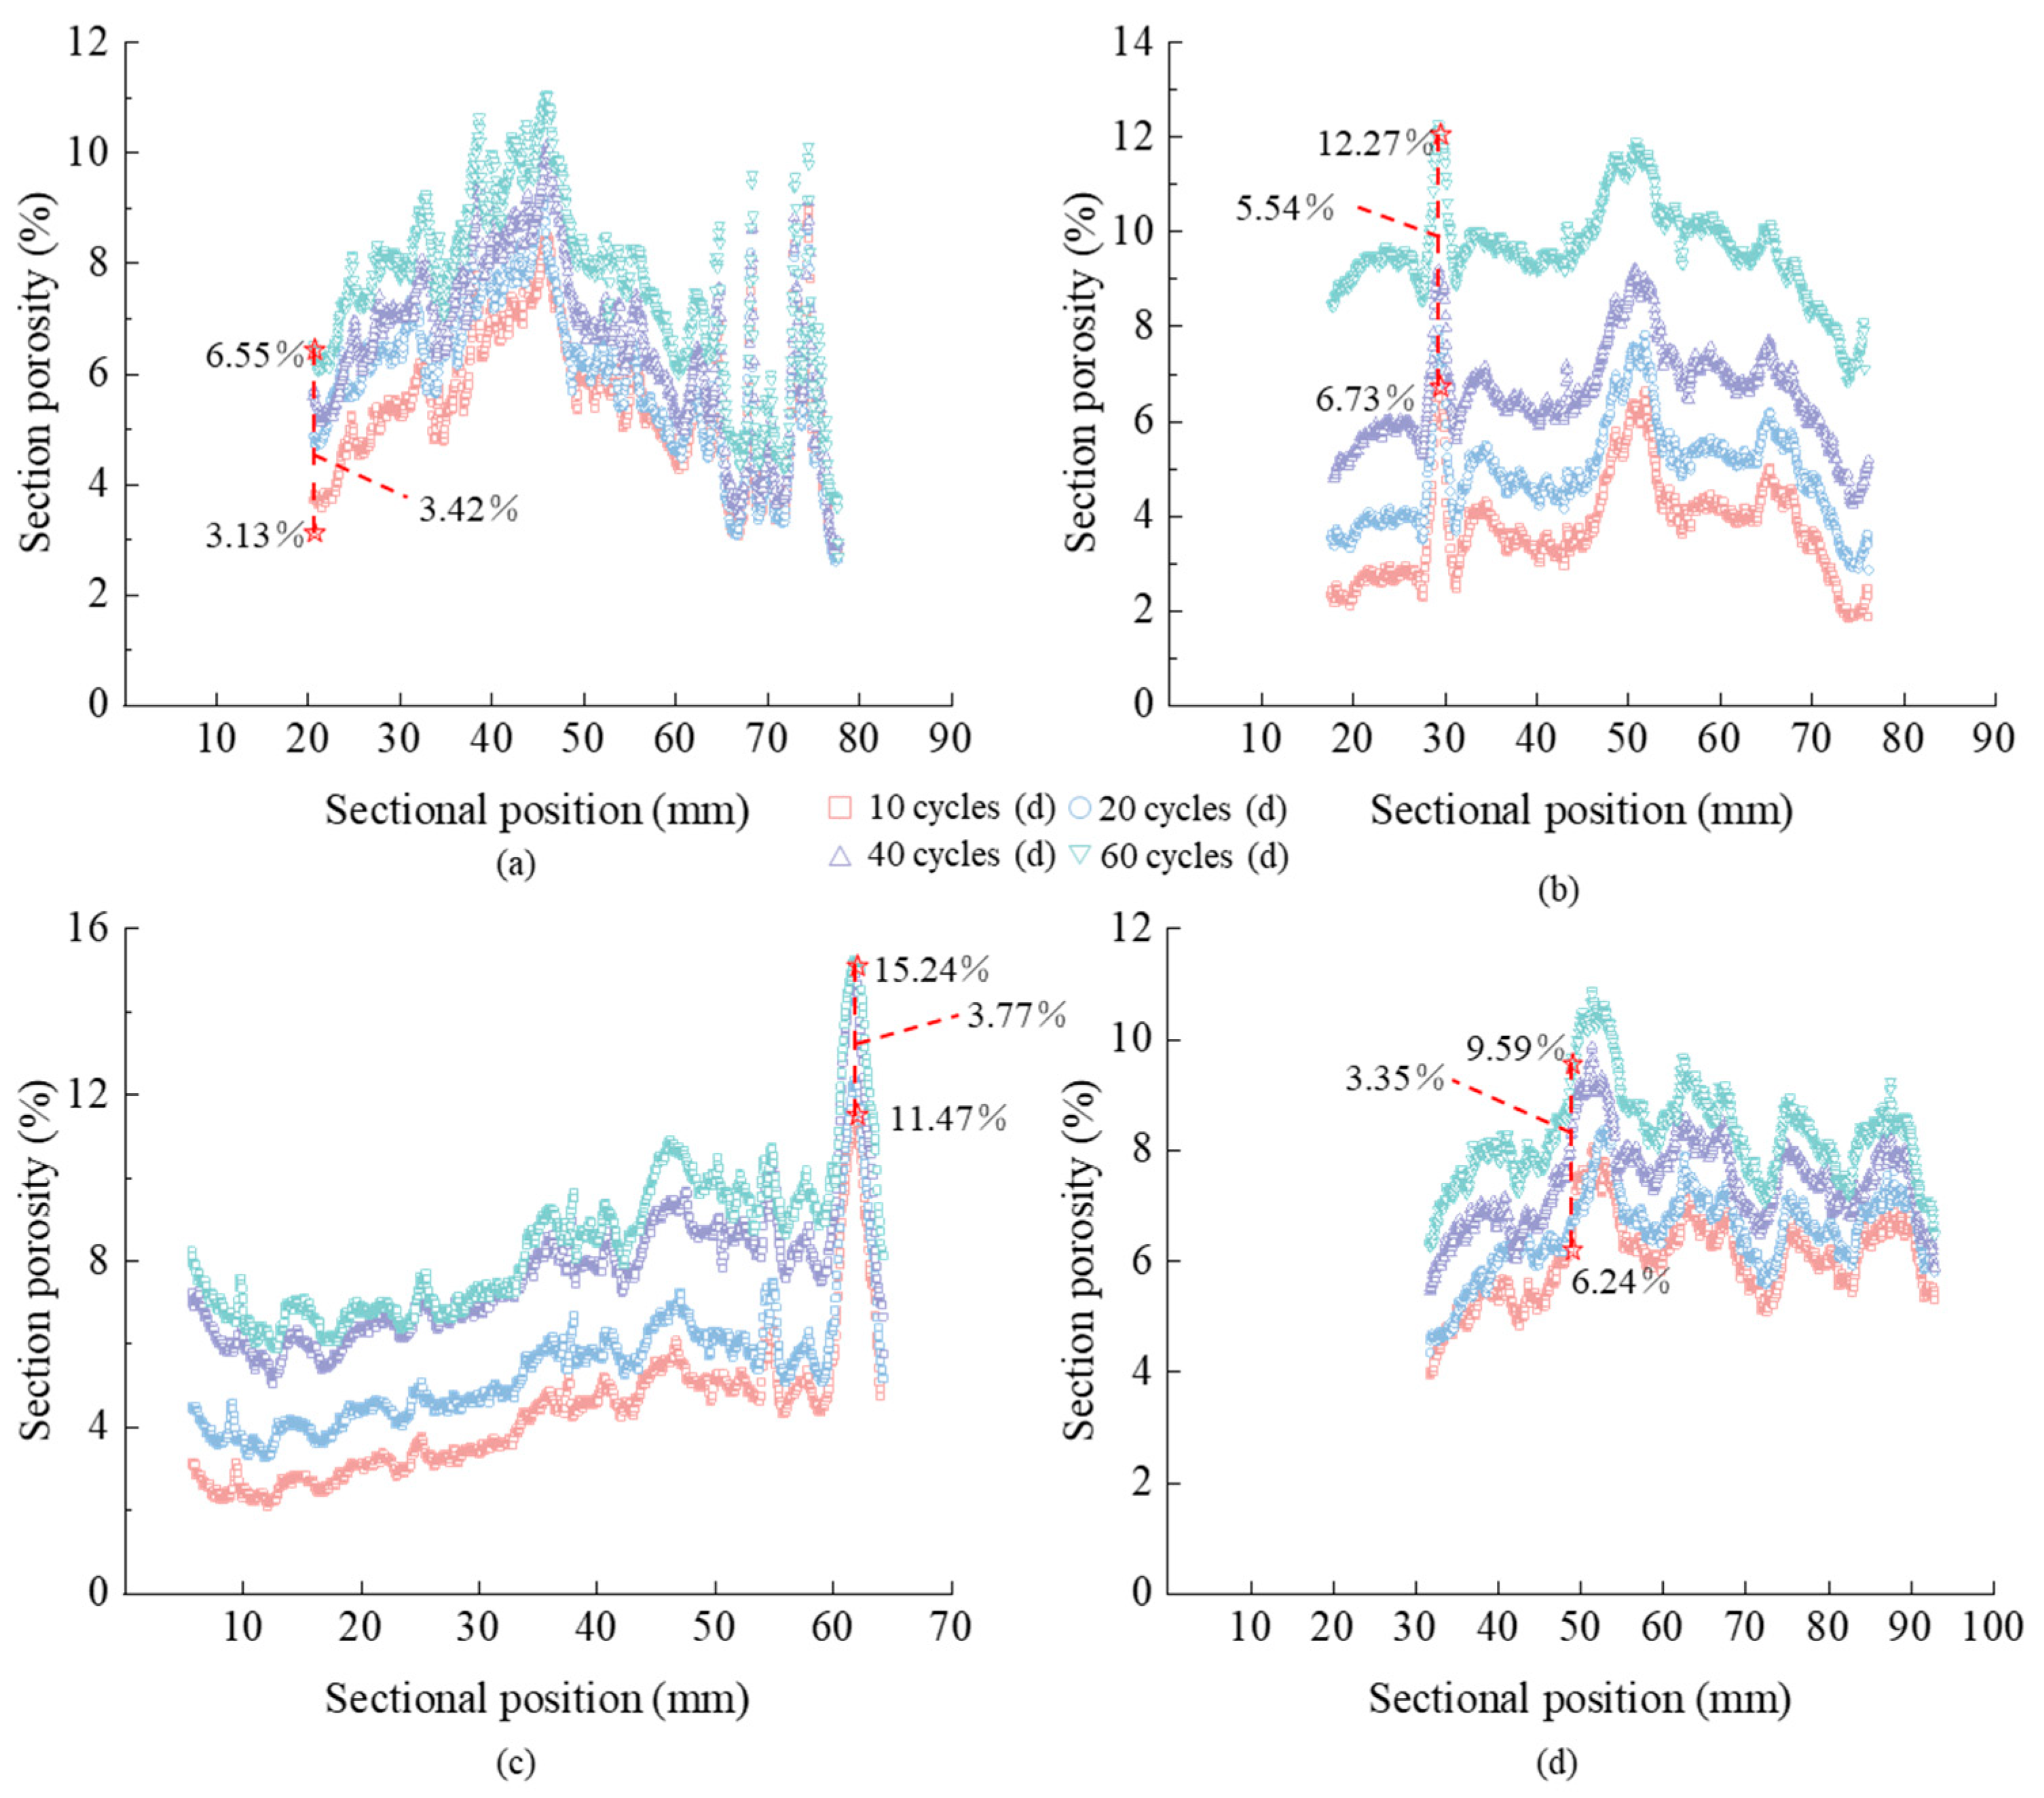
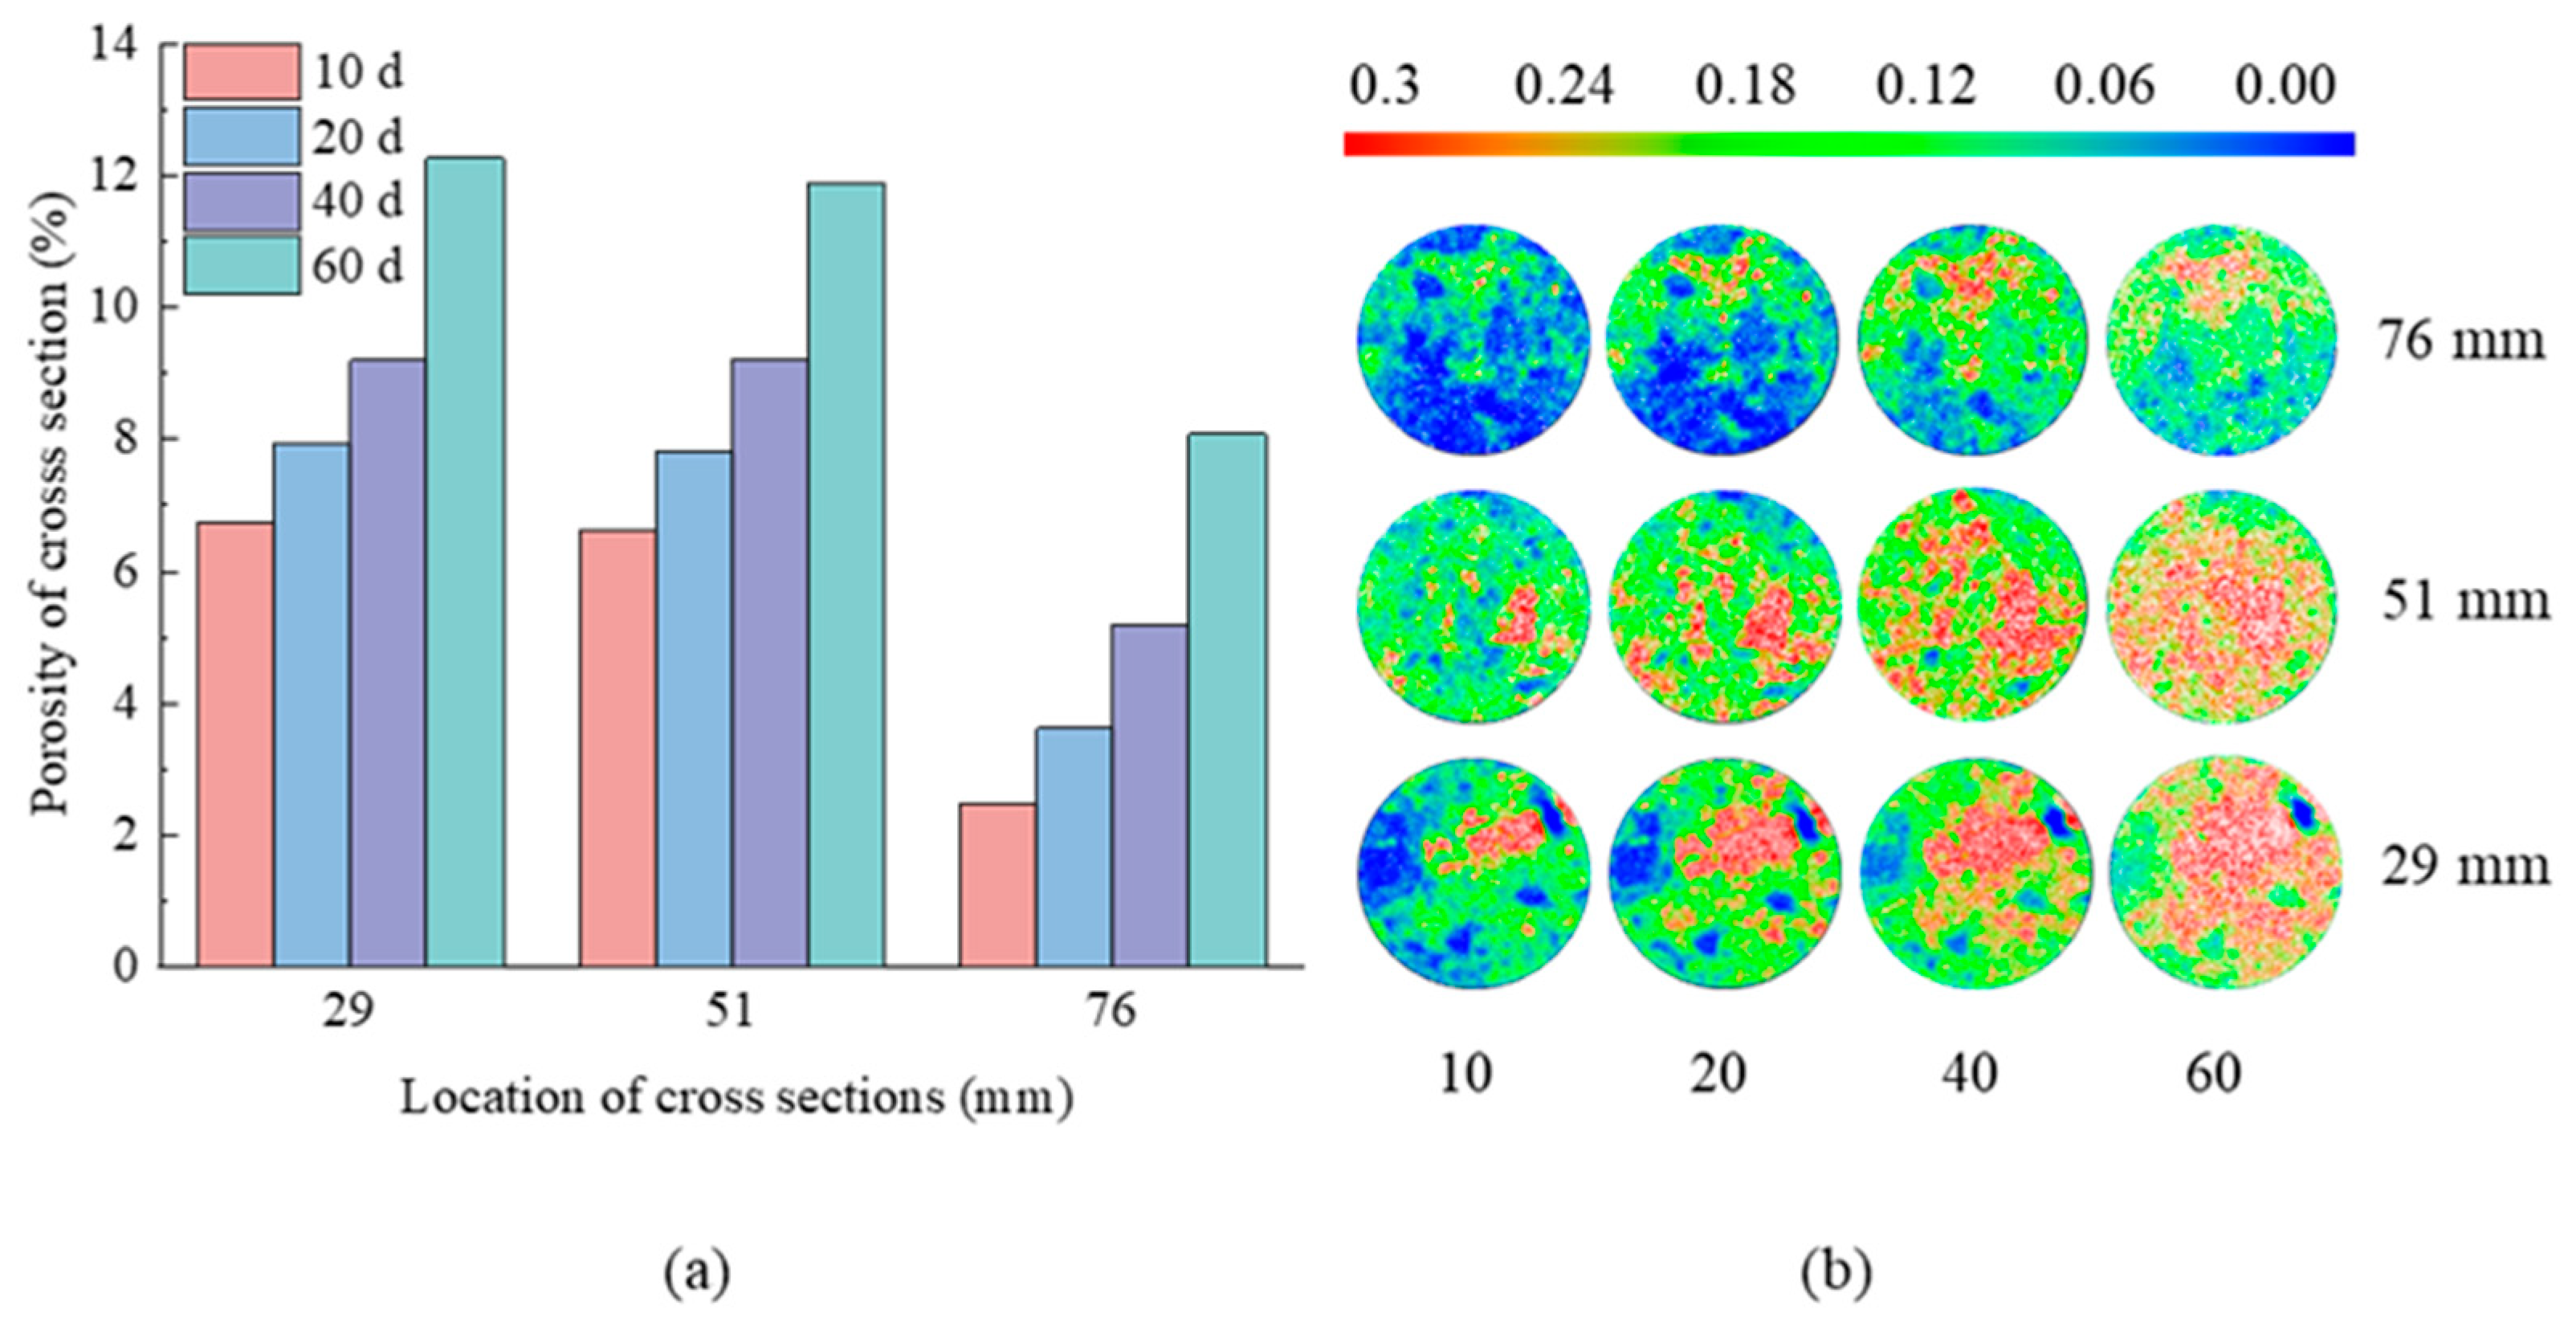
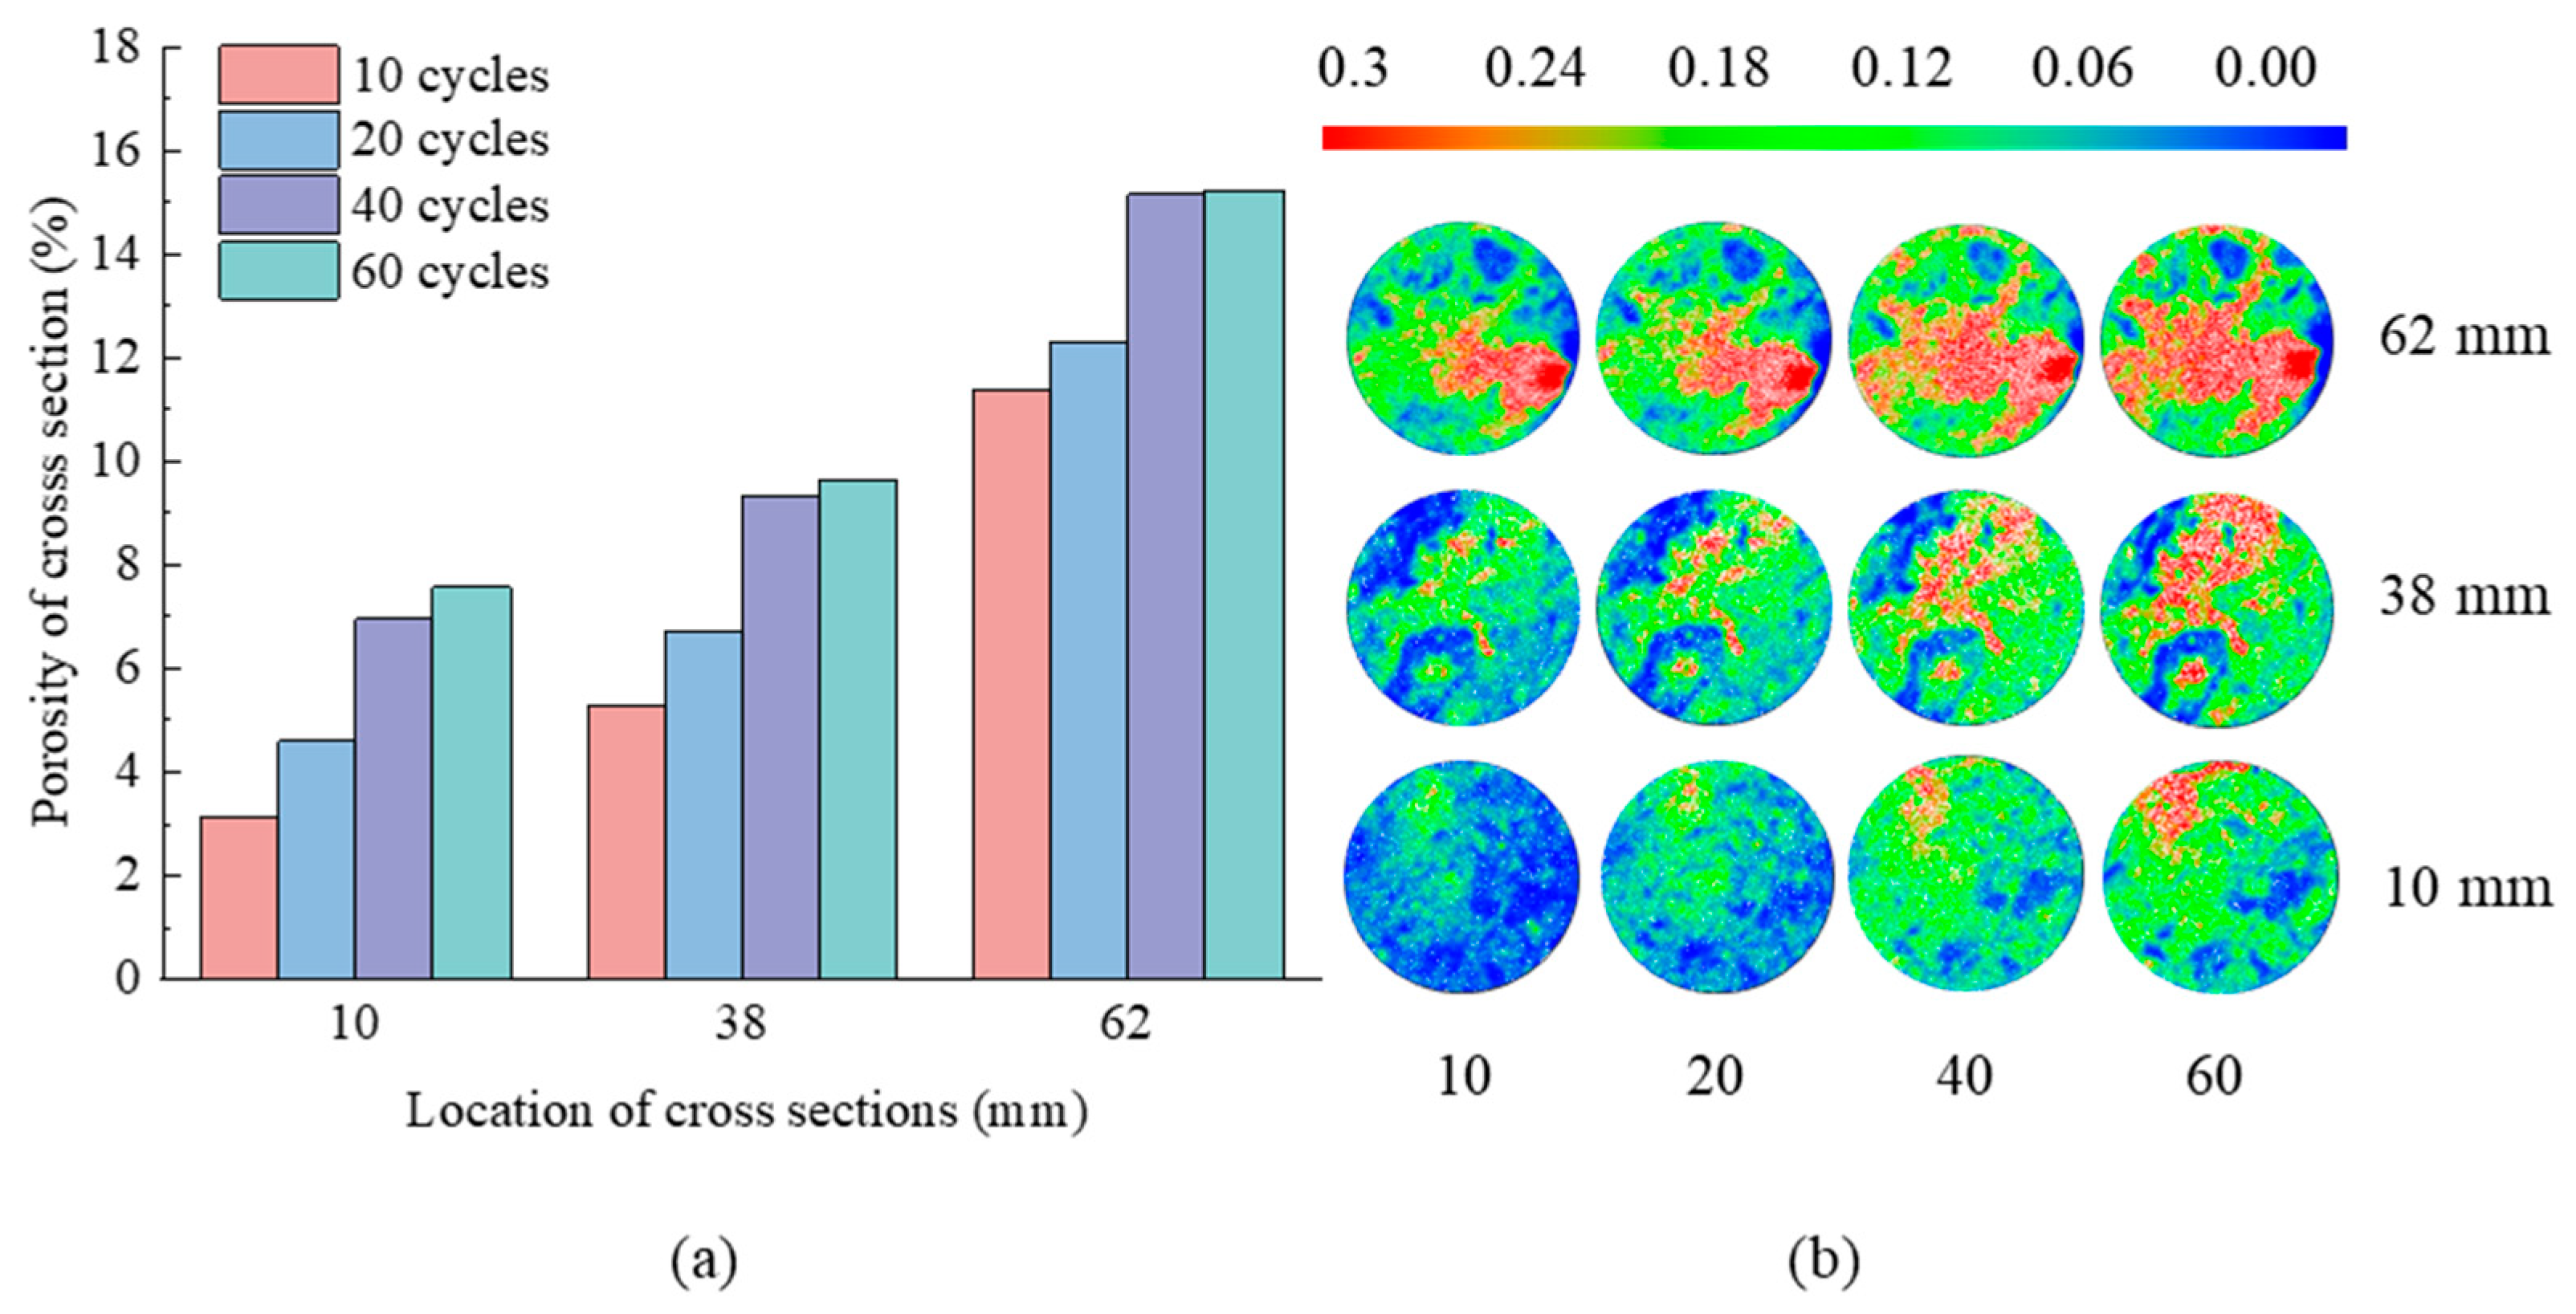
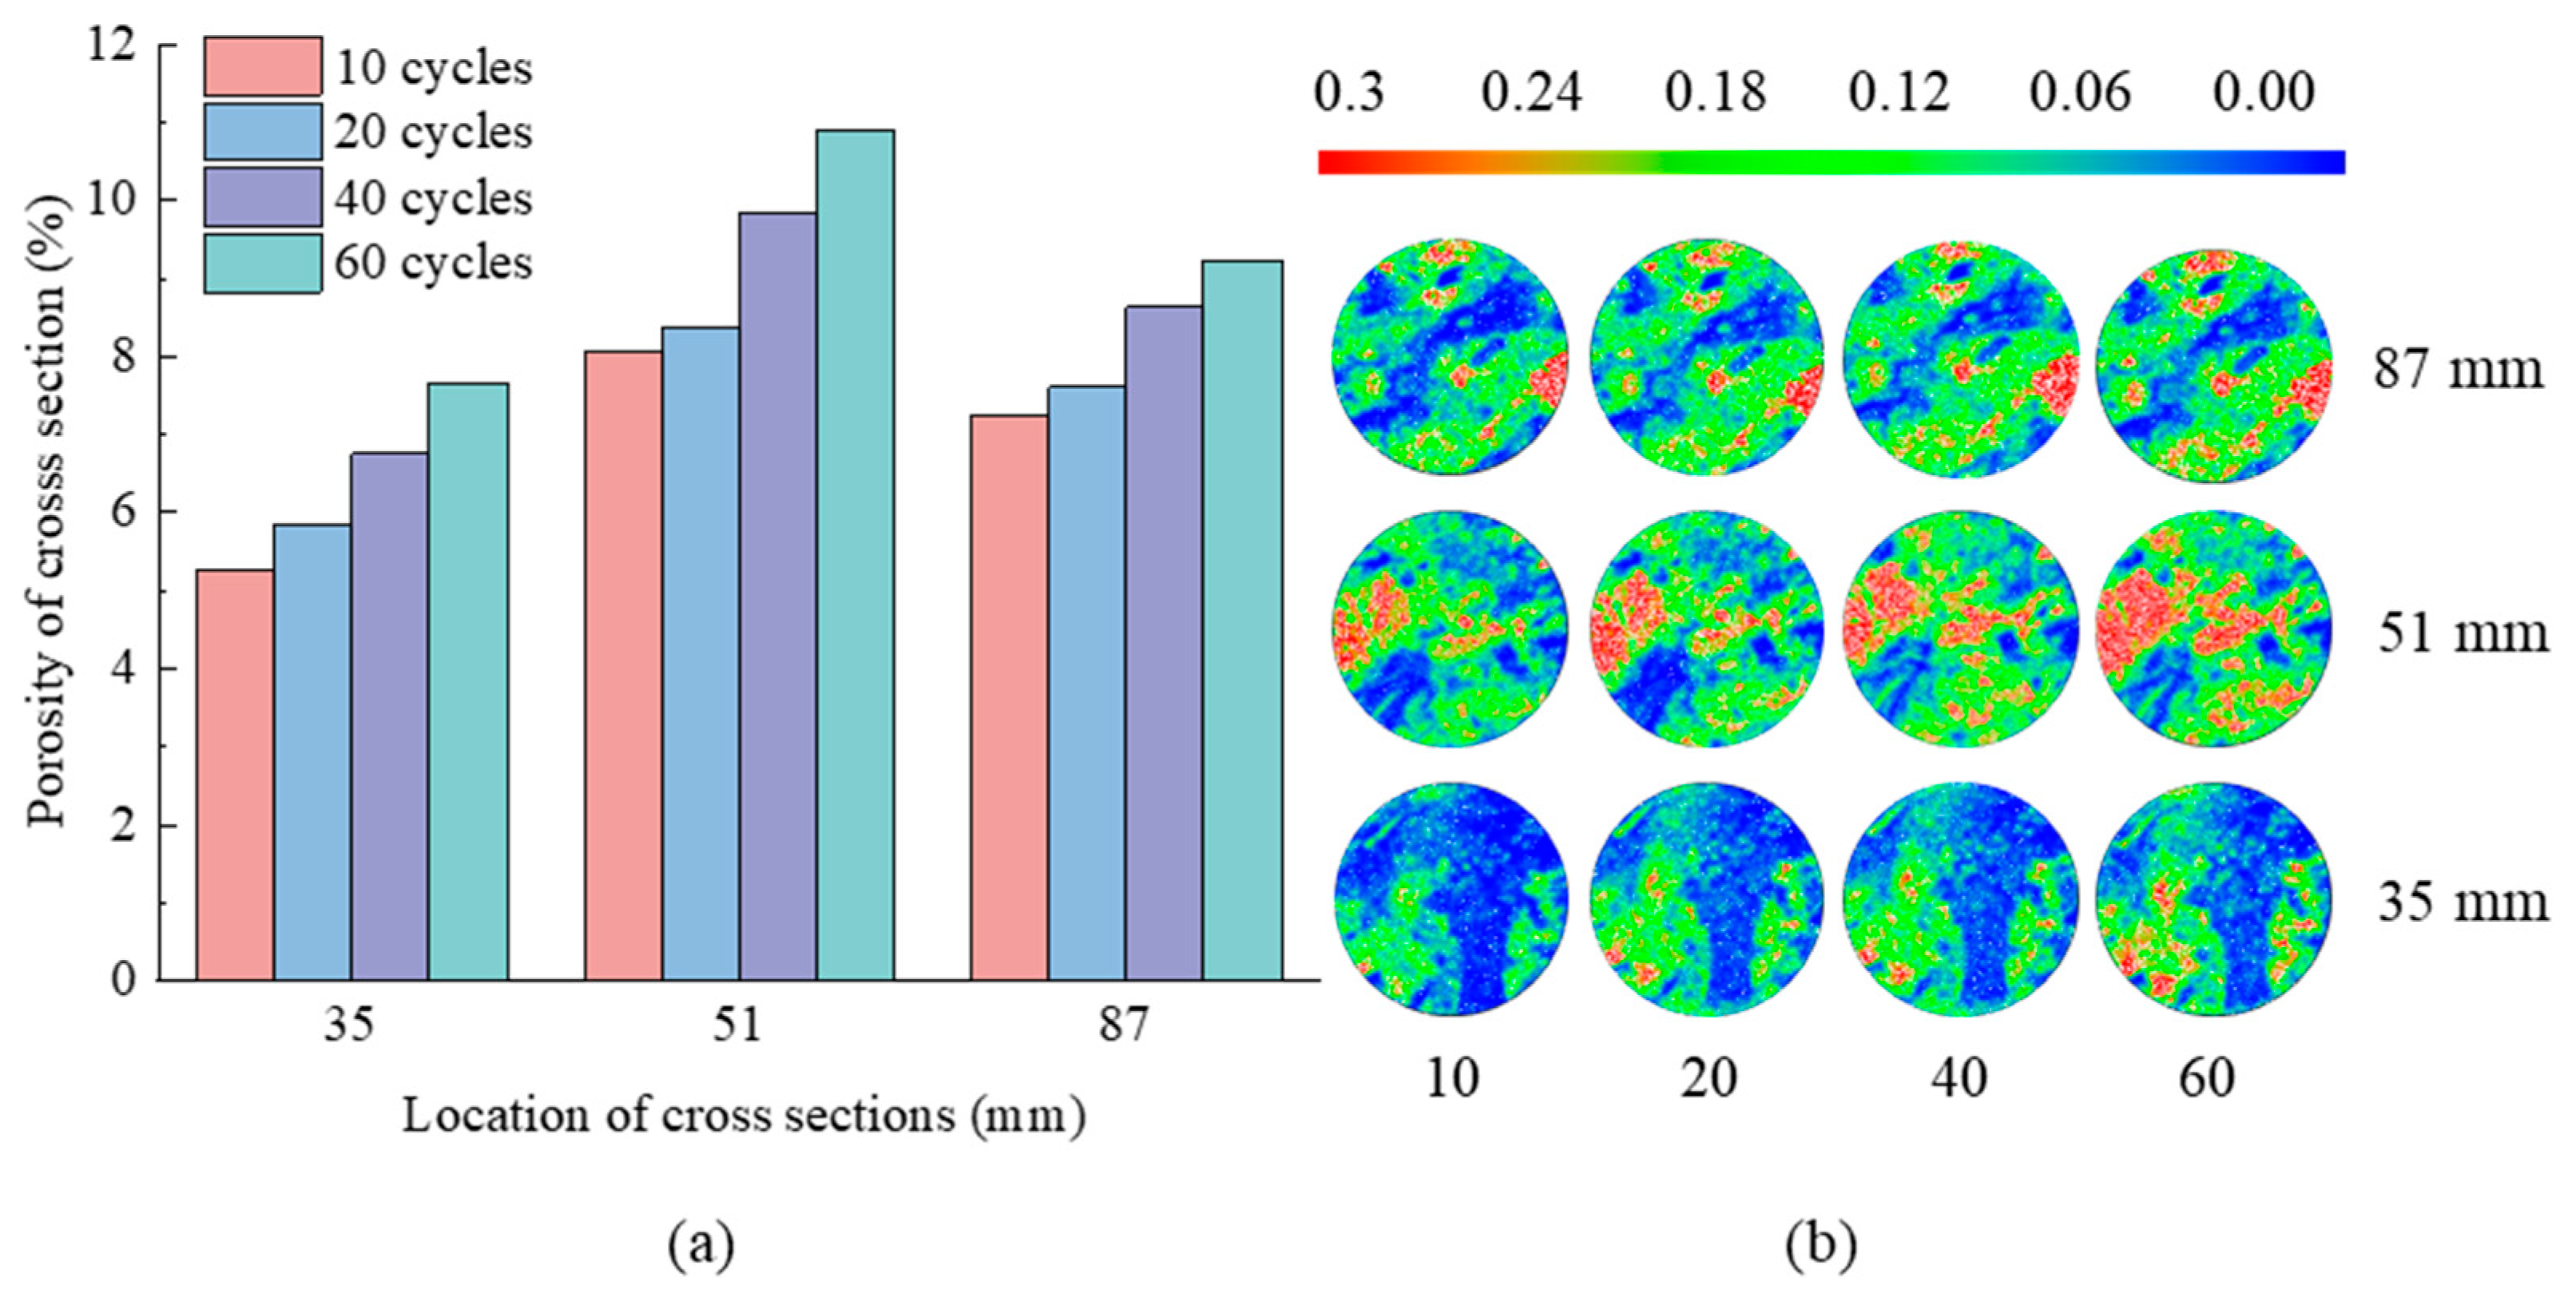
From 10 to 60 erosion days, the maximal and average porosity changes in all cross-sections in the sodium sulfate and magnesium sulfate groups were 3.42% and 5.54%, 4.14%, and 6.59%, respectively. The largest and average values of porosity change in the sodium sulfate and magnesium sulfate groups were 3.77% and 3.35%, and 2.18% and 2.25%, respectively, as the number of freeze–thaw cycles rose from 10 to 60.

Author Contributions

Conceptualization, H.J. and A.L.; Software, Y.S.; Formal analysis, Y.S. and A.L.; Investigation, L.C. and C.W.; Data curation, L.C. and C.W.; Writing—original draft, L.C. and A.L.; Writing—review & editing, P.S. and M.L.; Funding acquisition, P.S. and M.L. All authors have read and agreed to the published version of the manuscript.

Funding

This study has been partially funded by the Second Tibetan Plateau Scientific Expedition and Research Program (Grant No. 2019QZKK0904), the Program of the State Key Laboratory of Frozen Soil Engineering (Grant No. SKLFSE-ZT-202110), and the Science and Technology Plan of Gansu Province (22JR5RA059).

Institutional Review Board Statement

Not applicable.

Informed Consent Statement

Not applicable.

Data Availability Statement

Not applicable.

Acknowledgments

The authors thank the anonymous reviewers and editors for their constructive comments on this manuscript.

Conflicts of Interest

The authors declare no conflict of interest.

References

  1. Walder, J.S.; Hallet, B. The physical basis of frost weathering: Toward a more fundamental and unified perspective. Arct. Alp. Res. 1986, 18, 27. [Google Scholar] [CrossRef]
  2. Matsuoka, N.; Murton, J. Frost weathering: Recent advances and future directions. Permafr. Periglac. Process. 2008, 19, 195–210. [Google Scholar] [CrossRef]
  3. Oguchi, C.T.; Yu, S. A review of theoretical salt weathering studies for stone heritage. Prog. Earth Planet. Sci. 2021, 8, 1–23. [Google Scholar] [CrossRef]
  4. Yang, H.; Chen, C.; Ni, J.; Karekal, S. A hyperspectral evaluation approach for quantifying salt-induced weathering of sandstone. Sci. Total. Environ. 2023, 885, 163886. [Google Scholar] [CrossRef]
  5. Trenhaile, A.S.; Mercan, D.W. Frost weathering and the saturation of coastal rocks. Earth Surf. Process. Landf. 1984, 9, 321–331. [Google Scholar] [CrossRef]
  6. Williams, R.B.G.; Robinson, D.A. Frost weathering of rocks in the presence of salts—A review. Permafr. Periglac. Process. 1991, 2, 347–353. [Google Scholar] [CrossRef]
  7. Peter, M.; Andersen, J.L.; Nixon, F.C.; Etzelmüller, B.; Westermann, S.; Fredin, O. Near-surface temperatures and potential for frost weathering in blockfields in Norway and Svalbard. Earth Surf. Process. Landf. 2023, 48, 940–955. [Google Scholar] [CrossRef]
  8. Matsuoka, N. Frost weathering and rockwall erosion in the southeastern Swiss Alps: Long-term (1994–2006) observations. Geomorphology 2008, 99, 353–368. [Google Scholar] [CrossRef]
  9. Goudie, A.S.; Viles, H.A.; Parker, A.G. Monitoring of rapid salt weathering in the central Namib Desert using limestone blocks. J. Arid. Environ. 1997, 37, 581–598. [Google Scholar] [CrossRef]
  10. Matsuoka, N. Direct observation of frost wedging in alpine bedrock. Earth Surf. Process. Landf. 2001, 26, 601–614. [Google Scholar] [CrossRef]
  11. Schnepfleitner, H.; Sass, O.; Fruhmann, S.; Viles, H.; Goudie, A. A multi-method investigation of temperature, moisture and salt dynamics in tafoni (Tafraoute, Morocco). Earth Surf. Process. Landf. 2016, 41, 473–485. [Google Scholar] [CrossRef]
  12. Kellerer-Pirklbauer, A. Potential weathering by freeze-thaw action in alpine rocks in the European Alps during a nine year monitoring period. Geomorphology 2017, 296, 113–131. [Google Scholar] [CrossRef]
  13. Matsuoka, N. Mechanisms of rock breakdown by frost action: An experimental approach. Cold Reg. Sci. Technol. 1990, 17, 253–270. [Google Scholar] [CrossRef]
  14. Park, J.; Hyun, C.U.; Park, H.D. Changes in microstructure and physical properties of rocks caused by artificial freeze–thaw action. Bull. Eng. Geol. Environ. 2015, 74, 555–565. [Google Scholar] [CrossRef]
  15. Yang, G.S.; Zhang, Q.S.; Ren, J.X.; Pu, Y. Study on the effect of freezing rate on the damage CT values of TongChuan sandstone. Chin. J. Rock Mech. Eng. 2004, 23, 4099–4104. [Google Scholar]
  16. Jia, H.; Liu, Q.; Xiang, W.; Zhang, W.; Lang, L. Damage evolution model of saturated sandstone under freeze-thaw cycles. Chin. J. Rock Mech. Eng. 2013, 32, 3049–3055. [Google Scholar]
  17. Shen, Y.; Yang, G.; Rong, T.L.; Jia, H.; Wang, M.; Liu, H. Localized damage effects of quasi-sandstone with single fracture and fracture behaviors of joint end under cyclic freezing and thawing. Chin. J. Rock Mech. Eng. 2017, 36, 562–570. [Google Scholar]
  18. Zhang, H.; Wang, Y. Multi-scale analysis of damage evolution of freezing-thawing red sandstones. Rock Soil Mech. 2022, 43, 2103–2114. [Google Scholar]
  19. Wang, P.; Xu, J.; Liu, S.; Liu, S.; Wang, H. A prediction model for the dynamic mechanical degradation of sedimentary rock after a long-term freeze-thaw weathering: Considering the strain-rate effect. Cold Reg. Sci. Technol. 2016, 131, 16–23. [Google Scholar] [CrossRef]
  20. Hori, M.; Morihiro, H. Micromechanical analysis on deterioration due to freezing and thawing in porous brittle materials. Int. J. Eng. Sci. 1998, 36, 511–522. [Google Scholar] [CrossRef]
  21. Williams, R.B.G.; Robinson, D.A. Weathering of sandstone by the combined action of frost and salt. Earth Surf. Process. Landf. 1981, 6, 1–9. [Google Scholar] [CrossRef]
  22. Sun, Q.; Dong, Z.; Jia, H. Decay of sandstone subjected to a combined action of repeated freezing–thawing and salt crystallization. Bull. Eng. Geol. Environ. 2019, 78, 5951–5964. [Google Scholar] [CrossRef]
  23. Angeli, M.; Bigas, J.-P.; Benavente, D.; Menéndez, B.; Hébert, R.; David, C. Salt crystallization in pores: Quantification and estimation of damage. Environ. Geol. 2007, 52, 205–213. [Google Scholar] [CrossRef]
  24. Yu, S.; Oguchi, C.T. Role of pore size distribution in salt uptake, damage, and predicting salt susceptibility of eight types of Jap-anese building stones. Eng. Geol. 2010, 115, 226–236. [Google Scholar] [CrossRef]
  25. Li, B.; Zhang, G.; Ma, W.; Liu, M.; Li, A. Damage mechanism of sandstones subject to cyclic freeze–thaw (FT) actions based on high-resolution computed tomography (CT). Bull. Eng. Geol. Environ. 2022, 81, 374. [Google Scholar] [CrossRef]
  26. Deprez, M.; Kock, T.D.; Schutter, G.D.; Cnudde, V. A review on freeze-thaw action and weathering of rocks. Earth-Sci. Rev. 2020, 203, 103143. [Google Scholar] [CrossRef]
  27. Lai, Y.; Wu, Z.; Zhu, Y.; Liao, Q. CT Analysis of Frost Damage of the Surrounding Rocks of a Tunnel in the Daban Mountain. J. Glaciol. Geocryol. 2000, 22, 206–210. [Google Scholar]
  28. Wang, J.; Gao, J.; Liu, L. Porosity characteristics of sandstone by X-ray CT scanning system. Acta Pet. Sin. 2009, 30, 887–897. [Google Scholar]
  29. Desarnaud, J.; Bonn, D.; Shahidzadeh, N. The Pressure induced by salt crystallization in confinement. Sci. Rep. 2016, 6, 30856. [Google Scholar] [CrossRef]
  30. Santhanam, M.; Cohen, M.D.; Olek, J. Mechanism of sulfate attack: A fresh look: Part 1: Summary of experimental results. Cem. Concr. Res. 2002, 32, 915–921. [Google Scholar] [CrossRef]
  31. Santhanam, M.; Cohen, M.D.; Olek, J. Mechanism of sulfate attack: A fresh look: Part 2. Proposed mechanisms. Cem. Concr. Res. 2003, 33, 341–346. [Google Scholar] [CrossRef]
  32. Benavente, D.; Martinez-Martinez, J.; Cueto, N.; Ordoñez, S.; Garcia-Del-Cura, M.A. Impact of salt and frost weathering on the physical and durability properties of travertines and carbonate tufas used as building material. Environ. Earth Sci. 2018, 77, 147. [Google Scholar] [CrossRef]
  33. Sato, M.; Hattanji, T. A laboratory experiment on salt weathering by humidity change: Salt damage induced by deliquescence and hydration. Prog. Earth Planet. Sci. 2018, 5, 84. [Google Scholar] [CrossRef]
  34. Qazi, M.J.; Salim, H.; Doorman, C.A.W.; Jambon-Puillet, E.; Shahidzadeh, N. Salt creeping as a self-amplifying crystallization process. Sci. Adv. 2019, 5, eaax1853. [Google Scholar] [CrossRef]
Figure 1. Surface weathering and deterioration of tuff in the Bazi Bridge in Shaoxing City.
Applsci 13 10483 g001
Figure 2. Schematic diagram of test system of frost and salt weathering of tuff.
Applsci 13 10483 g002
Figure 3. Schematic diagram of CT scanning and 3D reconstruction of tuff sample.
Applsci 13 10483 g003
Figure 4. Mass change in tuff samples under frost and salt weathering (a) salt weathering (b) coupled salt and frost weathering.
Applsci 13 10483 g004
Figure 5. The evolution of the cross-section over time under salt weathering (ac) samples soaked into magnesium sulfate solution for 10, 40, 60 days; (df) samples soaked into sodium sulfate solution for 10, 40, 60 days.
Applsci 13 10483 g005
Figure 6. 3D Pore distribution of tuff (a) N2 group, (b) N3 group, (c) N5 group, and (d) N6 group.
Applsci 13 10483 g006
Figure 7. Cross-section porosity (a) N2 group, (b) N3 group, (c) N5 group, and (d) N6 group.
Applsci 13 10483 g007
Figure 8. (a) Porosity of cross-sections and (b) porosity distribution on the cross-sections at Z = 24, 46, 74 mm with 10, 20, 40, 60 days in N2 group.
Applsci 13 10483 g008
Figure 9. (a) Porosity of cross-sections and (b) porosity distribution on the cross-sections at Z = 29, 51, 76 mm with 10, 20, 40, 60 days in N3 group.
Applsci 13 10483 g009
Figure 10. (a) Porosity of cross-sections and (b) porosity distribution on the cross-sections at Z = 10, 38, 62 mm with 10, 20, 40, 60 days in N5 group.
Applsci 13 10483 g010
Figure 11. (a) Porosity of cross-sections and (b) porosity distribution on the cross-sections at Z = 35, 51, 87 mm with 10, 20, 40, 60 days in N6 group.
Applsci 13 10483 g011
Table 1. Initial experiment conditions.
Rock TypeSample Size (mm)Experiment ContentExperiment ConditionTest
Number
Initial
Mass (g)
Tuffφ50 × 100Salt weathering (25 °C)Distilled waterN1482.12
Sodium sulfateN2485.05
Magnesium sulfate N3484.13
Coupled frost and salt weathering
(−20~20 °C)
Distilled water and freeze–thaw cyclesN4484.50
Sodium sulfate and freeze–thaw cyclesN5487.60
Magnesium sulfate and freeze–thaw cyclesN6483.00
Disclaimer/Publisher’s Note: The statements, opinions and data contained in all publications are solely those of the individual author(s) and contributor(s) and not of MDPI and/or the editor(s). MDPI and/or the editor(s) disclaim responsibility for any injury to people or property resulting from any ideas, methods, instructions or products referred to in the content.

