Article

Determination of the Dependences of the Nutritional Value of Corn Silage and Photoluminescent Properties

by
Dmitriy Y. Pavkin
,
Mikhail V. Belyakov
,
Evgeniy A. Nikitin
*,
Igor Y. Efremenkov
and
Ilya A. Golyshkov
Federal Scientific Agroengineering Center VIM, 109428 Moscow, Russia
*
Author to whom correspondence should be addressed.
Appl. Sci. 2023, 13(18), 10444; https://doi.org/10.3390/app131810444
Submission received: 28 August 2023 / Revised: 13 September 2023 / Accepted: 14 September 2023 / Published: 18 September 2023
(This article belongs to the Special Issue Agriculture 4.0 – the Future of Farming Technology)

Abstract

:
This article examines existing optical methods for the diagnostics of food and feed products used in agriculture to determine their nutritional value or detect maximum permissible indicators. Among the most common feeds used for cattle, corn silage is considered. Its nutritional value depends on many external factors that need to be taken into account when formulating feeding rations. This article is dedicated to assessing the prospects of using visible-range photoluminescence for determining dry matter content, total protein content, and NDF (neutral detergent fiber) using a portable device in field conditions without lengthy sample preparation. This research aims to develop a laboratory device and establish the theoretical foundations for determining the nutritional value of agricultural feeds using photoluminescence. The study revealed that the most indicative range for measuring nutritional corn silage is to use excitation via radiation with a wavelength of about 362 nm. At the same time, the luminescent radiation flux must be measured in a range of 440–620 nm. Moreover, R 2 values greater than 0.8 were achieved in correlation after constructing luminescence relationships only for the determination of dry matter content/moisture, total protein content, and NDF. This indicates the potential use of the proposed method for determining these parameters.

1. Introduction

Modern livestock complexes for the maintenance of large cattle specialized in milk and beef production are enterprises with a high level of automation of technological processes. However, some of these processes cannot be executed with 100% efficiency without human intervention [1]. One such process is the feeding of animals, which involves a complex of preparatory measures for calculating and justifying the composition of feed components and the energy value of the mixed diet [2].
In general, when forming the feeding ration for animals, the farmer adheres to a strictly rational approach from the perspective of milk or beef productivity, as well as the preservation of animal health, ensuring productive longevity [3]. Achieving high levels of animal efficiency in terms of milk and beef production is determined by the feedstock of the animals, the balance of the diet, and the energy value of the feed [4].
The nutritional or energy value of feeds used for animal feeding is typically determined through preliminary analysis, where a key indicator is the dry matter content. This indicator determines the amount of nutrients that the animal will receive by consuming a specific component of the feed mixture [5].
The dry matter content in plant feeds for agricultural animals is measured using gravimetric, dielcometric, and optical methods.
The gravimetric method, most common in countries with low investment attractiveness in the agricultural sector, particularly in terms of technological provision, involves the sampling of the analyzed feed, weighing, and then recording the initial mass indicator of the taken feed portion. Subsequently, the feed portion undergoes drying by placing it in a dehydrator or a household drying chamber using special containers. It is processed until the mass of the processed feed portion ceases to decrease (indicating complete drying of the sample). By calculating the proportion, the percentage of lost moisture is determined, and conclusions are drawn about the level of dry matter/moisture of the investigated feed.
This described method is most frequently used by farmers to determine dry matter indicators on the farm without laboratory services. However, it does not provide entirely accurate results due to the fact that complete drying of the feed to 100% is impossible when interacting with the surrounding environment. Part of the feed may adhere to the used utensils and absorb moisture from the surroundings. The significant disadvantages of this method include it being a fire hazard, as well as the labor-intensive sample preparation (up to 30 min per sample) [1,6].
Among commercial devices, the dielcometric method has gained the widest prevalence, which is based on the correlation between the dielectric permittivity of a material and its moisture content. Instruments that operate based on the dielcometric method are designed as a rod, one end of which is placed into the tested sample, while the measuring part is located at the other end. The moisture assessment results can be obtained within 20 s. However, a significant drawback of the method is that the tested sample must be tightly compressed, which is why the method is most effective for determining the moisture content of wood, feed compacted in a trench, or gathered into briquettes using special presses. Otherwise, the device introduces a high level of error [1,7].
Optical methods represent the most promising direction, with broad developmental potential compared to the methods mentioned above. Instruments based on optics are more costly in terms of development and manufacturing. However, the potential of the hardware aspect offers significantly wider possibilities in terms of the number of determinable parameters. For example, devices released to the market, such as Aurora NIR (Mayville, WI, USA) and Dinamica Generale (Poggio Rusco, Italy), enable not only the determination of dry matter content but also protein, ash, and fiber. The principle on which the operation of such devices is based is near-infrared spectroscopy [1,8].
However, concerning the non-contact determination of ash, ADF, and NDF cellulose concentrations, as well as fats, it is expedient to conduct research into the effectiveness of applying an optical method in the visible range from 380 to 780 nm [9].
According to the conducted literature review, the photoluminescence of the visible range demonstrates its effectiveness in terms of detecting okadaic acid (OA), a marine biotoxin produced by microalgae that poses a significant threat to mariculture, seafood safety, and human health. The results of processing experimental data showed that the reliability of detection using luminescence is confirmed by a coefficient of variation of 2.54% when employing alternative methods [10].
Luminescence is employed to identify the adulteration of butter by detecting non-dairy fats through the dependence of the intensity ratios of components in the extended spectrum of luminescence on palm oil content when excited at a wavelength of λ = 266 nm [11]. Additionally, it is used for the quantitative determination of fat content in milk [12].
The broader diagnostic functionality of plant products, including those that have undergone extensive processing, is provided by luminescent nanoprobes, enabling the diagnosis of heavy metal content, pesticides, and the presence of veterinary drugs, microbes, and mycotoxins [13].
Photoluminescence is a useful technique for the non-destructive and quick evaluation of cereals and other starchy products. Visible light peaking at around λ = 460 nm is observed from cereals, such as rice, wheat, barley, millet, flour, corn starch, and peanut, under the illumination of ultraviolet light at λ = 365 nm [14].
The photoluminescence method demonstrates its effectiveness in detecting riboflavin and its derivative flavin mononucleotide in cellulose materials [15], which also suggests the potential for identifying important vitamins in livestock feed.
Moreover, photoluminescence has been actively utilized in the industrial processing of food products and the preparation of semi-finished goods. For instance, in the range of 550 nm, myoglobin in poultry meat actively fluoresces, allowing the degree of poultry cooking to be determined through its detection [16].
Similarly, for the detection of vitamin B2 (riboflavin) in cellulose materials, its concentration is determined in milk at peak intensity values of λ = 545 nm, by measuring the configuration of backscattering using ultraviolet LEDs, violet LEDs, or a blue LED as the excitation light [17].
In confirmation of the efficiency of detecting qualitative feed indicators and ensuring safety prior to direct animal consumption, photoluminescence enables the visualization of serum albumin within the range of 480 to 535 nm [18].
The most commonly used mathematical method for processing optical signals obtained from photodiodes is correlation–regression analysis, often accompanied by the pre-training of the hardware algorithm. In this process, preliminary results obtained through chemical analysis are utilized as the reference parameter for the corresponding sample.
In the scope of this present study, we examined the prospect of utilizing the photoluminescence method as a tool for determining the dry matter content in livestock feed. To test the key hypotheses, a prototype device equipped with LEDs and photodiodes calibrated to a specific range of luminescence was developed for corn silage and compound feed.
The goal of the presented research is to develop a laboratory apparatus and establish theoretical foundations for determining the nutritional value of agricultural feeds using photoluminescence.

2. Materials and Methods

Study of Spectral Characteristics of Feed Mix Components

The physical phenomenon serving as a basis for the offered method consists of measuring the image reflection ability of a forage mix surface layer.
At the preliminary laboratory study stage, it was necessary to determine spectral characteristics of components of feeding mixes as exemplified by a cattle feed ration. This type of ration can contain natural-origin forages (grass green mass, corn silage, alfalfa haylage) and concentrated mixed fodder (consisting of grain mash, corn, and barley as rape meal and sunflower meal).
The study aimed to determine the optical properties and establish correlation spectral dependencies of the most commonly used components in cattle feed mixtures. The investigated materials included corn silage. The exploration of optical properties was carried out using a spectrofluorimeter CM 2203 (Lumex, St. Petersburg, Russia) (Figure 1), through which the most indicative ranges of photoluminescence for corn silage were determined.
Based on the conducted measurements, it was revealed that the excitation of photoluminescence in corn silage occurs from 220 nm to 550 nm. The most representative range of photoluminescence for corn silage was found to be from 350 nm to 365 nm, where the strongest light signal absorption occurred. This allowed for the use of light-emitting diodes and photodiodes tuned to the corresponding frequency in the portable device prototype.
Preliminary measurements from the spectrofluorimeter, which determined the most representative measurement range of 350–365 nm, shaped the concept of constructing a portable optical device. As there is a high probability of external light exposure within this range, the decision was made to eliminate external light exposure by creating a light-permeable casing with a retractable case.
For the utmost representativeness of optical measurement results, the internal part containing the optical module was colored in a matte black shade to eliminate reflections.
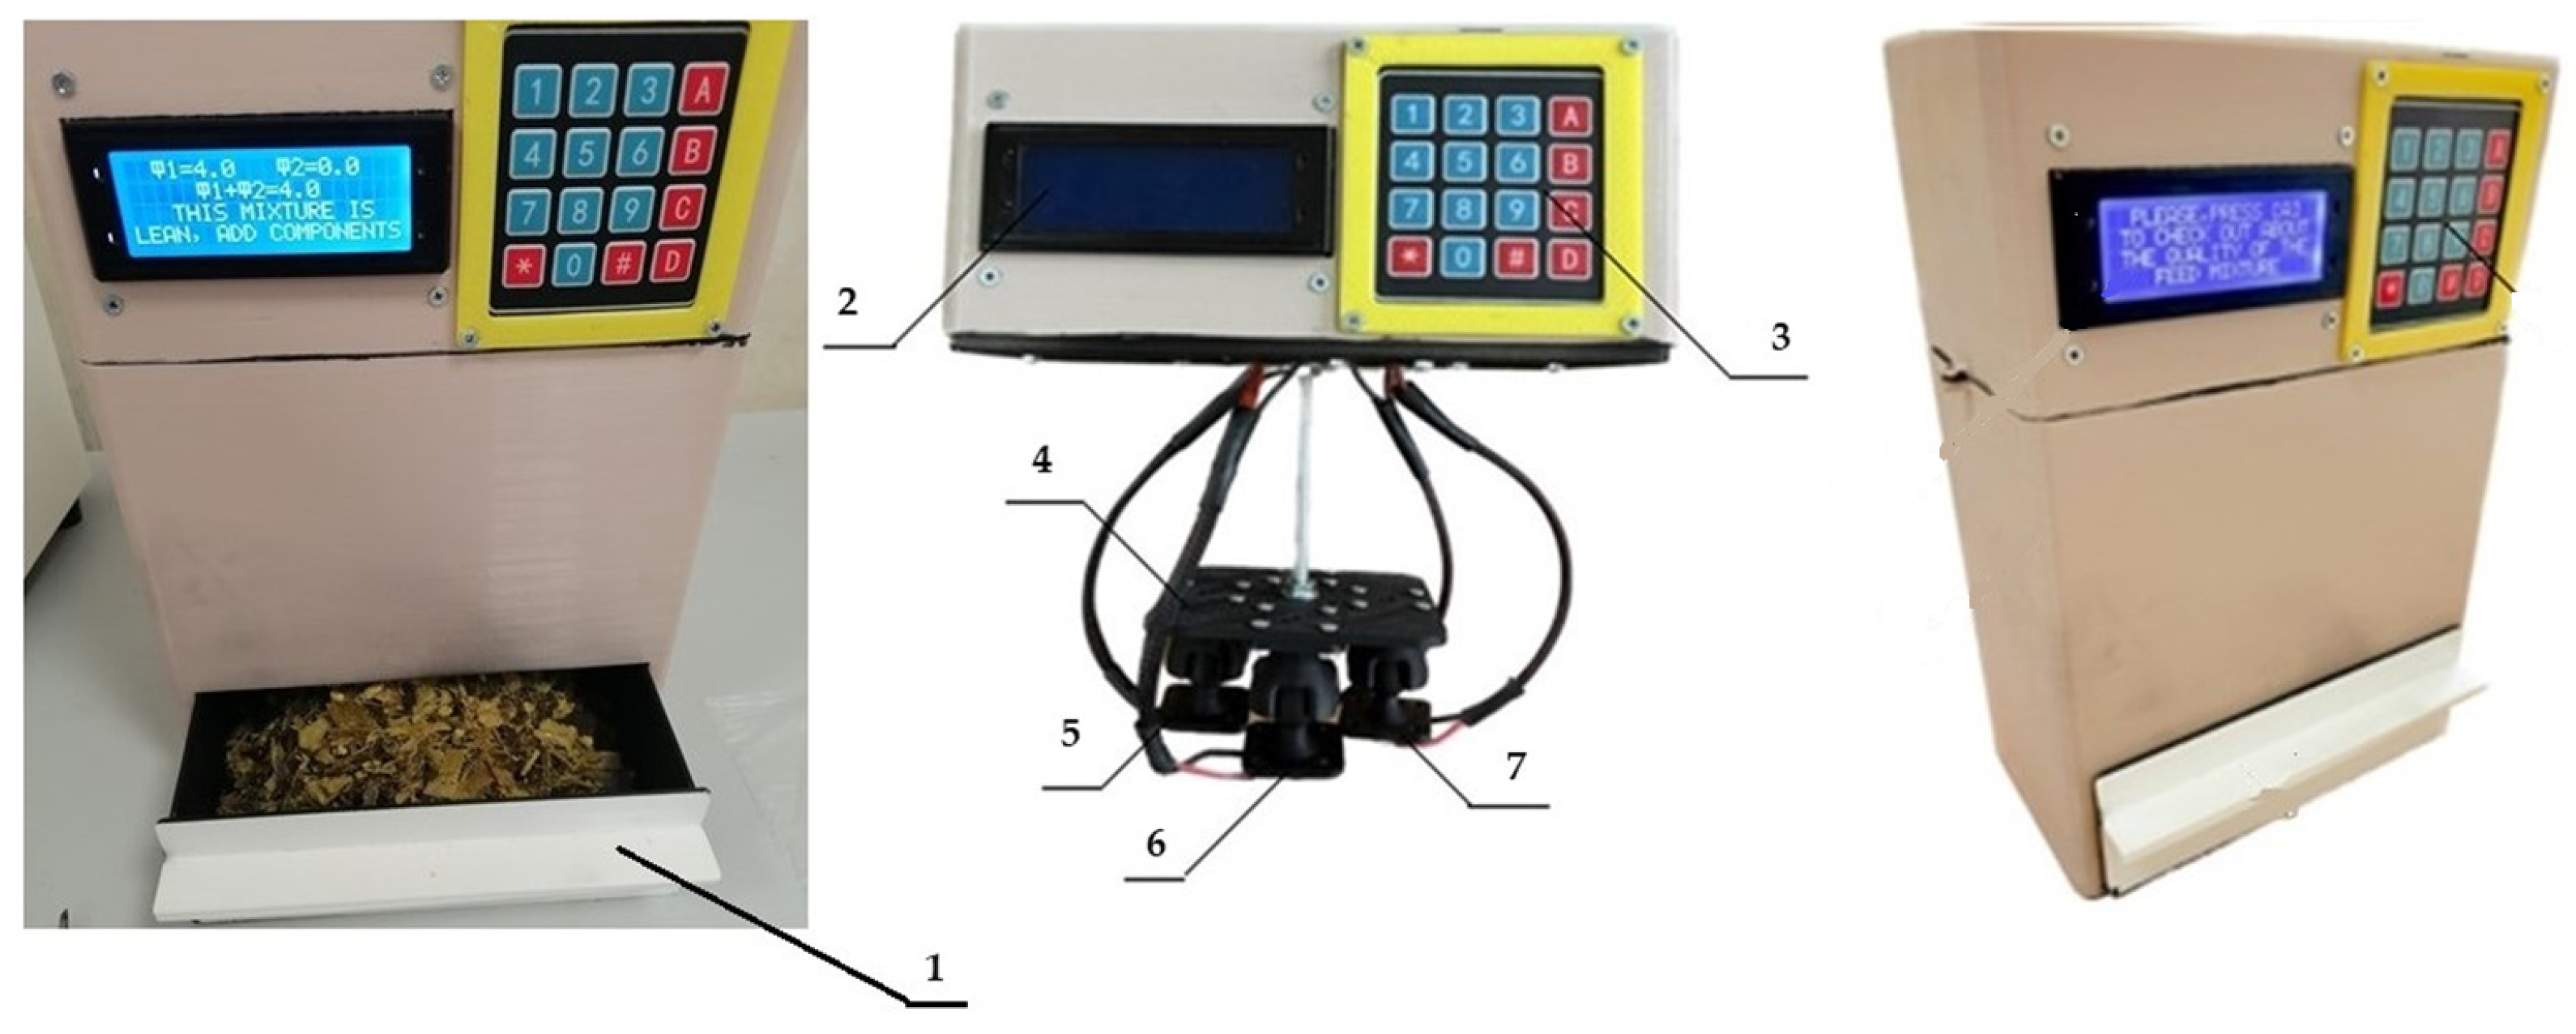
The external appearance of the portable optical device for determining the photoluminescence of agricultural feeds is depicted in Figure 2.
Since the luminescent emission from silage has extremely low intensity, signal amplifiers are necessary for its detection alongside the photodiode. Operational amplifiers AD820ANZ (Analog Devices, Shanghai, China) are used as amplifiers. Once the signal passes through the operational amplifier, it is processed via the microcontroller ATmega328P (Atmel Corporation, Shenzhen, China) and subsequently displayed on the LCD 2004 (Winstar Display, Taiwan, China). The laboratory analyzer is powered by batteries with a nominal capacity of 2200 mAh. Device control is carried out through the keyboard (Figure 2, position 3).
The key indicator that determines the quantity of nutrients in feed is the dry matter content or its inverse value (humidity). Based on these values, farmers determine the agrotechnical deadlines for plant processing or the timing for starting feed harvesting. Additionally, it involves modeling a multi-component diet, considering the balance between total dry matter consumption and moisture level. This is especially important for livestock groups during peak lactation periods.
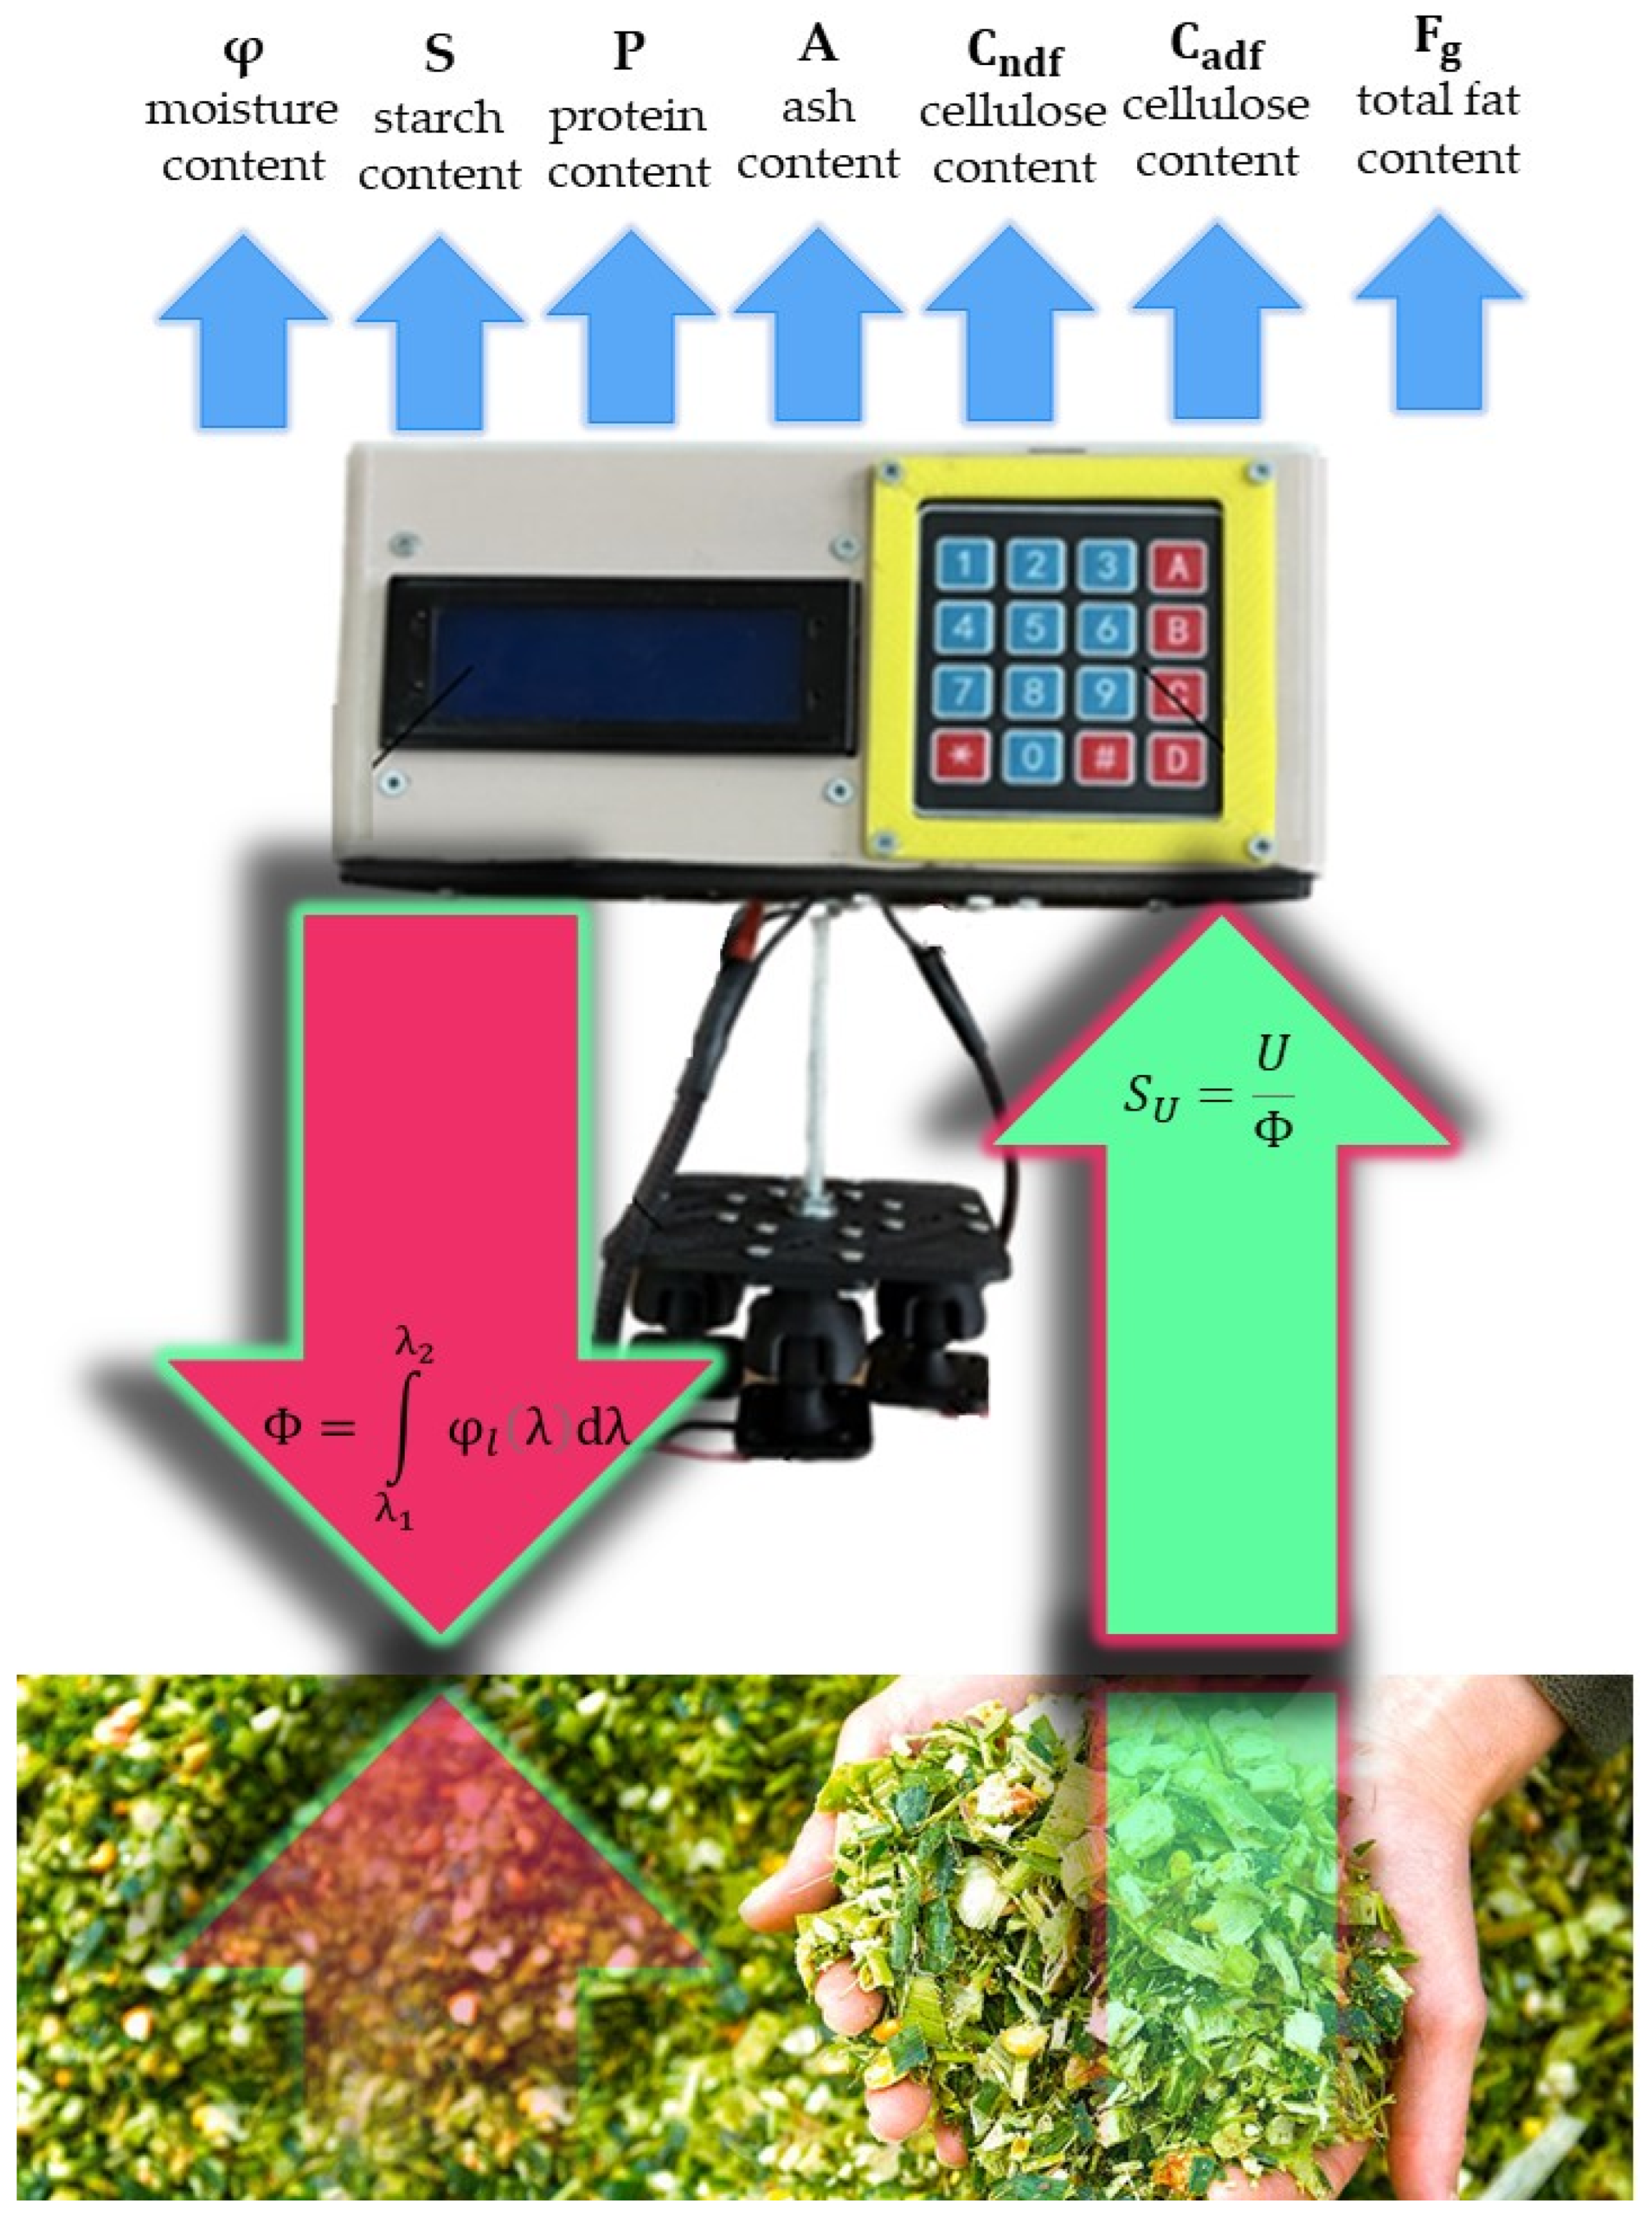
The algorithm for determining the dry matter content using a portable optical device based on photoluminescence is presented in Figure 3.
The main hypothesis of the presented study is to determine the nutritional value of agricultural feed using an optical method that does not require preliminary sample preparation. This will ensure the construction of a device for conducting measurements in the field. To do this, we measured photoluminescence fluxes using a laboratory sample according to the following equations.
Sampling of corn silage from the storage was carried out using a manual sampler; then, vacuum sealing of the material was carried out. Up to 59 measurements were carried out to construct correlation dependencies for each indicator, while the values with the largest spread from the average were entered in Table 1.
The integral value of photoluminescence flux is determined using Formula (1).
Φ = λ 1 λ 2 φ l λ d λ
φl(λ)—photoluminescence spectra;
λ1–λ2—limits of the operating spectral range of photoluminescence.
In this case, photonic signals are determined according to Formula (2).
U = U g U d
Ug—total voltage on the photodiode;
Ud—dark voltage.
Formula (3) is expressed through the photonic signal.
U = S U · Φ
SU—voltage sensitivity of the photodiode.
Further, by using the provided mathematical data processing algorithm and the developed original photoluminescence device, measurements of corn silage were carried out with the construction of correlation–spectral dependencies concerning the dry matter content.
The research was conducted in June 2023 on the basis of the Federal Agroengineering Center VIM, while the samples of corn silage were grown on the basis of the agricultural firm JSC Zelenogradskoye (Moscow region) and laid for storage in 2022. Sampling was carried out using a special sampler, while the packaging of the corn silo sample was vacuum- and light-tight.

3. Results

Among the three previously identified excitation maxima in plant organisms (362 nm, 424 nm, 485 nm) (PHP23), the silage absorption spectrum shows the most pronounced peak at 362 nm. The peak at 424 nm is more than twice as small and shifted to the short-wavelength region. The peak at 485 nm is not evident in the spectrum. Peaks in the long-wavelength region above 550 nm are instrument noise and do not induce luminescence, as experimentally verified by the authors. Furthermore, as evident from Figure 4, the excitation and, consequently, photoluminescence are very weak, necessitating work with integral parameters.
The spectral excitation characteristic of the silage is presented in Figure 4.
Earlier, we found that in plant feeds with maximum excitation (362 nm, 424 nm, 485 nm) [19], in the excitation (absorption) spectrum of the silos, the maximum 362 nm is most pronounced. The maximum of 424 nm is more than twice as small and shifted to the shortwave region. The maximum of 485 nm does not appear in the spectrum. Bursts in the long-wavelength region above 550 nm are the noise of the device and do not excite luminescence, which was verified experimentally by the authors. Also, from Figure 4, it can be seen that the excitation and, consequently, photoluminescence are very weak; therefore, it is necessary to work with integral parameters.
In Table 1, we entered data characterizing the largest variation in the measurement process in the amount of eight values for each indicator. At the same time, the experiment assumed a repetition of measurements up to 59 times for each sample.
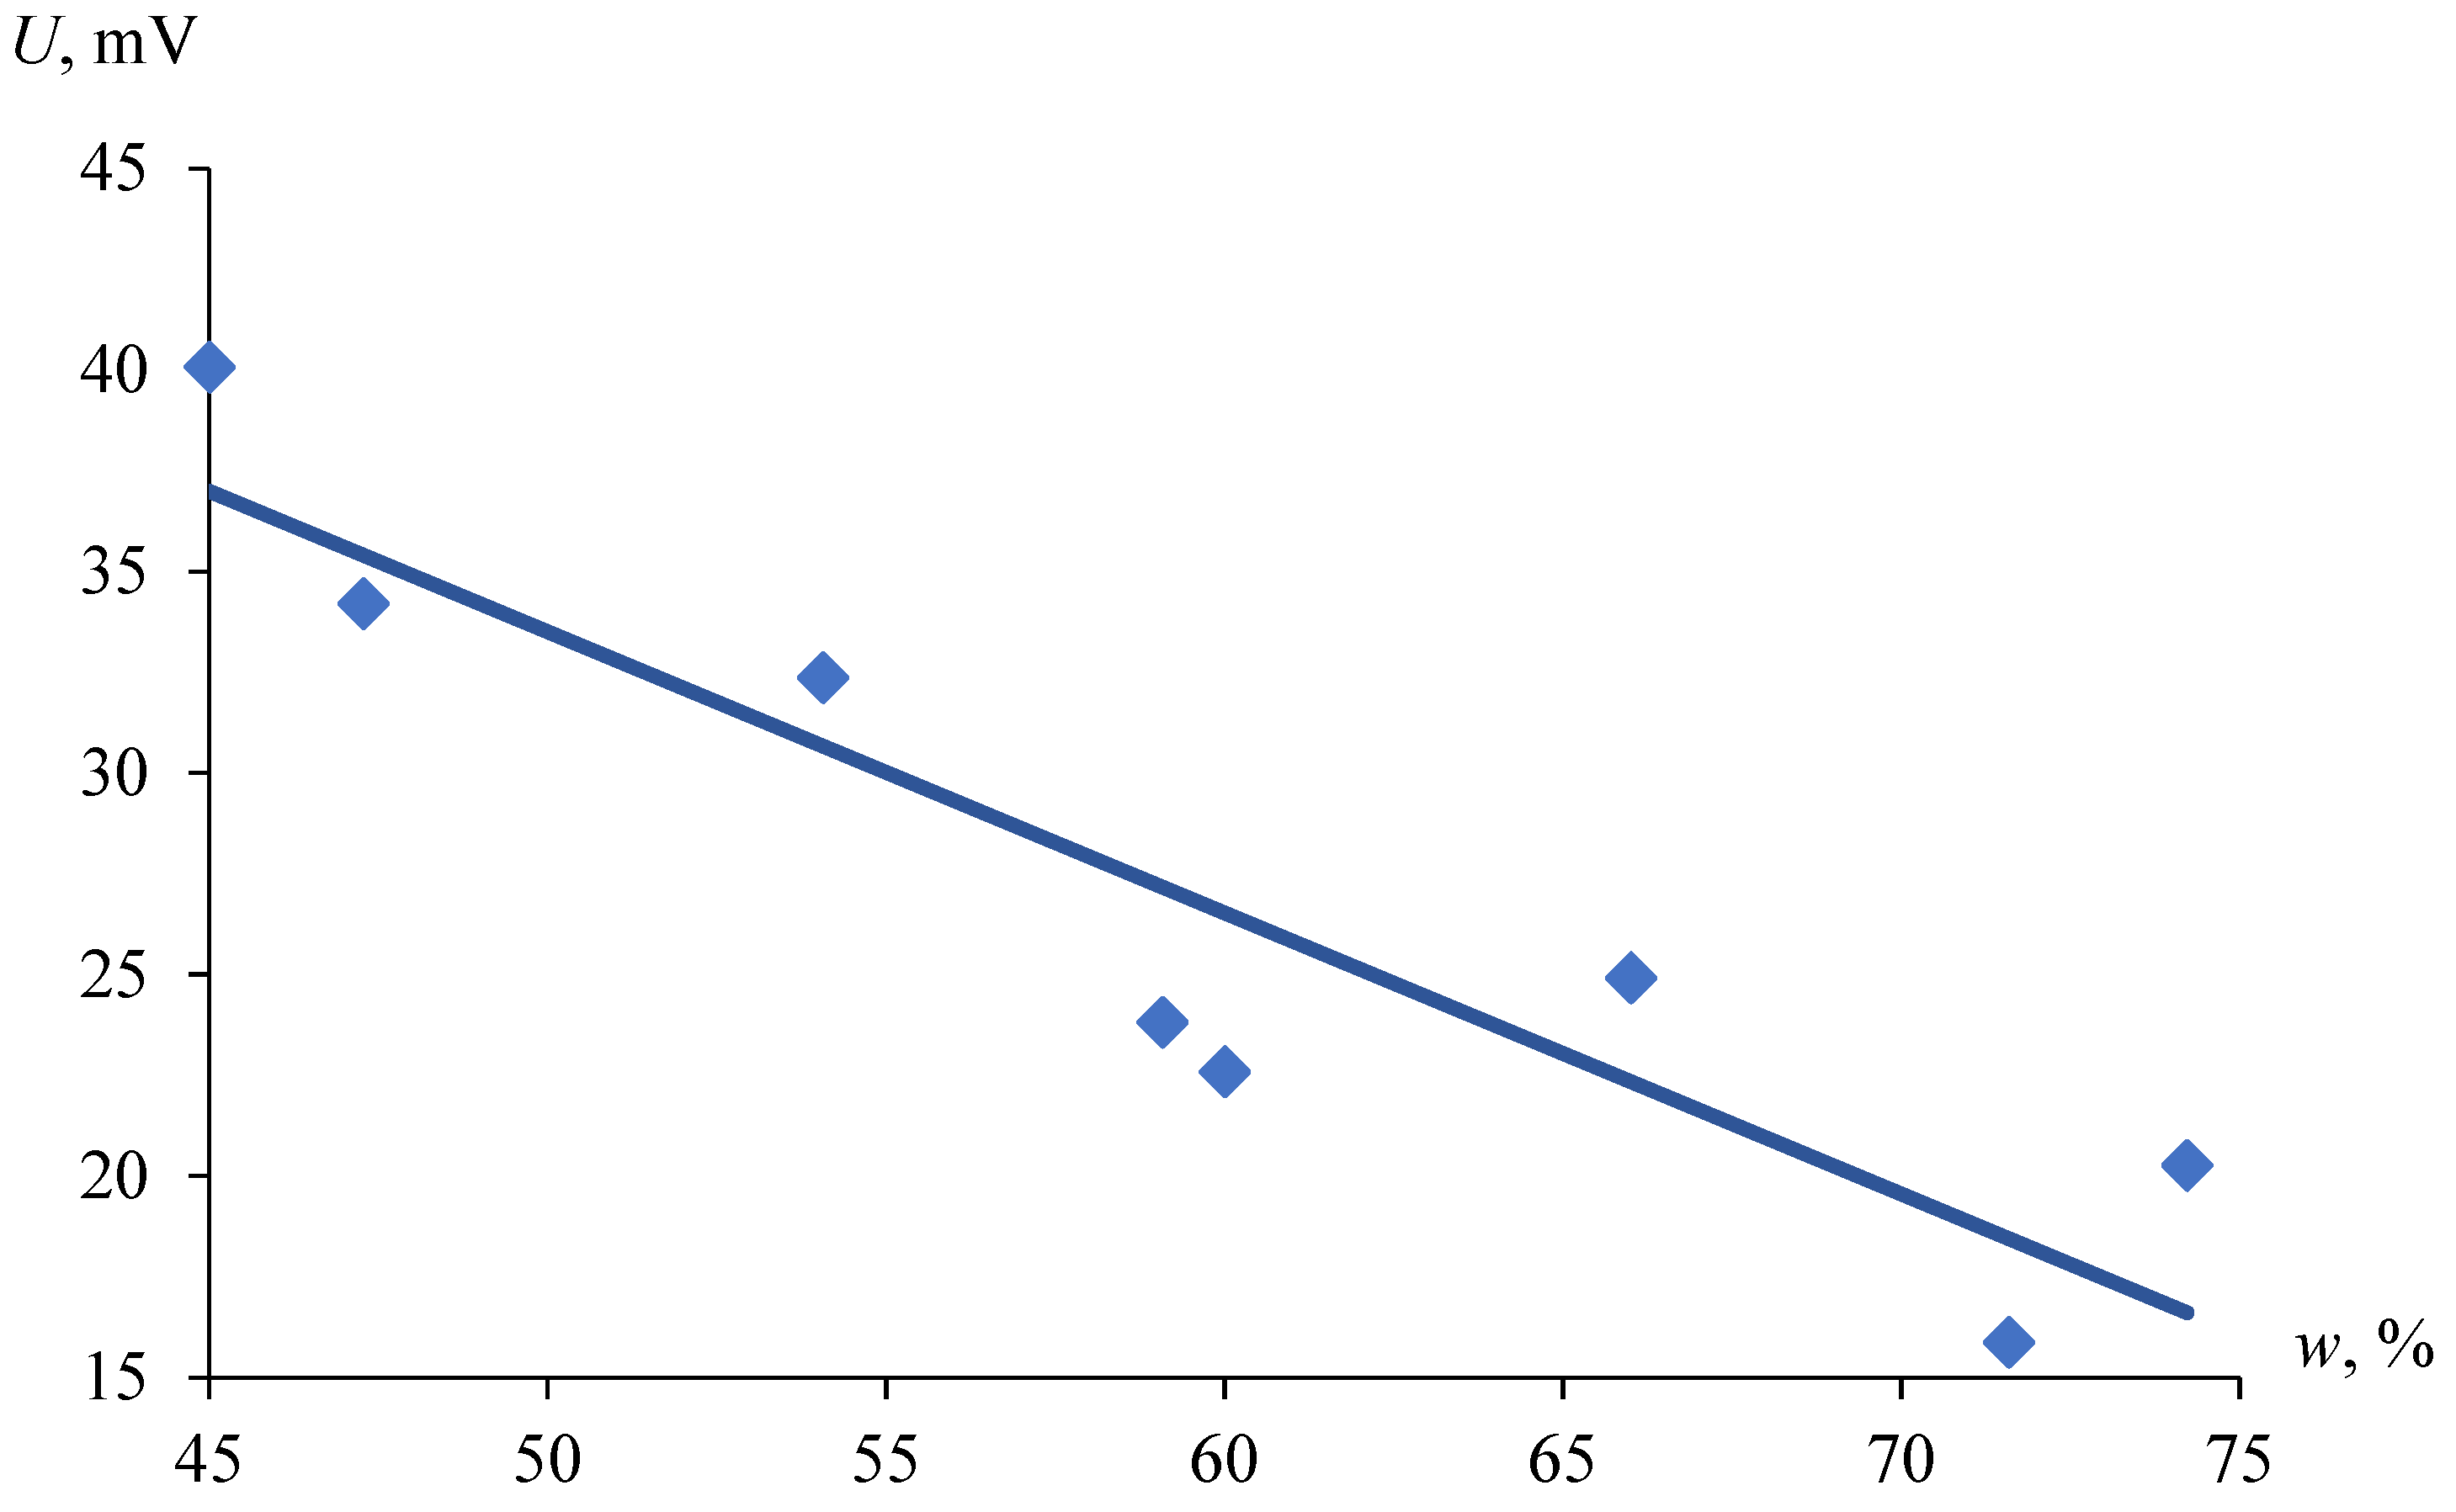
Based on the array of obtained values, dependencies of the photo signal on silage moisture content were constructed, along with their approximations, as presented in Figure 5.
The dependence U(w) can be statistically and reliably approximated using a linear function with a coefficient of determination R2 = 0.8522.
For silage with varying moisture content, the change in the photoluminescence intensity is caused by the quenching of fluorescence due to changes in the concentration of mechanically bound (free) water in the near-surface tissues. The quenching of fluorescence is caused by collisions of excited atoms with their surrounding unexcited particles. As a result of the collisions, the excitation energy transfers into the kinetic energy of the colliding particles or into the excitation energy of the partner. The efficiency of the quenching depends on the collision frequency with the excited atom and the probability of quenching during collisions. Quenching becomes pronounced at high concentrations when the free path length of particles is small and the collision frequency is high. The quenching effect is particularly strong in condensed media. The quenching of fluorescence as a result of the collisions of the excited particles is accompanied by a reduction in the average lifetime of the excited state. The nature of the particles colliding with excited atoms significantly influences the efficiency of quenching.
Static quenching is caused by the formation of a non-luminescent product as a result of the interaction between the fluorophore and the quencher (water). Since static quenching is related to the formation of non-luminescent complexes Z between the fluorophore molecule L and the quencher molecule Q, the quenching process can be described using Formula (4).
L + Q = Z
If the absorption of the fluorophore and the complex is the same, then the following expression can be written (Formula (5)).
η η Q = 1 + β y Q
η—luminescence yield in the absence of quencher;
ηQluminescence yield in the presence of quencher;
βy—stability constant of the non-luminescent complex;
Q—concentration of quencher molecules.
In this case, the value of Q is proportional to the moisture content of the silage, w.
In addition to determining the dry matter content in corn silage, this research aimed to test the hypothesis regarding the determination of other nutritional value indicators using photoluminescence. These indicators also hold significant importance in the management of feeding for cattle and other animals, such as protein content, ADF and NDF cellulose content, ash content, etc.
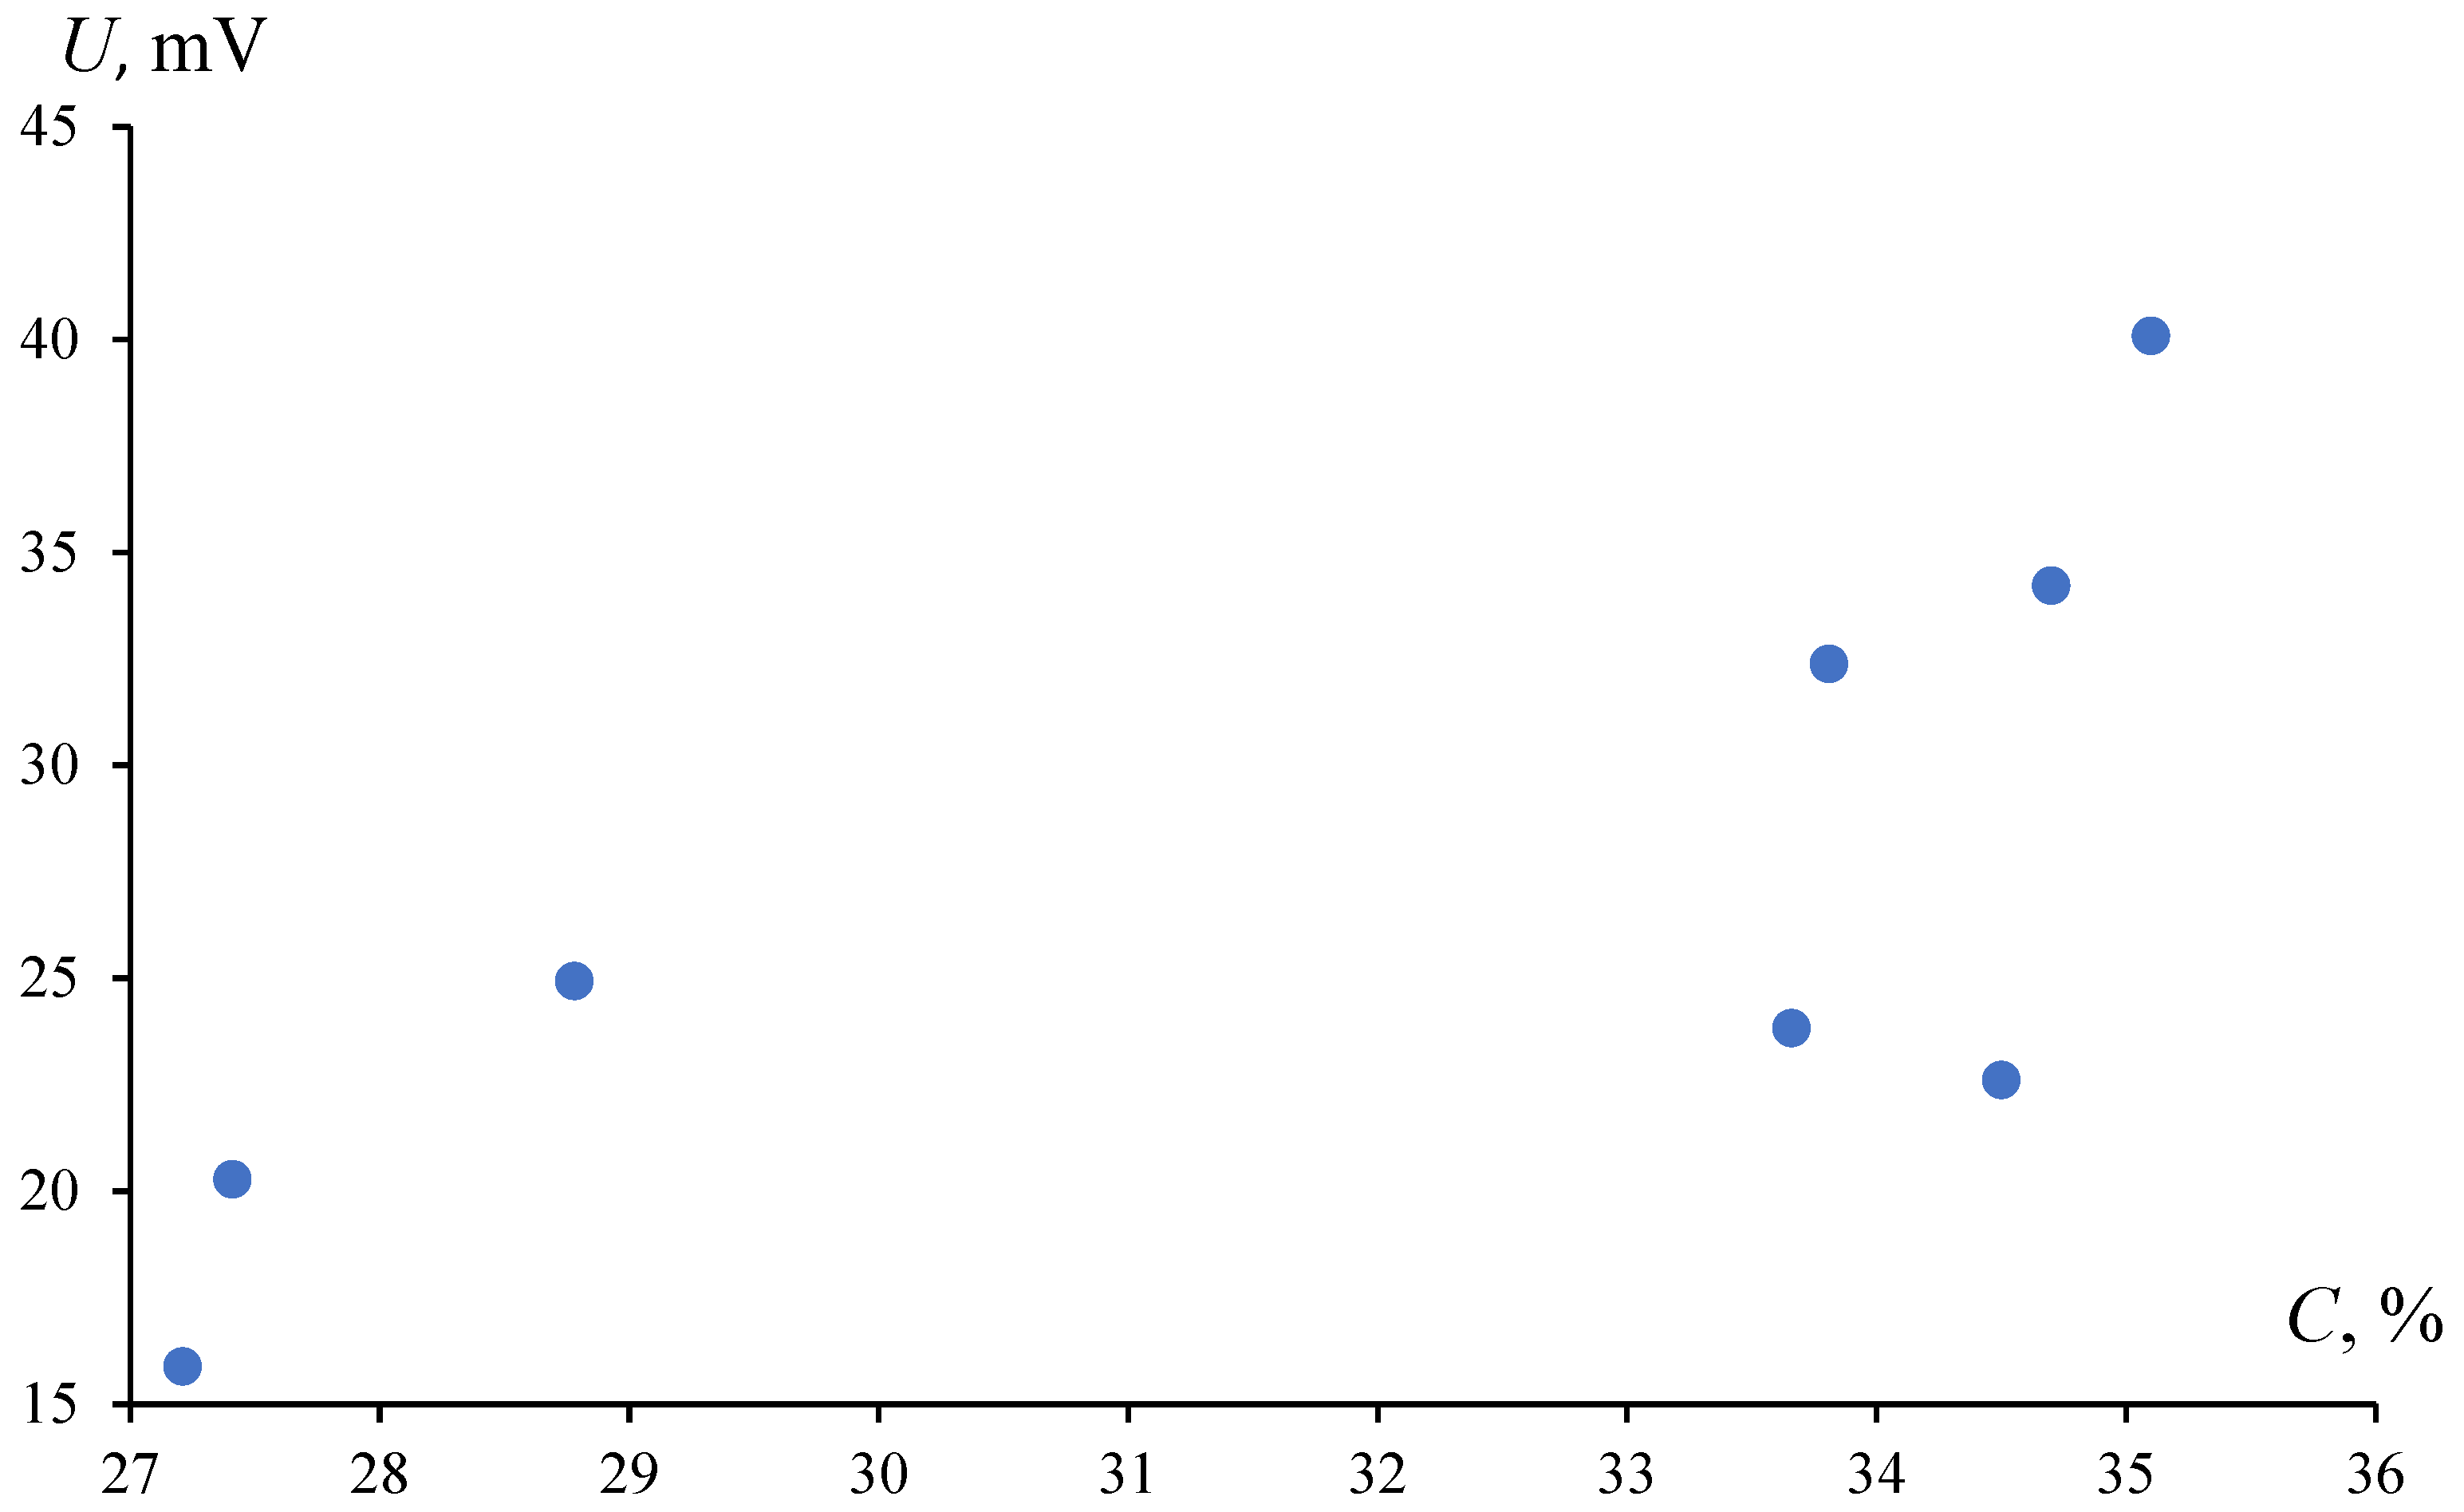
The investigated sample of corn silage on the developed device was also subjected to the determination of starch concentration using a chemical method. However, in the process of searching for correlation dependencies between the intensity of photoluminescence and starch content in corn silage, no relationships were identified (Figure 6).
The relationship between photon voltage and starch content in the silage cannot be statistically and reliably approximated due to the fact that the value of R2 < 0.8.
However, for the determination of protein concentration in corn silage, photoluminescence proves to be a promising method, as evidenced by the identified dependencies with R 2   >   0.8 (Figure 7).
The dependence of U(P) can also be statistically significantly approximated using a linear function with a coefficient of determination R2 = 0.8945, where P is the protein content.
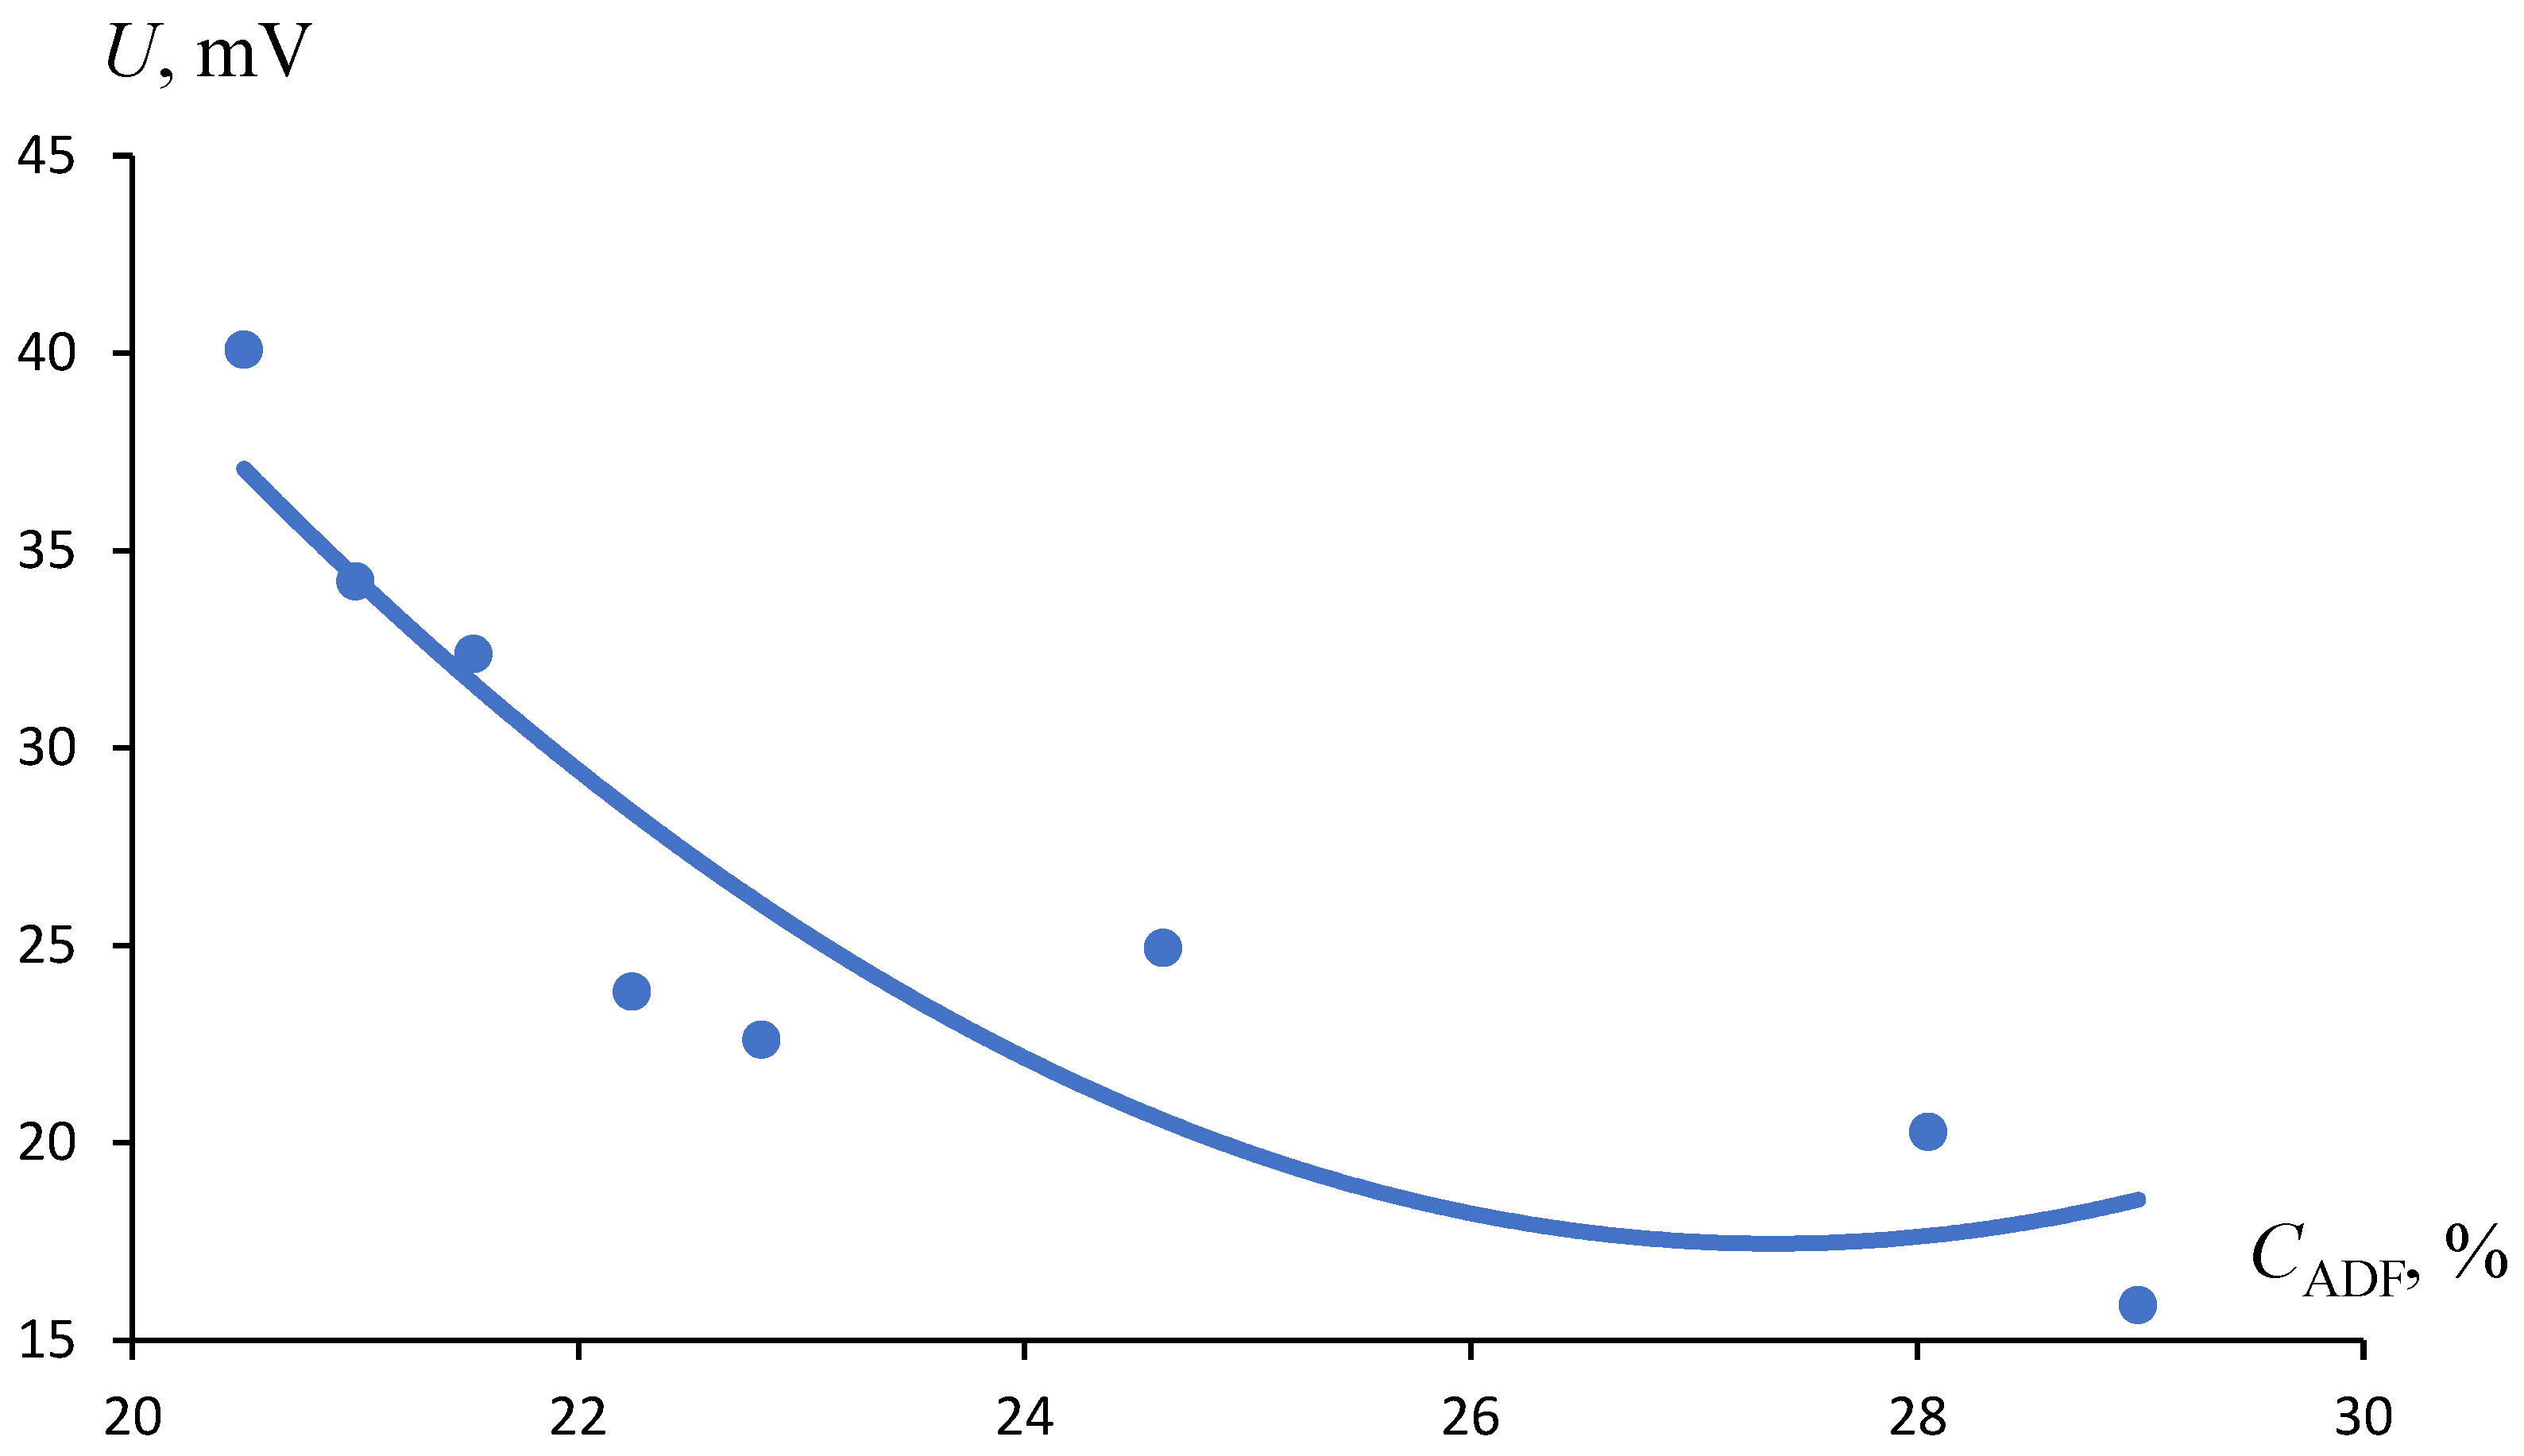
Furthermore, during the course of the research, we investigated the correlation of photoluminescent signals with the content of ADF in corn silage (Figure 8).
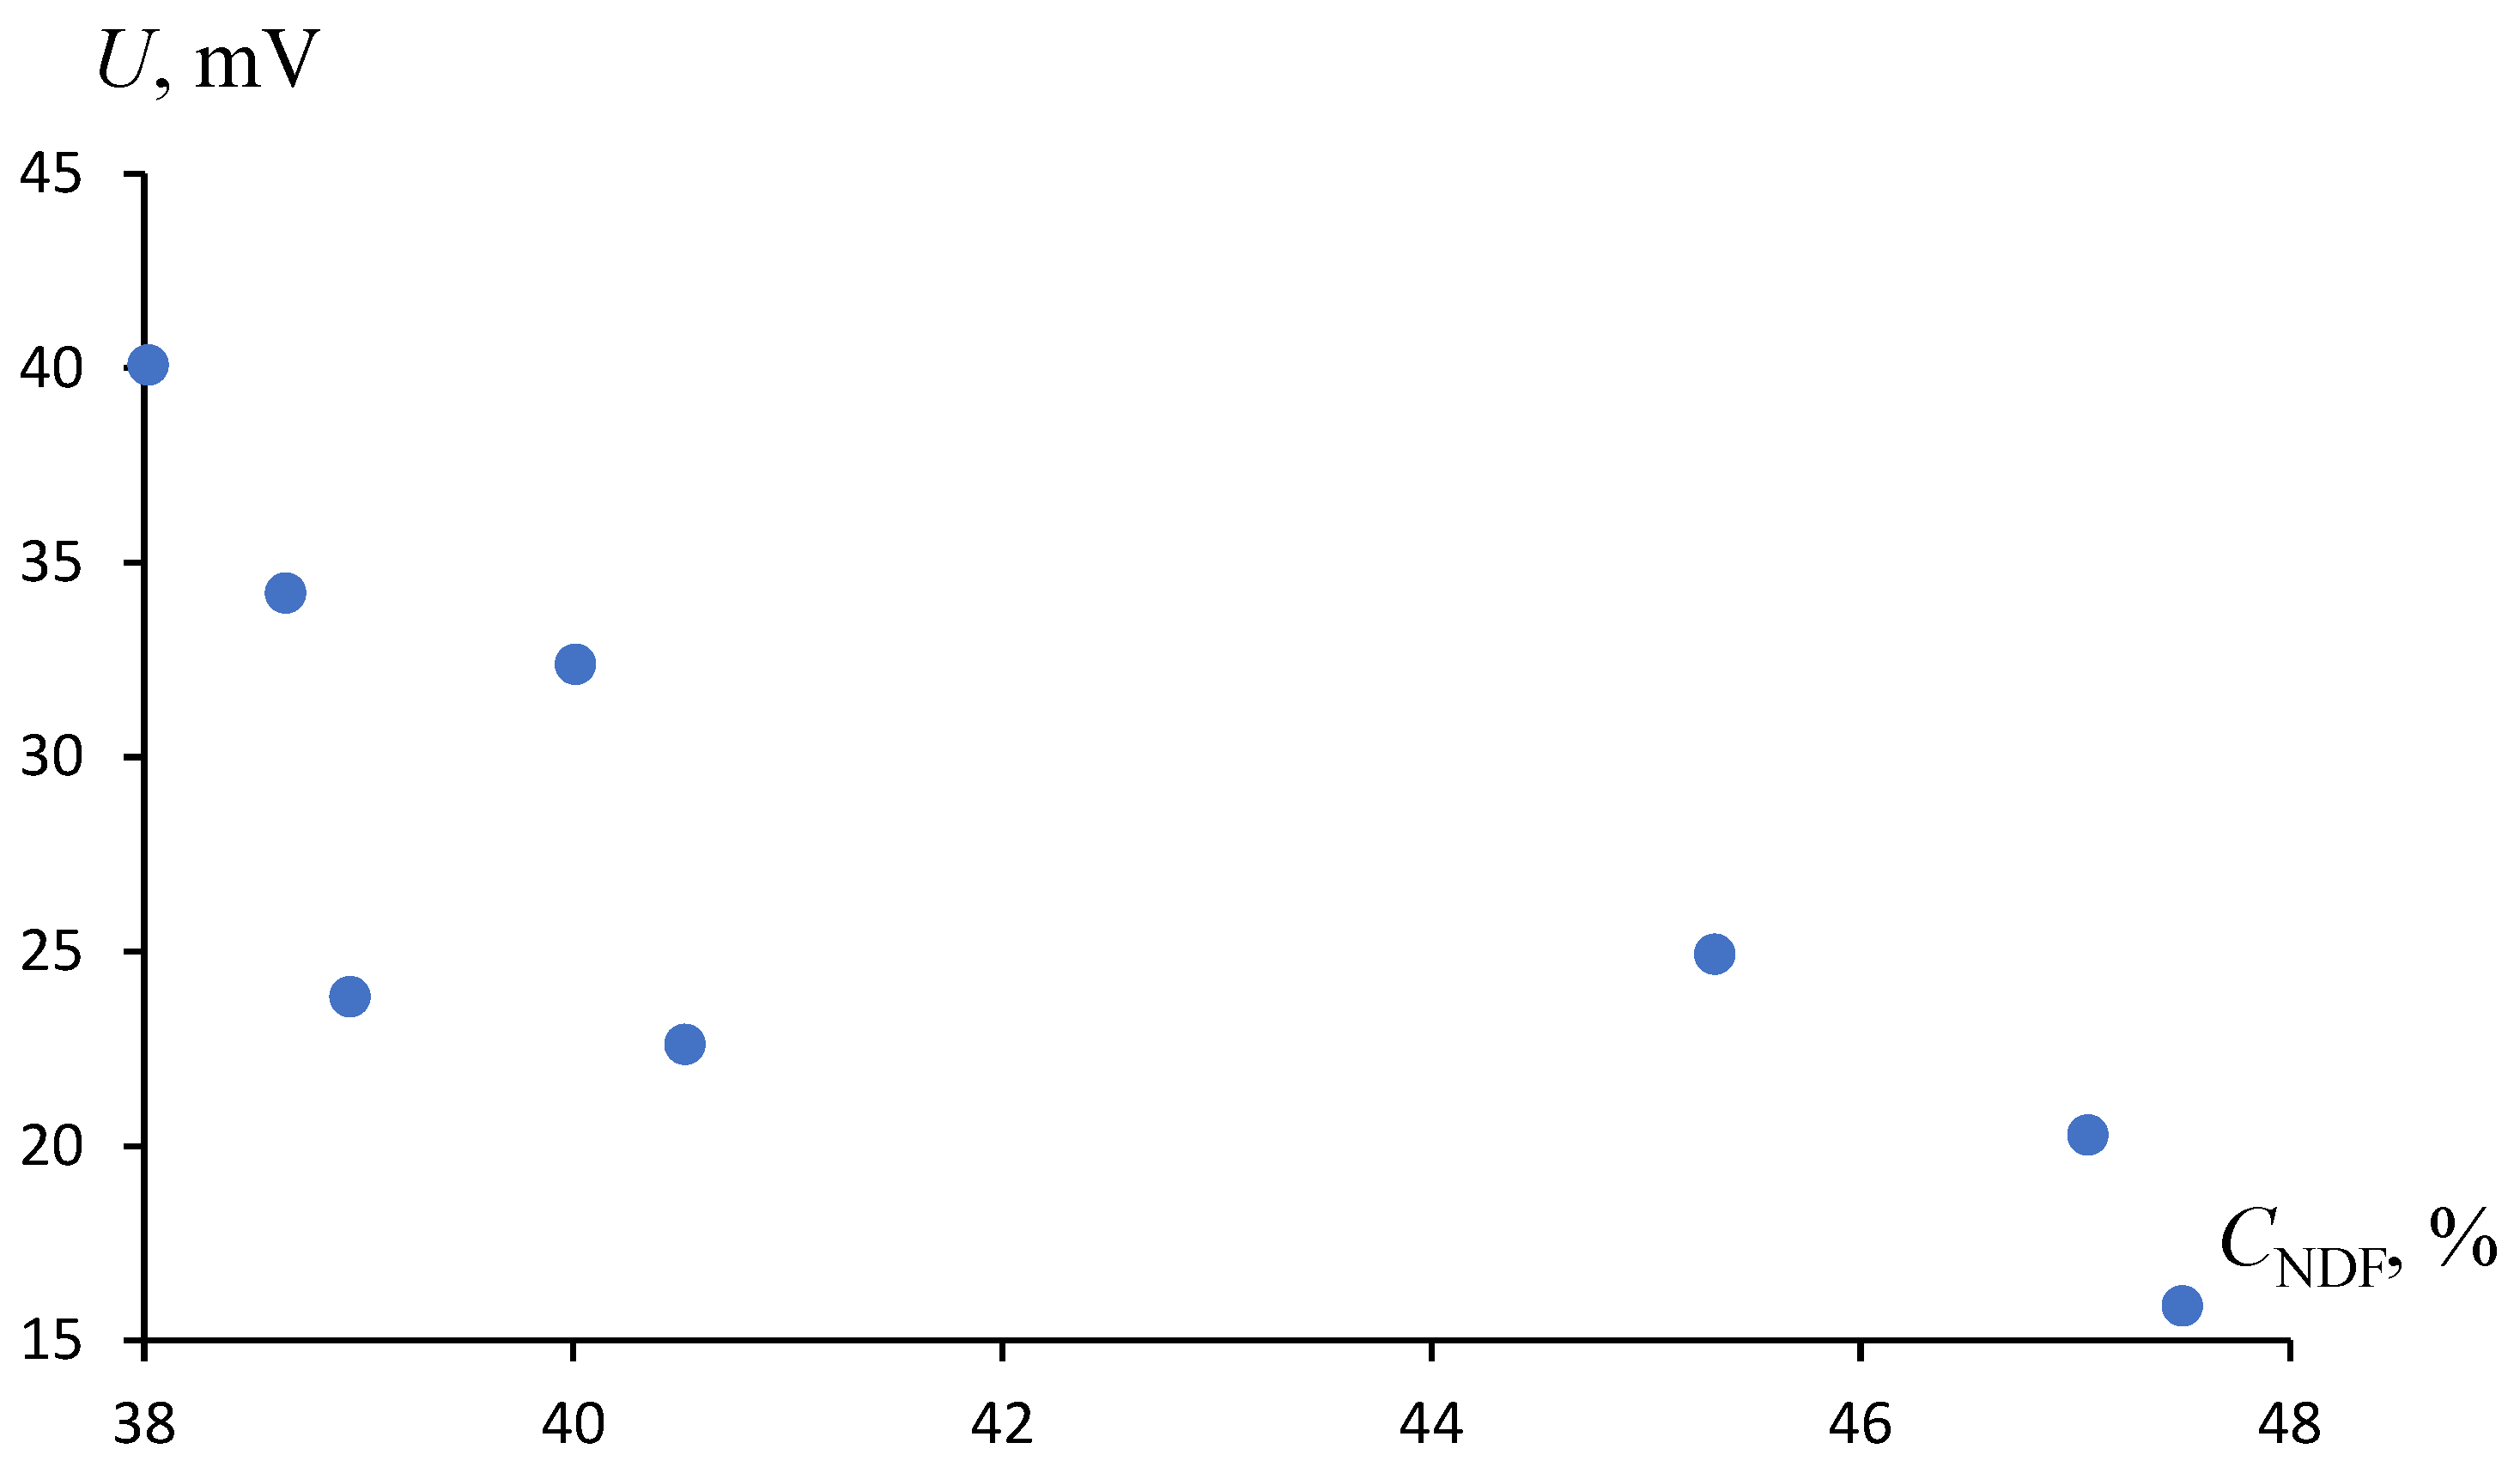
The relationship of U to CADF is statistically significant and is confirmed by the fact that R 2   >   0.8 ; however, the values can only be approximated by a second-order polynomial, as R2 = 0.8346 (Figure 9).
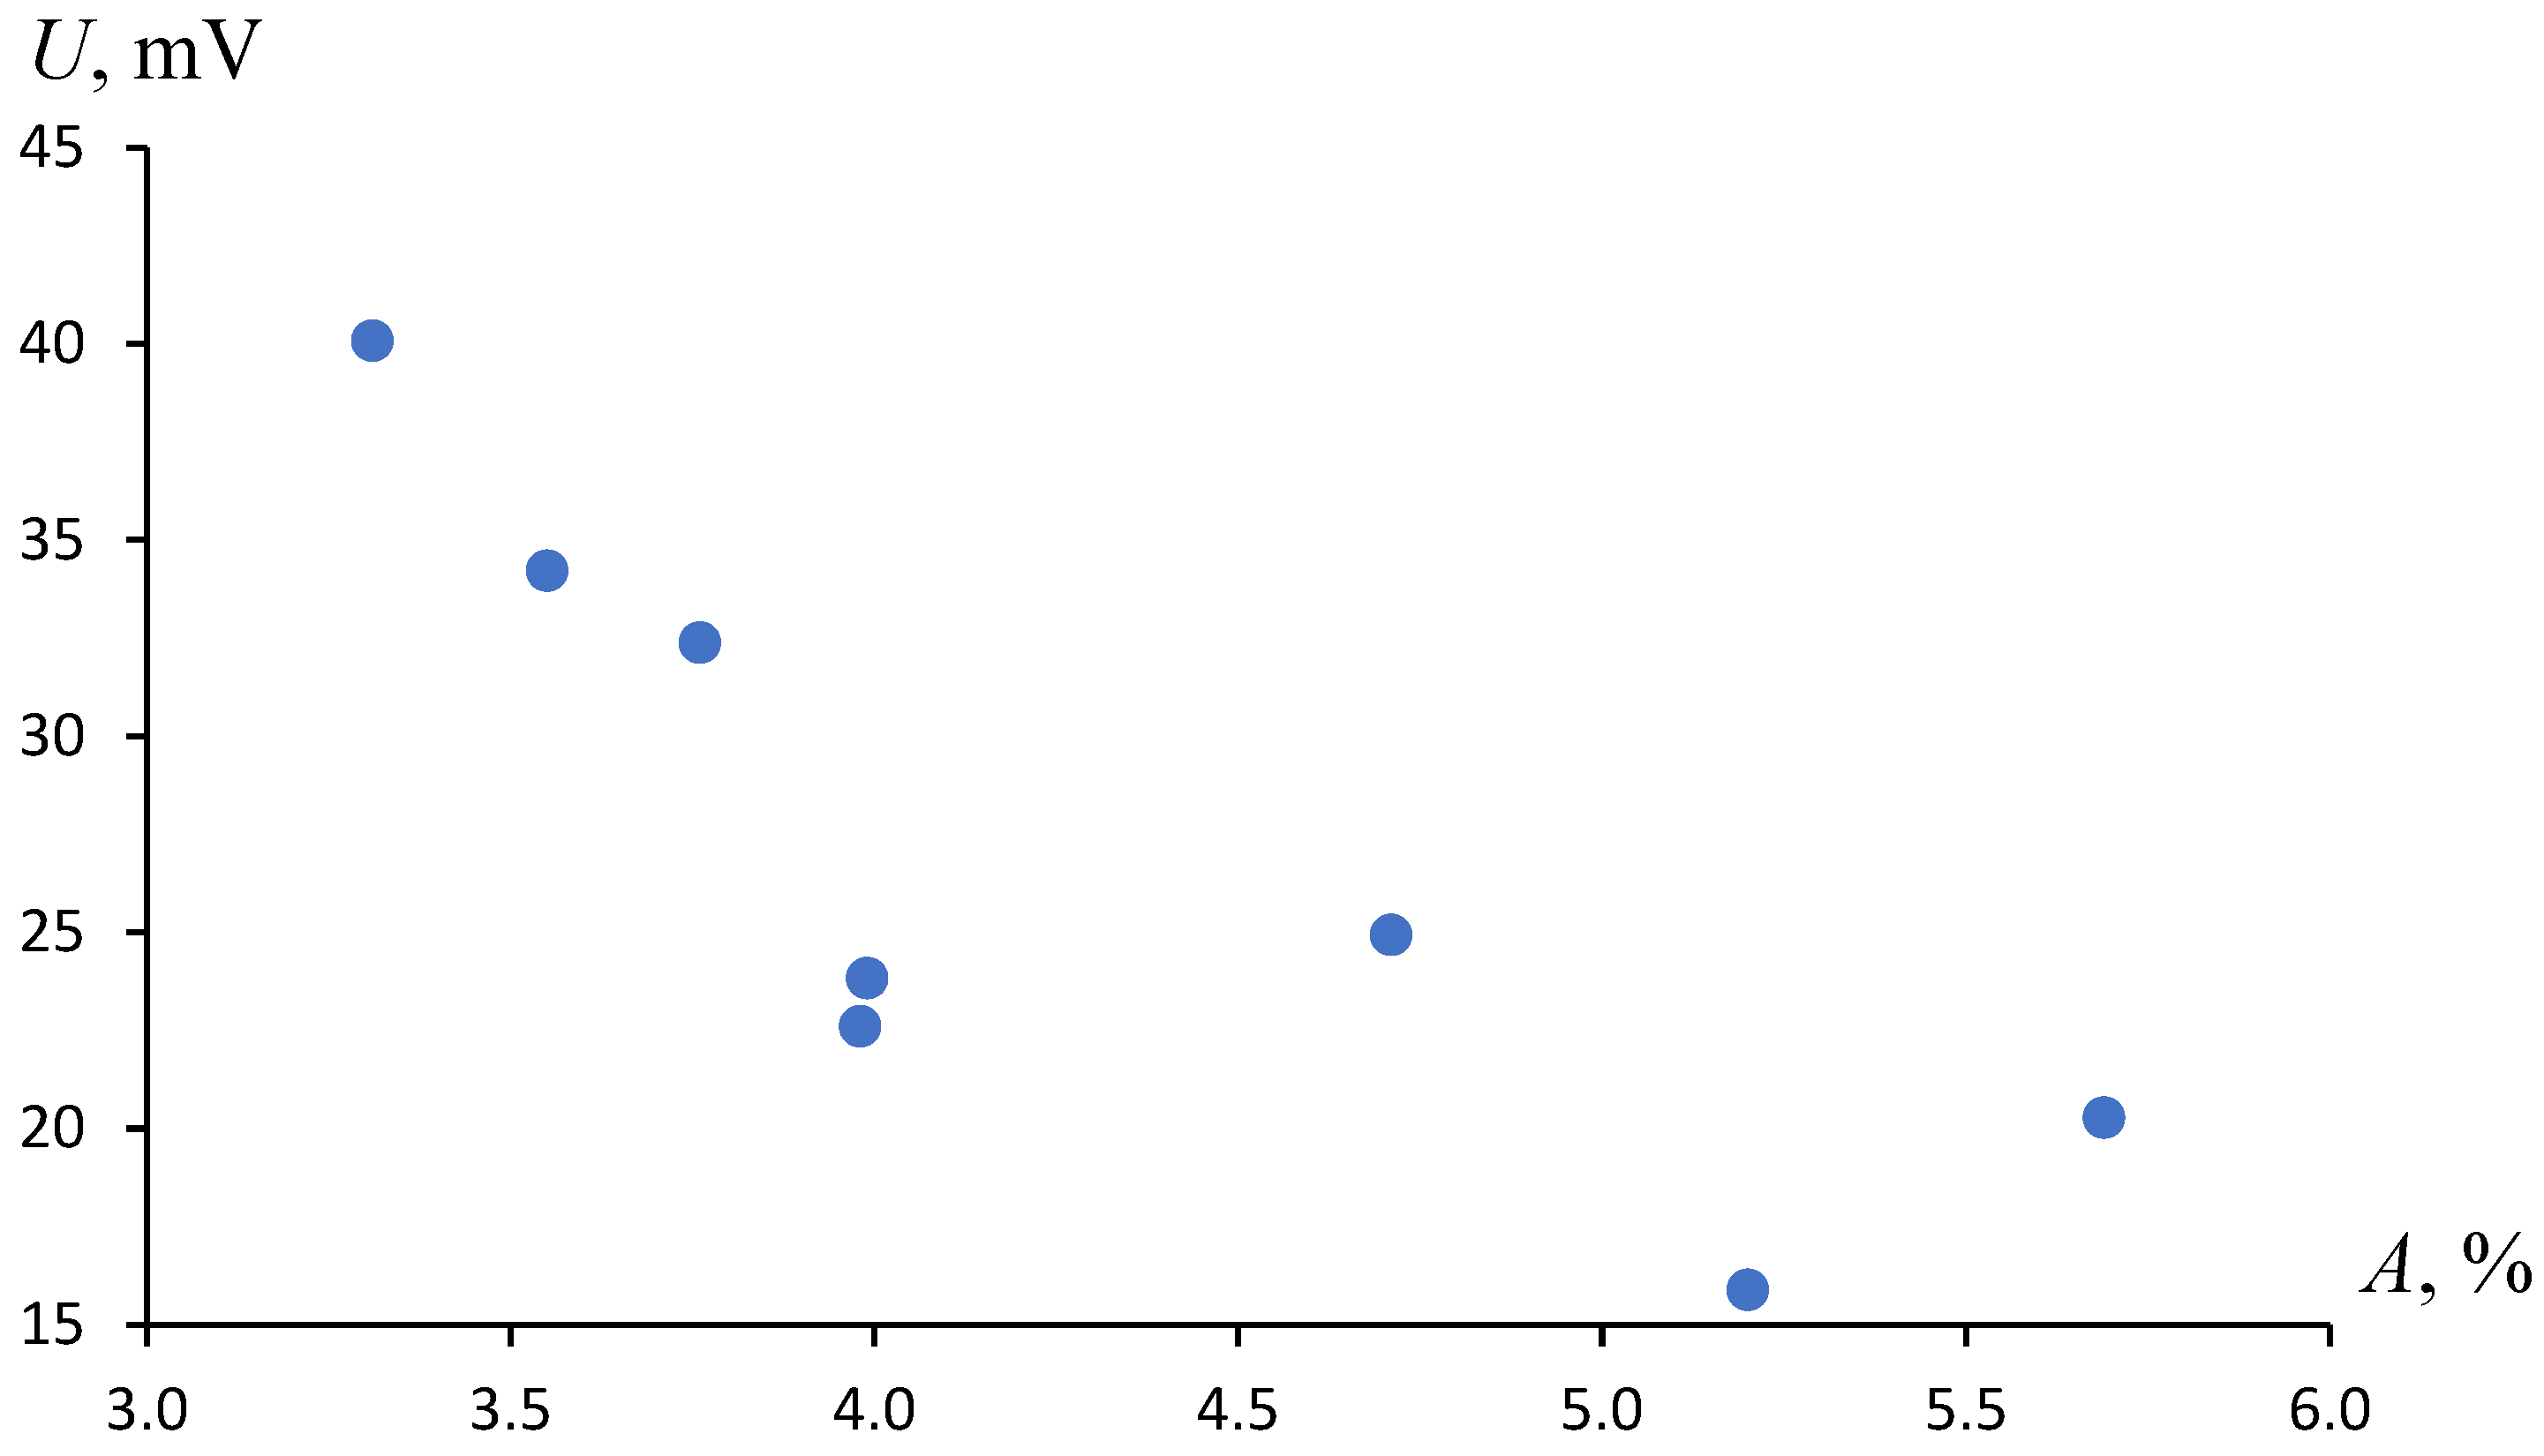
During the laboratory research, we also analyzed the content of ash, taking into account the variation in photon voltage in the corn silage (Figure 10).
As a result of processing the experimental data, the value of R2 < 0.8 indicates the absence of the possibility to statistically and reliably approximate the relationship between the photon voltage and the ash content in corn silage.
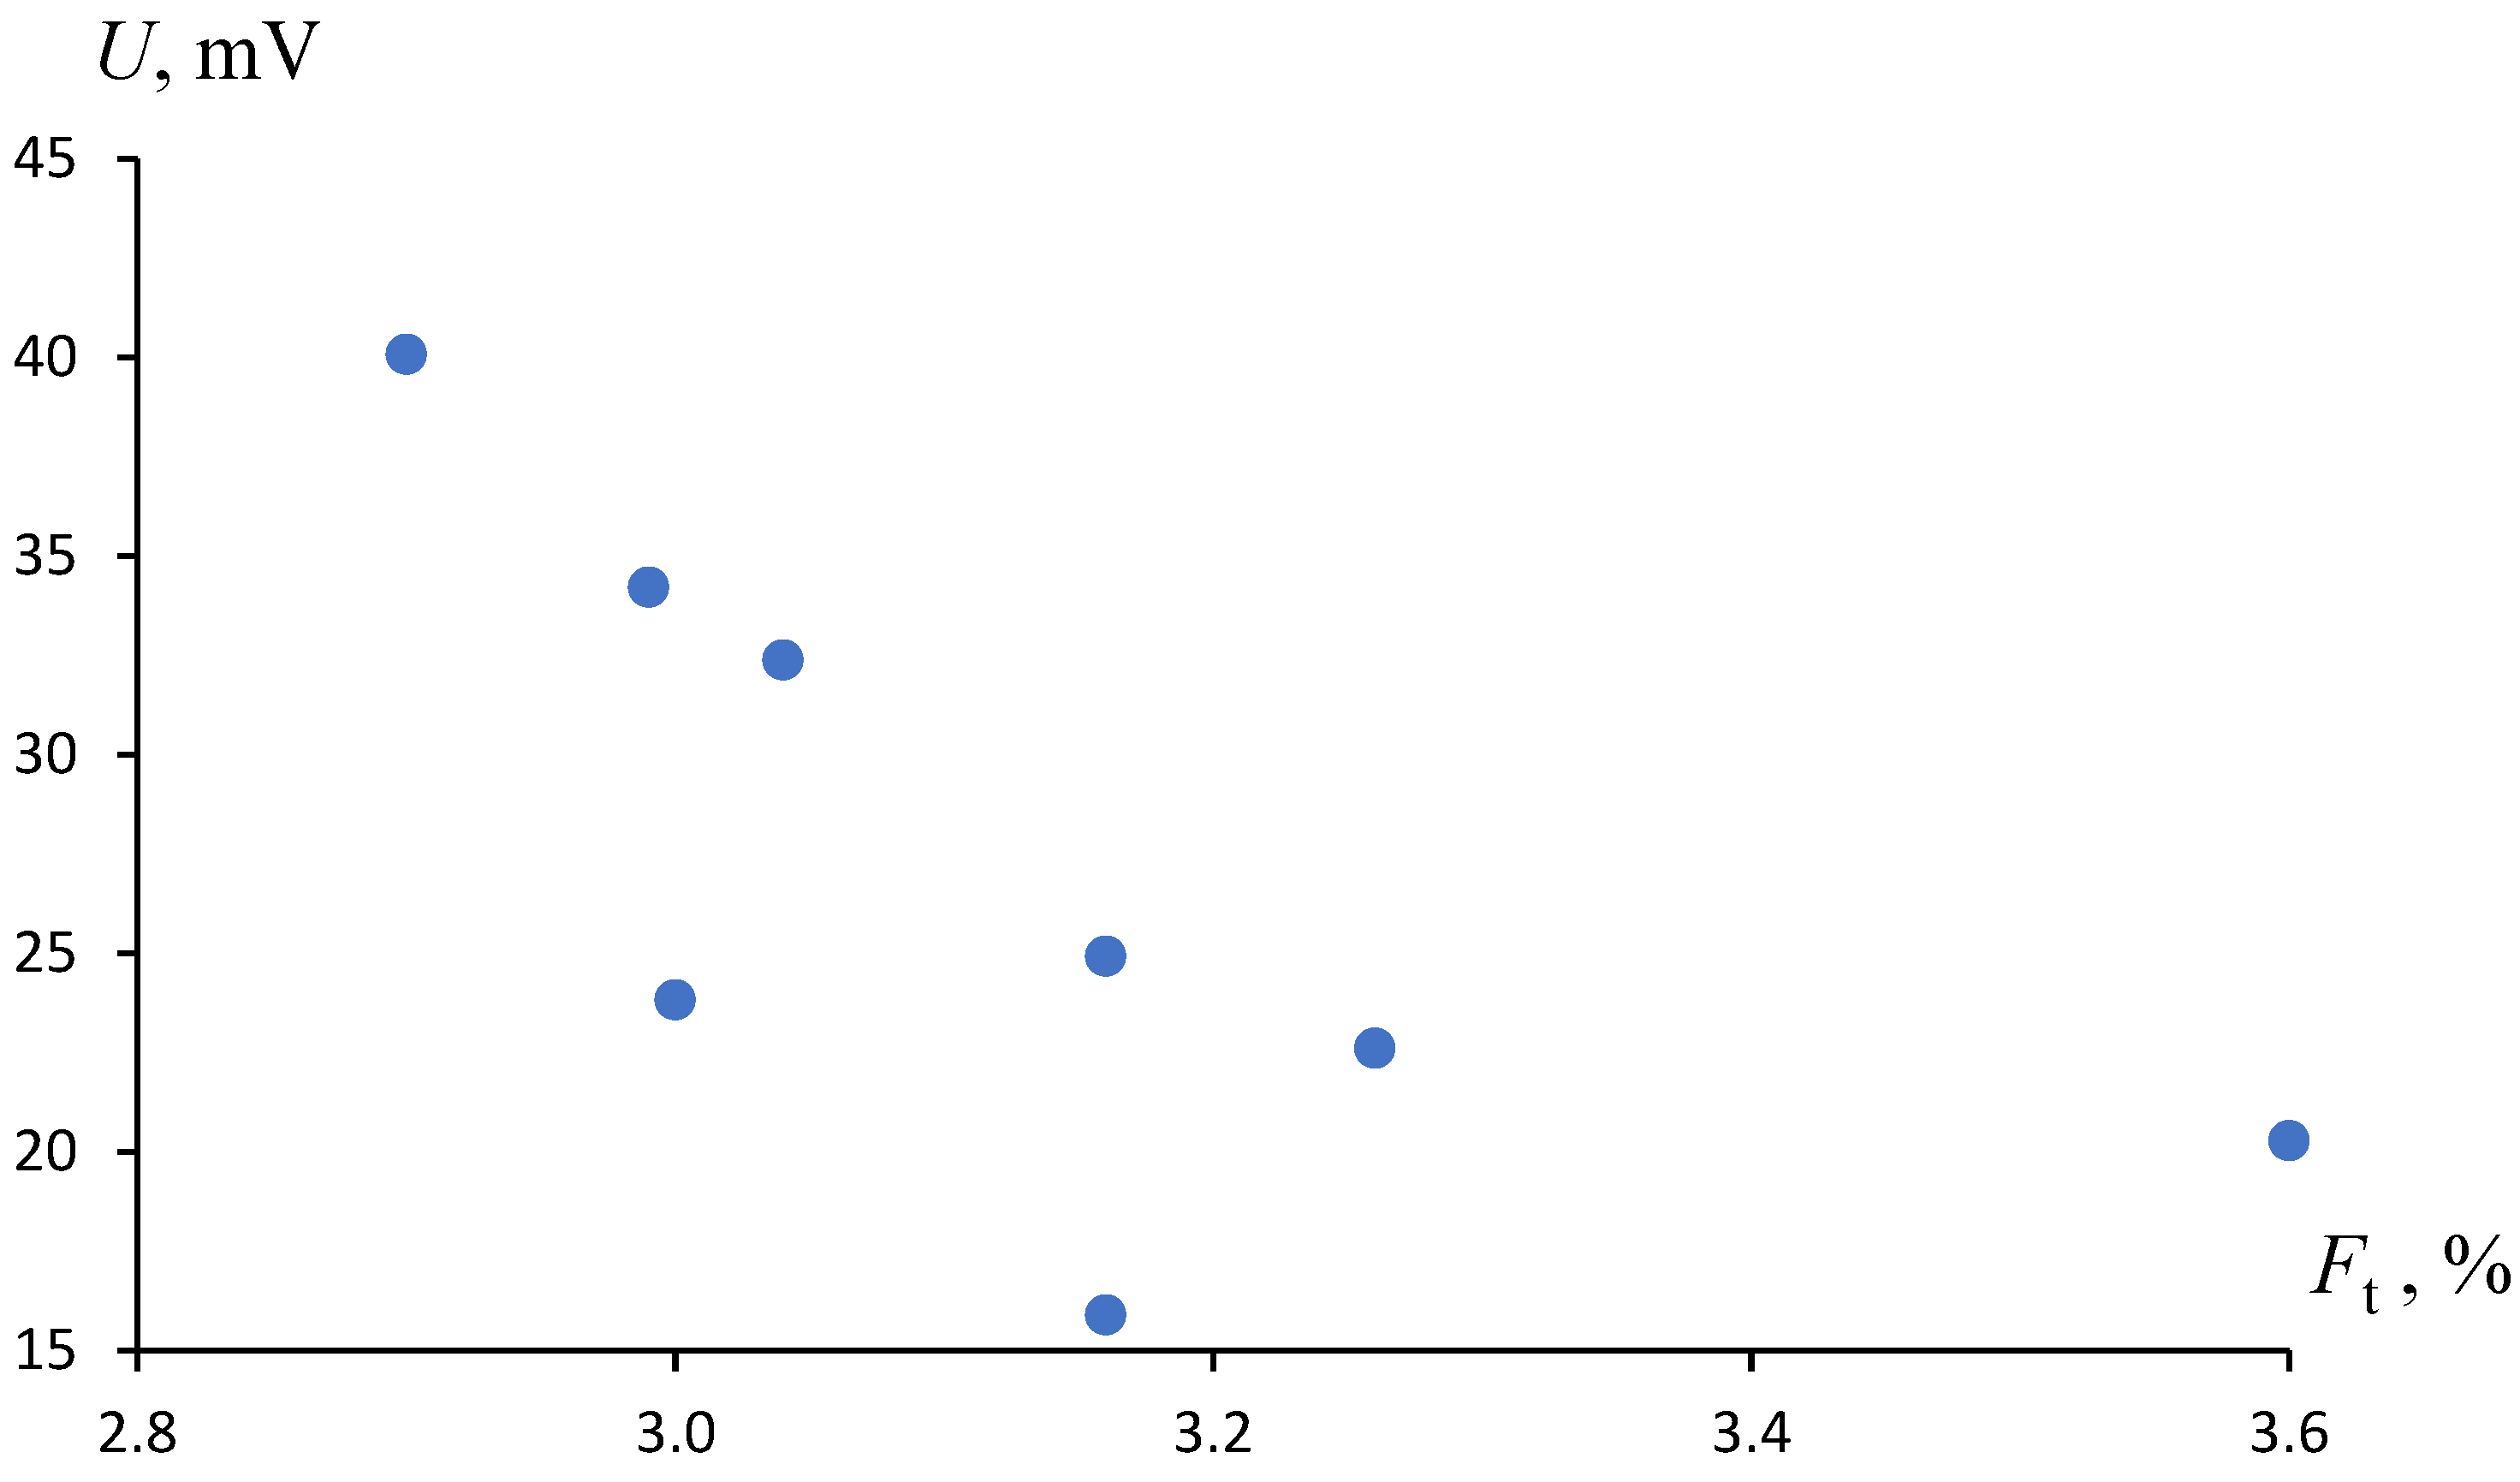
Furthermore, during the literature analysis, sources referring to the potential determination of fat content in various materials were explored. However, concerning the feeding of large ruminants and the formulation of rations, it is crucial to assess the total fat content. Through photoluminescence analysis and statistical data processing, no correlation relationships were detected, as evidenced by the graph (Figure 11).
The relationship between photon voltage and raw fat content in silage cannot be statistically and reliably approximated (R2 < 0.8).
Based on the obtained results for three silage parameters (moisture content, protein content, and ADF content), calibration equations for the developed laboratory instrument can be derived.
For dry matter/moisture content, see Equation (6):
w = 1.22 U + 92.35
For total protein content, see Equation (7):
P t = 0.038 U + 8.11
For ADF content in corn silage, see Equation (8):
C ADF = 0.019 U 2 1.42 U + 46.90

4. Discussion

We previously revealed that the foundation of the automation process and the elimination of human factors in agriculture are typically built upon optical technologies. These technologies enable the automatic positioning of manipulators in milking robots using LiDAR or TOF cameras, measurements of milking intensity in cows using LED sensors, and the assessment of milk quality through the interpretation of color characteristics [20,21,22,23].
Feeding processes are equally important factors that shape the profitability of the industry. For farmers, it is crucial to make quick managerial decisions regarding adjustments to feeding rations or crop harvesting. The proposed solution for the optical express analysis of feed crops, exemplified by corn silage, allows farmers to determine the nutritional value of the feed used in-field conditions without the involvement of specialized laboratories.
In the explored literature and commercial device brochures, the use of NIR analysis methods for the nutritional value of feeds in agriculture is noted. Our presented research contributes to testing the hypothesis of using photoluminescence to determine nutritional value, providing corresponding correlation dependencies of photoluminescence concerning total protein content, moisture, ADF, and other indicators [24,25,26].
A similar spectral method, but based on reflectivity data, was used to detect Fusarium pepper disease [27]. Unfortunately, the creation of a device implementing the method was not reported.
The device proposed in this study, unlike analogs, does not need to analyze the structure of volatile organic compounds [28] and does not require the construction of an image [29,30].
We found that among the existing studies, the most common are manuscripts that reveal the essence of spectroscopy in the near-infrared range (700–1400 nm) as a tool for determining the nutritional value of agricultural feed. At the same time, the essence of the method is to register the reflecting signals associated with the vibrational movements of the molecules of the surface layer of the biomaterial that is being analyzed. Also, the NIR method requires the use of an expensive spectrometer for recording the reflecting signal and hardware with software for processing spectral data.
We proposed a method related to the effect of photoluminescence in the visible range and confirmed our hypothesis with the results of the experimental studies. At the same time, the practical value of photoluminescence as a tool for determining the nutritional value of feed is the low cost of electronic components (diode and photodiode) compared to a spectrometer and a light source for implementing this task in the near-infrared range.

5. Conclusions

  • To measure the nutritional value of corn silage, it is advisable to use excitation via radiation with a wavelength of about 362 nm. At the same time, the luminescent radiation flux must be measured in the range of 440–620 nm.
  • Based on the preliminary measurements, a component base was selected for the original photoluminescence device, where the photodiodes and light-emitting diodes were tuned to the indicative photoluminescence range of corn silage.
  • Through the development and fabrication of an experimental photoluminescence device, measurements of corn silage were performed to determine its dry matter content, total protein content, ash, ADF, and NDF using the physical method of photoluminescence. Dependencies were identified that allowed for the assertion that photoluminescence can be used to determine the dry matter content/moisture, total protein content, and ADF content in corn silage. These results are supported by statistically significant indicators (R2 < 0.8) that can be approximated.
  • In order to conduct further research and improve the results, we plan to modernize the laboratory sample of the device, which will allow for measuring nutritional values with greater reliability in narrow ranges of visible radiation.

6. Patents

  • Patent No. RU 2775170 C1, IPC G06T 7/60, G06T 7/90, A01K 5/02. A system for assessing the quality of animal feed/Pavkin D.Y. Nikitin E.A. Kiryushin I.A./Patent holder: Federal Scientific Agroengineering Center VIM. Application: 2021129058, dated 5 October 2021.
  • Patent No. RU 2781751 C1, IPC G01N 21/25. Portable spectral meter of feed quality indicators/Pavkin D.Y. Lednev V.N. Nikitin E.A. Pershin S.M. Grishin M.Y. Sdvighenskiy P.A./Patent holder: Federal Scientific Agroengineering Center VIM. Application: 2021129056, dated 5 October 2021.
  • Patent No. RU 2021663154, Program for automated recognition of feed mixture components for farm animals/Pavkin D.Y. Kiryushin I.A. Nikitin E.A. Vladimirov F.E. Yurochka S.S./Patent holder: Federal Scientific Agroengineering Center VIM. Application: 2021662352, dated 9 August 2021.

Author Contributions

Conceptualization, M.V.B.; methodology, E.A.N.; software, I.Y.E.; validation, D.Y.P. and I.A.G.; formal analysis, D.Y.P.; investigation, E.A.N.; resources, D.Y.P. and E.A.N.; data curation, I.A.G. and I.Y.E.; writing—original draft preparation, M.V.B. and E.A.N.; writing—review and editing, E.A.N. and M.V.B.; visualization, I.Y.E.; supervision, D.Y.P.; project administration, E.A.N.; funding acquisition, D.Y.P. All authors have read and agreed to the published version of the manuscript.

Funding

This work was supported by a grant from the Ministry of Science and Higher Education of the Russian Federation for large scientific projects in priority areas of scientific and technological development (grant number 075-15-2020-774).

Institutional Review Board Statement

The animal study protocol was approved by the Ethics Committee of Federal Scientific Agroengineering Center VIM (protocol code 321 and date of approval 15 July 2022) for studies involving animals.

Data Availability Statement

The data presented in this study are available on request from the corresponding author. The data are not publicly available due to the terms of the contract under which the study was funded.

Conflicts of Interest

The authors declare no conflict of interest.

References

  1. Pavkin, D.Y.; Nikitin, E.A.; Shilin, D.V.; Belyakov, M.V.; Golyshkov, I.A.; Mikhailichenko, S.; Chepurina, E. Development Results of a Cross-Platform Positioning System for a Robotics Feed System at a Dairy Cattle Complex. Agriculture 2023, 13, 1422. [Google Scholar] [CrossRef]
  2. Belyakov, M.V. Photoluminescent Sensor of Scarification Efficiency of Fodder Plants’ Seeds. Sensors 2023, 23, 106. [Google Scholar] [CrossRef]
  3. Nikitin, E.A.; Pavkin, D.Y.; Izmailov, A.Y.; Aksenov, A.G. Assessing the homogeneity of forage mixtures using an RGB camera as exemplified by cattle rations. Appl. Sci. 2022, 12, 3230. [Google Scholar] [CrossRef]
  4. Belyakov, M.V.; Pavkin, D.Y.; Nikitin, E.A.; Efremenkov, I.Y. Substantiation of the choice of spectral ranges of photoluminescent control of the composition and nutritional value of feed. Mach. Equip. Rural. Area 2023, 2, 31–36. [Google Scholar] [CrossRef]
  5. Belyakov, M.V.; Nikitin, E.A.; Efremenkov, I.Y. Efficiency of the Photoluminescent Method for Monitoring the Homogeneity of Feed Mixtures in Animal Husbandry. Agric. Mach. Technol. 2022, 16, 55–61. [Google Scholar] [CrossRef]
  6. Buelvas, R.M.; Adamchuk, V.I.; Leksono, E.; Tikasz, P.; Lefsrud, M.; Holoszkiewicz, J. Biomass estimation from canopy measurements for leafy vegetables based on ultrasonic and laser sensors. Comput. Electron. Agric. 2019, 164, 104896. [Google Scholar] [CrossRef]
  7. Giménez-Gallego, J.; González-Teruel, J.D.; Soto-Valles, F.; Jiménez-Buendía, M.; Navarro-Hellín, H.; Torres-Sánchez, R. Intelligent thermal image-based sensor for affordable measurement of crop canopy temperature. Comput. Electron. Agric. 2021, 188, 106319. [Google Scholar] [CrossRef]
  8. Michelucci, U.; Venturini, F. Multi-Task Learning for Multi-Dimensional Regression: Application to Luminescence Sensing. Appl. Sci. 2019, 9, 4748. [Google Scholar] [CrossRef]
  9. Qin, Y.; Li, J.; Kuang, J.; Shen, S.; Zhou, X.; Zhao, X.; Huang, B.; Han, B. Okadaic Acid Detection through a Rapid and Sensitive Amplified Luminescent Proximity Homogeneous Assay. Toxins 2023, 15, 501. [Google Scholar] [CrossRef]
  10. Chaikov, L.L.; Kirichenko, M.N.; Krivokhizha, S.V.; Kupov, M.R.; Lobanov, A.N.; Sverbil, P.P.; Nagaev, E.I.; Shkirin, A.V. Two Convenient Methods for Detection of Non-Dairy Fats in Butter by Dynamic Light Scattering and Luminescence Spectroscopy. Appl. Sci. 2023, 13, 8563. [Google Scholar] [CrossRef]
  11. Yuan, H.; Li, Y.; Lv, J.; An, Y.; Guan, D.; Liu, J.; Tu, C.; Wang, X.; Zhou, H. Recent Advances in Fluorescent Nanoprobes for Food Safety Detection. Molecules 2023, 28, 5604. [Google Scholar] [CrossRef] [PubMed]
  12. Iyer, S.N.; Behary, N.; Nierstrasz, V. Study of photoluminescence property on cellulosic fabric using multifunctional biomaterials riboflavin and its derivative Flavin mononucleotide. Sci. Rep. 2019, 9, 8696. [Google Scholar] [CrossRef] [PubMed]
  13. Liu, S.; Liu, C.; Ren, Y.; Kuang, S.; Zhou, C.; Cai, H.; Yao, Z. Fluorescence spectra of nutrients in chicken and skin under baking conditions. Optik 2020, 218, 164795. [Google Scholar] [CrossRef]
  14. Katsumata, T.; Aizawa, H.; Komuro, S.; Ito, S.; Matsumoto, T. Evaluation of photoluminescence from milk with various vitamin B2 concentrations. Int. Dairy J. 2020, 109, 104744. [Google Scholar] [CrossRef]
  15. Kim, S.-B.; Kamiya, G.; Furuta, T.; Kitada, N.; Maki, S.A. Coelenterazine Indicators for the Specific Imaging of Human and Bovine Serum Albumins. Sensors 2023, 23, 6020. [Google Scholar] [CrossRef] [PubMed]
  16. Moskovsky, M.N.; Shogenov, Y.H.; Lavrov, A.V.; Gulyaev, A.A.; Efremenkov, I.Y.; Pyatchenkov, D.S.; Belyakov, M.V. Spectral Photoluminescent Parameters of Barley Seeds (Hordéum vulgáre) Infected with Fusarium ssp. Photochem. Photobiol. 2023, 99, 29–34. [Google Scholar] [CrossRef]
  17. Xu, H.Y.; Jiang, G.Y.; Yu, M.; Luo, T. A Color Image Watermarking Based on Tensor Analysis. IEEE Access 2018, 6, 51500–51514. [Google Scholar] [CrossRef]
  18. Sun, X.; Zhao, L. RGB Pixel Brightness Characteristics of Linked Color Imaging in Early Gastric Cancer: A Pilot Study. Gastroenterol. Res. Pract. 2020, 2020, 2105874. [Google Scholar] [CrossRef]
  19. Lukac, R.; Plataniotis, K.N. Color filter arrays: Design and performance analysis. IEEE Trans. Consum. Electron. 2005, 51, 1260–1267. [Google Scholar] [CrossRef]
  20. Burmistrov, D.E.; Ignatenko, D.N.; Lednev, V.N.; Gudkov, S.V.; Pavkin, D.Y.; Khakimov, A.R.; Nikitin, E.A.; Lobachevsky, Y.P.; Zvyagin, A.V. Application of optical quality control technologies in the dairy industry: An overview. Photonics 2021, 8, 551. [Google Scholar] [CrossRef]
  21. Halachmi, I.; Ben Meir, Y.; Miron, J.; Maltz, E. Feeding behavior improves prediction of dairy cow voluntary feed intake but cannot serve as the sole indicator. Animal 2016, 10, 1501–1506. [Google Scholar] [CrossRef] [PubMed]
  22. Ding, K.; Xiao, L.; Weng, G. Active contours driven by region-scalable fitting and optimized Laplacian of Gaussian energy for image segmentation. Signal Process. 2017, 134, 224–233. [Google Scholar] [CrossRef]
  23. Jin, R.; Weng, G. Active contours driven by adaptive functions and fuzzy c-means energy for fast image segmentation. Signal Process. 2019, 163, 1–10. [Google Scholar] [CrossRef]
  24. Sun, H.; Xing, Z.Z.; Zhang, Z.Y.; Ma, X.Y.; Long, Y.W.; Liu, N.; Li, M.Z. Visualization Analysis of Crop Spectral Index Based on RGB-NIR Image Matching. Spectrosc. Spectr. Anal. 2019, 39, 3493–3500. [Google Scholar] [CrossRef]
  25. Manokhina, A.A.; Dorokhov, A.S.; Kobozeva, T.P.; Fomina, T.N.; Starovoitov, V.I. Jerusalem Artichoke as a Strategic Crop for Solving Food Problems. Agronomy 2022, 12, 465. [Google Scholar] [CrossRef]
  26. Alshehawy, A.M.; Mansour, D.-E.A.; Ghali, M.; Lehtonen, M.; Darwish, M.M.F. Photoluminescence Spectroscopy Measurements for Effective Condition Assessment of Transformer Insulating Oil. Processes 2021, 9, 732. [Google Scholar] [CrossRef]
  27. Karadağ, K.; Tenekeci, M.E.; Taşaltın, R.; Bilgili, A. Detection of pepper fusarium disease using machine learning algorithms based on spectral reflectance. Sustain. Comput. Inform. Syst. 2020, 28, 100299. [Google Scholar] [CrossRef]
  28. Sanjay, M.; Kalpana, B. Early Mass Diagnosis of Fusarium Wilt in Banana Cultivations using an E-Nose Integrated Autonomous Rover System. Int. J. Appl. Sci. Biotechnol. 2017, 5, 261–266. [Google Scholar] [CrossRef]
  29. Zhang, D.; Wang, D.; Du, S.; Huang, L.; Zhao, H.; Liang, D.; Gu, C.; Yang, X. A Rapidly Diagnosis and Application System of Fusarium Head Blight Based on Smartphone. In Proceedings of the 8th International Conference on Agro-Geoinformatics (Agro-Geoinformatics), Istanbul, Turkey, 16–19 July 2019; pp. 1–5. [Google Scholar] [CrossRef]
  30. Zhang, D.; Wang, Z.; Jin, N.; Gu, C.; Chen, Y.; Huang, Y. Evaluation of Efficacy of Fungicides for Control of Wheat Fusarium Head Blight Based on Digital Imaging. IEEE Access 2020, 8, 109876–109890. [Google Scholar] [CrossRef]
Figure 1. Spectrofluorimeter CM 2203 for determining the indicative ranges of photoluminescence in agricultural feed.
Applsci 13 10444 g001
Figure 2. Portable optical device for determining the nutritional value of corn silage through photoluminescence. 1—feed bed, 2—display, 3—interface control unit, 4—console, 5—photodiodes, 6—light-emitting diode, 7—adjusting screw.
Applsci 13 10444 g002
Figure 3. Algorithm for determining nutritional value indicators using an optical device.
Applsci 13 10444 g003
Figure 4. Spectral characteristic of silo excitation.
Applsci 13 10444 g004
Figure 5. Dependence of photon voltage on silage moisture and its linear approximation.
Applsci 13 10444 g005
Figure 6. Dependence of photon voltage on starch content in corn silage and its linear approximation.
Applsci 13 10444 g006
Figure 7. The dependence of the photon voltage on the protein content in the silo and its linear approximation.
Applsci 13 10444 g007
Figure 8. The dependence of the photon voltage on the ADF content in the silo and its approximation using a second-order polynomial.
Applsci 13 10444 g008
Figure 9. Dependence of the photon voltage of corn silage on the NDF content.
Applsci 13 10444 g009
Figure 10. Dependence of photon voltage on the ash content in corn silage.
Applsci 13 10444 g010
Figure 11. Dependence of the photon voltage on the total fat content in the corn silo.
Applsci 13 10444 g011
Table 1. Photo of the voltage and parameters of the silo at different humidities.
U, mV20.2715.8824.9322.6123.8332.3834.2140.08
Humidity w, %74.2271.5966.0260.0159.0854.0747.2744.98
Starch C, %27.4127.2128.7834.533.6633.8134.735.1
Protein Pt, %7.357.617.237.047.246.786.806.67
ADF CADF, %28.0528.9924.6222.8222.2421.5321.0020.50
NDF CNDF, %47.0647.5045.3240.5238.9640.0138.6638.02
Ash A, %5.695.204.713.983.993.763.553.31
Raw fat Ft, %3.603.163.163.263.003.042.992.90
Disclaimer/Publisher’s Note: The statements, opinions and data contained in all publications are solely those of the individual author(s) and contributor(s) and not of MDPI and/or the editor(s). MDPI and/or the editor(s) disclaim responsibility for any injury to people or property resulting from any ideas, methods, instructions or products referred to in the content.