
Research on Students’ Action Behavior Recognition Method Based on Classroom Time-Series Images


Abstract
:1. Introduction
- We propose an action behavior detection model based on an improved AIA network [11]. The Multi-scale Temporal Attention (MsTA) module and Multi-scale Channel Spatial Attention (MsCSA) module are added to the video backbone network SlowFast, which improves the accuracy of students’ action recognition.
- The EFL function [12] was introduced to dynamically adjust the categorization loss weights of different categories to improve the category imbalance problem existing in the dataset.
- Experiments are conducted on a self-made student action behavior dataset. The experimental results show that the algorithm proposed in this paper improves the mean average precision (mAP) value of action behavior detection. Based on the results of action behavior recognition, the student’s seat number is used as the index to analyze the sequence of students’ action behavior during the teaching time of knowledge points.
2. Related Work
2.1. Video Behavior Recognition
2.2. Behavior Recognition in Classroom Scenarios
3. Proposed Method
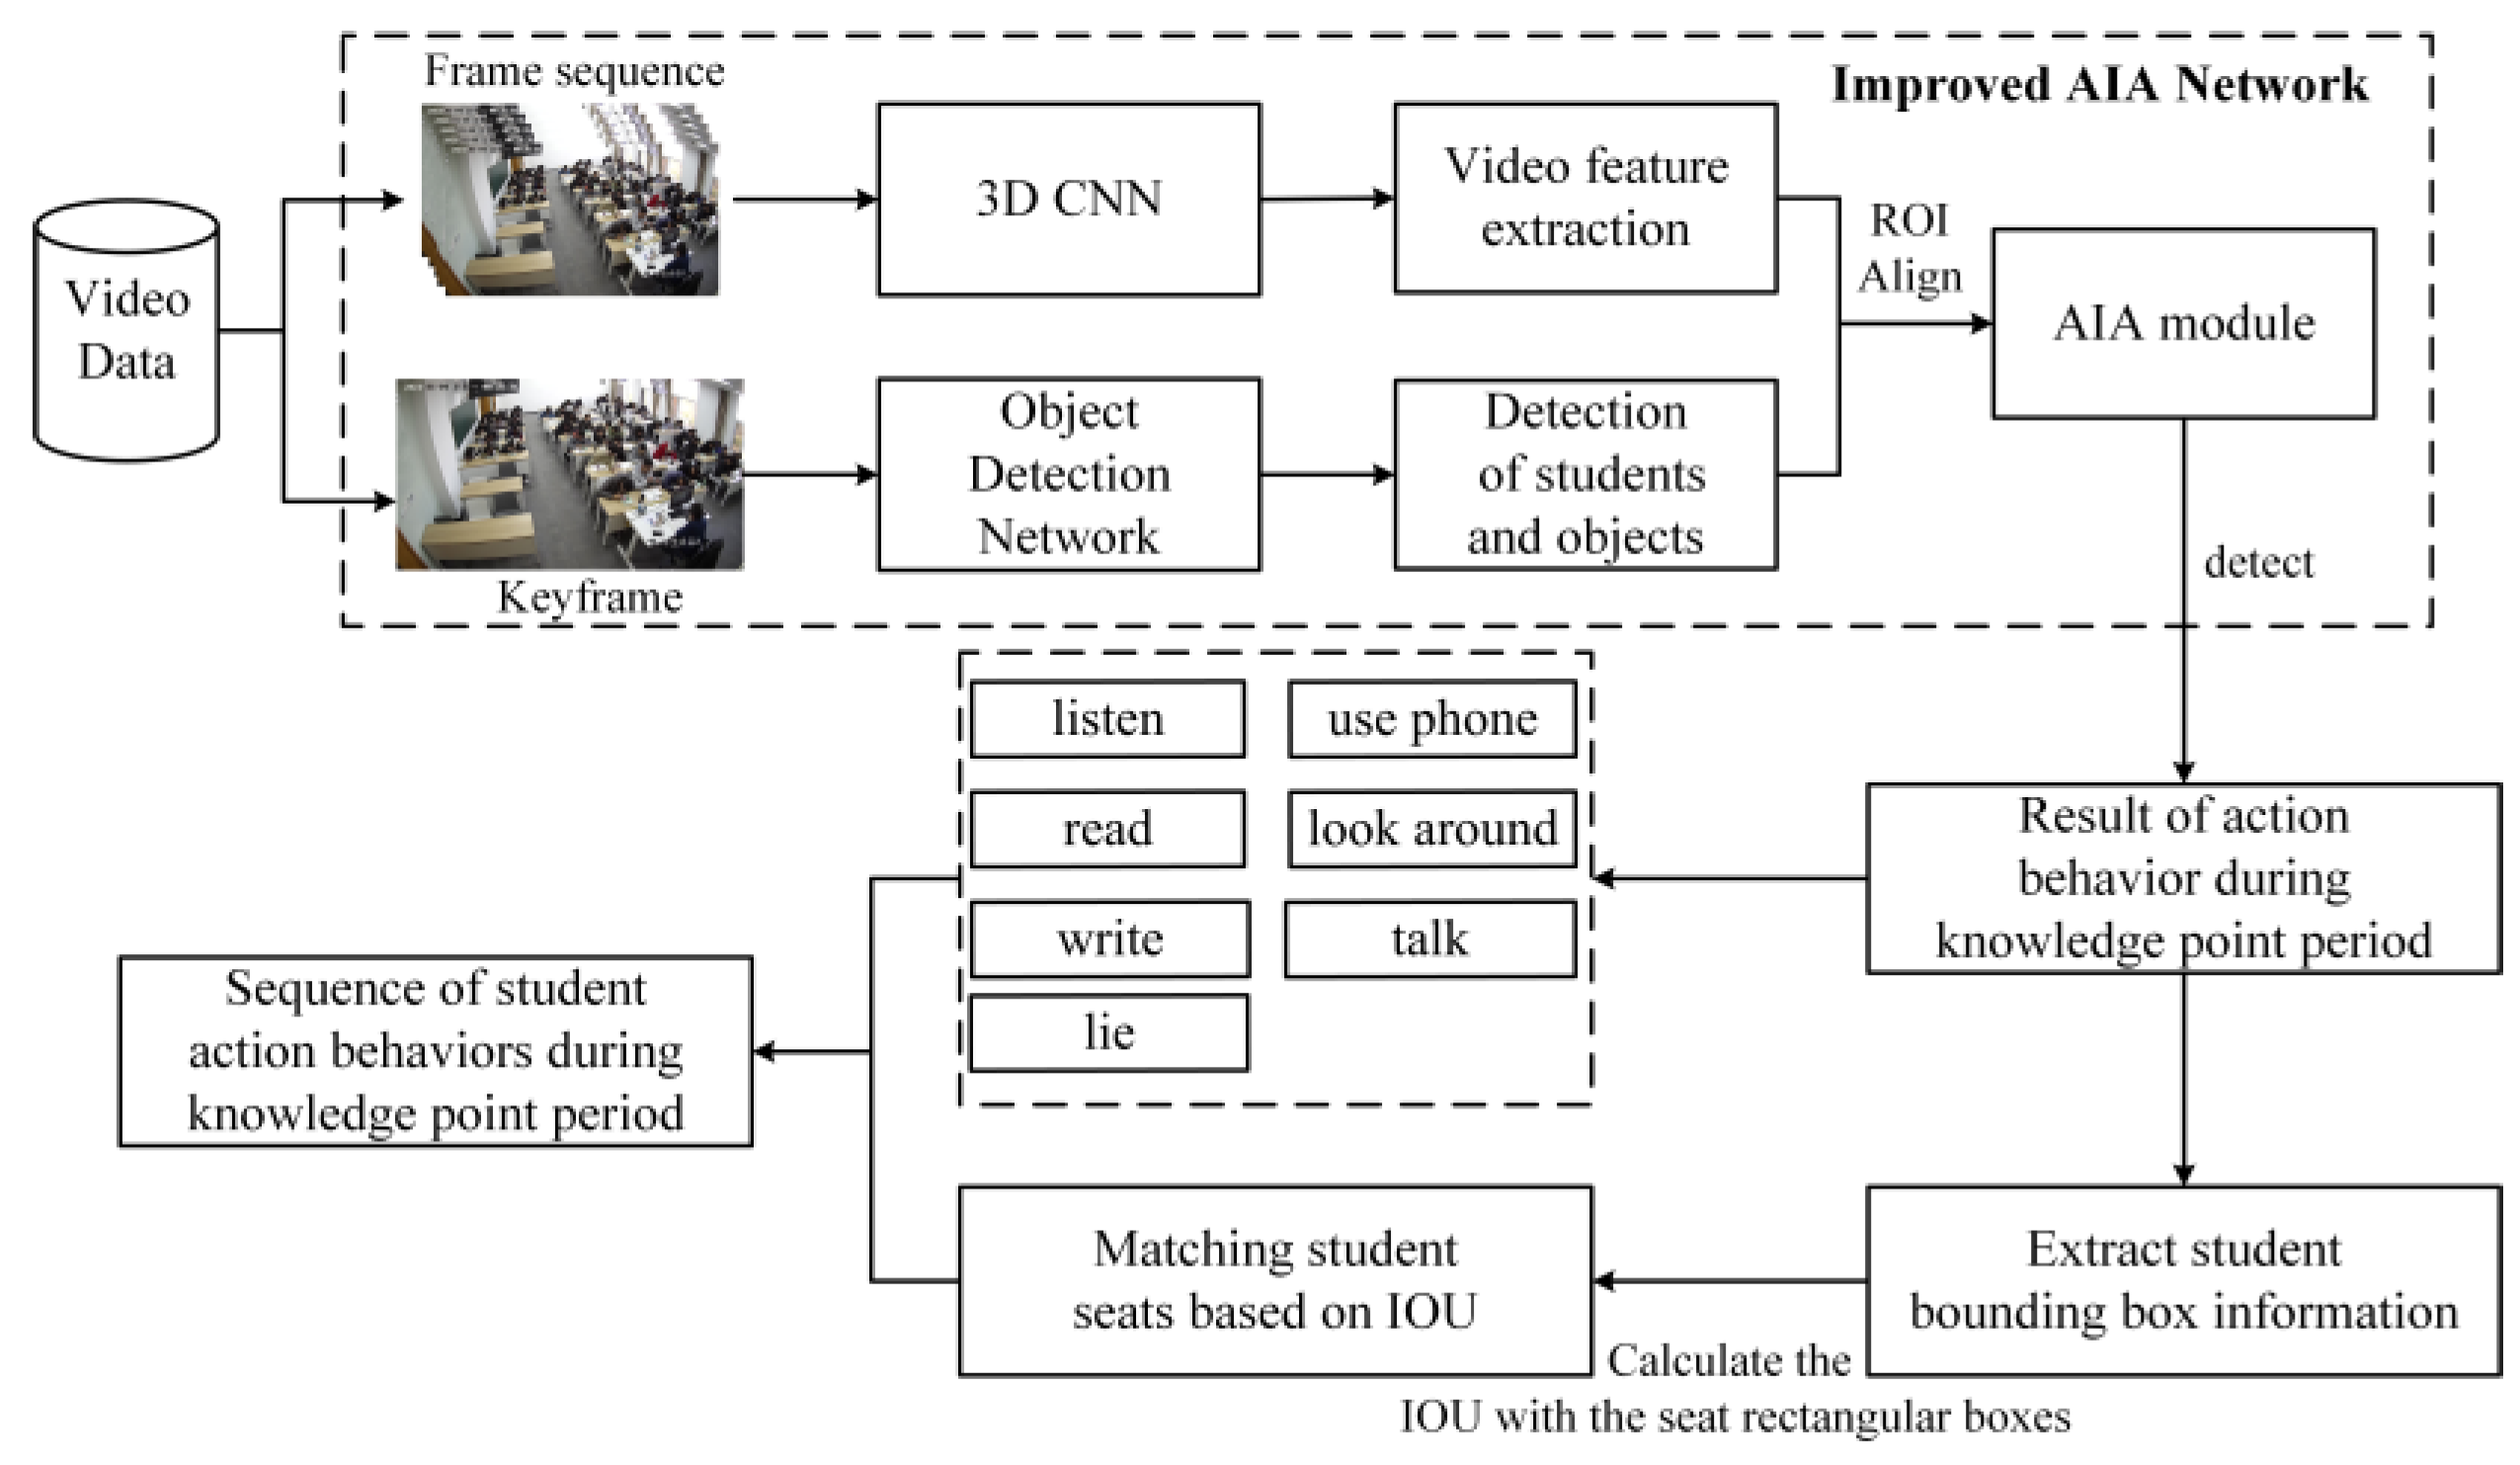
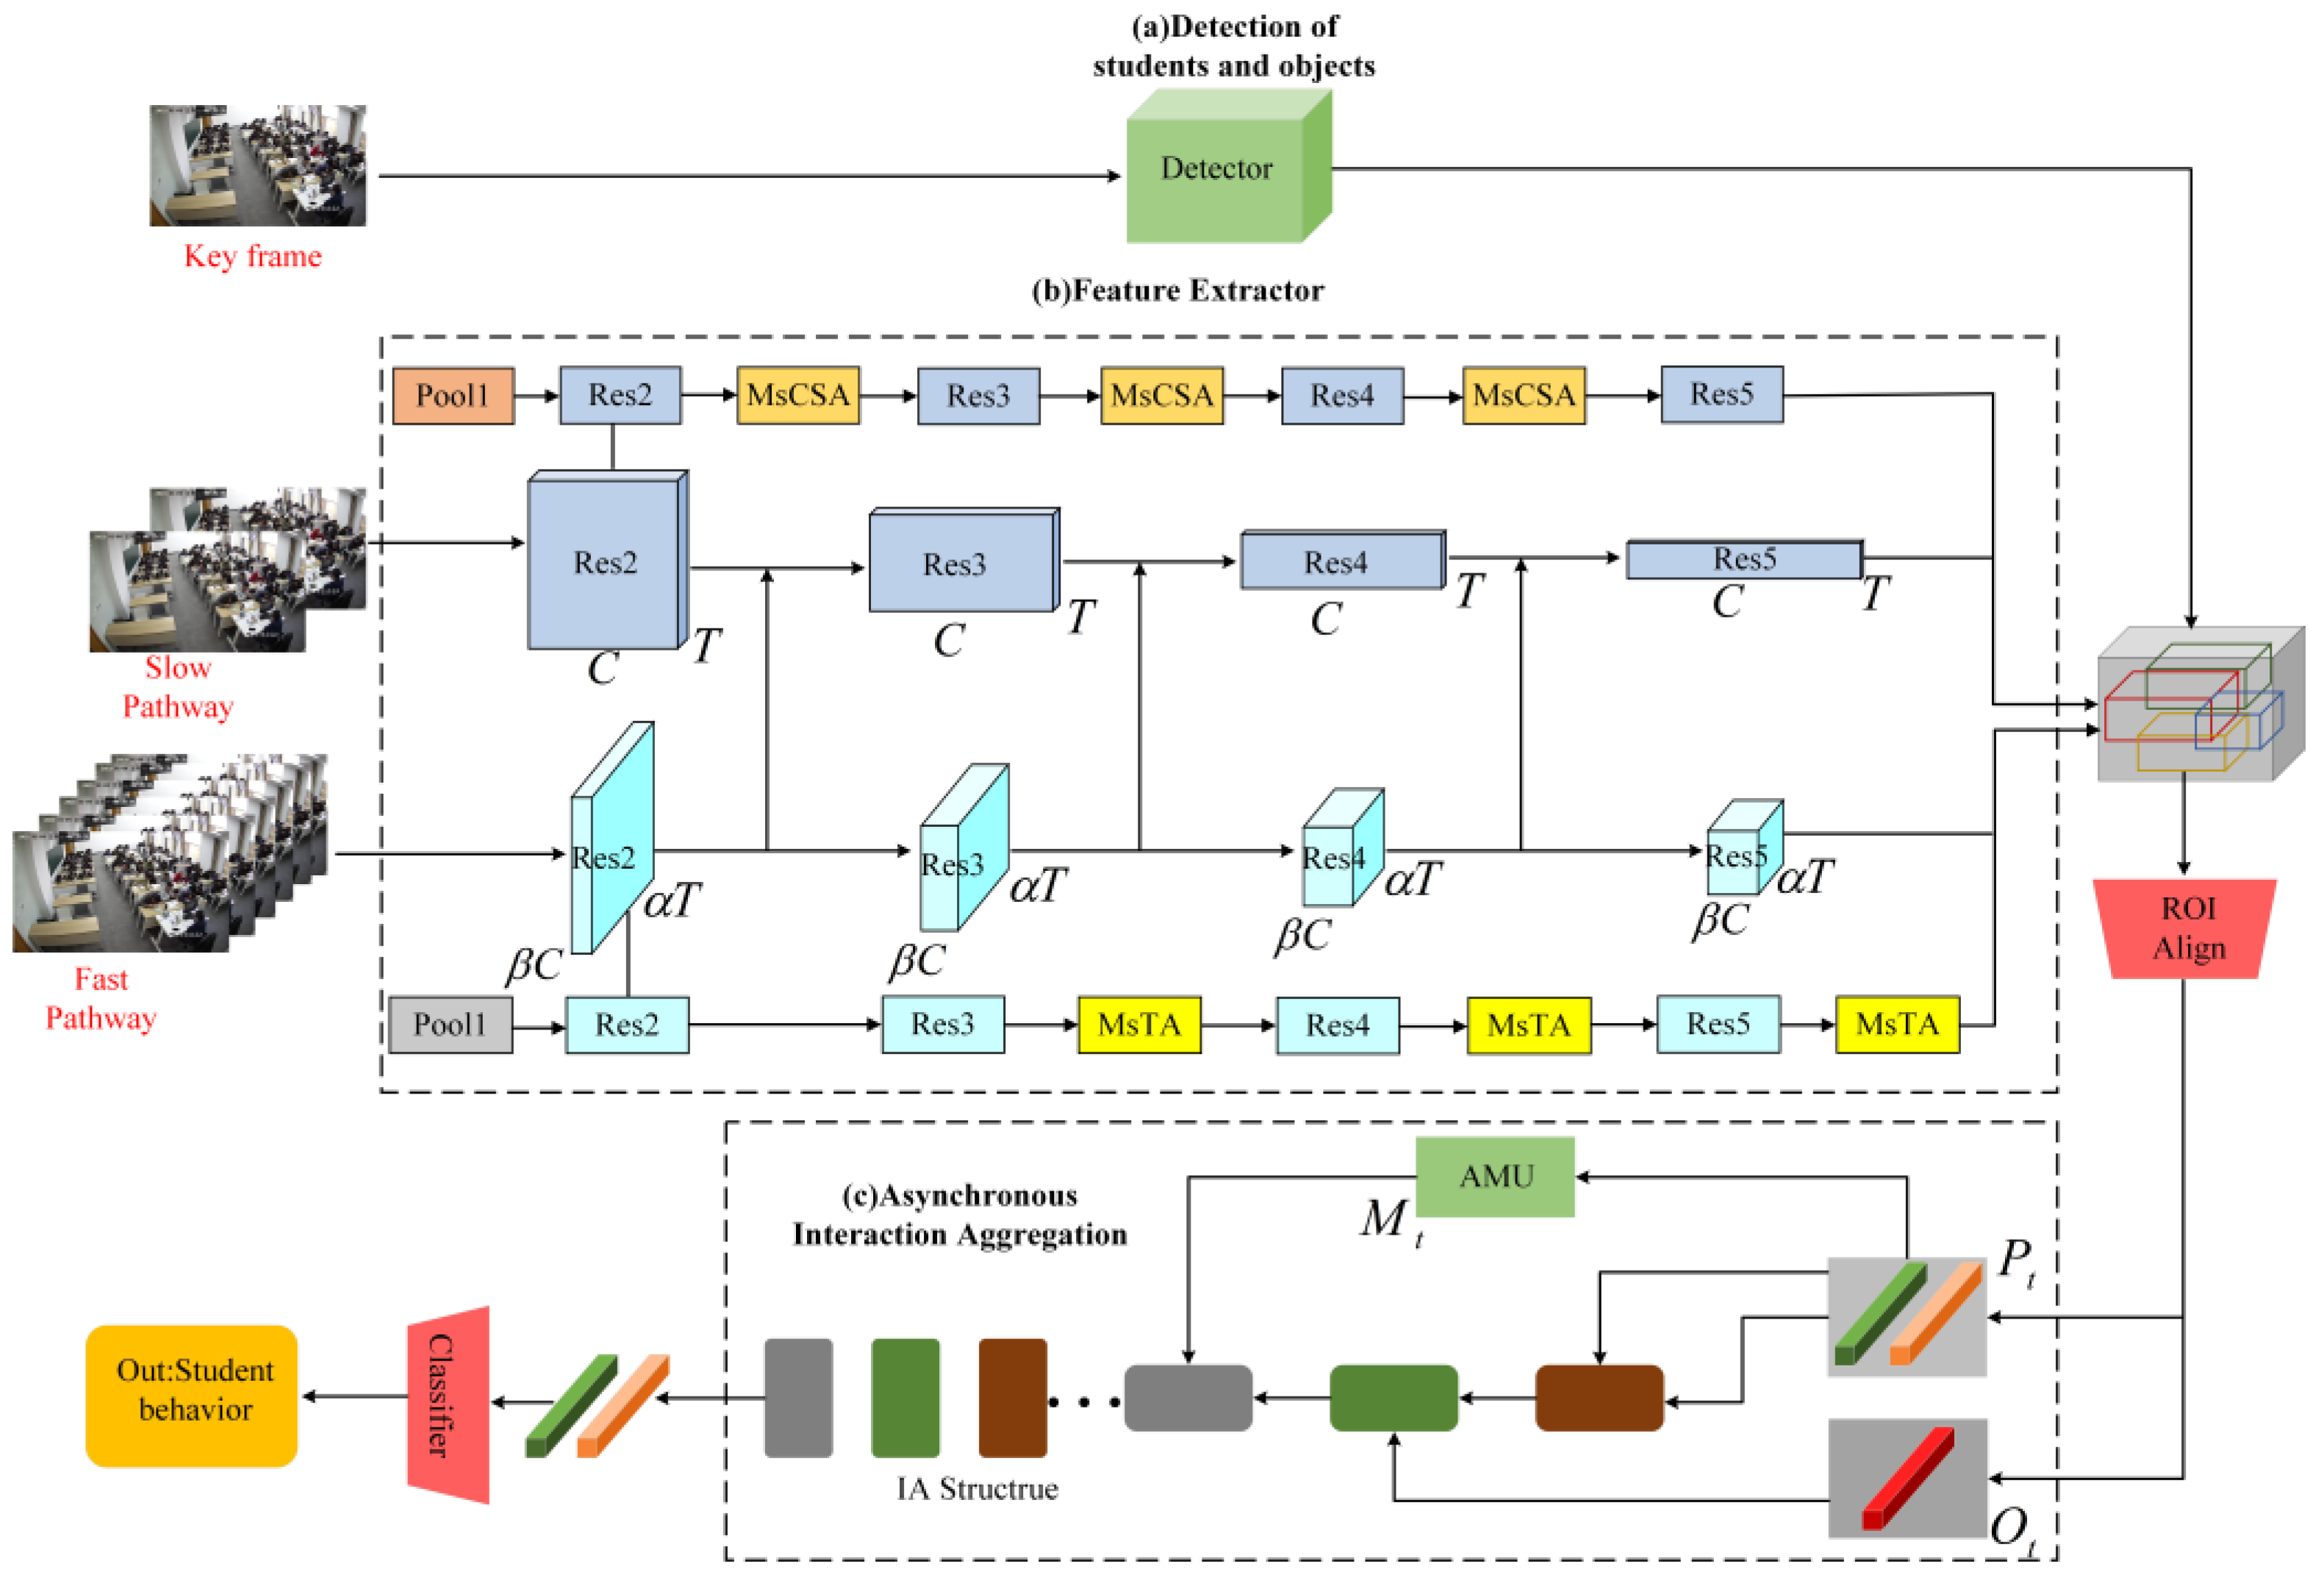
3.1. Detection of Students’ Action Behavior
3.1.1. Video Backbone Network
3.1.2. Feature Extraction
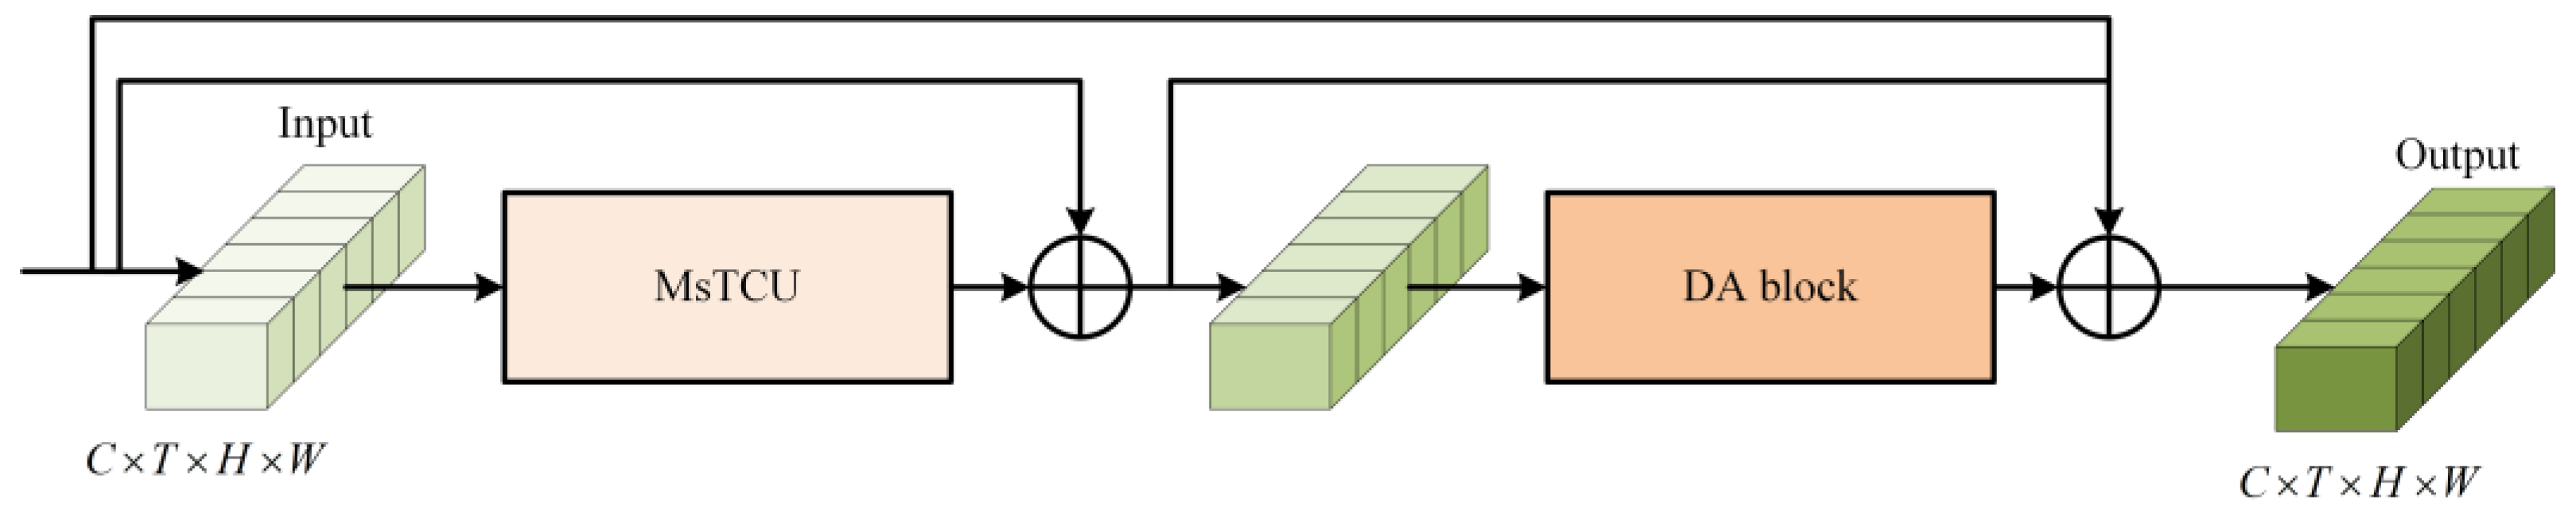
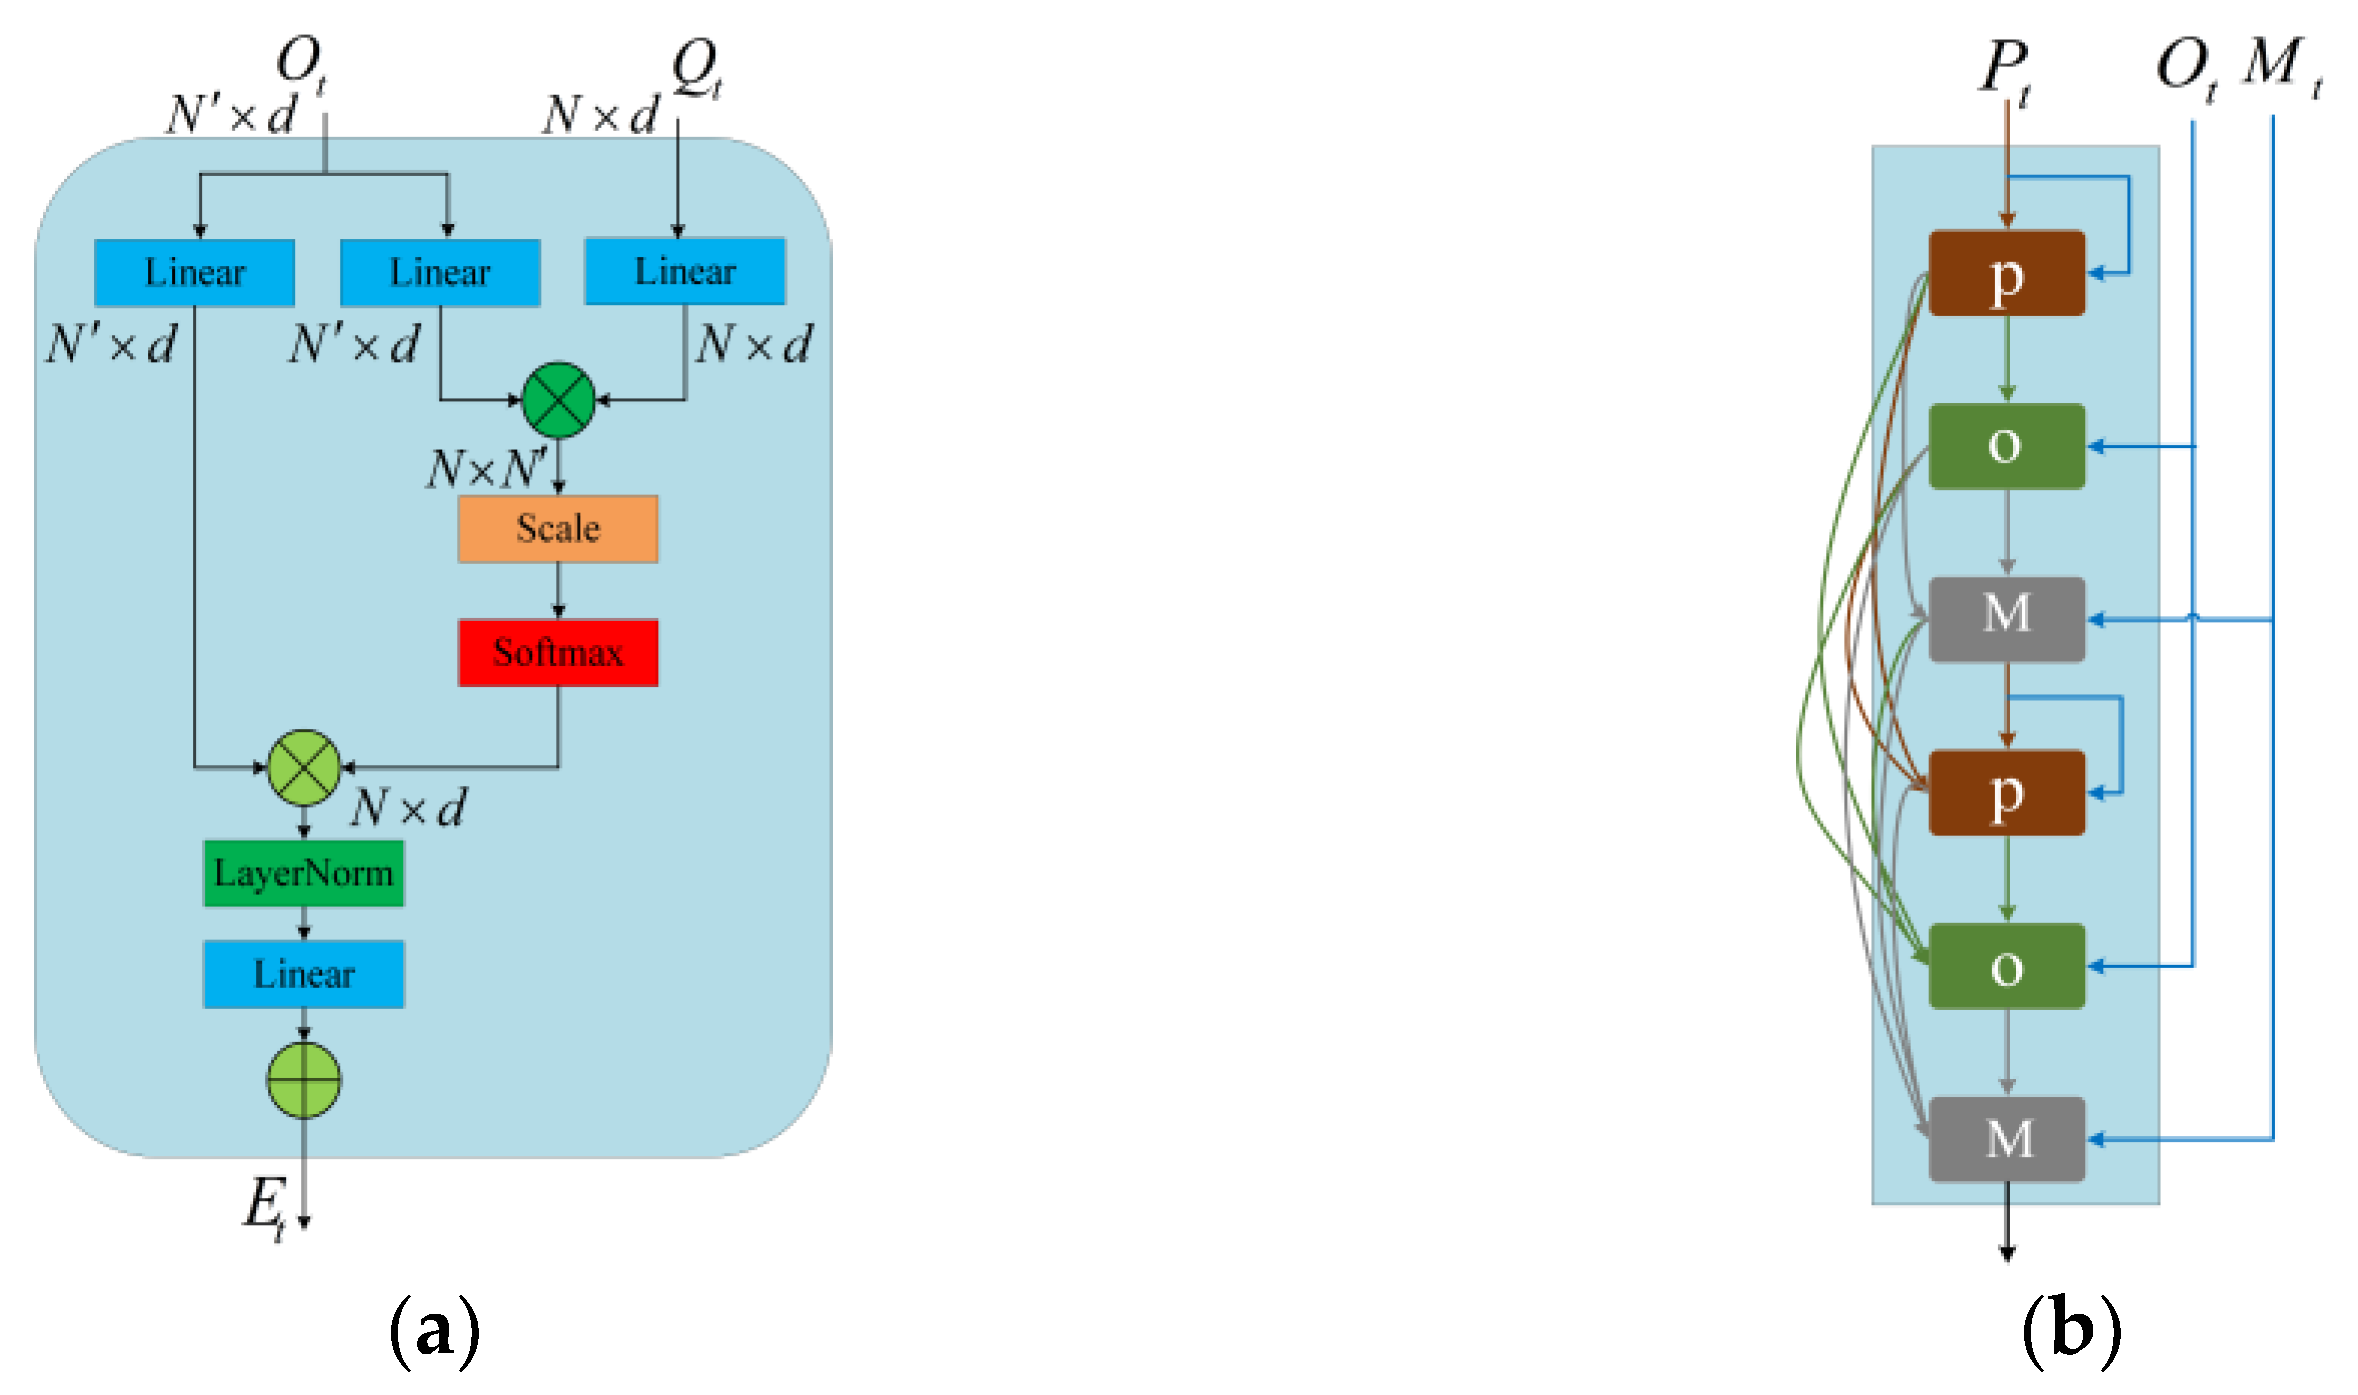
3.1.3. Modeling and Aggregation of Interactions
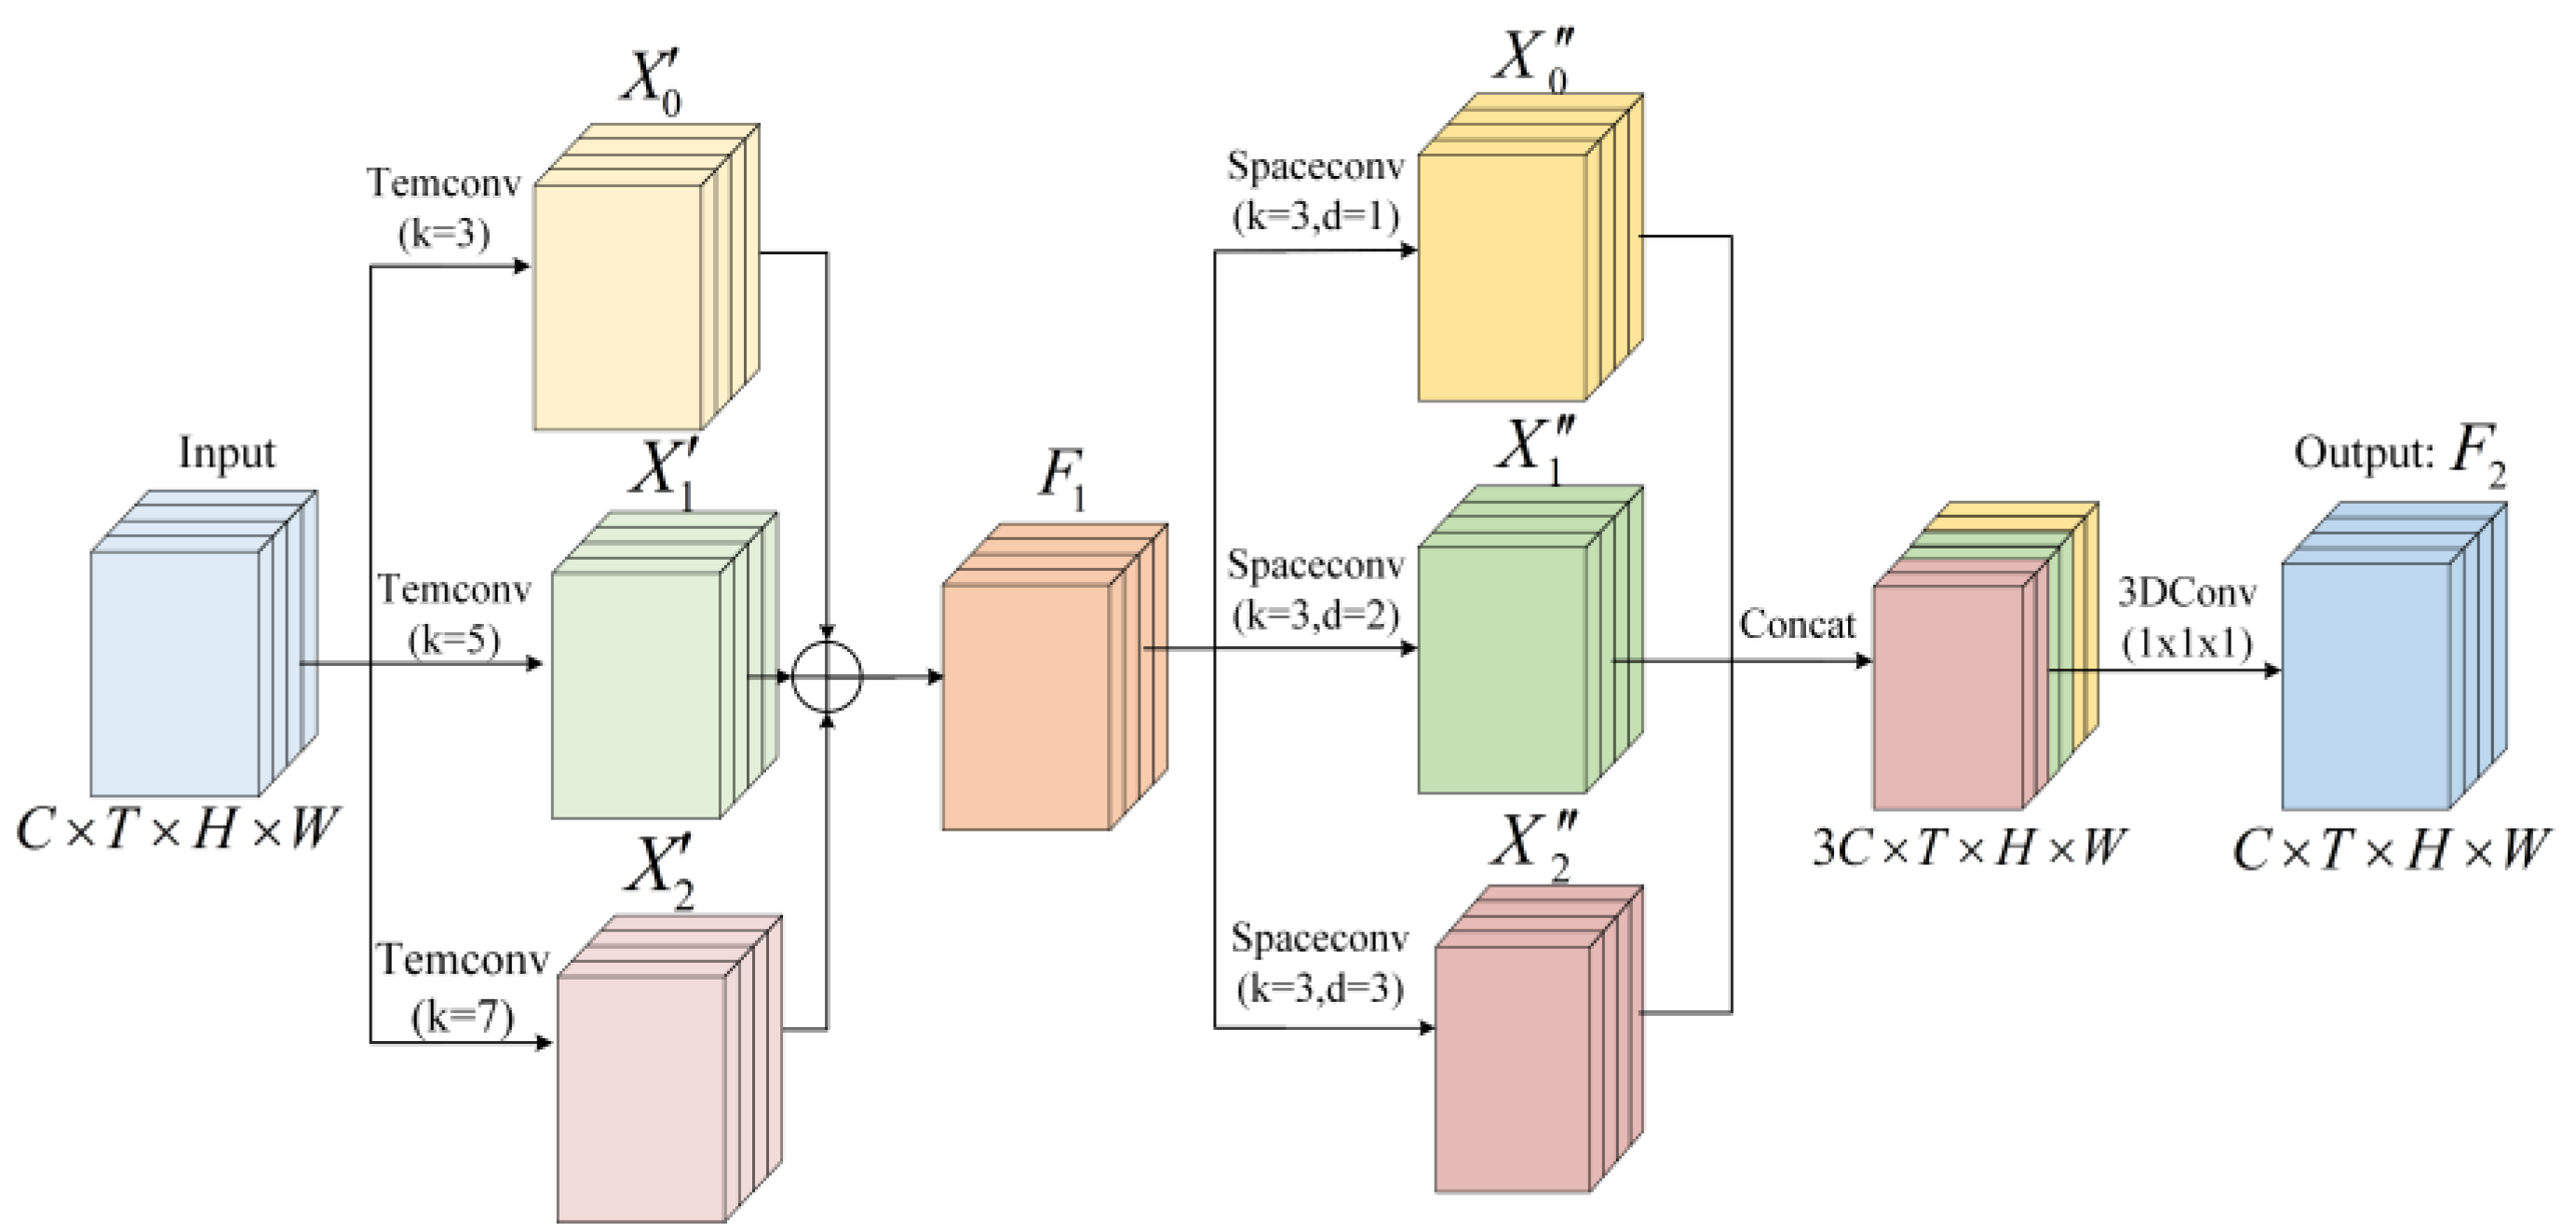
3.1.4. MsTA Module
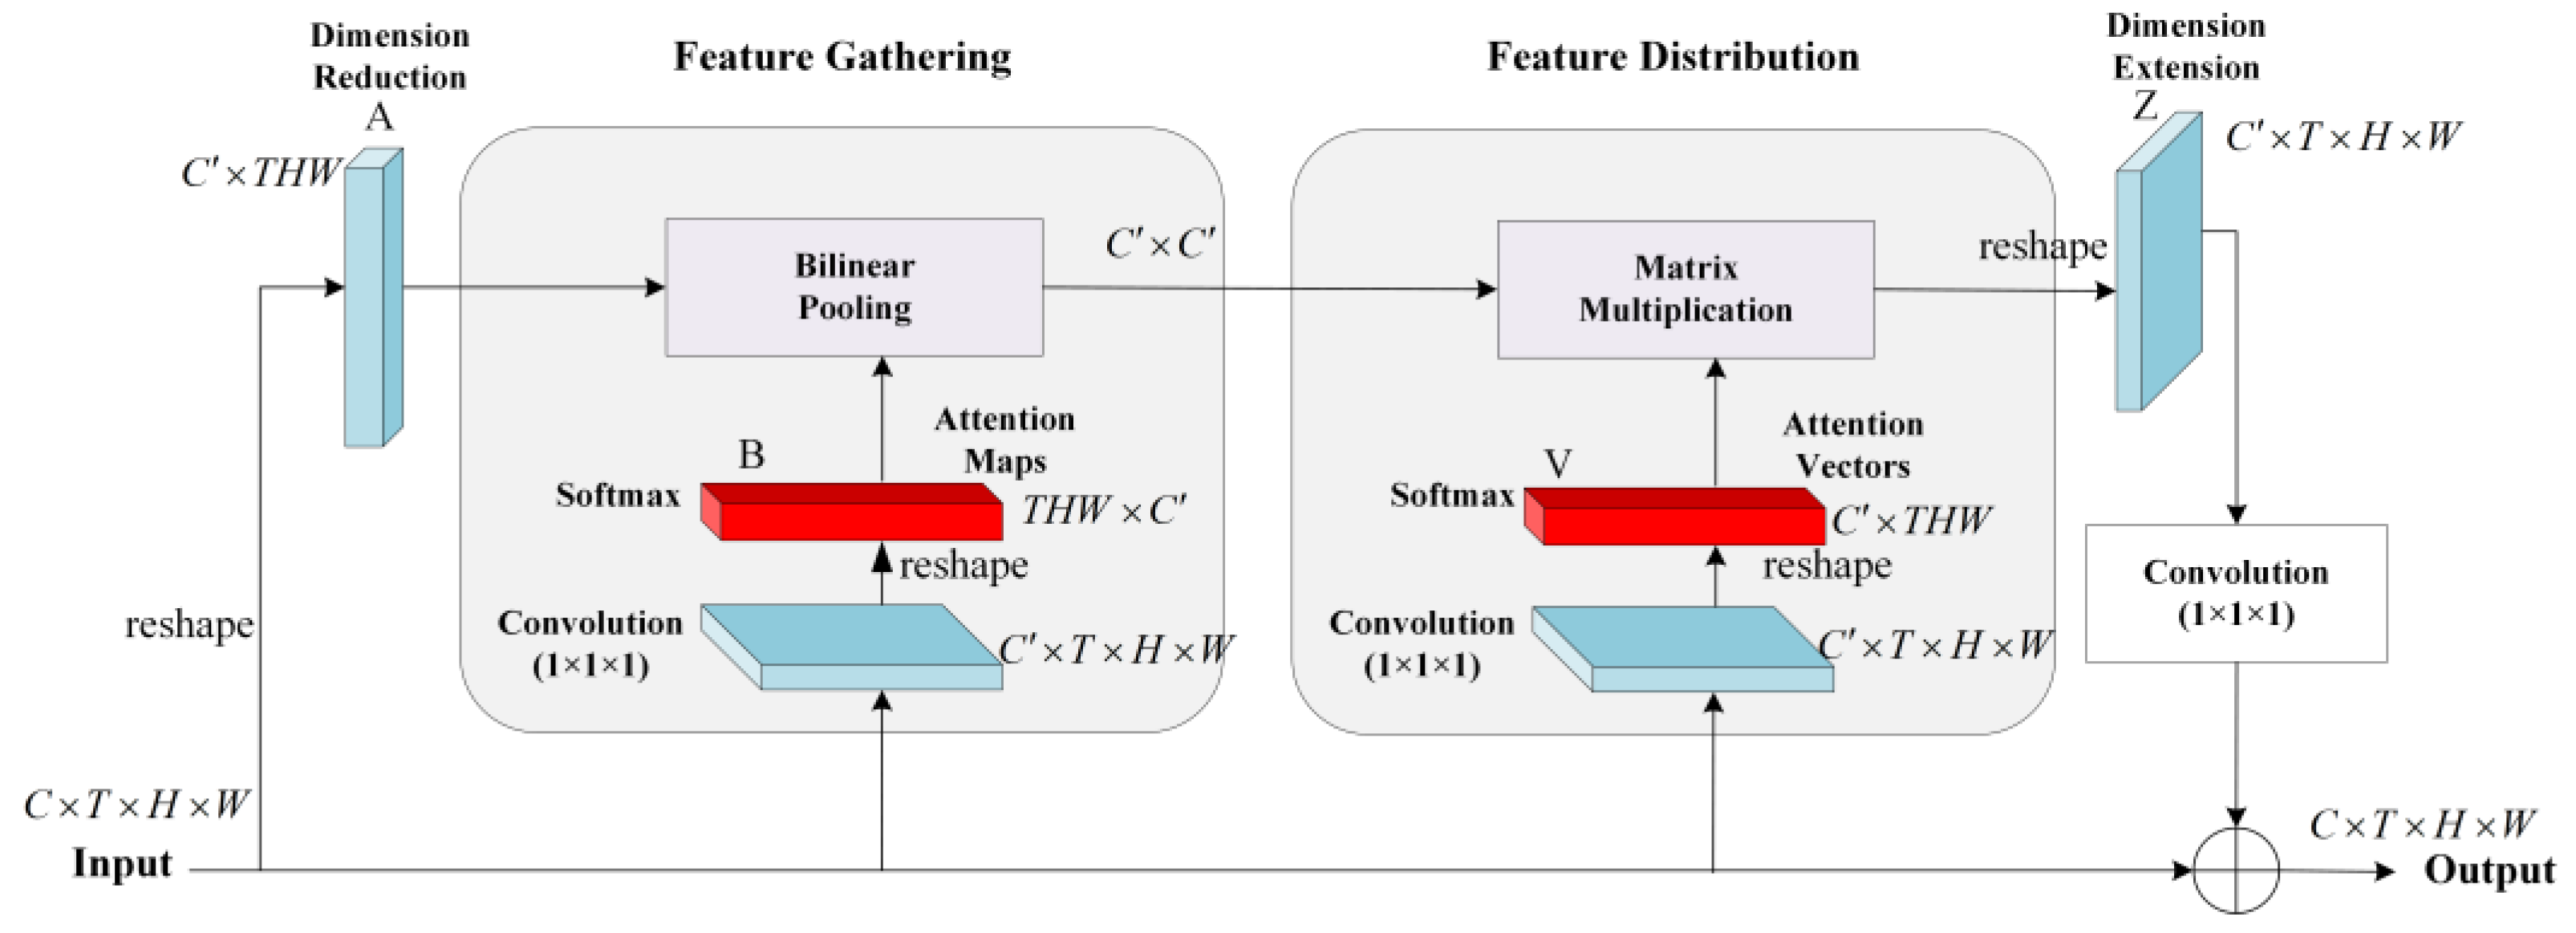
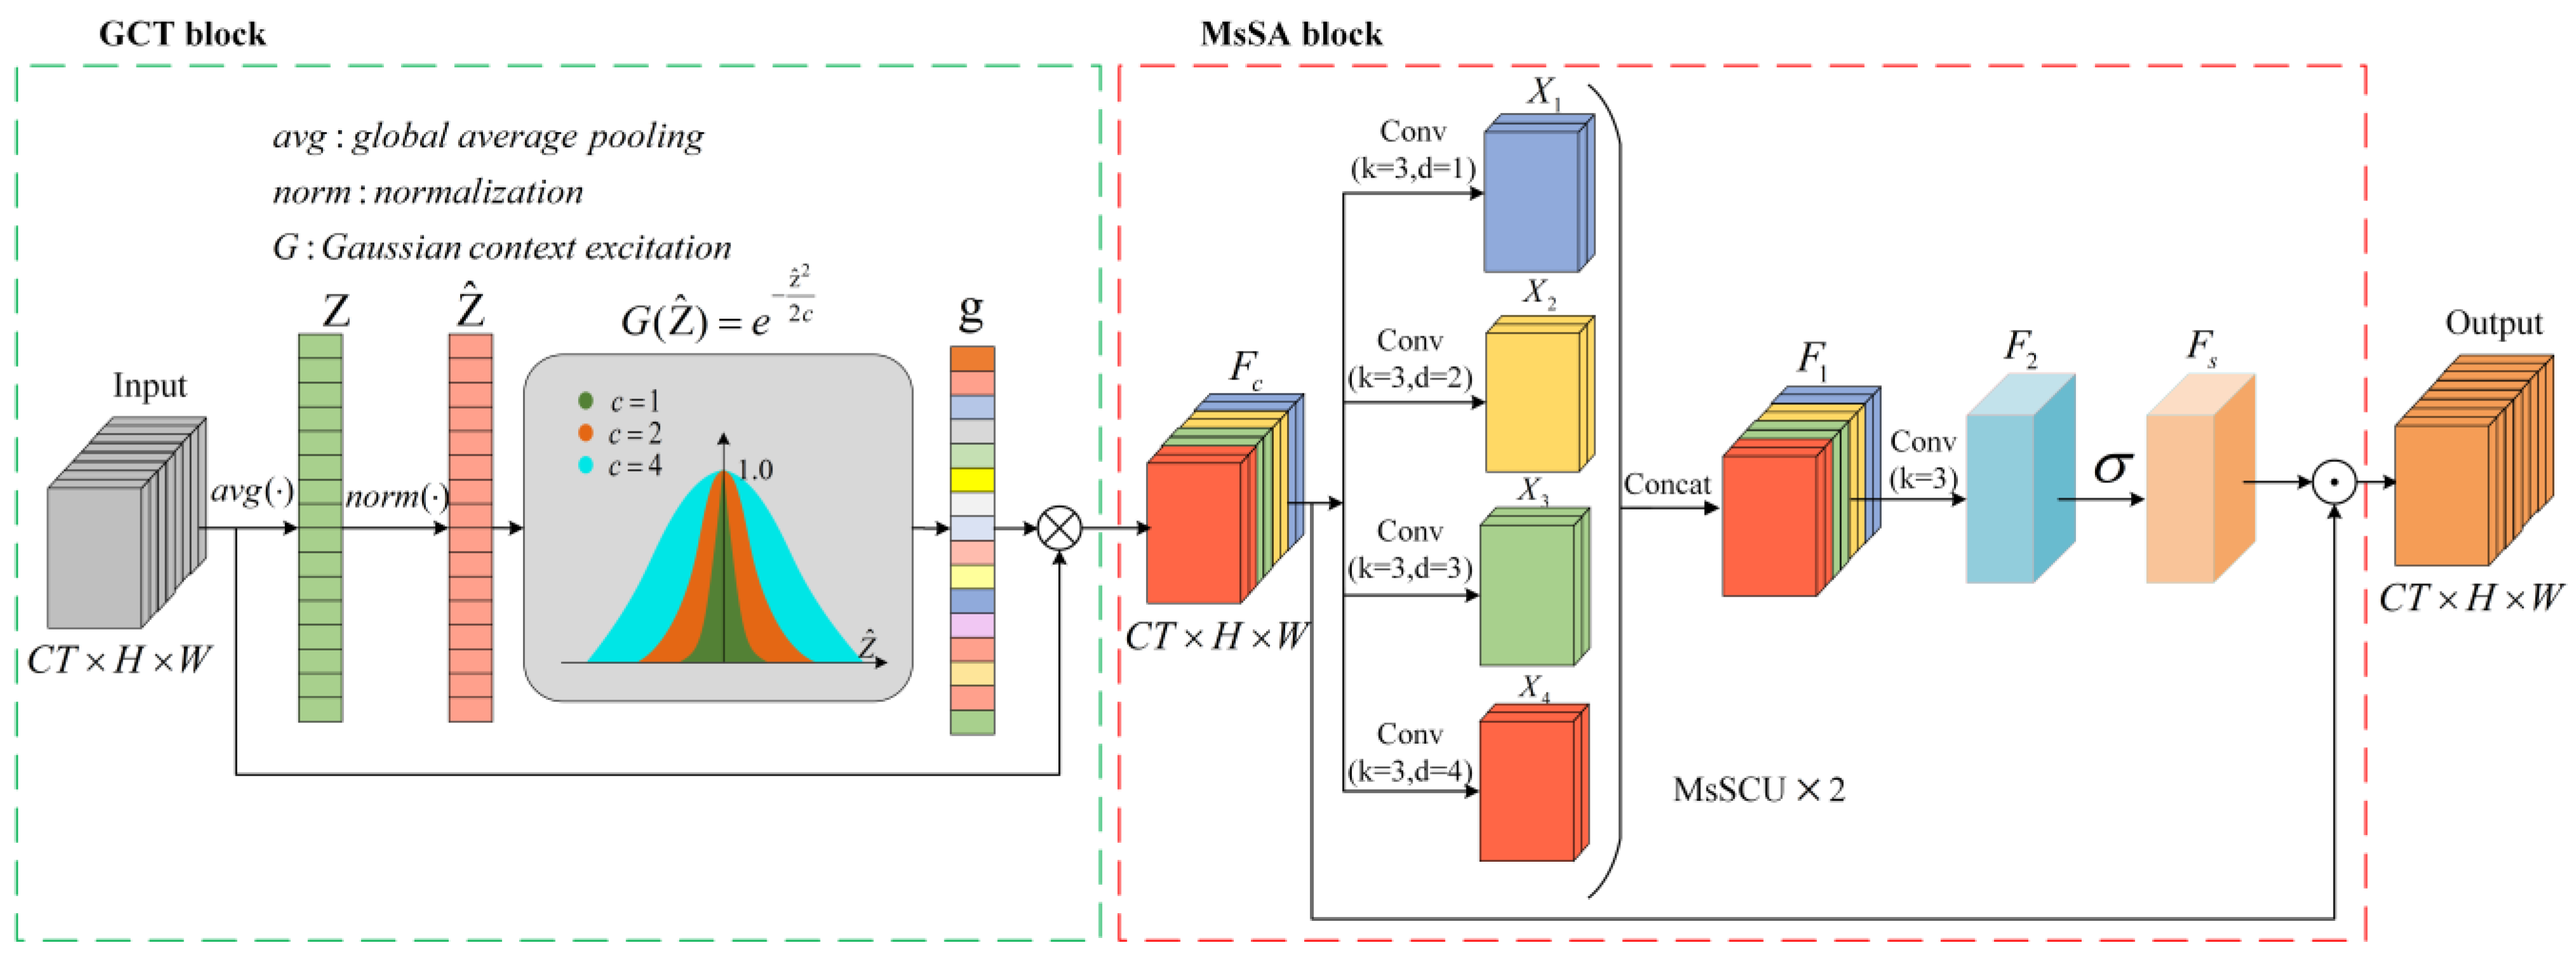
3.1.5. MsCSA Module
3.1.6. Equalized Focal Loss Function
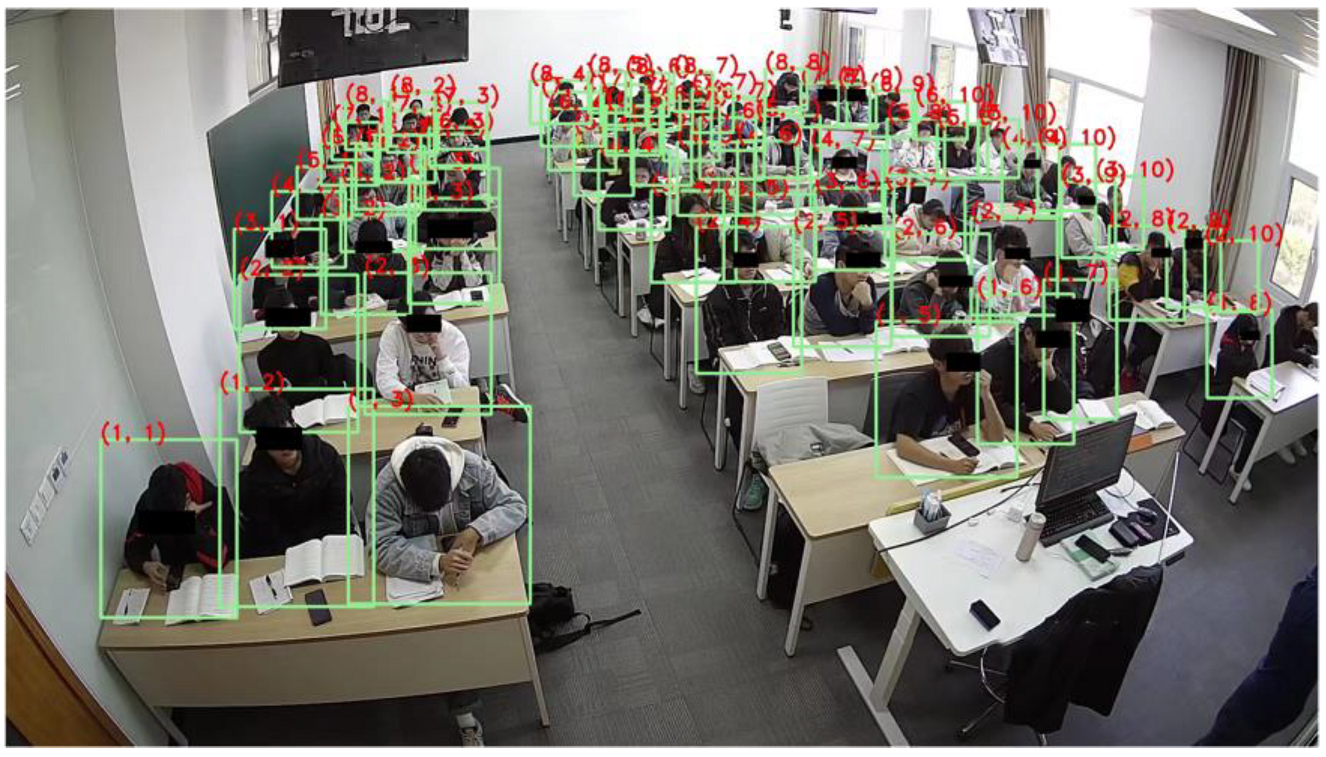
3.2. Seat-Association-Based Analysis of Students’ Action Behavior Sequence
4. Experimental Results and Analysis
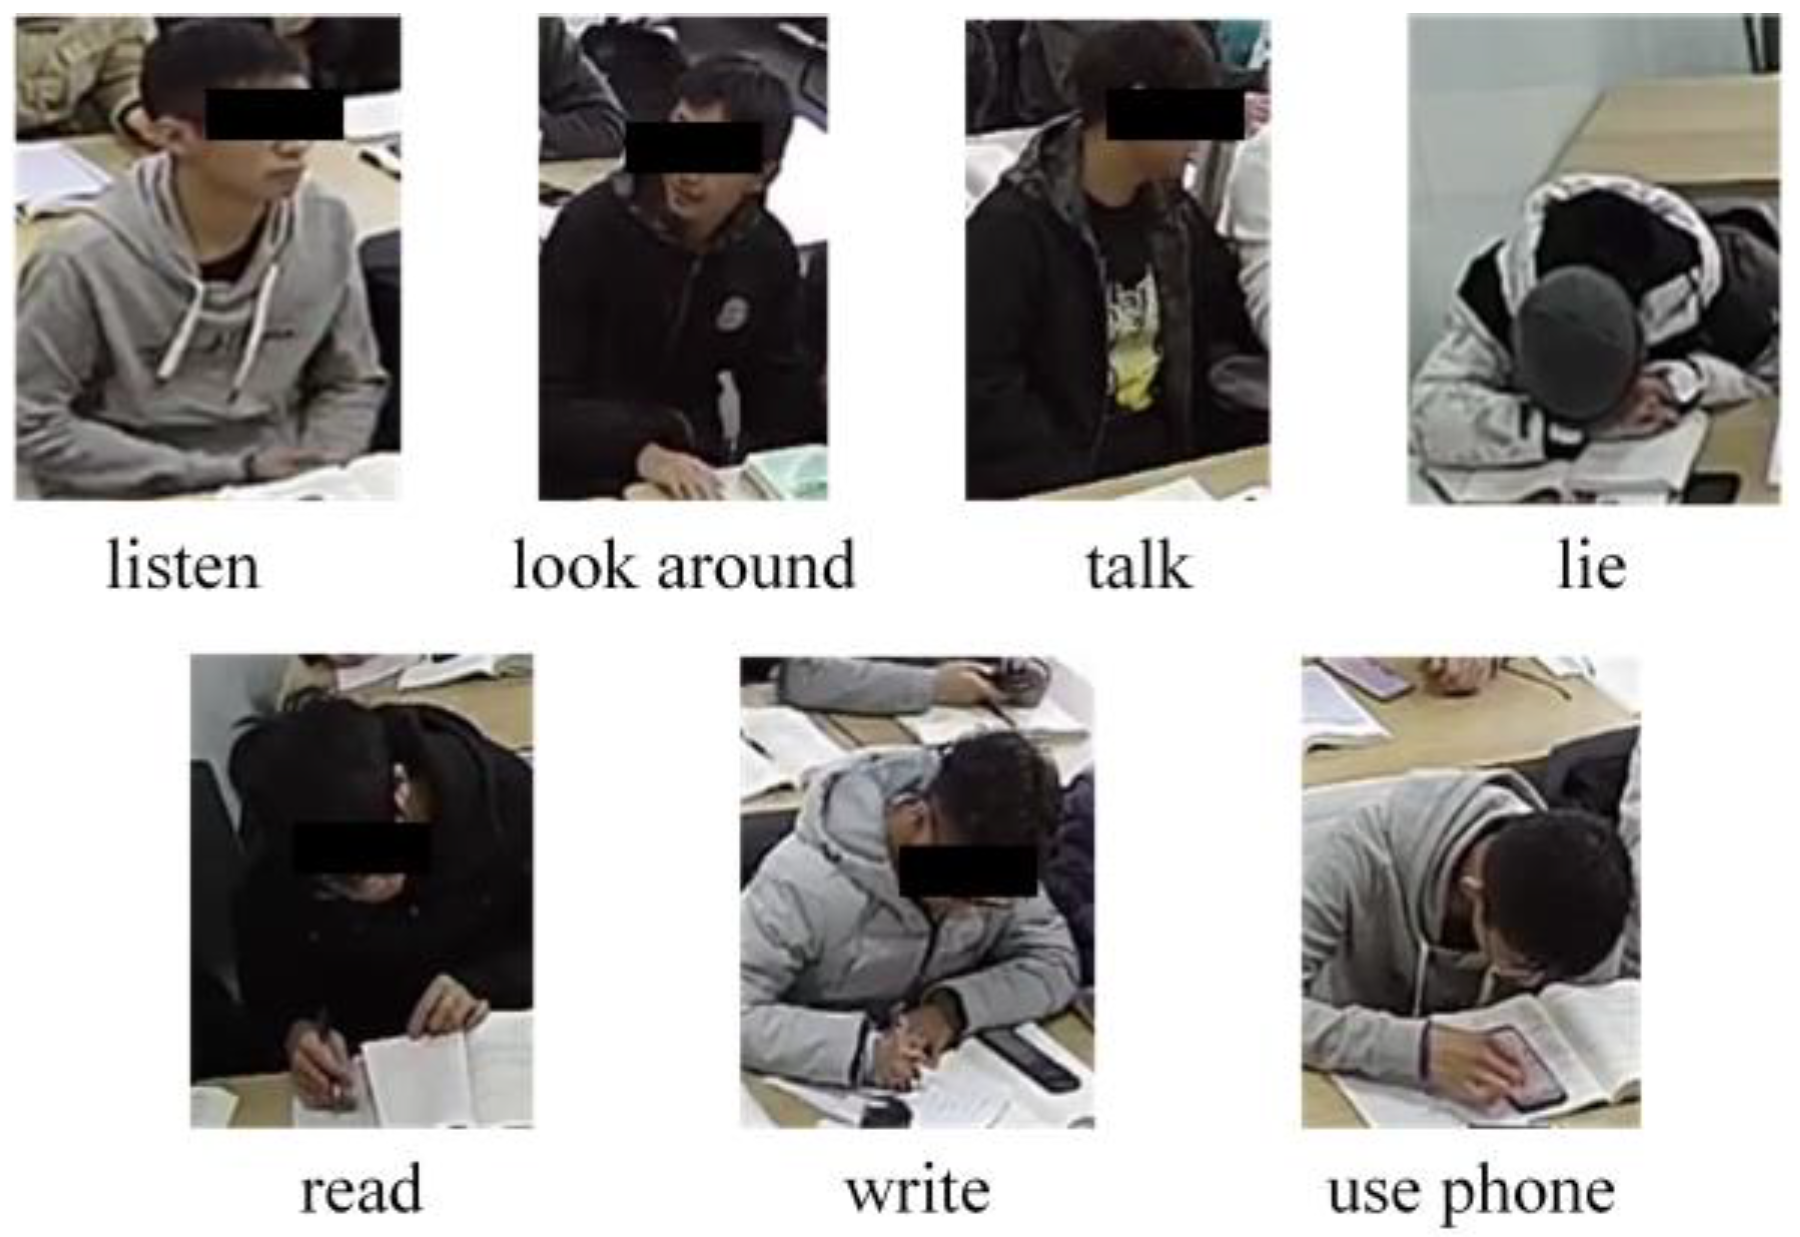
4.1. Datasets
4.2. Experimental Results on the Public Dataset
4.3. Student Action Behavior Detection Performance
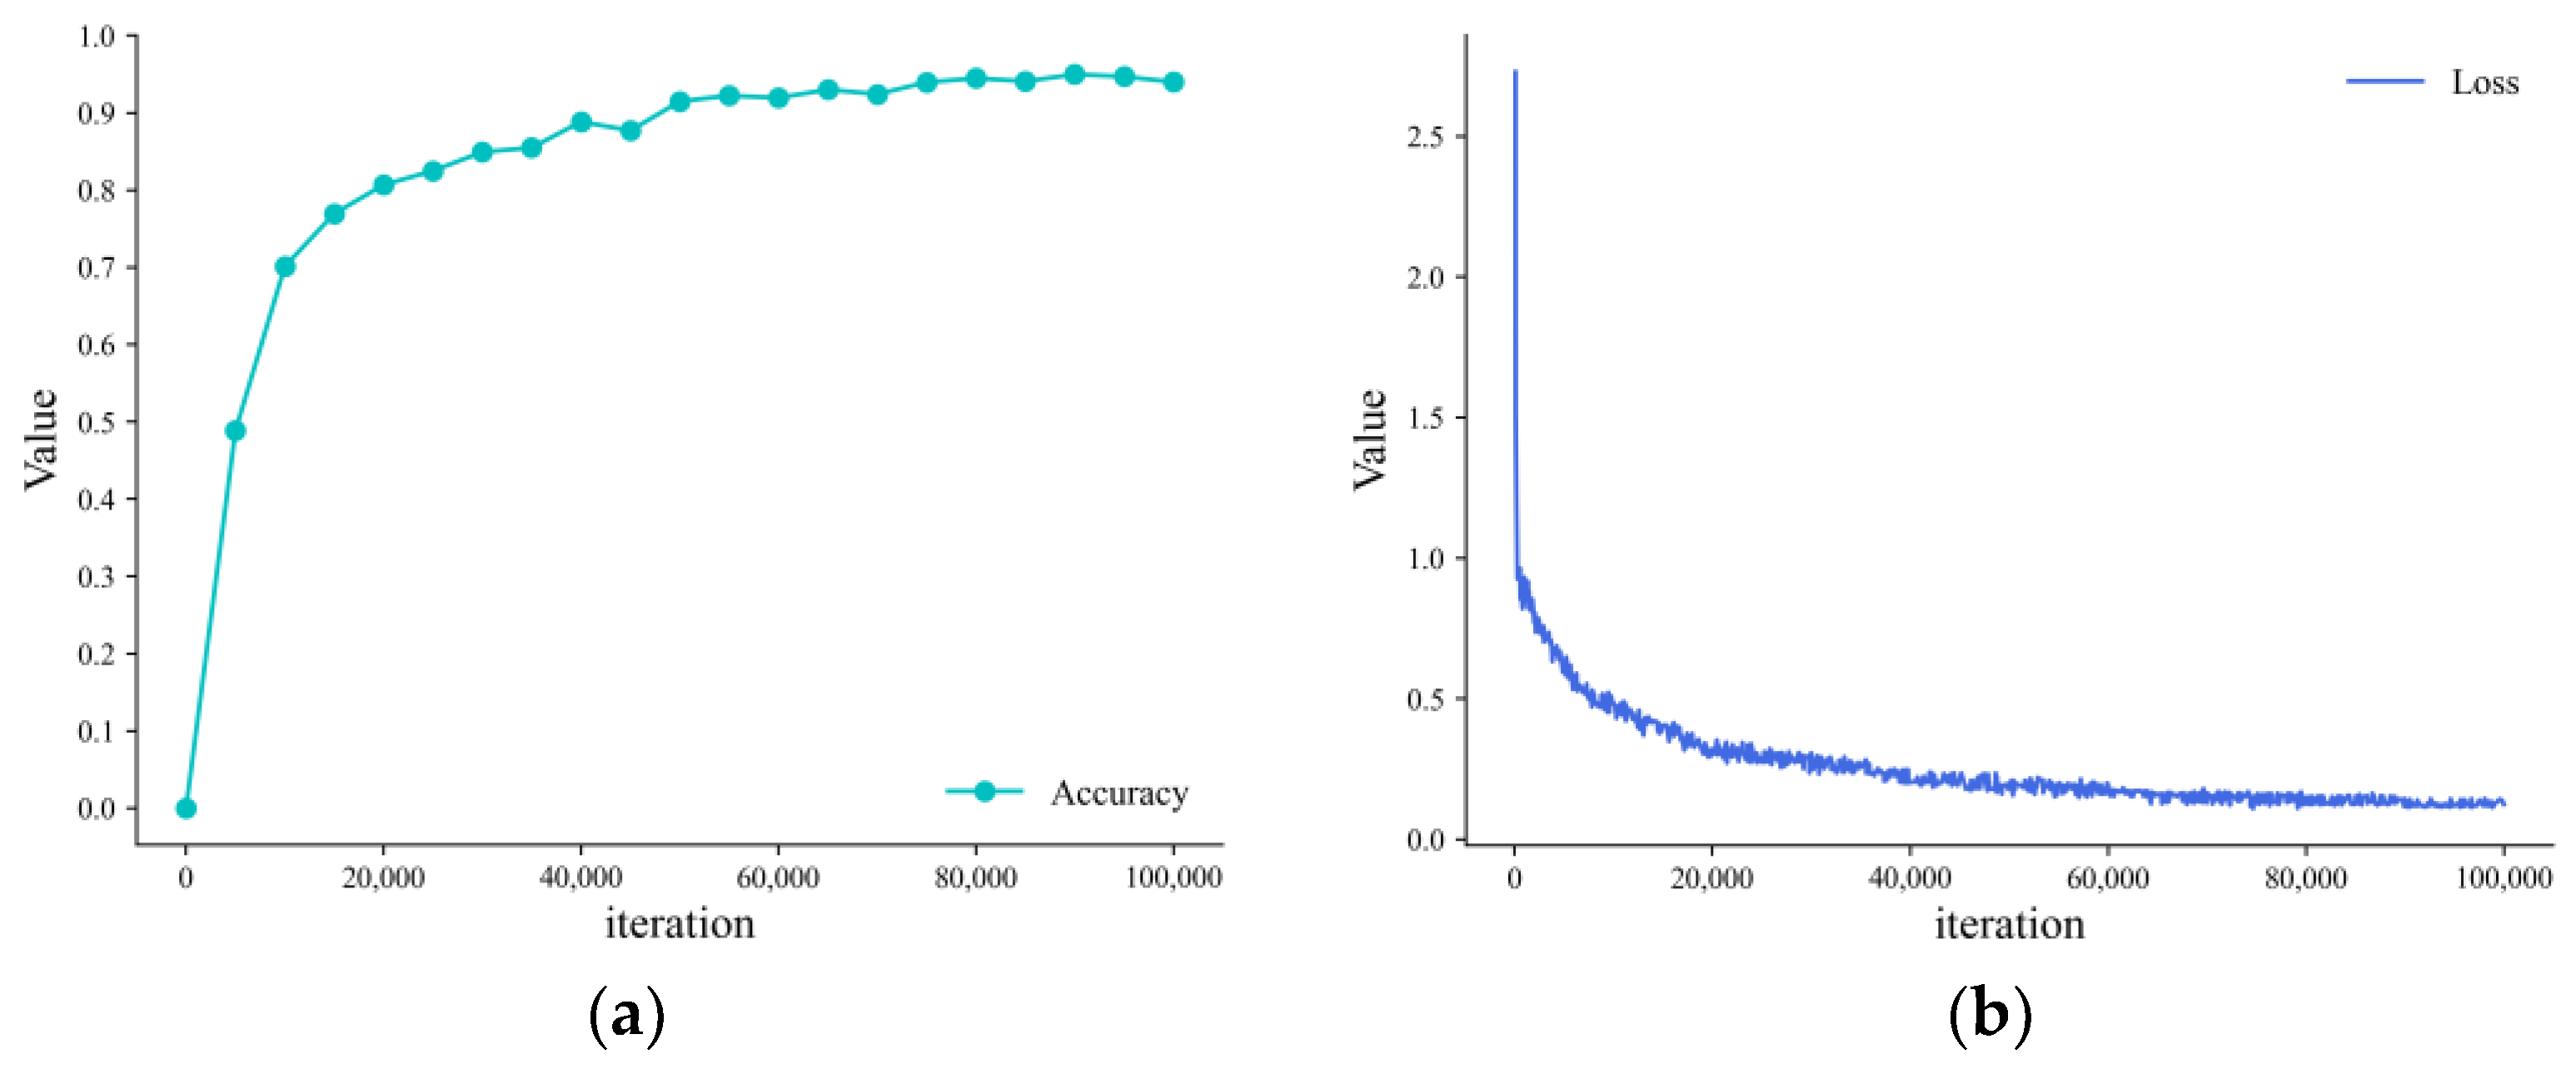
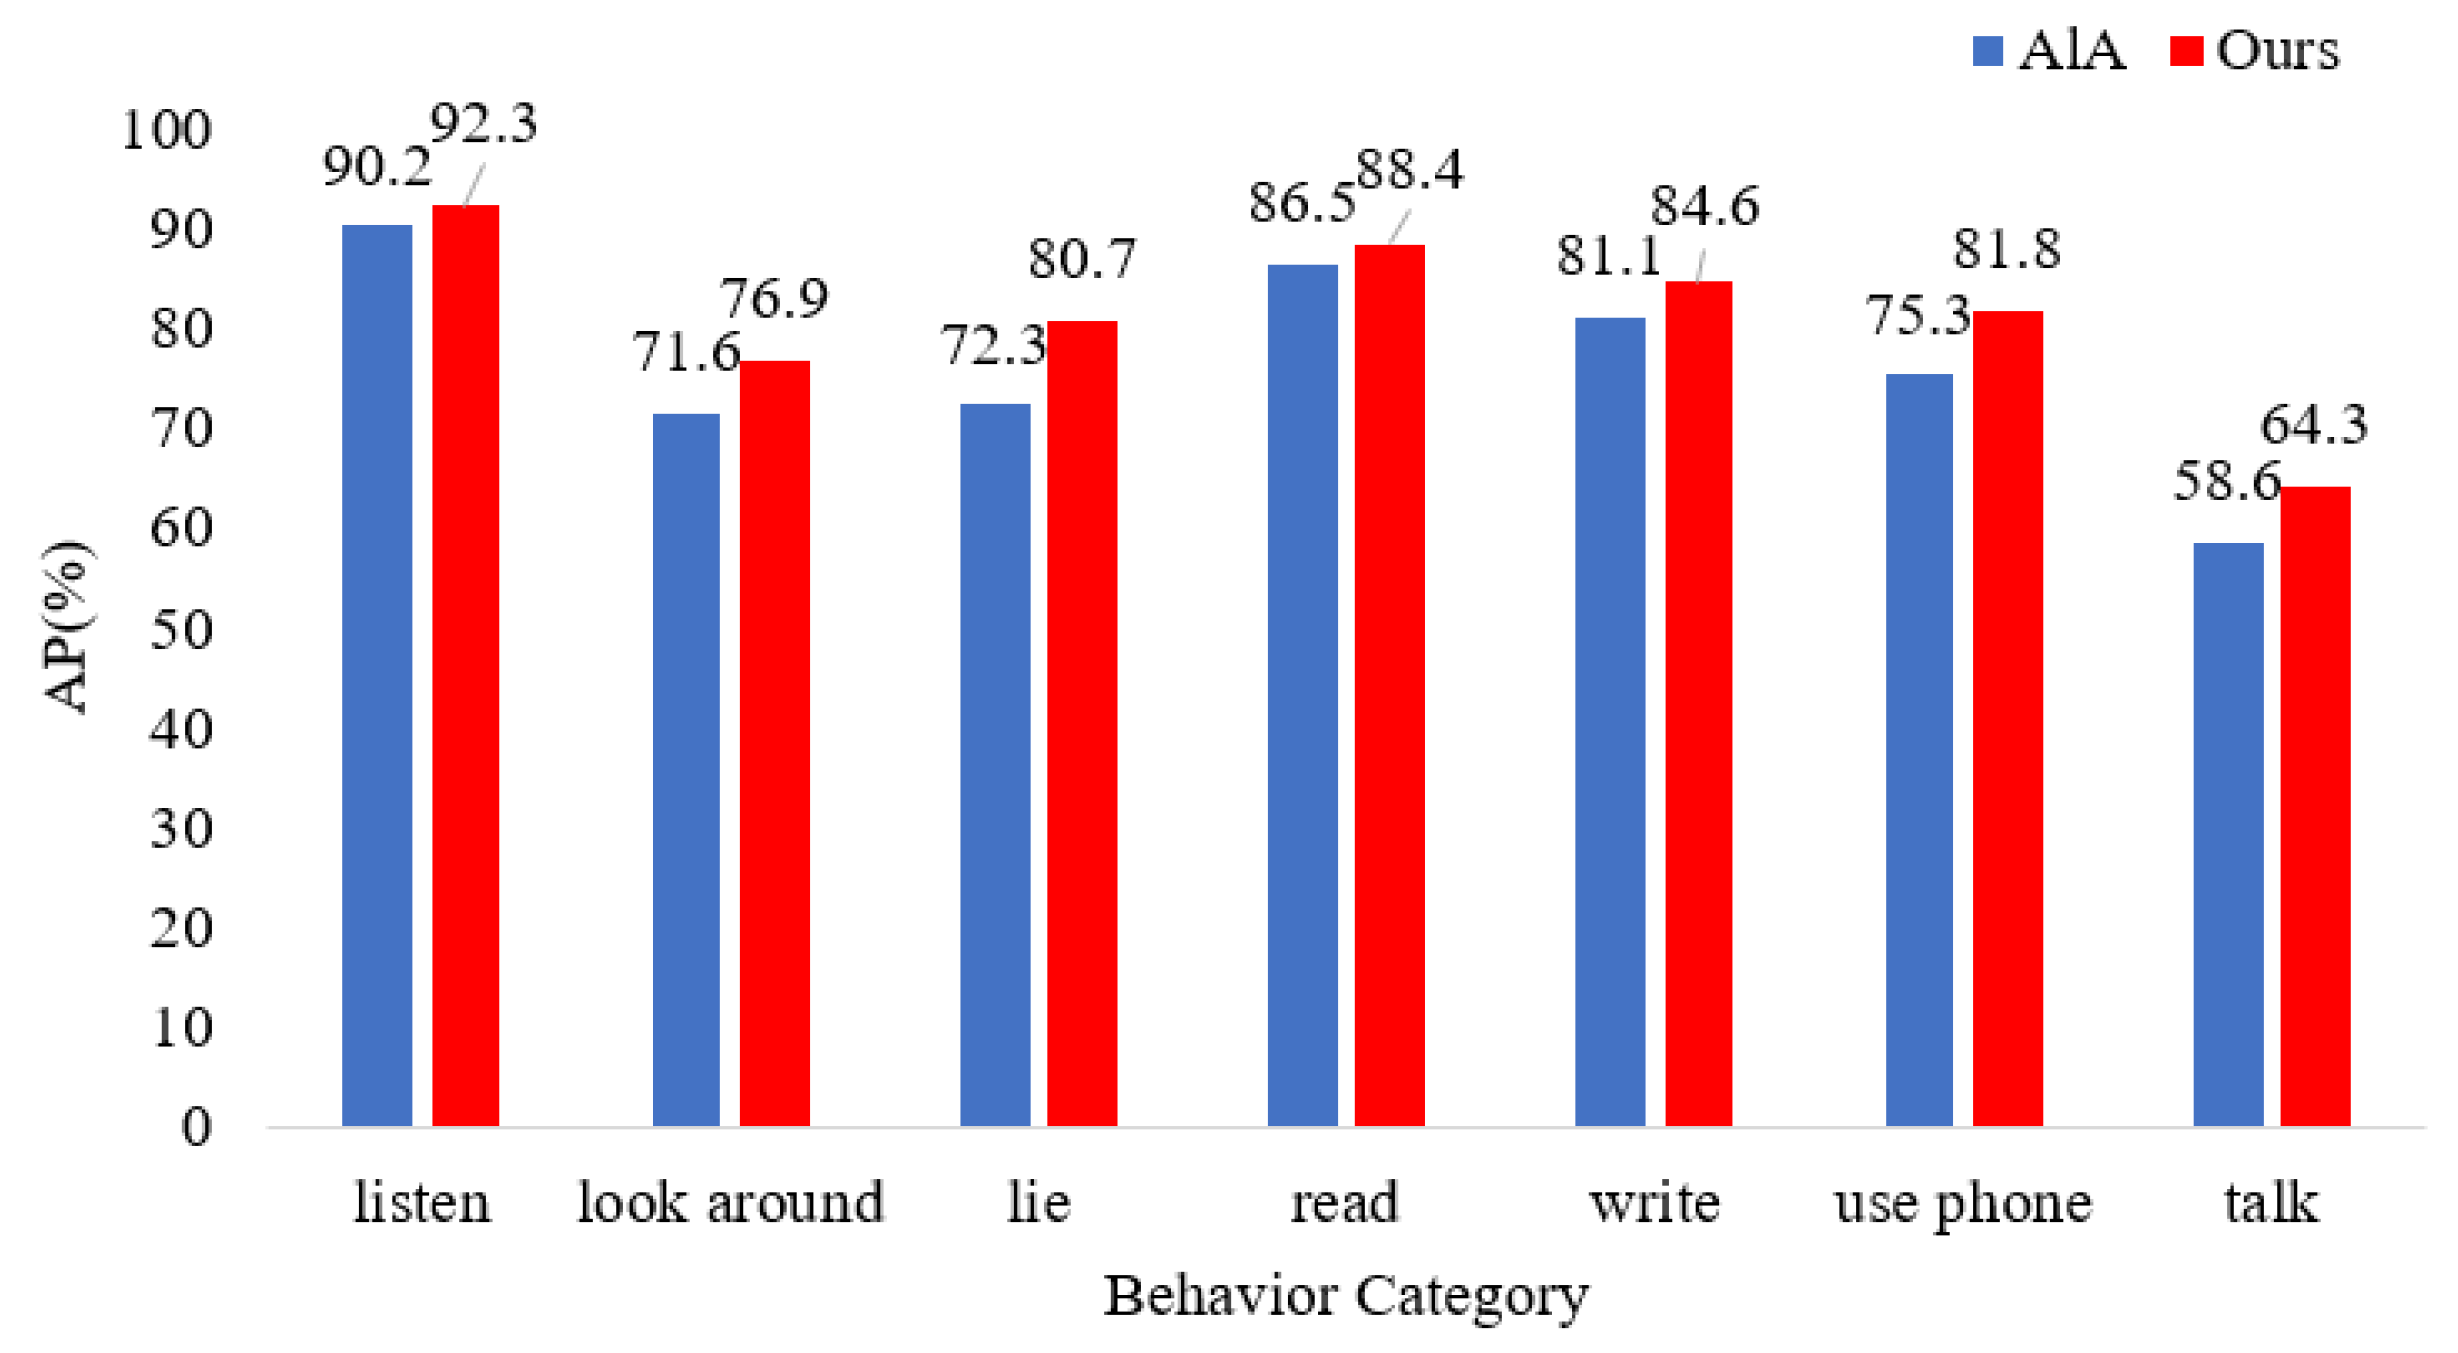
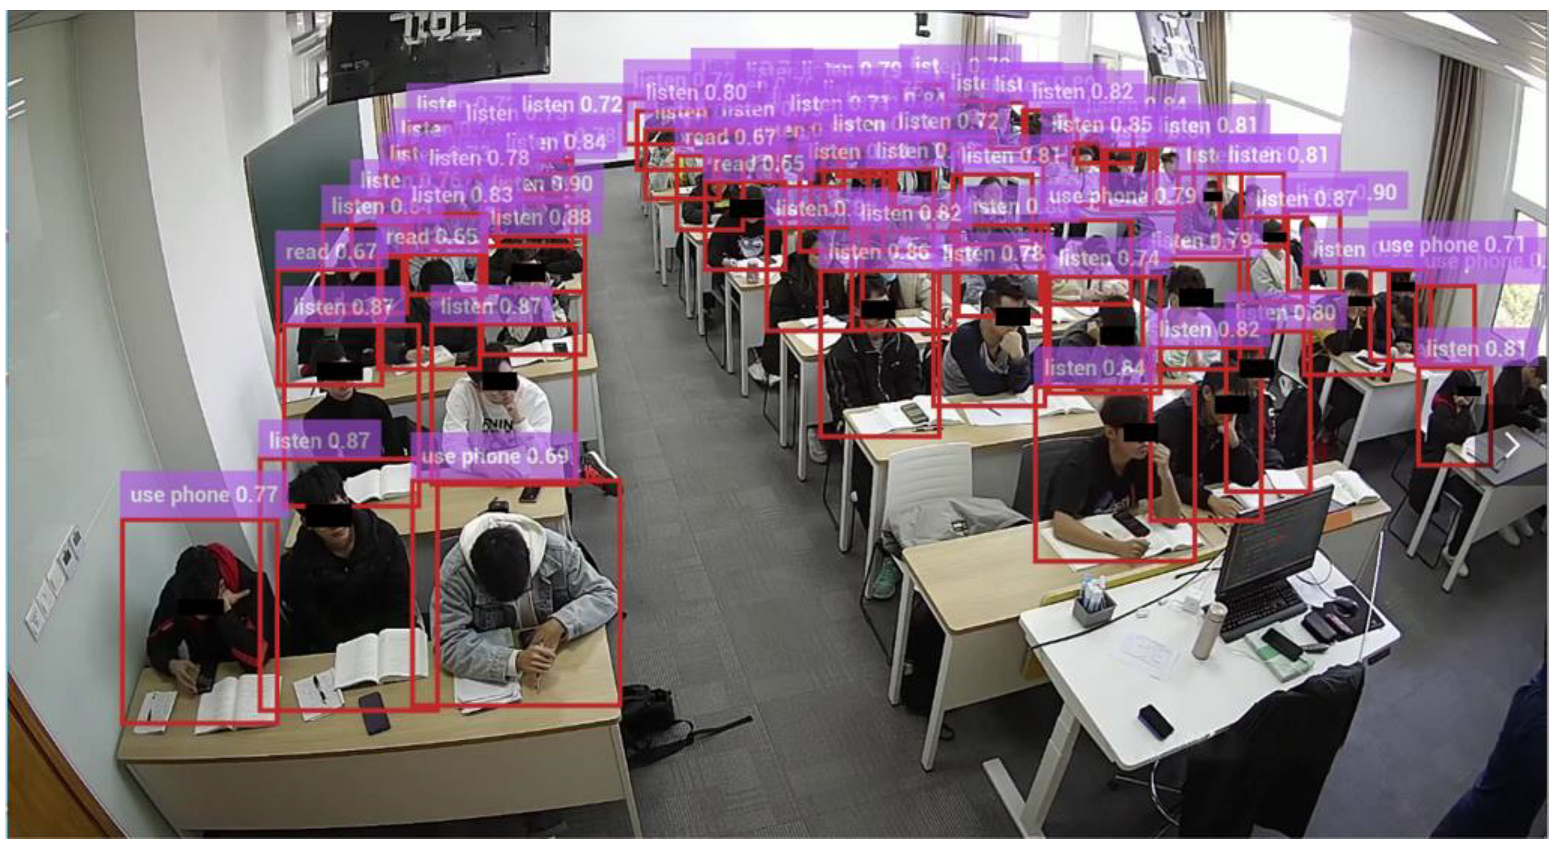
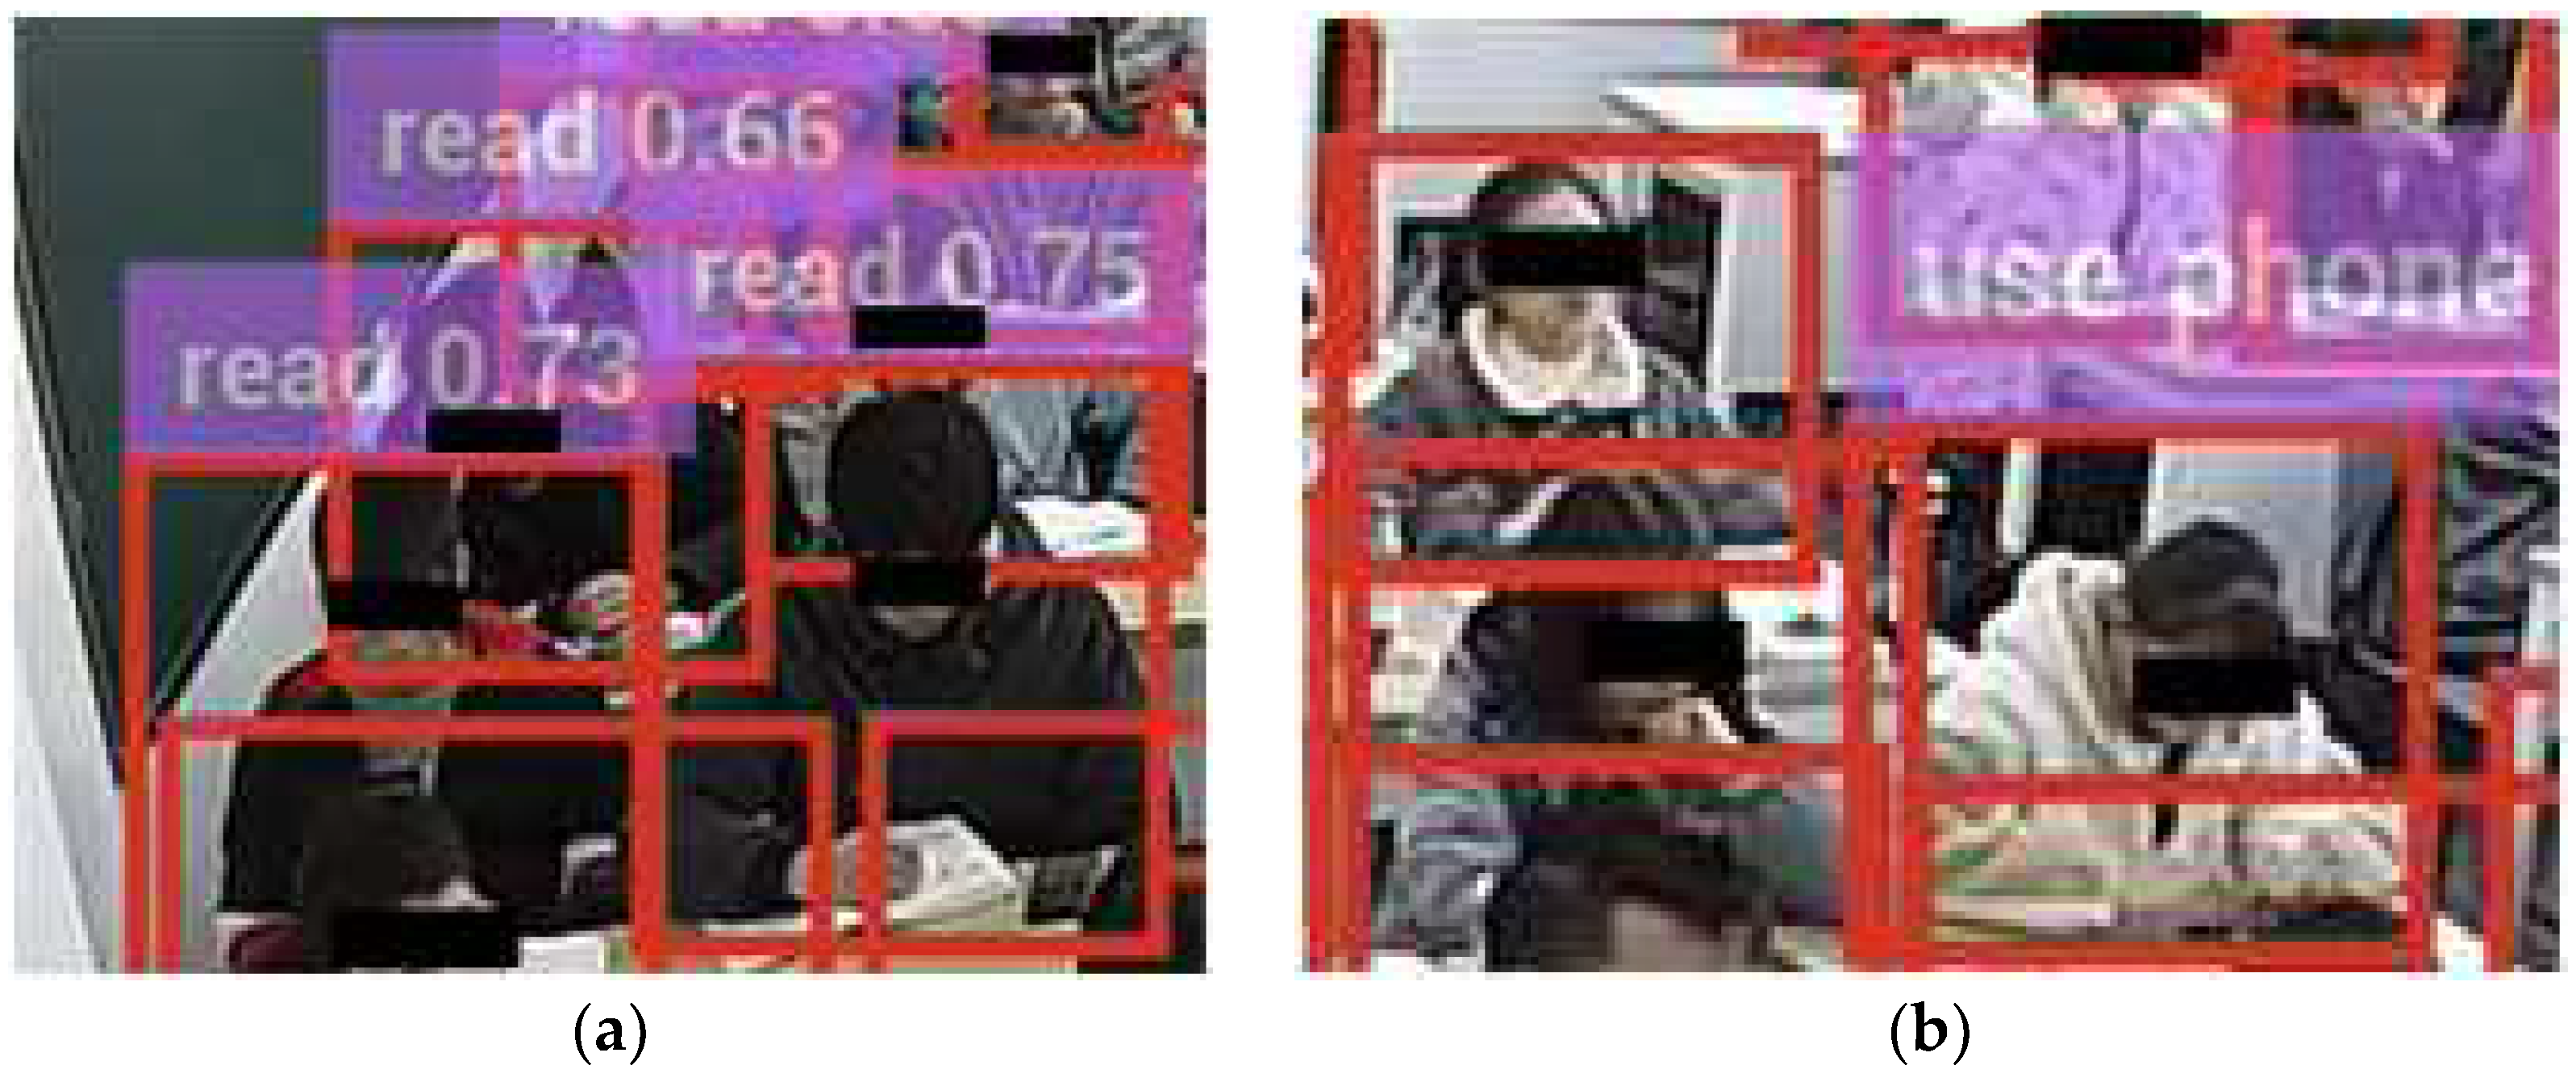
4.3.1. Experimental Results and Analysis of the Student Action Behavior Dataset
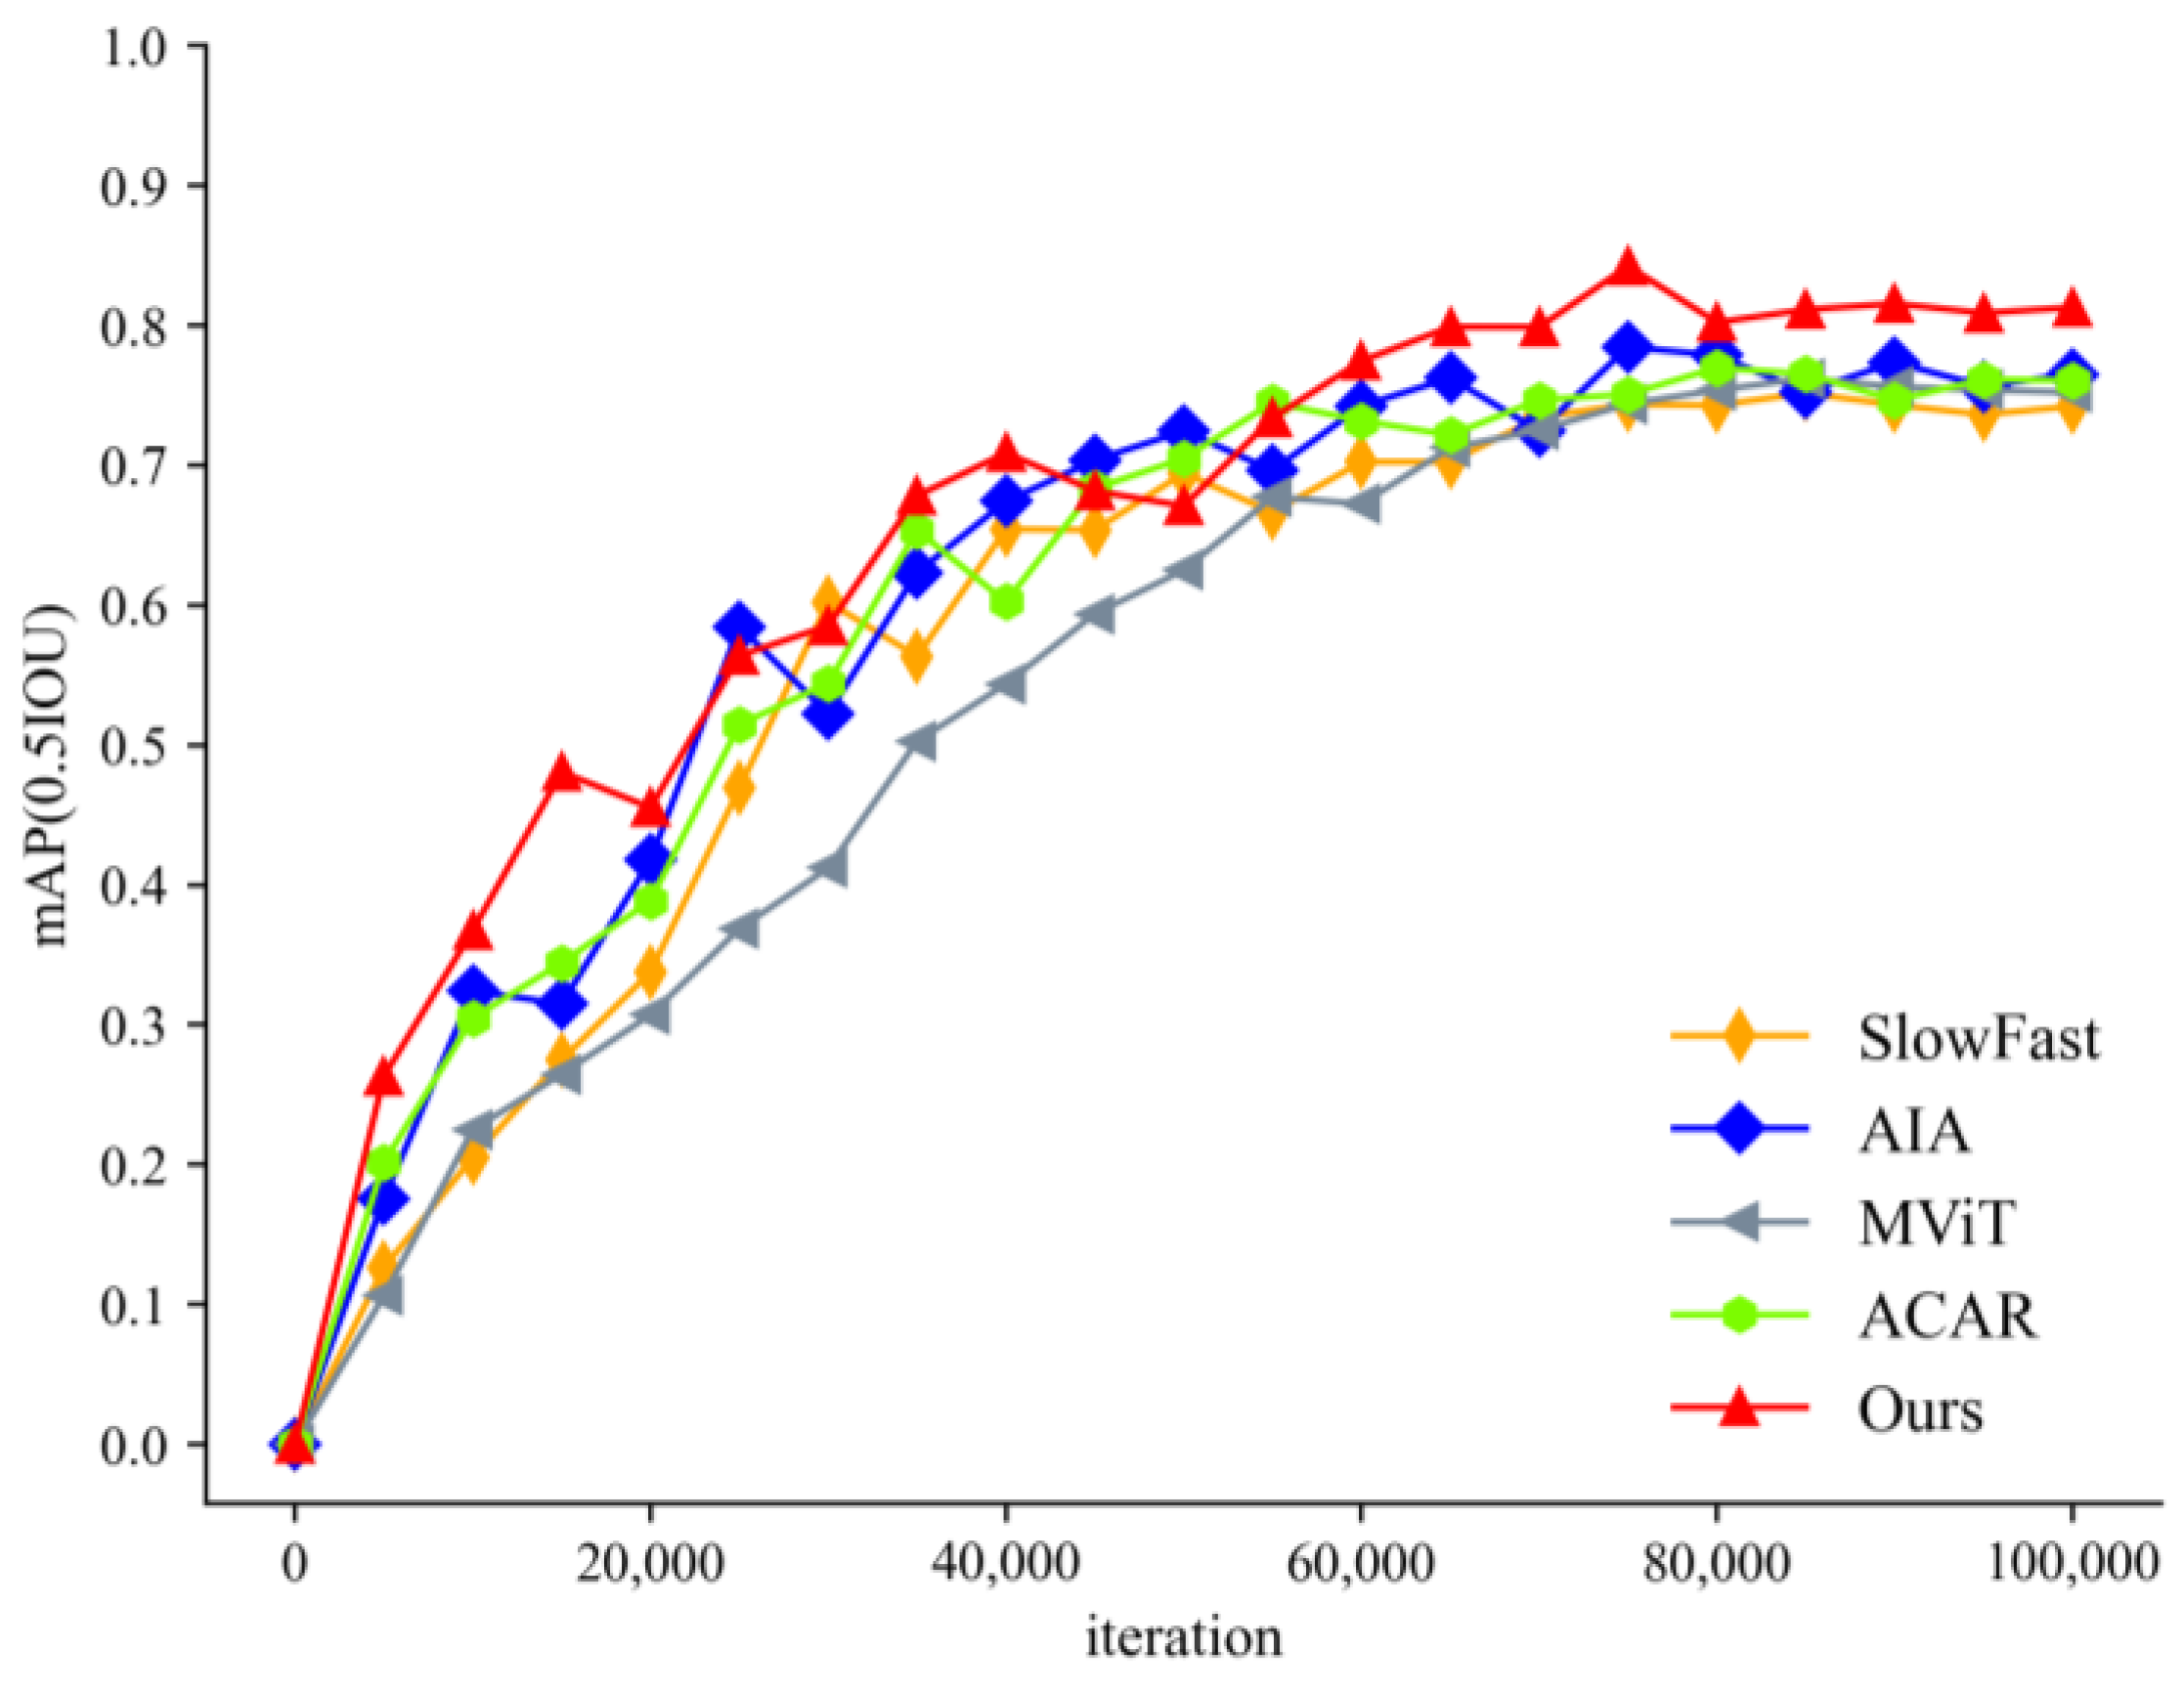
4.3.2. Comparative Experiments and Analysis
4.4. Analysis of Students’ Action Behavior Sequences
5. Conclusions
Author Contributions
Funding
Informed Consent Statement
Data Availability Statement
Conflicts of Interest
References
- Fu, R.; Wu, T.; Luo, Z.; Duan, F.; Qiao, X.; Guo, P.; IEEE. Learning Behavior Analysis in Classroom Based on Deep Learning. In Proceedings of the 10th International Conference on Intelligent Control and Information Processing, Marrakesh, Morocco, 14–19 December 2019; pp. 206–212. [Google Scholar]
- Zhang, Y.; Wang, G. Research on Application of Intelligent Analysis in Monitoring of Classroom Teaching. In Proceedings of the 2021 3rd International Conference on Advances in Computer Technology, Information Science and Communication, Shanghai, China, 23–25 April 2021; pp. 253–257. [Google Scholar]
- Zheng, X.W.; Tang, Y.Y.; Zhou, J.T. A Framework of Adaptive Multiscale Wavelet Decomposition for Signals on Undirected Graphs. IEEE Trans. Signal Process. 2019, 67, 1696–1711. [Google Scholar] [CrossRef]
- Yang, L.; Su, H.L.; Zhong, C.; Meng, Z.Q.; Luo, H.W.; Li, X.C.; Tang, Y.Y.; Lu, Y. Hyperspectral image classification using wavelet transform-based smooth ordering. Int. J. Wavelets Multiresolution Inf. Process. 2019, 17, 1950050. [Google Scholar] [CrossRef]
- Guido, R.C.; Pedroso, F.; Contreras, R.C.; Rodrigues, L.C.; Guariglia, E.; Neto, J.S. Introducing the Discrete Path Transform (DPT) and its applications in signal analysis, artefact removal, and spoken word recognition. Digit. Signal. Process. 2021, 117, 103158. [Google Scholar] [CrossRef]
- Guariglia, E. Primality, Fractality, and Image Analysis. Entropy 2019, 21, 304. [Google Scholar] [CrossRef]
- Bui Ngoc, A.; Ngo Tung, S.; Phan Truong, L.; Le Phuong, C.; Nguyen Huu, T.; Nguyen Cong, D.; Nguyen Huu, T.; Aftab, M.U.; Tran Van, D. A Computer-Vision Based Application for Student Behavior Monitoring in Classroom. Appl. Sci. 2019, 9, 4729. [Google Scholar] [CrossRef]
- Tang, L.; Gao, C.; Chen, X.; Zhao, Y. Pose detection in complex classroom environment based on improved Faster R-CNN. IET Imag. Process. 2019, 13, 451–457. [Google Scholar] [CrossRef]
- Liu, S.; Zhang, J.; Su, W. An improved method of identifying learner’s behaviors based on deep learning. J. Supercomput. 2022, 78, 12861–12872. [Google Scholar] [CrossRef]
- Xie, Y.; Zhang, S.; Liu, Y. Abnormal Behavior Recognition in Classroom Pose Estimation of College Students Based on Spatiotemporal Representation Learning. Trait. Du Signal 2021, 38, 89–95. [Google Scholar] [CrossRef]
- Tang, J.; Xia, J.; Mu, X.; Pang, B.; Lu, C. Asynchronous Interaction Aggregation for Action Detection. In Proceedings of the European Conference on Computer Vision, Glasgow, UK, 23–28 August 2020; pp. 71–87. [Google Scholar]
- Li, B.; Yao, Y.; Tan, J.; Zhang, G.; Yu, F.; Lu, J.; Luo, Y. Equalized Focal Loss for Dense Long-Tailed Object Detection. In Proceedings of the IEEE/CVF Conference on Computer Vision and Pattern Recognition, New Orleans, LA, USA, 18–24 June 2022; pp. 6980–6989. [Google Scholar]
- Feichtenhofer, C.; Fan, H.; Malik, J.; He, K. SlowFast Networks for Video Recognition. In Proceedings of the IEEE/CVF International Conference on Computer Vision, Seoul, Republic of Korea, 27 October–2 November 2019; pp. 6201–6210. [Google Scholar]
- Feichtenhofer, C. X3D: Expanding Architectures for Efficient Video Recognition. In Proceedings of the IEEE/CVF Conference on Computer Vision and Pattern Recognition, Seattle, WA, USA, 14–19 June 2020; pp. 200–210. [Google Scholar]
- Chang, S.; Wang, P.; Wang, F.; Feng, J.; Shou, M.Z. DOAD: Decoupled One Stage Action Detection Network. In Proceedings of the 2023 IEEE/CVF Conference on Computer Vision and Pattern Recognition Workshops, Vancouver, BC, Canada, 17–24 June 2023; pp. 3123–3232. [Google Scholar]
- Fan, H.; Xiong, B.; Mangalam, K.; Li, Y.; Yan, Z.; Malik, J.; Feichtenhofer, C. Multiscale Vision Transformers. In Proceedings of the 18th IEEE/CVF International Conference on Computer Vision, Montreal, BC, Canada, 11–17 October 2021; pp. 6804–6815. [Google Scholar]
- Pan, J.; Chen, S.; Shou, M.Z.; Liu, Y.; Shao, J.; Li, H. Actor-Context-Actor Relation Network for Spatio-Temporal Action Localization. In Proceedings of the IEEE/CVF Conference on Computer Vision and Pattern Recognition, Virtual, 19–25 June 2021; pp. 464–474. [Google Scholar]
- Zheng, Y.D.; Chen, G.; Yuan, M.; Lu, T. MRSN: Multi-Relation Support Network for Video Action Detection. In Proceedings of the 2023 IEEE International Conference on Multimedia and Expo, Brisbane, Australia, 10–14 July 2023; pp. 1026–1031. [Google Scholar]
- Faure, G.J.; Chen, M.H.; Lai, S.H. Holistic Interaction Transformer Network for Action Detection. In Proceedings of the 2023 IEEE/CVF Winter Conference on Applications of Computer Vision, Waikoloa, HI, USA, 2–7 January 2023; pp. 3329–3339. [Google Scholar]
- Zhang, Y.; Zhu, T.; Ning, H.; Liu, Z. Classroom student posture recognition based on an improved high-resolution network. Eurasip J. Wirel. Commun. Netw. 2021, 2021, 140. [Google Scholar] [CrossRef]
- Zhou, J.; Ran, F.; Li, G.; Peng, J.; Li, K.; Wang, Z. Classroom Learning Status Assessment Based on Deep Learning. Math. Probl. Eng. 2022, 2022, 7049458. [Google Scholar] [CrossRef]
- Pang, C. Simulation of student classroom behavior recognition based on cluster analysis and random forest algorithm. J. Intell. Fuzzy Syst. 2021, 40, 2421–2431. [Google Scholar] [CrossRef]
- Ding, Y.; Bao, K.; Zhang, J. An Intelligent System for Detecting Abnormal Behavior in Students Based on the Human Skeleton and Deep Learning. Comput. Intell. Neurosci. 2022, 2022, 3819409. [Google Scholar] [CrossRef]
- Wu, B.; Wang, C.; Huang, W.; Huang, D.; Peng, H. Recognition of Student Classroom Behaviors Based on Moving Target Detection. Traitement Du Signal 2021, 38, 215–220. [Google Scholar] [CrossRef]
- Banerjee, S.; Ashwin, T.S.; Guddeti, R.M.R. Multimodal behavior analysis in computer-enabled laboratories using nonverbal cues. Signal Image Video Process. 2020, 14, 1617–1624. [Google Scholar] [CrossRef]
- Liu, M.; Meng, F.; Wu, Q.; Xu, L.; Liao, Q. Behaviour detection in crowded classroom scenes via enhancing features robust to scale and perspective variations. IET Imag. Process. 2021, 15, 3466–3475. [Google Scholar] [CrossRef]
- Huang, W.; Li, N.; Qiu, Z.; Jiang, N.; Wu, B.; Liu, B. An Automatic Recognition Method for Students’ Classroom Behaviors Based on Image Processing. Traitement Du Signal 2020, 37, 503–509. [Google Scholar] [CrossRef]
- Zheng, Z.; Liang, G.; Luo, H.; Yin, H. Attention assessment based on multi-view classroom behaviour recognition. IET Comput. Vis. 2022. [Google Scholar] [CrossRef]
- Liu, H.; Liu, Y.; Zhang, R.; Wu, X. Student Behavior Recognition From Heterogeneous View Perception in Class Based on 3-D Multiscale Residual Dense Network for the Analysis of Case Teaching. Front. Neurorobotics 2021, 15, 675827. [Google Scholar] [CrossRef]
- Jisi, A.; Yin, S. A new feature fusion network for student behavior recognition in education. J. Appl. Sci. Eng. 2021, 24, 133–140. [Google Scholar]
- He, K.; Gkioxari, G.; Dollar, P.; Girshick, R. Mask R-CNN. In Proceedings of the 16th IEEE International Conference on Computer Vision, Venice, Italy, 22–29 October 2017; pp. 2980–2988. [Google Scholar]
- Ren, S.; He, K.; Girshick, R.; Sun, J. Faster R-CNN: Towards Real-Time Object Detection with Region Proposal Networks. IEEE Trans. Pattern Anal. Mach. Intell. 2017, 39, 1137–1149. [Google Scholar] [CrossRef]
- Vaswani, A.; Shazeer, N.; Parmar, N.; Uszkoreit, J.; Jones, L.; Gomez, A.N.; Kaiser, L.; Polosukhin, I. Attention Is All You Need. In Proceedings of the 31st Annual Conference on Neural Information Processing Systems, Long Beach, CA, USA, 4–9 December 2017. [Google Scholar]
- Chen, Y.; Kalantidis, Y.; Li, J.; Yan, S.; Feng, J. A2-Nets: Double Attention Networks. In Proceedings of the 32nd Conference on Neural Information Processing Systems, Montreal, QC, Canada, 2–8 December 2018. [Google Scholar]
- Li, Y.; Chen, Y.; Wang, N.; Zhang, Z.; IEEE. Scale-Aware Trident Networks for Object Detection. In Proceedings of the IEEE/CVF International Conference on Computer Vision, Seoul, Republic of Korea, 27 October–2 November 2019; pp. 6053–6062. [Google Scholar]
- Ruan, D.; Wang, D.; Zheng, Y.; Zheng, N.; Zheng, M. Gaussian Context Transformer. In Proceedings of the IEEE/CVF Conference on Computer Vision and Pattern Recognition, Nashville, TN, USA, 19–25 June 2021; pp. 15124–15133. [Google Scholar]
- Lin, T.-Y.; Goyal, P.; Girshick, R.; He, K.; Dollar, P. Focal Loss for Dense Object Detection. IEEE Trans. Pattern Anal. Mach. Intell. 2020, 42, 318–327. [Google Scholar] [CrossRef]
- Zheng, Z.; Wang, P.; Liu, W.; Li, J.; Ye, R.; Ren, D.; Assoc Advancement Artificial, I. Distance-IoU Loss: Faster and Better Learning for Bounding Box Regression. In Proceedings of the 34th AAAI Conference on Artificial Intelligence/32nd Innovative Applications of Artificial Intelligence Conference/10th AAAI Symposium on Educational Advances in Artificial Intelligence, New York, NY, USA, 7–12 February 2020; pp. 12993–13000. [Google Scholar]
- Gu, C.; Sun, C.; Ross, D.A.; Vondrick, C.; Pantofaru, C.; Li, Y.; Vijayanarasimhan, S.; Toderici, G.; Ricco, S.; Sukthankar, R.; et al. AVA: A Video Dataset of Spatio-temporally Localized Atomic Visual Actions. In Proceedings of the 31st IEEE/CVF Conference on Computer Vision and Pattern Recognition, Salt Lake City, UT, USA, 18–23 June 2018; pp. 6047–6056. [Google Scholar]
- Kalogeiton, V.; Weinzaepfel, P.; Ferrari, V.; Schmid, C. Action Tubelet Detector for Spatio-Temporal Action Localization. In Proceedings of the 16th IEEE International Conference on Computer Vision, Venice, Italy, 22–29 October 2017; pp. 4415–4423. [Google Scholar]
- Yang, X.; Yang, X.; Liu, M.-Y.; Xiao, F.; Davis, L.; Kautz, J.; Soc, I.C. STEP: Spatio-Temporal Progressive Learning for Video Action Detection. In Proceedings of the 32nd IEEE/CVF Conference on Computer Vision and Pattern Recognition, Long Beach, CA, USA, 16–20 June 2019; pp. 264–272. [Google Scholar]
- Tan, J.R.; Lu, X.; Zhang, G.; Yin, C.Q.; Li, Q.Q. Equalization Loss v2: A New Gradient Balance Approach for Long-tailed Object Detection. In Proceedings of the IEEE/CVF Conference on Computer Vision and Pattern Recognition, Virtual, 19–25 June 2021; pp. 1685–1694. [Google Scholar]


| Model | Pretrain | mAP% |
|---|---|---|
| SlowFast, R101-NL | Kinetics-600 | 29.0 |
| X3D | Kinetics-600 | 27.4 |
| AIA | Kinetics-700 | 31.2 |
| ACAR | Kinetics-700 | 31.9 |
| MRSN | Kinetics-700 | 33.5 |
| DOAD | Kinetics-700 | 28.5 |
| HIT | Kinetics-700 | 32.6 |
| Ours | Kinetics-700 | 32.0 |
| Model | Input | mAP% |
|---|---|---|
| ACT | V | 69.5 |
| STEP | V + F | 75.0 |
| AIA | V | 81.7 |
| ACAR | V | 84.3 |
| MESN | V | 80.3 |
| DOAD | V | 74.8 |
| HIT | V | 84.8 |
| Ours | V | 82.2 |
| Model | Precision% | Recall% | mAP% |
|---|---|---|---|
| AIA | 78.4 | 77.6 | 76.5 |
| AIA + MsTA | 81.5 | 78.3 | 79.4 |
| AIA + MsCSA | 79.2 | 78.5 | 77.8 |
| AIA + EQLv2 | 80.3 | 78.2 | 78.8 |
| AIA + EFL | 82.7 | 79.1 | 80.2 |
| AIA + MsTA + MsCSA + EQLv2 | 82.2 | 78.8 | 80.1 |
| AIA + MsTA + MsCSA + EFL (Ours) | 83.9 | 80.4 | 81.3 |
| Model | Pretrain | mAP% |
|---|---|---|
| SlowFast | Kinetics-600 | 74.2 |
| AIA | Kinetics-700 | 76.5 |
| MViT | Kinetics-600 | 75.2 |
| ACAR | Kinetics-700 | 76.1 |
| Ours | Kinetics-700 | 81.3 |
| Seat | 10 s | 20 s | 30 s | 40 s | 50 s | 60 s | 70 s | 80 s | 90 s | 100 s | 110 s |
|---|---|---|---|---|---|---|---|---|---|---|---|
| −2 | −2 | 3 | 3 | 3 | 3 | 3 | 3 | 3 | 3 | 3 | |
| 1 | −2 | −2 | 3 | 1 | 3 | 3 | 3 | 3 | 3 | 3 | |
| 1 | 3 | −4 | 3 | 3 | 3 | 3 | 3 | 3 | 3 | 3 | |
| −4 | −4 | 1 | 1 | 3 | 3 | −4 | −4 | 3 | 3 | 3 | |
| 3 | 3 | 3 | 3 | 3 | 3 | 3 | 3 | 3 | 3 | 1 | |
| −1 | 3 | −2 | −2 | −2 | −2 | −2 | −2 | −2 | −2 | −2 |
Disclaimer/Publisher’s Note: The statements, opinions and data contained in all publications are solely those of the individual author(s) and contributor(s) and not of MDPI and/or the editor(s). MDPI and/or the editor(s) disclaim responsibility for any injury to people or property resulting from any ideas, methods, instructions or products referred to in the content. |
© 2023 by the authors. Licensee MDPI, Basel, Switzerland. This article is an open access article distributed under the terms and conditions of the Creative Commons Attribution (CC BY) license (https://creativecommons.org/licenses/by/4.0/).
Share and Cite
Shou, Z.; Yan, M.; Wen, H.; Liu, J.; Mo, J.; Zhang, H. Research on Students’ Action Behavior Recognition Method Based on Classroom Time-Series Images. Appl. Sci. 2023, 13, 10426. https://doi.org/10.3390/app131810426
Shou Z, Yan M, Wen H, Liu J, Mo J, Zhang H. Research on Students’ Action Behavior Recognition Method Based on Classroom Time-Series Images. Applied Sciences. 2023; 13(18):10426. https://doi.org/10.3390/app131810426
Chicago/Turabian StyleShou, Zhaoyu, Mingbang Yan, Hui Wen, Jinghua Liu, Jianwen Mo, and Huibing Zhang. 2023. "Research on Students’ Action Behavior Recognition Method Based on Classroom Time-Series Images" Applied Sciences 13, no. 18: 10426. https://doi.org/10.3390/app131810426
APA StyleShou, Z., Yan, M., Wen, H., Liu, J., Mo, J., & Zhang, H. (2023). Research on Students’ Action Behavior Recognition Method Based on Classroom Time-Series Images. Applied Sciences, 13(18), 10426. https://doi.org/10.3390/app131810426