Article

WAID: A Large-Scale Dataset for Wildlife Detection with Drones

1
School of Information Science and Technology, Beijing Forestry University, Beijing 100083, China
2
Engineering Research Center for Forestry-Oriented Intelligent Information Processing of National Forestry and Grassland Administration, Beijing 100083, China
*
Author to whom correspondence should be addressed.
Appl. Sci. 2023, 13(18), 10397; https://doi.org/10.3390/app131810397
Submission received: 29 August 2023 / Revised: 12 September 2023 / Accepted: 15 September 2023 / Published: 17 September 2023
(This article belongs to the Special Issue Deep Learning in Drone Detection)

Abstract

:
Drones are widely used for wildlife monitoring. Deep learning algorithms are key to the success of monitoring wildlife with drones, although they face the problem of detecting small targets. To solve this problem, we have introduced the SE-YOLO model, which incorporates a channel self-attention mechanism into the advanced real-time object detection algorithm YOLOv7, enabling the model to perform effectively on small targets. However, there is another barrier; the lack of publicly available UAV wildlife aerial datasets hampers research on UAV wildlife monitoring algorithms. To fill this gap, we present a large-scale, multi-class, high-quality dataset called WAID (Wildlife Aerial Images from Drone), which contains 14,375 UAV aerial images from different environmental conditions, covering six wildlife species and multiple habitat types. We conducted a statistical analysis experiment, an algorithm detection comparison experiment, and a dataset generalization experiment. The statistical analysis experiment demonstrated the dataset characteristics both quantitatively and intuitively. The comparison and generalization experiments compared different types of advanced algorithms as well as the SE-YOLO method from the perspective of the practical application of UAVs for wildlife monitoring. The experimental results show that WAID is suitable for the study of wildlife monitoring algorithms for UAVs, and SE-YOLO is the most effective in this scenario, with a mAP of up to 0.983. This study brings new methods, data, and inspiration to the field of wildlife monitoring by UAVs.

1. Introduction

With the impacts of global climate change and habitat loss, wild animals are facing unprecedented threats to their survival [1,2]. For instance, rising temperatures, increased extreme weather events, and rising sea levels all pose threats to the survival of wildlife [1]. The global urbanization and agricultural expansion have led to large-scale habitat destruction and loss. This has deprived many wild animals of places to live and breed [2]. Moreover, the decline of biodiversity has also exacerbated human concerns about environmental sustainability [3]. As a result, the issue of wildlife conservation has received extensive international attention [4]. In this context, governments and international organizations have taken various initiatives in an attempt to curb the decline of wildlife populations and to improve the efficiency of conservation through the use of scientific and technological means [1].
In recent years, aerial imagery has been extensively utilized in wildlife conservation due to the fast-paced evolution of drones and other aerial platforms [5]. Moreover, Unmanned Aerial Vehicles (UAVs) offer several advantages in aerial imagery due to their high altitude and ability to carry high-resolution camera payloads. Aerial imagery can, therefore, provide humans with valuable information in complex and harsh natural environments in a relatively short period of time [6]. For instance, high-resolution aerial photographs can accurately identify wildlife categories and population numbers, facilitating wildlife population counts and assessments of their endangerment levels [7]. Similarly, aerial photographs with broader coverage can detect wildlife in remote or otherwise inaccessible areas [8]. The wide field of view is advantageous as it enables the aerial images to observe a large area, covering several square kilometers, while simultaneously detecting individuals and groups of animals that are otherwise difficult to access [9]. Various methods have been explored for detecting wildlife on aerial images, including target detection algorithms, semantic segmentation algorithms, and deep learning methods [10,11,12,13,14]. For instance, Barbedo et al. [11] used convolutional neural networks to monitor herds of cattle with drones. Brown et al. [12] employed high-resolution UAV images to establish an accurate ground truth. They utilized a target detection-based method using YOLOv5 to achieve animal localization and counting on Australian farms. Similarly, Padubidri et al. [14] counted sea lions and African elephants in aerial images by utilizing a UNet model based on semantic segmentation. Furthermore, wildlife detection using deep learning techniques and aerial imagery can rapidly locate wildlife, aiding in the planning of effective protection and search activities [15]. Additionally, it can determine the living conditions of wildlife in dangerous and complex natural habitats such as swamps and forests [16]. In a word, deep learning models, such as YOLO, have emerged as a significant approach in UAV aerial imagery-based applications for wildlife detection.
The success of deep learning in wildlife detection with drones relies on having a large amount of real-world data available for training algorithms [17]. For example, training on large datasets like ImageNet [18] and MSCOCO [19] was then followed by transfer learning on actual data. Unfortunately, the extremely high cost of acquiring high-quality aerial images makes obtaining real transfer learning data challenging, not to mention constructing large-scale aerial wildlife datasets. That is to say, due to the lack of large-scale aerial wildlife image datasets, most current methods involve adapting object detection algorithms developed for natural scene images to aerial images, which is not suitable for wildlife detection [20]. These challenges contribute to the current shortcomings of drone-based wildlife detection algorithms, including low accuracy, weak robustness, and unsatisfactory practical application outcomes [21,22]. To fill this gap, we introduce a novel and extensive aerial wildlife detection public dataset called WAID (Wildlife Aerial Images from Drone), aimed at aiding researchers in developing drone-based wildlife detection algorithms.
In addition, the data of wildlife captured by drones have unique characteristics. As can be seen from Figure 1, the individual animals in aerial images are small and the proportion varies greatly. This arises not only from differences in drone flight altitudes but also relates to inherent variations in object sizes within the same category. Therefore, it is necessary to overcome the small target problem when using drones to detect wildlife [23]. Currently, researchers have invested substantial efforts in enhancing the accuracy of algorithms for detecting these small targets, but few of them focus on wildlife aerial imagery applications [24]. For instance, Chen et al. [25] proposed an approach that combines contextual models and small region proposal generators to enhance the R-CNN algorithm, thereby improving the detection of small objects in images. Zhou et al. [26] introduced a scale-transferable detection network that maintains scale consistency between different detection scales through embedded super-resolution layers, enhancing the detection of multi-scale objects in images. However, although the above work has improved the effect of small target detection to a certain extent, challenges remain, including limited real-time performance, high computational demands, information redundancy, and complex network structures.
On the one hand, to address real-time wildlife detection, researchers often employ one-stage YOLO methods [27]. For example, Zhong et al. [28] used the YOLO method to monitor marine animal populations, demonstrating that YOLO can rapidly and accurately identify marine animals within coral reefs. Roy et al. [29] proposed a high-performance YOLO-based automatic detection model for real-time detection of endangered wildlife. Although advanced versions like YOLOv7 [30] have started addressing multi-scale detection issues, they still struggle with the highly dynamic scenes encountered in drone aerial imagery [31]. On the other hand, researchers have also turned their attention to attention mechanisms to address the small target detection problem. These mechanisms guide the model to focus on critical feature regions of the target, leading to more accurate localization of small objects and reduced computational resource consumption [32]. For instance, Wang et al. [33] introduced a pre-detection concept based on attention mechanisms into the model, which restricts the detection area in images based on the characteristics of small object detection. This reduces redundant information and improves the efficiency of small target detection. Zuo et al. [34] proposed an attention-fused feature pyramid network to address the issue of potential target loss in deep network structures. Their adaptive attention fusion module enhances the spatial positions and semantic information features of infrared small targets in shallow and deep layers, enhancing the network’s ability to represent target features. Zhu et al. [35] introduced a lightweight small target detection network with embedded attention mechanisms. This enhances the network’s ability to focus on regions of interest in images while maintaining a lightweight network structure, thereby improving the detection of small targets in complex backgrounds. These studies indicate that incorporating attention mechanisms into models is beneficial for effectively fusing features from different levels and enhancing the detection efficiency and capabilities of small targets. Notably, channel attention mechanisms hold advantages in small target detection [36,37]. Channel attention mechanisms better consider information from different channels, focusing on various dimensions of small targets and effectively capturing their features [38]. Moreover, since channel attention mechanisms are unaffected by spatial dimensions, they might be more stable when handling targets with different spatial distributions [39]. This can enhance robustness when dealing with targets of varying sizes, positions, and orientations.
To this end, in this study, we introduce the SE (Squeeze-and-Excitation) channel attention mechanism into the one-stage detection network YOLOv7, namely SE-YOLO, enhancing the small target detection performance in complex backgrounds through the fusion of different features of small targets at different scales. The SE-YOLO model achieves the best performance about 0.983 on mAP, 0.969 on recall, and 0.978 on precision, respectively. In particular, the recognition performance for minimal targets with 20–50 pixel points achieves 0.926, 0.894, and 0.929 in terms of mAP, recall, and precision, respectively. The results demonstrate that SE-YOLO is suitable for wildlife detection in drone scenarios. Moreover, the WAID dataset is public at https://github.com/xiaohuicui/WAID (accessed on 12 September 2023).
In summary, the contribution of this study is threefold:
  • By incorporating the SE modules into the YOLO model, we propose a model called SE-YOLO suitable for wildlife detection in aerial imagery, which improves the accuracy of small wildlife targets in natural environments.
  • The SE-YOLO model achieves a mAP of 0.983 on the WAID dataset, and in particular, the recognition performance for minimal targets with 20–50 pixel points reaches 0.926, 0.894, and 0.929 in terms of mAP, recall, and precision, respectively, indicating that SE-YOLO is particularly suitable for the problem of wildlife monitoring in the wild perspective of aerial photography from a UAV.
  • To address the scarcity of aerial wildlife datasets in photography, the first valuable open multi-category aerial wildlife image dataset, WAID, has been made available to all researchers for free download from https://github.com/xiaohuicui/WAID (accessed on 12 September 2023). This contributes to the advancement of the academic community of unmanned aerial wildlife monitoring.

2. Related Work

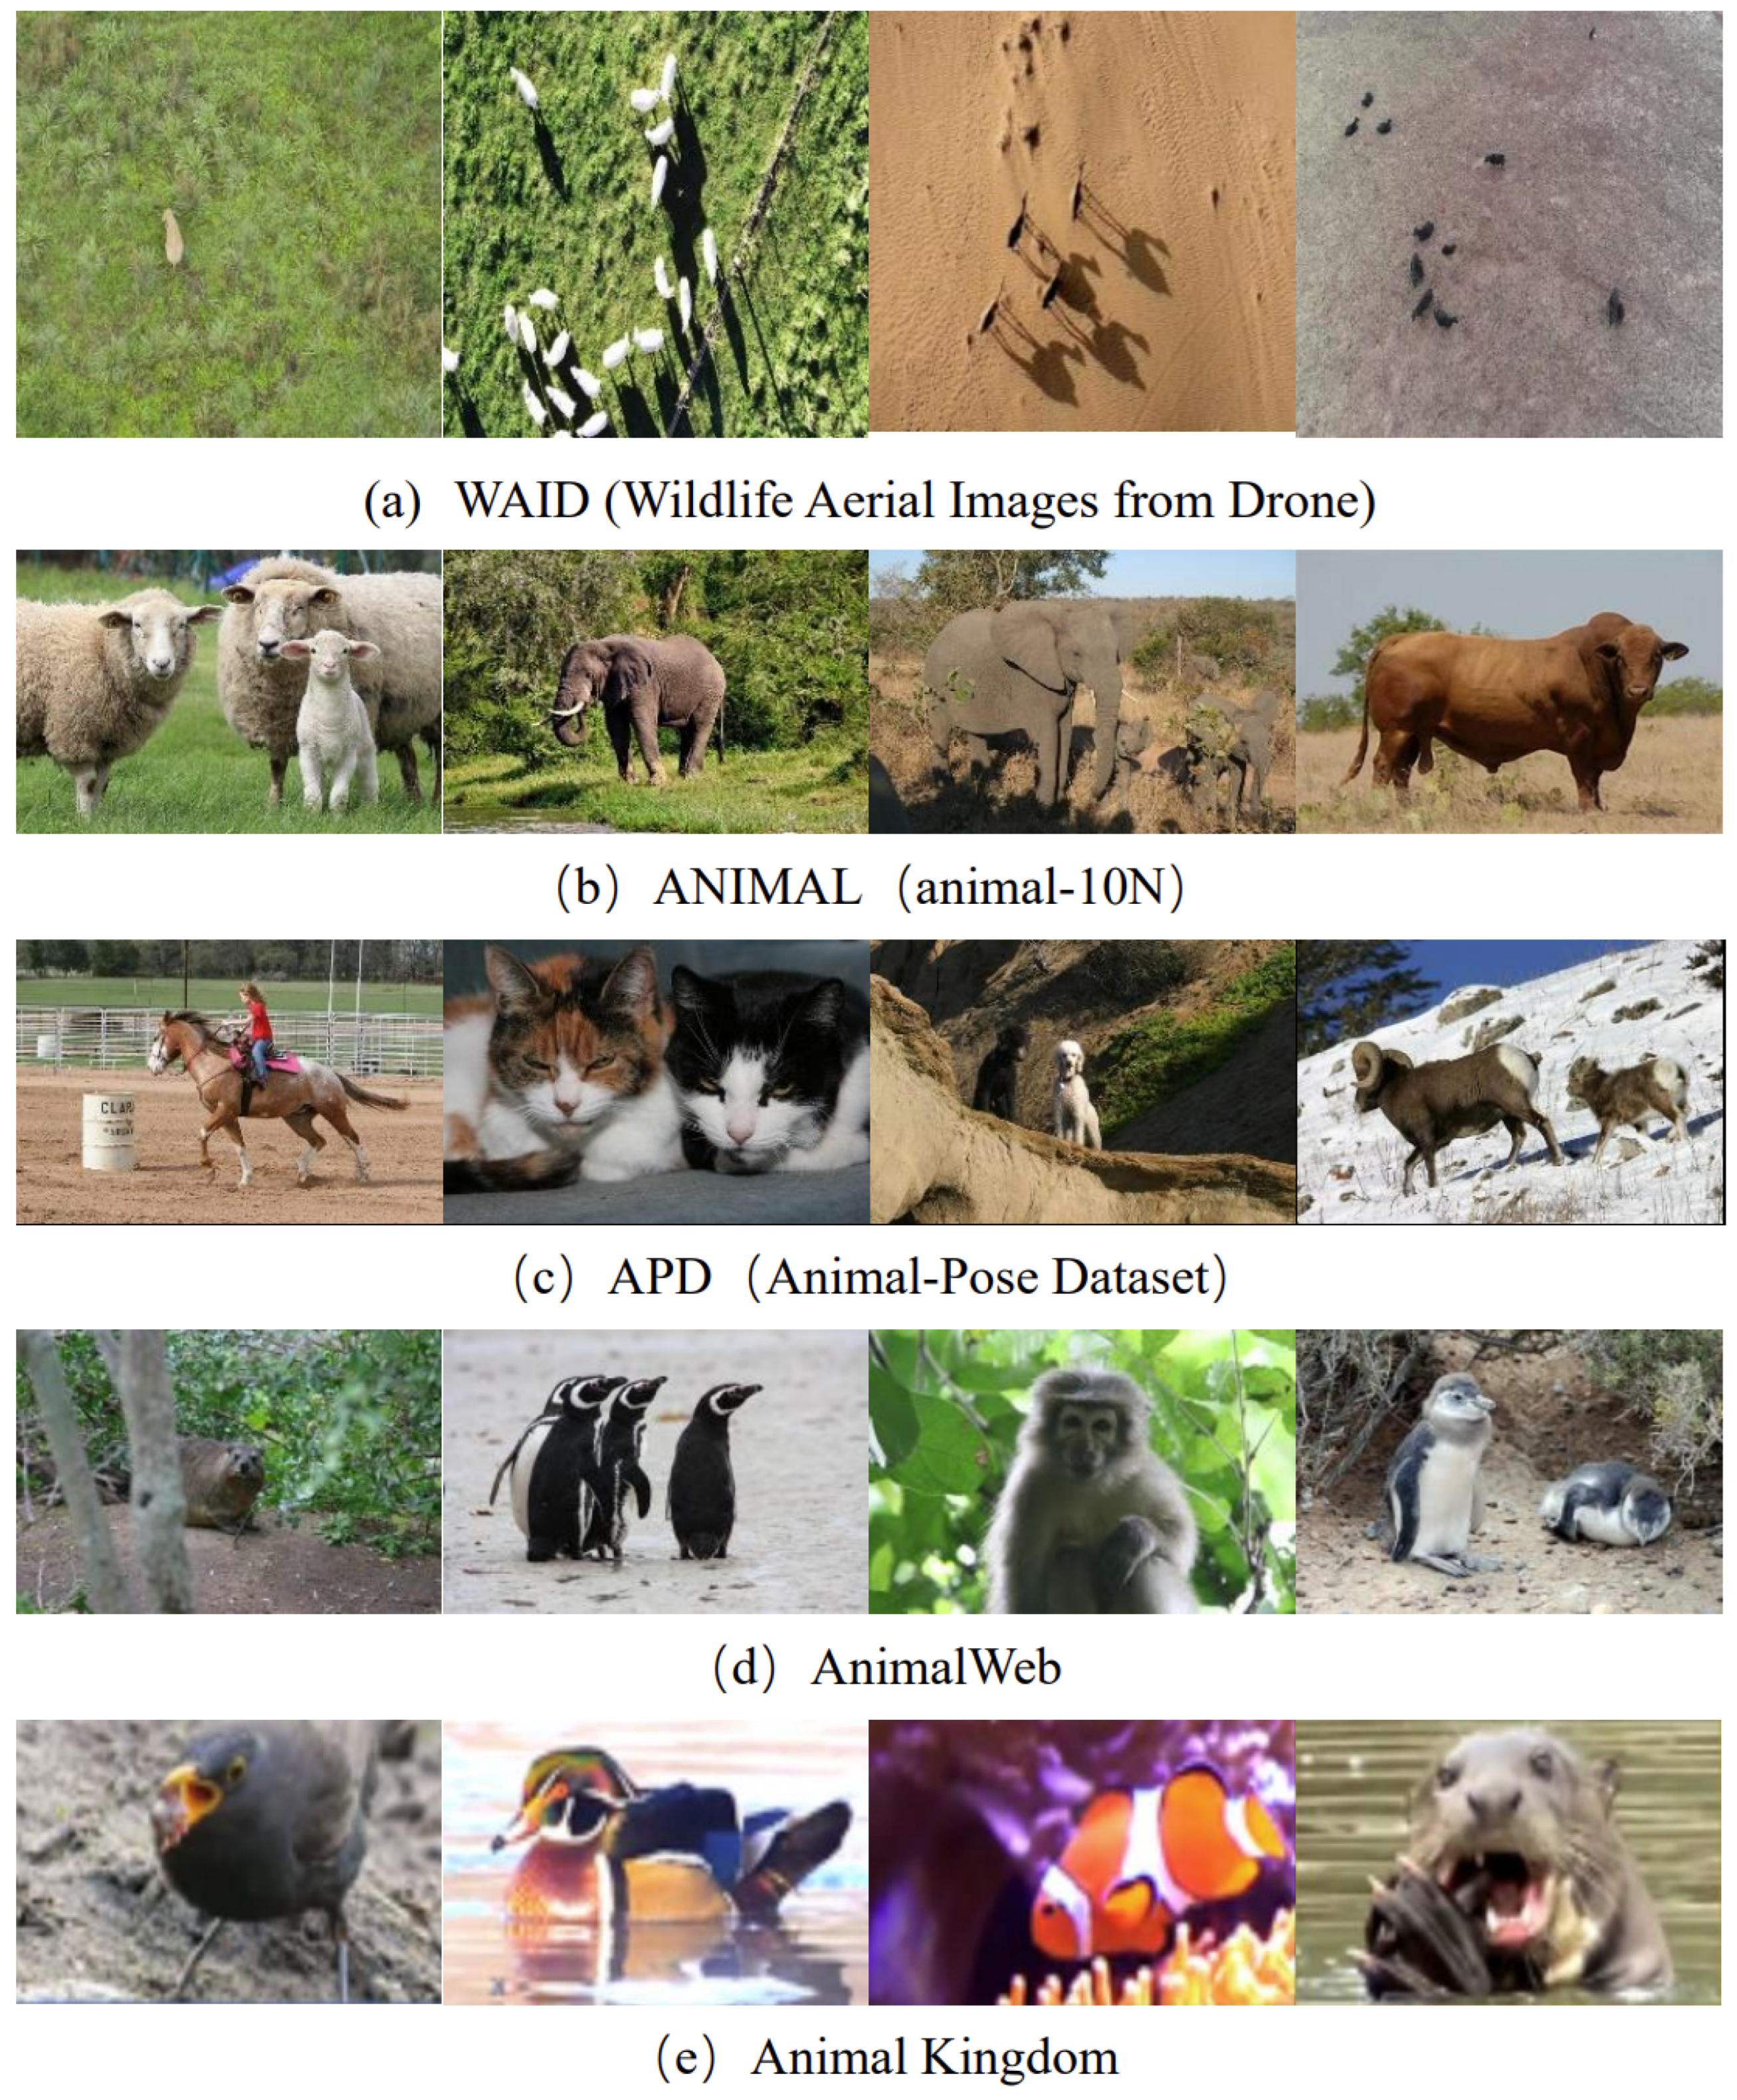
2.1. Diverse Datasets for Wildlife Detection

Currently, there are numerous publicly available animal datasets based on ground images as shown in Table 1. As seen from Table 1, Song et al. [40] introduced the Animal10N dataset, containing 55,000 images from five pairs of animals: (cat, lynx), (tiger, cheetah), (wolf, coyote), (gorilla, chimpanzee), and (hamster, guinea pig). The training set comprises 50,000 images, whereas the test set has 5000 images. Ng et al. [41] presented the Animal Kingdom dataset, a vast and diverse collection offering annotated tasks to comprehensively understand natural animal behavior. It includes 50 h of annotated videos for locating relevant animal behavior segments in lengthy videos, 30 K video sequences for fine-grained multi-label action recognition tasks, and 33 K frames for pose estimation tasks across 850 species of six major animal phyla. Cao et al. [42] introduced the Animal-Pose dataset for animal pose estimation, covering five categories: dogs, cats, cows, horses, and sheep, with over 6000 instances from 4000+ images. Additionally, it provides bounding box annotations for seven animal categories: otter, lynx, rhinoceros, hippopotamus, gorilla, bear, and antelope. AnimalWeb [43] is a large-scale, hierarchically annotated animal face dataset, encompassing 22.4 K faces from 350 species and 21 animal families. These facial images were captured in the wild under field conditions and annotated with nine key facial landmarks consistently across the dataset. However, these existing datasets may not sufficiently support the demands of comprehensive aerial wildlife monitoring. For instance, the Animal10 dataset focuses on animal detection rather than wildlife detection in natural environments. The Animal Kingdom and Animal-Pose datasets were not specifically designed for wildlife detection in drone aerial images.
In addition, most publicly available aerial image datasets are concentrated in urban areas and primarily used for tasks like building detection, vehicle detection or segmentation, and road planning [44,45,46]. However, to the best of the author’s knowledge, there are only a few public datasets available for animal detection in aerial images, such as the NOAA Arctic Seal dataset [47] and the Aerial Elephant Dataset (AED) [48]. The NOAA Arctic Seal dataset comprises approximately 80,000 color and infrared (thermal) images, collected during flights conducted by the NOAA Alaska Fisheries Science Center in Alaska in 2019. The images are annotated with around 28,000 ice seal bounding boxes (14,000 on color images and 14,000 on thermal images). The AED is a challenging dataset containing 2074 images, including a total of 15,581 African forest elephants in their natural habitat. The imaging was conducted with consistent methods across a range of background types, resolutions, and times of day. However, these datasets are annotated specifically for certain species. In addition to this, there are a number of small-scale aerial wildlife datasets (e.g., elephants or camels) available on data collection platforms (e.g., rebowflow). In summary, there are three limitations to the current aerial wildlife detection datasets. First, the current aerial wildlife datasets are small in size and not species-rich. Second, these datasets often suffer from limited image quantity and inconsistent annotation quality. Third, there are no open-source, large-scale, high-quality wildlife aerial photography datasets yet. In summary, the current aerial wildlife datasets, these limitations have restricted their applicability in diverse wildlife monitoring scenarios.
Figure 2 shows partial images from WAID in comparison to these datasets. Our WAID dataset contains 14,375 drone aerial images from a variety of geographic locations and environmental conditions, covering six wildlife species (sheep, cattle, seals, camels, Tibetan wild asses, and zebras) and a variety of habitat types (deserts, grasslands, and sandy beaches, etc.). It is the largest and most species-rich publicly available wildlife aerial photography dataset, which addresses the limitations of aerial wildlife datasets that are small in size and not species-rich. In addition, the WAID dataset has accurate box-level labeling, with wildlife in the images accurately labeled, including species classification and location bounding boxes. Each animal target has been manually confirmed, with an average labeling time of over 3 min. High-quality image annotation helps researchers to detect and identify wildlife more accurately [49] and helps us to address the limitation of poor annotation quality of existing aerial wildlife datasets. Meanwhile, we release freely the WAID dataset to address the limitation of the scarcity of existing datasets. The open-source dataset means that any researcher can access and use the data for free without worrying about copyright issues. WAID provides multiple types of image data, enabling researchers to develop more accurate, general, and robust algorithms, and serves as a public benchmark, which can greatly lower the research threshold of wildlife detection algorithms, enabling more researchers to join the cause of wildlife conservation [50]. Taken together, these motivate us to propose a large public dataset for the researchers of wildlife monitoring using drones.

2.2. Object Detection Methods

2.2.1. Single-Stage Object Detection Method

Single-stage object detection methods refer to those that require only one feature extraction process to achieve object detection. Compared to multi-stage detection methods, single-stage methods are faster in terms of speed, although they might have slightly lower accuracy. Some typical single-stage object detection methods include the YOLO series, SSD, and RefineDet. The YOLO model was initially introduced by Redmon et al. [51] in 2015. Its core idea is to divide the image into S*S grids, and each grid is responsible for predicting and generating multiple bounding boxes if the center point of the object is within that grid. However, during training, each bounding box is allowed to predict only one object, limiting its ability to detect multiple objects and thus affecting detection accuracy. Nonetheless, it significantly improves detection speed. Shortly after the publication of the YOLO model, the SSD model was also introduced [52]. SSD uses VGG16 [53] as its backbone network and does not generate candidate boxes. Instead, it allows feature extraction at multiple scales. The SSD algorithm trains the model using a weighted combination of data augmentation, localization loss, and confidence loss, resulting in fast speeds. However, due to its challenging training process, its accuracy is relatively lower. In 2018, Ref. [54] proposed the RefineDet detection algorithm. This algorithm comprises the ARM module, TCB module, and ODM module. The ARM module focuses on refining anchor boxes, reducing the proportion of negative samples, and adjusting the size and position of anchor boxes to provide better results for regression and classification. The TCB module transforms the output of the ARM into the input of ODM, achieving the fusion of high-level semantic information and low-level feature information. RefineDet uses two-stage regression to improve object detection accuracy and achieve end-to-end multi-task training.

2.2.2. Two-Stage Object Detection Method

Compared to single-stage detectors, two-stage object detection algorithms divide the detection process into two main steps: region proposal generation and object classification. The advantage of this approach lies in its ability to select multiple candidate boxes, effectively extracting feature information from targets, resulting in high-precision detection and accurate localization. However, due to the involvement of two independent steps, this can lead to slower detection speeds and more complex models. Girshick et al. [55] introduced the classic R-CNN algorithm, which employed a “Region Proposal + CNN” approach to feature extraction, opening the door for applying deep learning to object detection and laying the foundation for subsequent algorithms. Subsequently, He et al. [56] introduced the SPP-Net algorithm to address the time-consuming feature extraction process in R-CNN. To further improve upon the drawbacks of R-CNN and SPP-Net, Girshick [57] proposed the Fast R-CNN algorithm. Fast R-CNN combined the advantages of R-CNN and SPP-Net, but still did not achieve end-to-end object detection. In 2015, Ren et al. [58] introduced the Faster R-CNN algorithm, which was the first deep learning-based detection algorithm that approached real-time performance. Faster R-CNN introduced Region Proposal Networks (RPNs) to replace traditional Selective Search algorithms for generating proposals. Although Faster R-CNN surpassed the speed limitations of Fast R-CNN, there still remained issues of computational redundancy in the subsequent detection stage. The algorithm continued to use ROI Pooling layers, which could lead to reduced localization accuracy in object detection. Furthermore, Faster R-CNN’s performance in detecting small objects was subpar. Various improvements were subsequently proposed, such as R-FCN [59] and Light-Head R-CNN [60], which further enhanced the performance of Faster R-CNN.

2.3. Gated Channel Attention Mechanism

Incorporating attention mechanisms into neural networks offers various methods, and taking convolutional neural networks (CNNs) as an example, attention can be introduced in the spatial dimension, as well as in the channel dimension. For instance, in the Inception [61] network, the multi-scale approach assigns different weights to parallel convolutional layers, offering an attention-like mechanism. Attention can also be introduced in the channel dimension [62], and it is possible to combine both spatial and channel attention mechanisms [63]. The channel attention mechanism focuses on the differences in importance among channels within a convolutional layer, adjusting the weights of channels to enhance feature extraction. On the other hand, the spatial attention mechanism builds upon the channel attention concept, suggesting that the importance of each pixel in different channels varies. By adjusting the weights of all pixels across different channels, the network’s feature extraction capabilities are enhanced.
When applied to small object detection in aerial images, the channel attention mechanism is considered more suitable and has seen substantial research in enhancing small object detection while also addressing model complexity. For example, Wang et al. [64] addressed the trade-off between model detection performance and complexity by proposing an efficient channel attention module (ECA), which introduces a small number of parameters but yields significant performance improvements. Tong et al. [65] introduced a channel attention-based DenseNet network that rapidly and accurately captures key features from images, thus improving the classification of remote sensing image scenes. To tackle the issue of low recognition rates and high miss rates in current object detection tasks, Yang et al. [66] proposed an improved YOLOv3 algorithm incorporating a gated channel attention mechanism (GCAM) and an adaptive upsampling module. Results showed that the improved approach adapts to multi-scale object detection tasks in complex scenes and reduces the omission rate of small objects. Hence, in this study, we attempt to use a channel attention mechanism to enhance the performance of YOLO with drones.

2.4. Drone-Based Wildlife Detection

In the field of wildlife detection using drones, UAVs have made wildlife conservation technology more accessible. The benefits of aerial imagery from drones have contributed to wildlife conservation.
Drones have automated the process of capturing high-altitude aerial photos of wildlife habitats, greatly simplifying the process of obtaining images and monitoring wildlife using automated techniques such as image recognition. This technology eliminates the necessity for capturing images manually and enables more efficient monitoring of wildlife populations. For example, Hodgson et al. [67] applied UAV technology to wildlife monitoring in tropical and polar environments and demonstrated through their study that UAV counts of nesting bird colonies were an order of magnitude more accurate than traditional ground counts. Sirmacek et al. [68] proposed a computer vision method for quantifying animals in aerial images, resulting in successful detection and counting. The approach holds promise for effective wildlife conservation management. In a study comparing the efficacy of object- and pixel-based classification methods, Ruwaimana et al. [69] established that UAV images were more informative than satellite images in mapping mangrove forests in Malaysian wetlands. This opens the possibility for automating the detection and analysis of wildlife in aerial images using computer vision techniques, hence rendering wildlife conservation studies based on these images more efficient and feasible. Raoult et al. [70] employed drones in examining marine animals, which enabled the study of numerous aspects of ecology, behavior, health, and movement patterns of these animals. Overall, UAVs and aerial imagery have significant research value and potential for development in wildlife conservation.
Moreover, aerial imagery obtained through the use of drones is useful in various wildlife conservation applications due to its high level of accuracy, vast coverage, and broad field of view. This type of imagery, particularly those with 4K resolution or higher, can accurately identify various animal details, such as their category and quantity [71]. For instance, the distinctive stripes of zebras can easily be recognized [72], which is essential in counting the number of animals and assessing their level of endangerment. Aerial photos that cover a broad territory can be useful to survey wildlife in remote or hard-to-reach locations, aiding in complete assessments of animal distribution and habitat utilization [73]. For the advantage of comprehensive coverage, UAVs can survey areas encompassing vast wetlands or dense forests to detect elusive wildlife populations and monitor their ranges. This helps develop effective conservation plans [74].
However, current algorithms for wildlife detection using UAVs still encounter various challenges. Firstly, the accuracy of detecting small targets is inadequate. Existing algorithms fail to satisfy the requirements for accurate detection of small targets. As UAVs capture images from far away, small targets are often only a few tens of pixels. For instance, an enhanced YOLOv4 model was proposed by Tan et al. [75] for detecting UAV aerial images, which achieved only 45% of the mean average precision. Wang et al. [16] discovered that identifying small animals within obstructed jungle environments during UAV wildlife investigations is challenging. Furthermore, meeting practical use standards requires enhanced real-time algorithm performance, which current techniques struggle to achieve the necessary response speed for flight. For instance, Benjdira et al. [76] utilized the Faster R-CNN method in detecting vehicles in aerial images. The experimental results revealed that the detection speed hit 1.39 s. However, this could not satisfy the real-time requirements. Fortunately, YOLO, a one-stage detection algorithm, exhibits outstanding real-time performance (as mentioned in Section 2.2.1), making it a crucial choice as the primary model for this study. Additionally, the publicly accessible training data remain limited, which inevitably leads to the model’s overfitting issue and weak generalization ability in practical scenarios. These limitations suggest that there remains a disparity between the existing algorithms and the necessity for ongoing enhancement in order to attain precise and effective identification of wildlife in aerial images. Consequently, we have been spurred to develop a real-time detection (e.g., YOLO) technique for detecting small-target UAV wildlife and to divulge a superior, open-source training dataset to advance the field of academia.

3. Methods

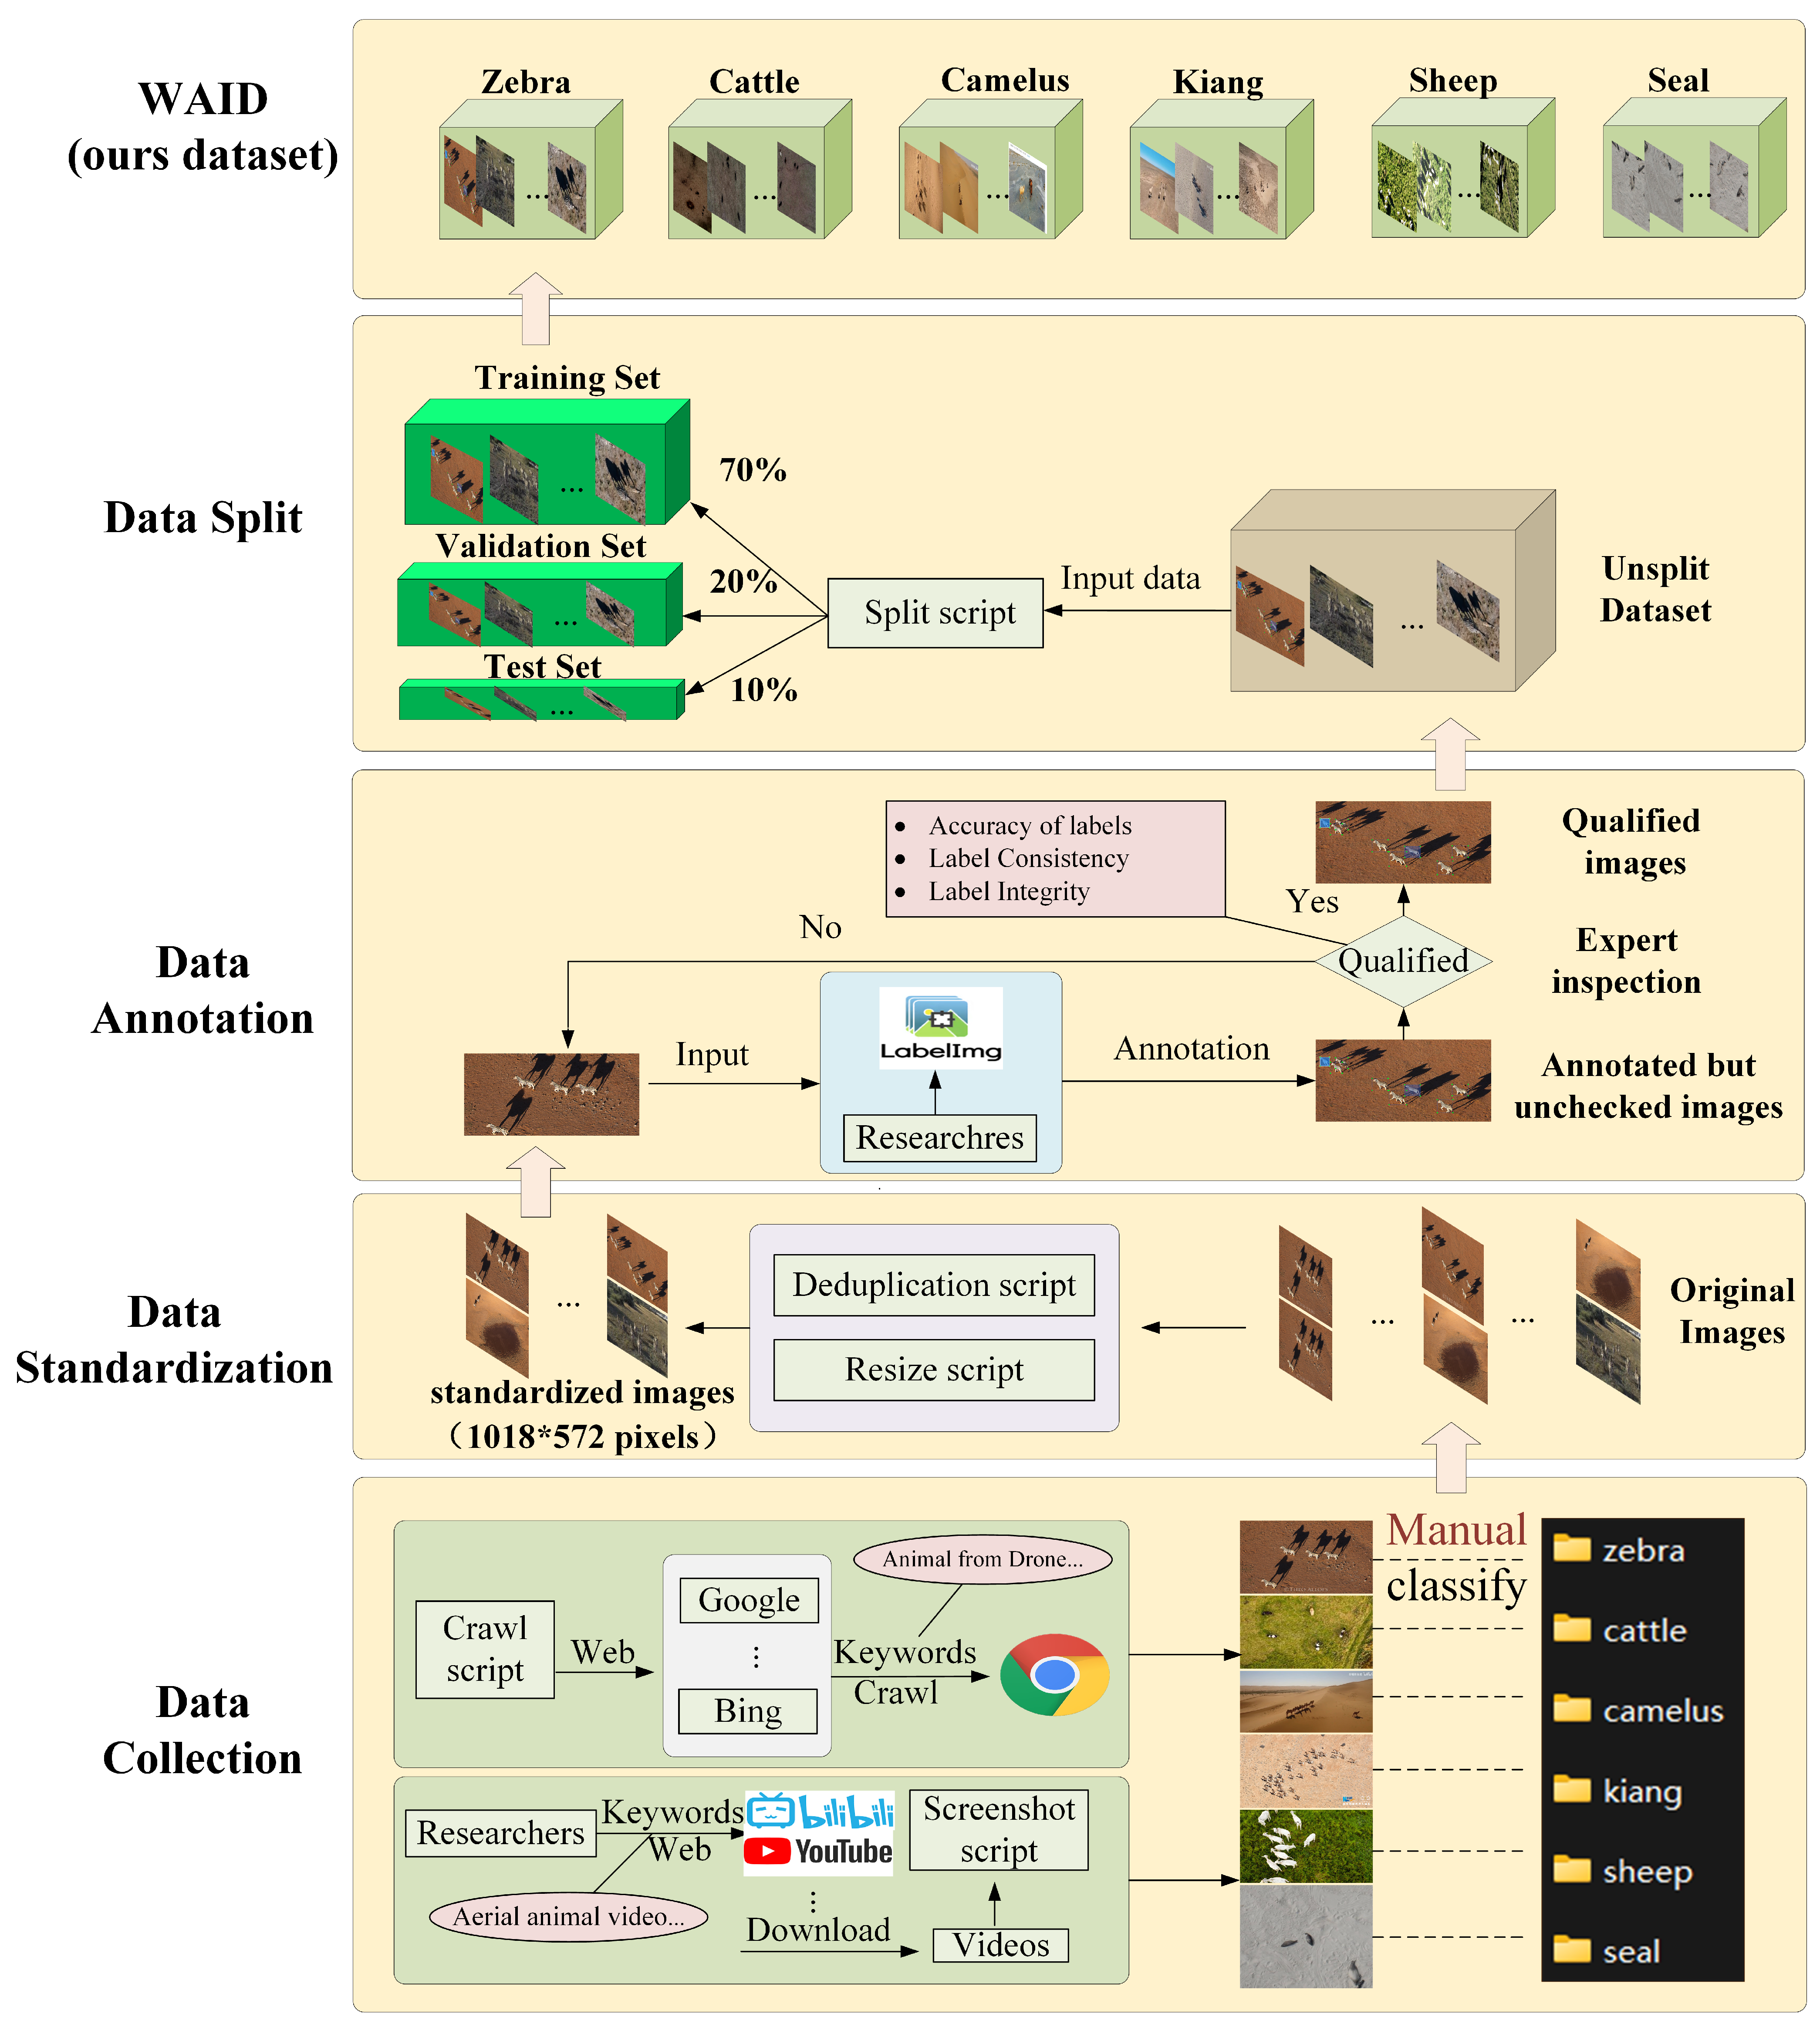
3.1. Dataset Design and Construction

In this study, we constructed a high-quality aerial wildlife dataset through the processes of data collection and standardization, data annotation, and dataset partitioning. Figure 3 shows the workflow for building the dataset. The data collection and standardization phase encompassed operations such as obtaining and cleaning image and video data. During the data annotation phase, professional tools were employed to ensure the quality of dataset annotations. Finally, the dataset was divided into training, validation, and testing sets using a ratio of 7:2:1, making it available for researchers to use.

3.1.1. Data Collection and Standardization

We employed a combination of web scraping, video capture techniques, and accessing publicly available data sources to obtain aerial wildlife images. Initially, we utilized a list of relevant keywords such as “Aerial animal” and “Animal from Drone” to perform web scraping on search engines like Google and wildlife photography websites. After manual screening and categorization, the collected images were organized into different folders based on animal categories, forming the raw image dataset. Subsequently, we filtered the raw image dataset, removed duplicates, and eliminated irrelevant content to create a standardized dataset. Moreover, we gathered videos of wildlife captured using high-resolution cameras installed on drones from platforms like Bilibili (https://www.bilibili.com/) and YouTube (https://www.youtube.com). These videos were processed using script tools to extract individual frames, which were then adjusted to a consistent resolution of 1018 × 572 pixels. This resolution choice aimed to expedite image processing time and conserve resources. Additionally, we accessed publicly available datasets like Roboflow Universe (https://universe.roboflow.com/) to obtain aerial wildlife images for specific animal categories. These images were collected using UAVs equipped with high-resolution cameras and provided under a knowledge-sharing license.

3.1.2. Data Annotation

Data annotation is a time-consuming and skill-intensive process, and the quality of label creation directly impacts the final accuracy of model training. In this study, we utilized a professional annotation tool called labelimg (https://github.com/HumanSignal/labelImg, accessed on 14 September 2023) to annotate aerial wildlife images. During the annotation process, we labeled each image using information about object positions, sizes, etc. and associated them with the correct categories. To ensure the quality of the dataset, we established rigorous annotation guidelines. After every 500 annotations, we required annotators to perform manual checks from the perspectives of accuracy, consistency, and completeness. Any improperly labeled images were sent back to annotators for re-annotation. Annotation personnel conducted multiple rounds of review and revision to correct any errors or inconsistencies in the annotation results. This annotation workflow ensured the reliability and utility of the dataset. Upon completing the annotations, we stored the annotation results in the YOLO format. This format facilitates algorithmic data reading and processing while also making the dataset more user-friendly and shareable. Additionally, to better apply the dataset information in multi-task scenarios, we employed dataset format conversion. Specifically, we converted the dataset to the VOC format, which better supports recording and utilizing various metadata. Moreover, we also successfully converted the dataset to the VOC format in this study to provide more choices.

3.1.3. Data Split

We adopted a split ratio of 7:2:1 to divide the dataset, meaning that the dataset was divided into 70% for training, 20% for validation, and 10% for testing. Table 2 shows the details of each class in the training, validation, and test set. This splitting ratio helps to make full use of the dataset while maintaining its diversity. To ensure the representativeness and balance of the dataset, we used scripting tools to achieve a randomized split. Firstly, for each category, we split its images according to the 7:2:1 ratio. During the splitting process, we ensured that the images in each dataset were randomly selected and that there was category balance across different datasets. After the splitting was complete, we stored the images of the training, validation, and testing sets, along with their corresponding annotation files, in separate folders for subsequent model training, validation, and evaluation. Through proper dataset splitting, we can more accurately assess the performance of the model in real-world scenarios, avoid overfitting to specific datasets, and enhance the model’s reliability and generalization ability in practical applications.

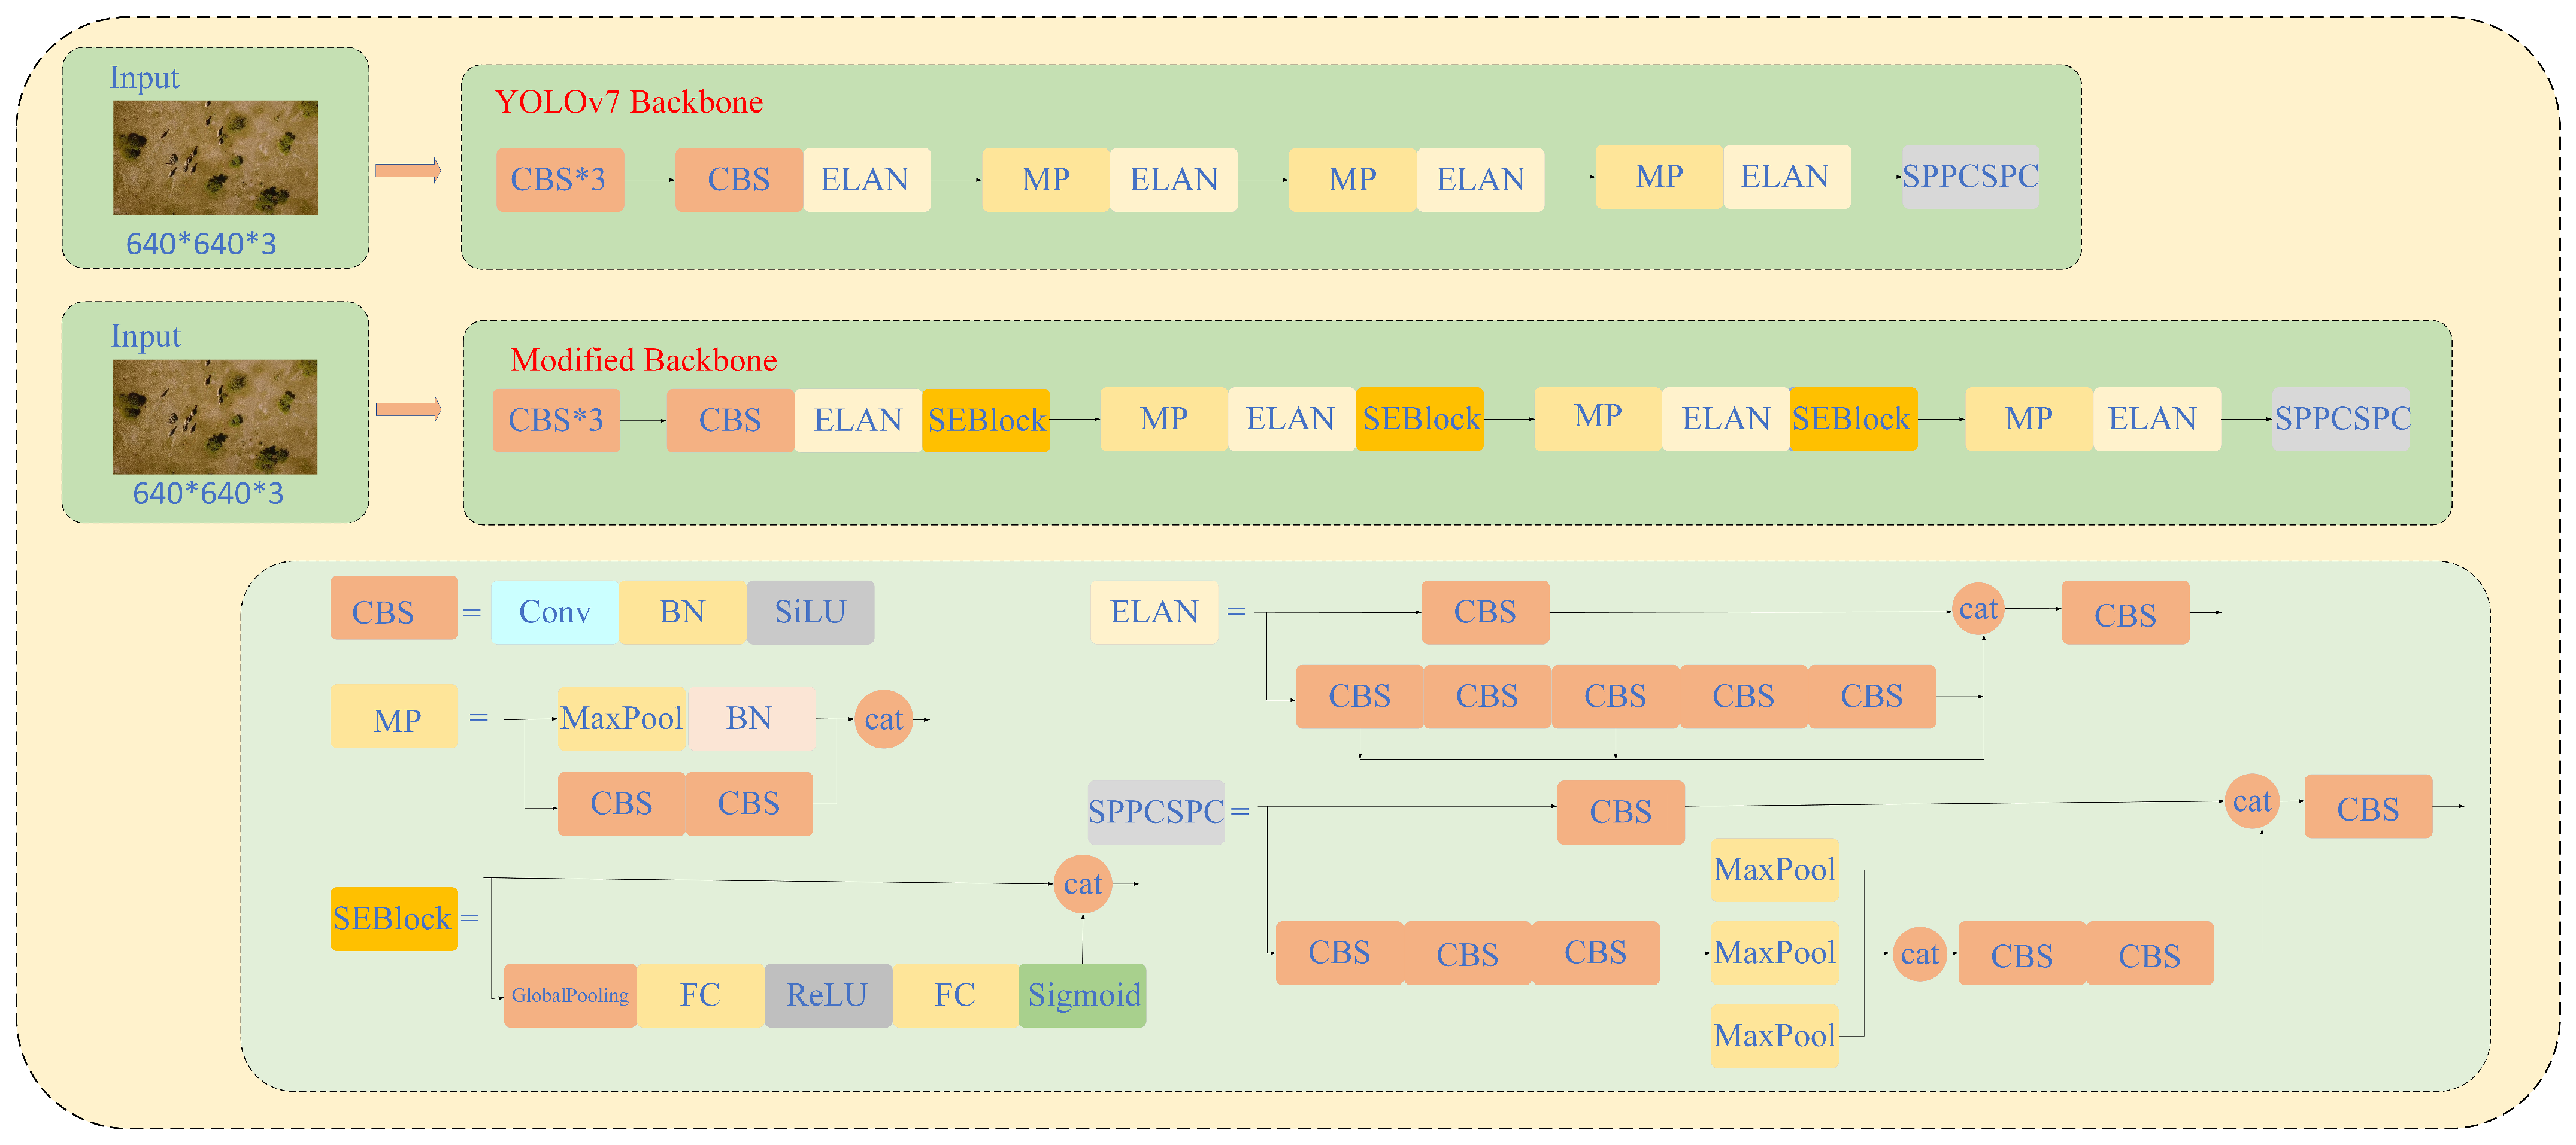
3.2. Improved YOLOv7 Model Based on Attention Mechanism

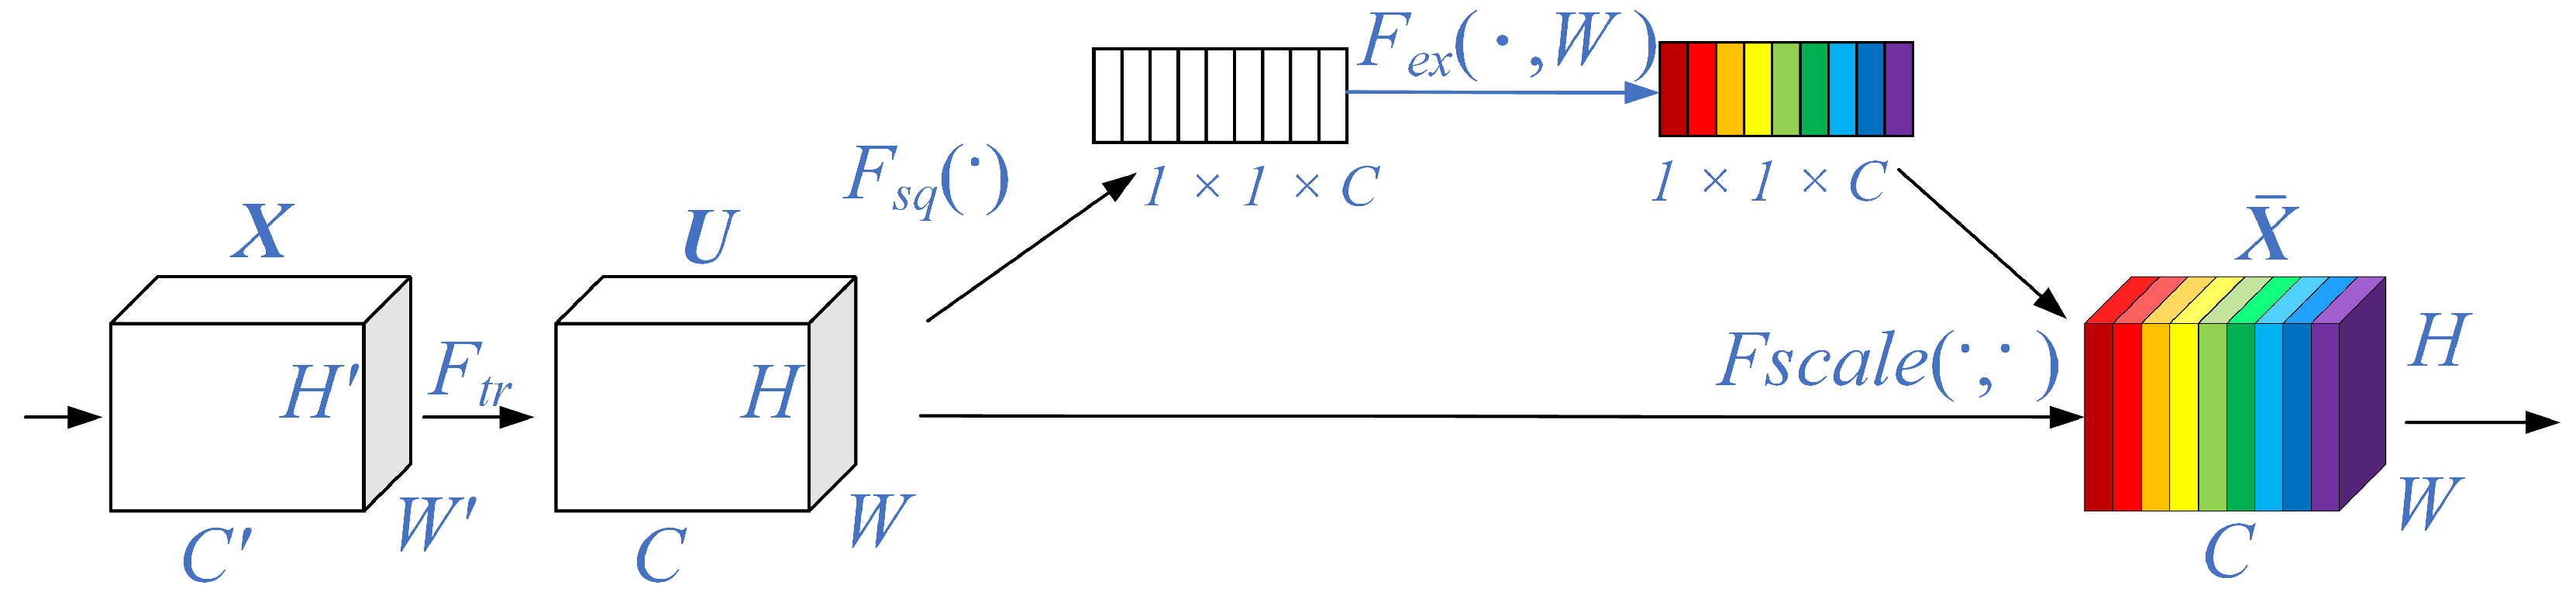
3.2.1. SEBlock Module

Hu et al. [77] proposed the SE-Net (Squeeze-and-Excitation Network) in 2017, which is a model that incorporates an attention mechanism in the channel-wise dimension to enhance the network’s representational power by simulating the interdependencies between convolutional feature channels [78]. The SENet introduces the Squeeze-and-Excitation (SE) module, aiming to allocate different weights to each feature map to enable the network to focus on more useful features. The design of the SE module is illustrated in Figure 4.
The SE module begins with a Squeeze operation on the feature map obtained from convolutional layers. It employs global average pooling (GAP) to compress spatial information (H × W) from each channel into a single-channel representation. The algorithm is as follows:
Z C = F s q U c = 1 W × H i = 1 W i = 1 H U c i , j .
Here, U c represents the input feature map, U c R H × W × C , where R denotes the feature map dimension, C is the number of channels in U c , and H and W represent the height and width of U c , respectively. F s q ( U c ) represents the compression operation, and Z C represents the resulting 1 × 1 × C-dimensional vector obtained from compressing U c .
Subsequently, a global feature Excitation operation is performed. This involves two fully connected layers (fully connected) to further compress and reconstruct the features. The first fully connected layer is for dimension reduction ( w 1 ), followed by a ReLU activation function for non-linear transformation, and finally, another fully connected layer ( w 2 ) to restore the features to their original dimension. This process generates distinct weights for each feature channel, capturing the relationships between different channels. The algorithm is as follows:
S C = F e x Z C , w 2 = δ w 2 σ w 1 Z C
σ x = 1 1 + e x
where F e x z C , w 2 represents the Excitation operation, σ and δ denote the ReLU and Sigmoid activation functions, respectively, and S C represents the attention weight information obtained by applying the ReLU and Sigmoid activations to the channel feature vector Z C , resulting in a 1 × 1 × C-dimensional vector.
Finally, the S C is multiplied element-wise with the original feature map to obtain the enhanced feature map. The algorithm is as follows:
X c ¯ = F s c a l e U c , S C = U C × S C .
Here, F s c a l e U c , S C denotes the reconstruction operation and X c ¯ represents the reconstructed feature map after the scaling operation.

3.2.2. SE-YOLO

In aerial images, the original YOLOv7 model often encounters false positives or false negatives when detecting relatively dense small objects like wildlife. This issue is primarily attributed to the imbalanced distribution of confidences. To address this problem and enable the network to learn global features for improved detection accuracy of dense small objects, it is necessary to calibrate the weights of various channels. Introducing the SENet attention mechanism into YOLOv7 helps preserve features that are prone to getting lost during the feature extraction process, thus resolving issues of feature blurring or loss. This is particularly crucial for small objects.
Within YOLOv7’s deep network structure (neck and head), the feature maps undergo semantic fusion to different extents, resulting in richer information and larger receptive fields. However, in highly fused feature maps, the features become more complex, which may affect the performance of the SEBlock in distinguishing crucial features in small-scale feature maps. On the other hand, whereas the feature maps in YOLOv7’s backbone network have relatively less semantic information, they contain important texture and contour details of objects in the middle and shallow layers, which are critical for detecting small objects. Hence, we choose to incorporate SEBlock only in the effective feature layers of the backbone network after the first three ELANs (feature extraction layers). The improved backbone network structure is illustrated in Figure 5. The modified YOLOv7 algorithm with the embedded SEBlock in the backbone network is referred to as the SE-YOLO model. This model, although reducing a significant number of parameters, retains global information and enhances the model’s robustness.

4. Experiments and Results

In this paper, we conducted a thorough analysis of the WAID dataset through three key experiments. Firstly, we conducted a dataset statistics experiment, delving into various aspects of the dataset through charts and visualization techniques. This allowed us to gain in-depth insights into the dataset’s characteristics. Secondly, we evaluated the performance of state-of-the-art methods as well as our proposed SE-YOLO on this dataset, providing an assessment benchmark for research in the field. Lastly, we performed cross-dataset validation experiments to assess the generalization ability of models trained on WAID to different datasets. These experiments not only revealed the dataset’s unique attributes and the performance of various methods but also provided substantial support for research and applications in the field of aerial wildlife image detection. By systematically analyzing the dataset and evaluating model performance, this paper contributes to a deeper understanding of the challenges and possibilities in wildlife detection in aerial imagery.

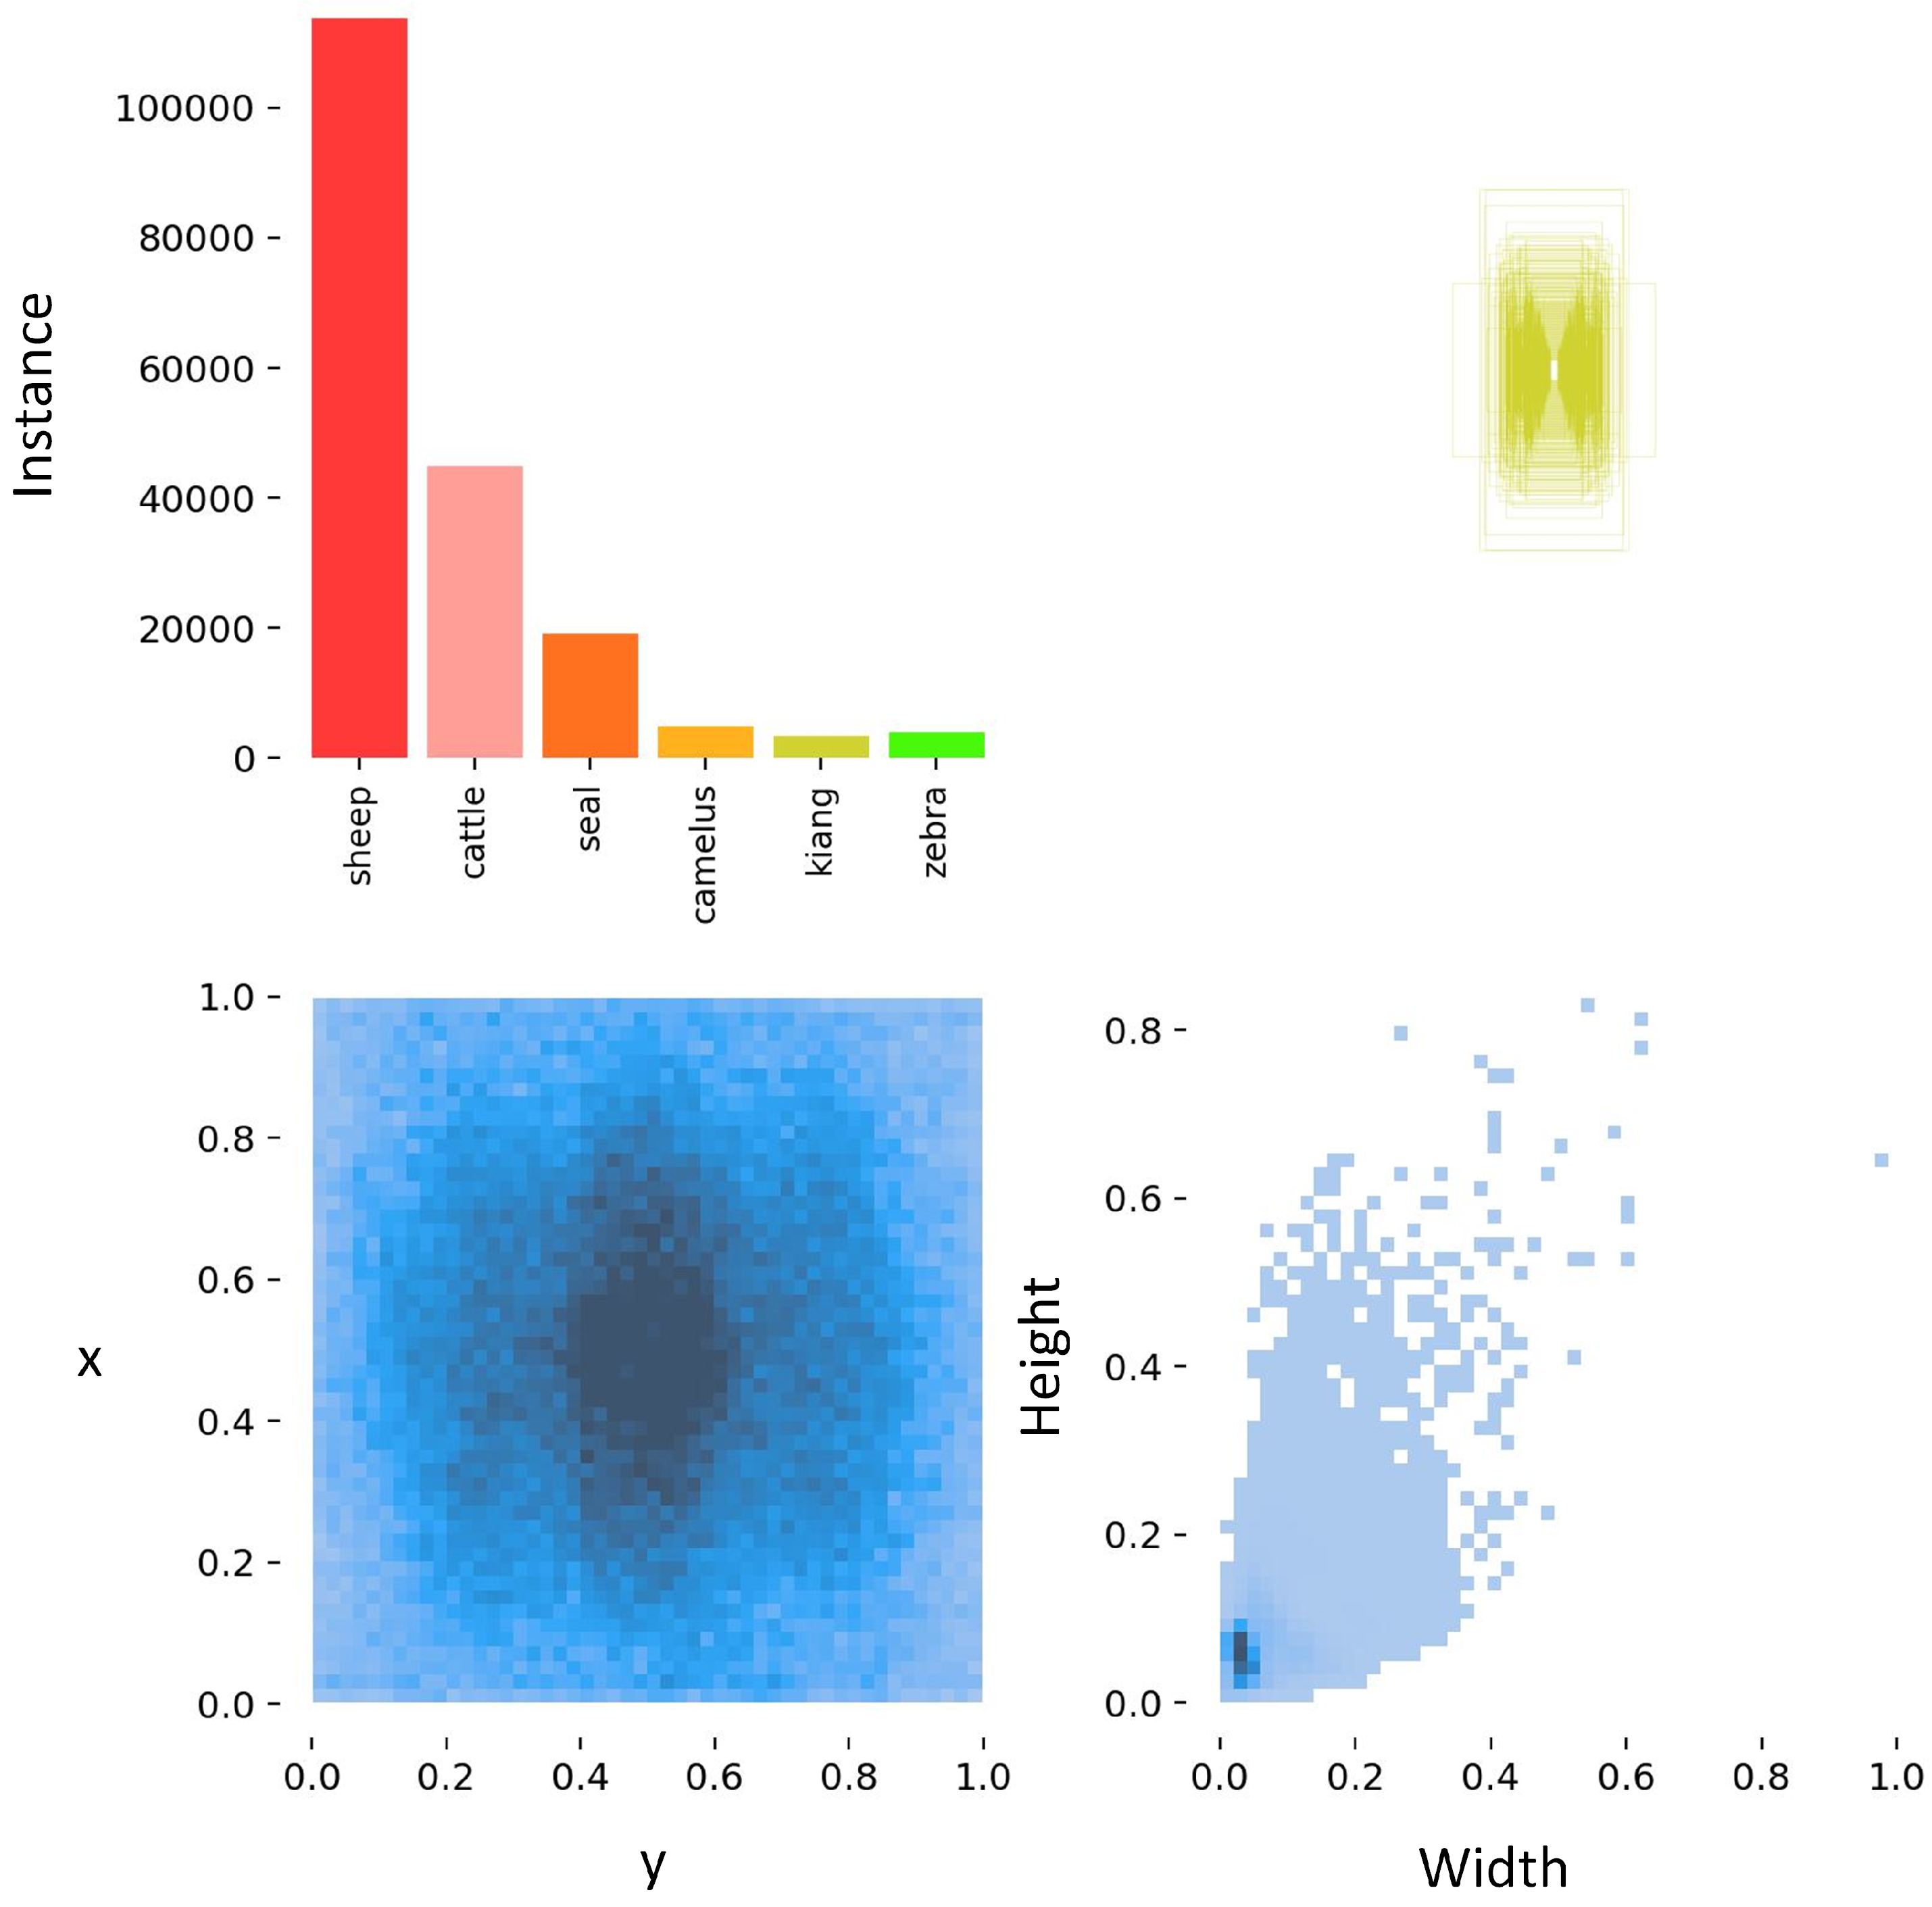
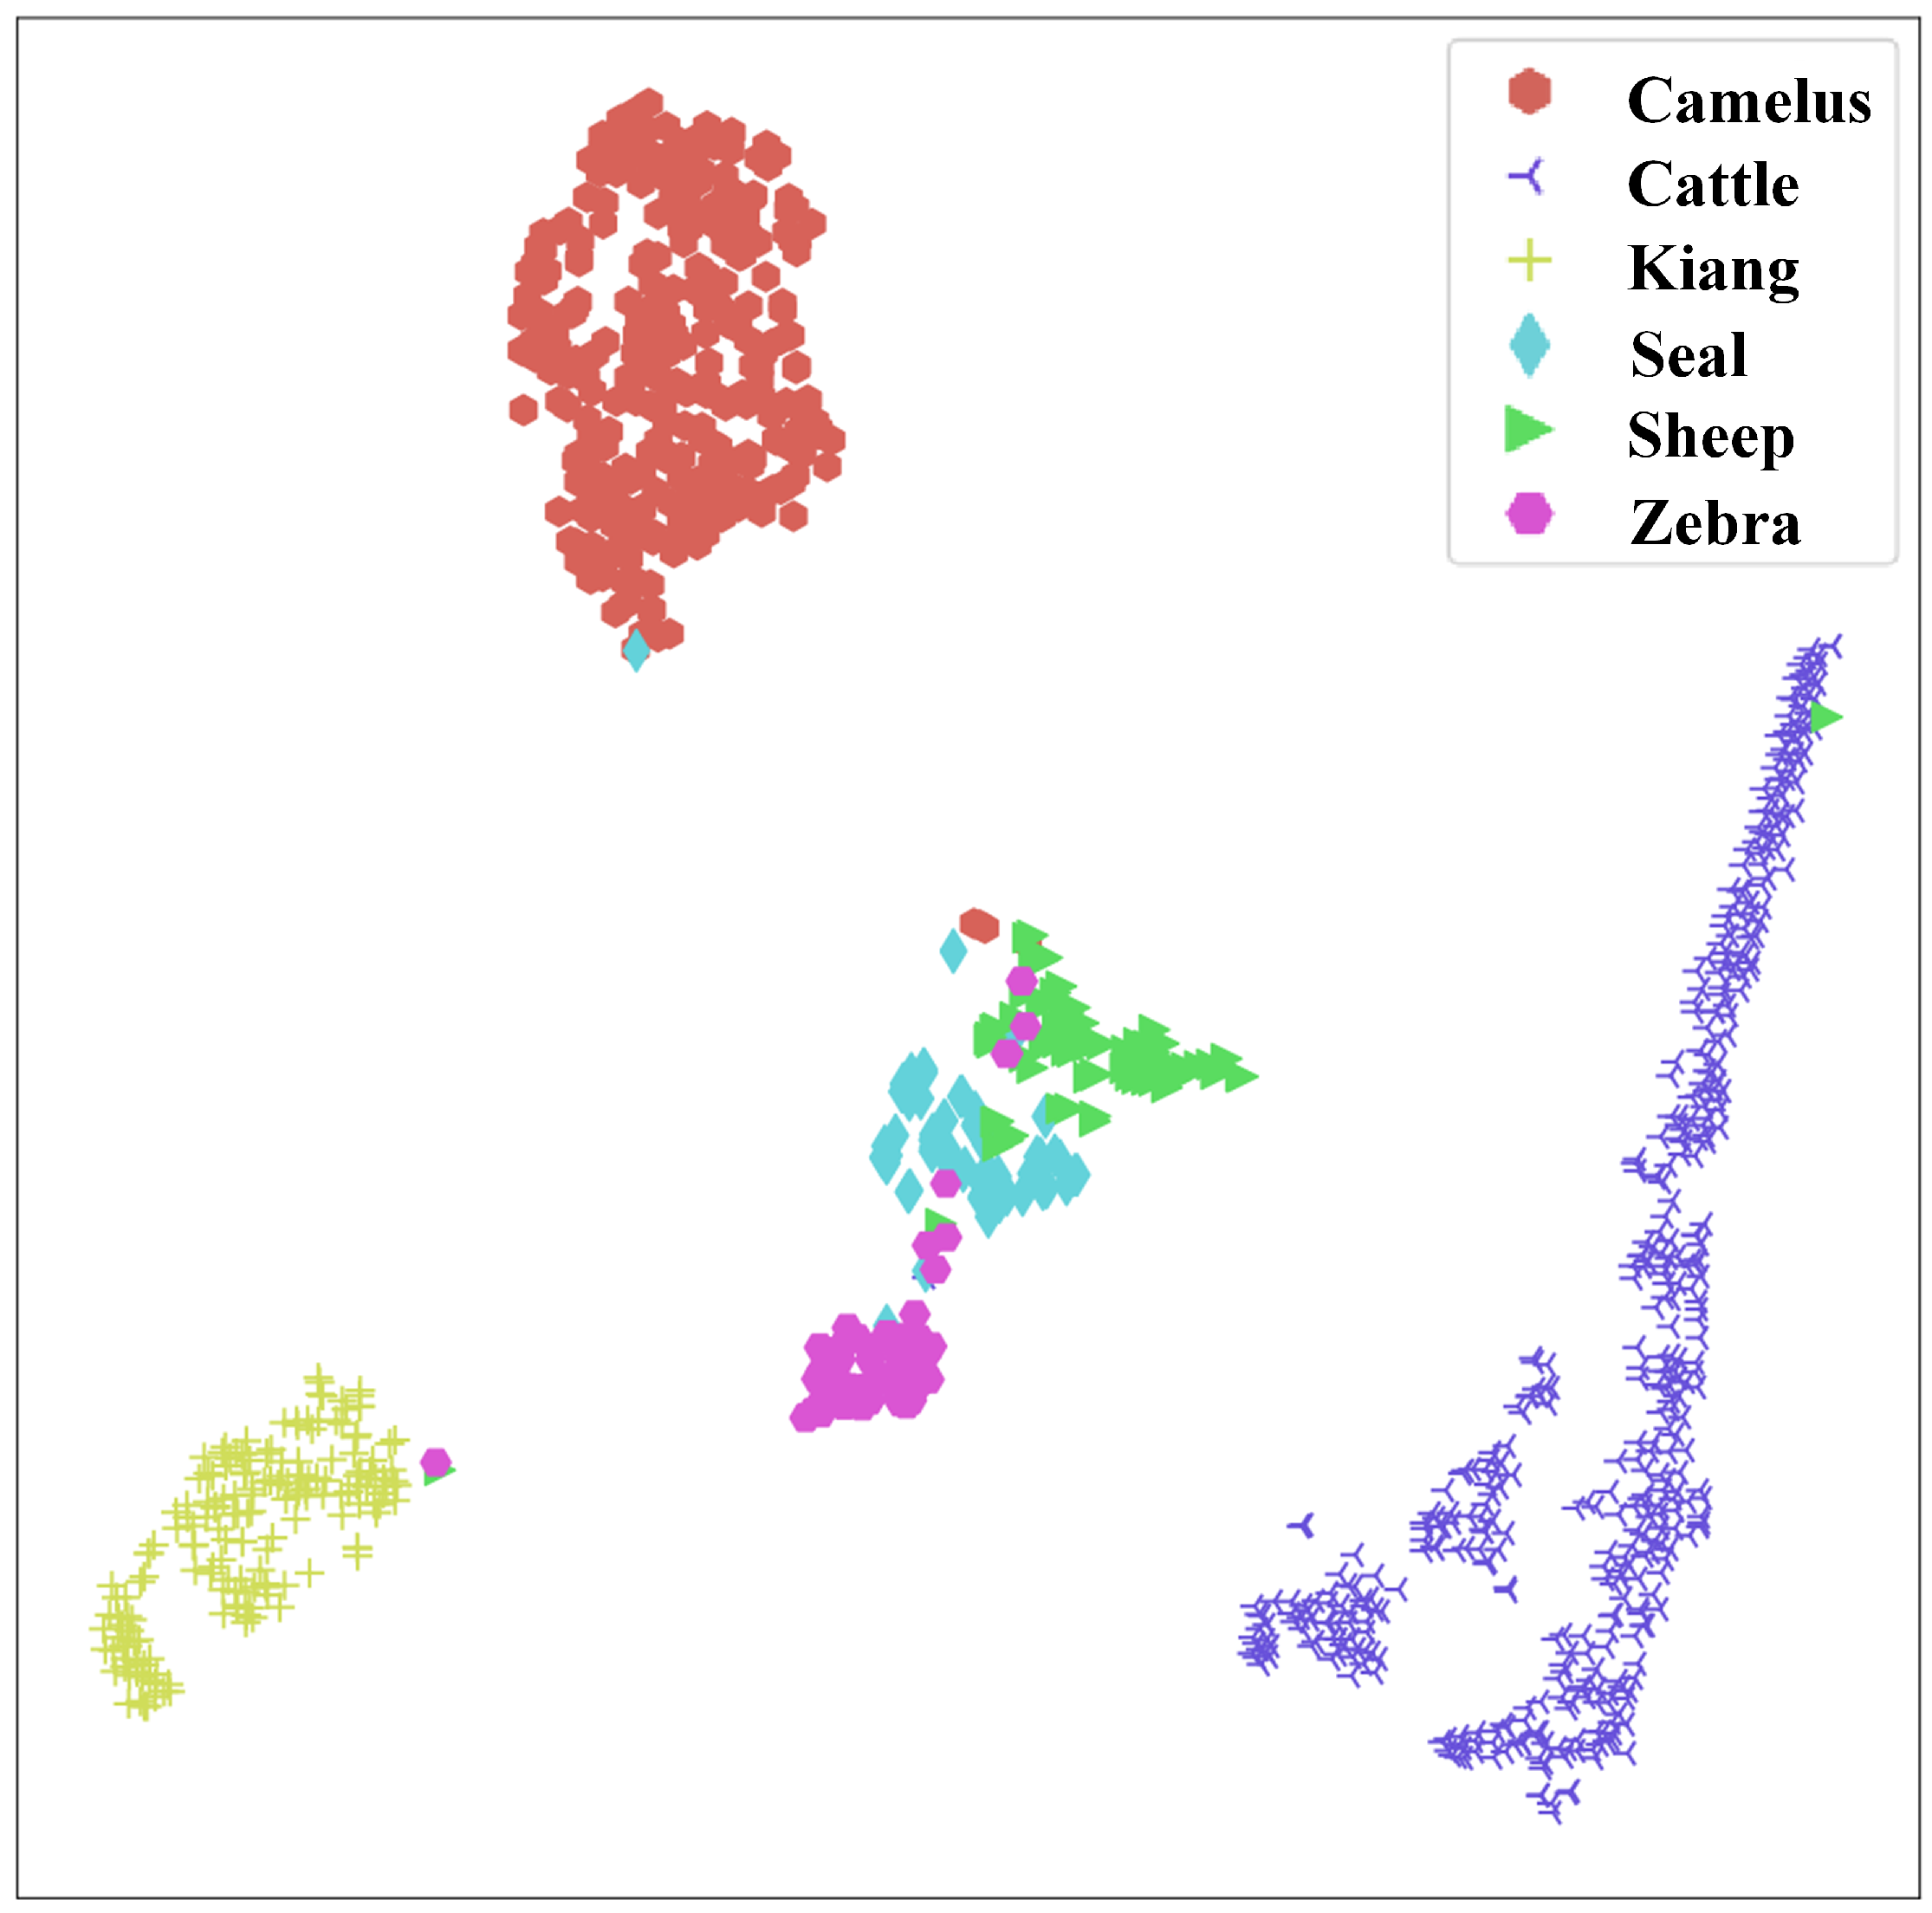
4.1. Statistical Experiments on WAID

To comprehensively understand the characteristics and distribution of the WAID dataset, we conducted statistical experiments. This included analyzing the instance data of different categories in the test set and plotting the distribution of label box sizes, aspect ratios, and object distributions. Through statistical analysis, we obtained information about the instance count of different categories, the spatial distribution of wildlife, and the distribution of label box sizes. This helps us gain deeper insights into the dataset’s structure, characteristics, and patterns, providing valuable information for further model training and wildlife ecological research. Additionally, we applied the T-SNE (t-distributed Stochastic Neighbor Embedding) method [79], a common dimensionality reduction technique used for visualizing high-dimensional data. T-SNE maps high-dimensional data into a lower-dimensional space, aiding visualization in two- or three-dimensional planes. In this experiment, we first preprocessed the data, handling missing values and standardizing and normalizing the data to ensure consistency across dimensions. Next, we applied the T-SNE algorithm, setting parameters such as learning rate, to perform dimensionality reduction and visualization. We plotted the reduced data points on a two-dimensional plane using a scatter plot, with different colors distinguishing different categories.
The instance counts of different categories in the dataset and the distribution of the dataset are illustrated in Figure 6. The histogram of animal category counts (top left) indicates an uneven distribution of sample quantities in the dataset, presenting a significant challenge to the model. Examining the distribution of label box widths and heights (top right) as well as the variable histograms plotted based on label box width and height (bottom right), it is evident that the label boxes in the dataset tend to be small. This suggests that the WAID dataset contains a relatively high number of small target wildlife instances. In the plot of label box center positions in the x and y dimensions (bottom left), darker regions indicate a higher concentration of label boxes. This suggests that the distribution of wildlife positions in the images is relatively dense.
The visualization results of the data after dimensionality reduction using the T-SNE method are shown in Figure 7. In the figure, we can clearly observe that samples from the six categories (Sheep, Cattle, Seal, Camelus, Kiang, Zebra) exhibit relatively distinct clustering structures. Each category forms a tight cluster in the plot, and there are noticeable gaps between the clusters, indicating their high distinctiveness in the feature space. Specifically observing the clustering of different animal categories, we can draw the following observations: the samples from the Camelus, Cattle, and Kiang categories are relatively independent clusters, each forming a closely grouped cluster, and they are relatively isolated from other categories. This suggests that they exhibit significant differences and unique semantic features in the feature space, making them distinctly separated in the reduced space. Samples from the Zebra category form a relatively independent cluster, but it is closely located to samples from the Sheep and Seal categories. This implies that there is some similarity between Zebra and Sheep and Seal in certain features that cause them to cluster together in the reduced dimensionality space. Additionally, a few Zebra samples appear in the connecting region between Sheep and Seal clusters, suggesting that these samples possess attributes that lie between the two categories and share some common properties. Samples from the Seal and Sheep categories are extremely close in the reduced space, almost adjacent to each other. This implies that Seal and Sheep share similar features in the feature space, possibly due to overlapping attributes, visual characteristics, ecological environment, or behavioral habits.
Considering these observations, we can draw the following conclusions: the Camelus, Cattle, and Kiang categories exhibit distinctiveness and uniqueness in the feature space, likely due to significant differences in appearance, size, and habitat. Zebra shares some similarities with Sheep and Seal in certain features, potentially related to visual or behavioral attributes. The close proximity of Seal and Sheep in the feature space indicates shared characteristics, such as similar color features, which could be related to their ecological environment or behavioral habits. These observations align well with the characteristics of the real natural environment. In a word, these intuitive experimental results demonstrate that our WAID dataset is reasonable and suitable to validate the wildlife detecting by drones.

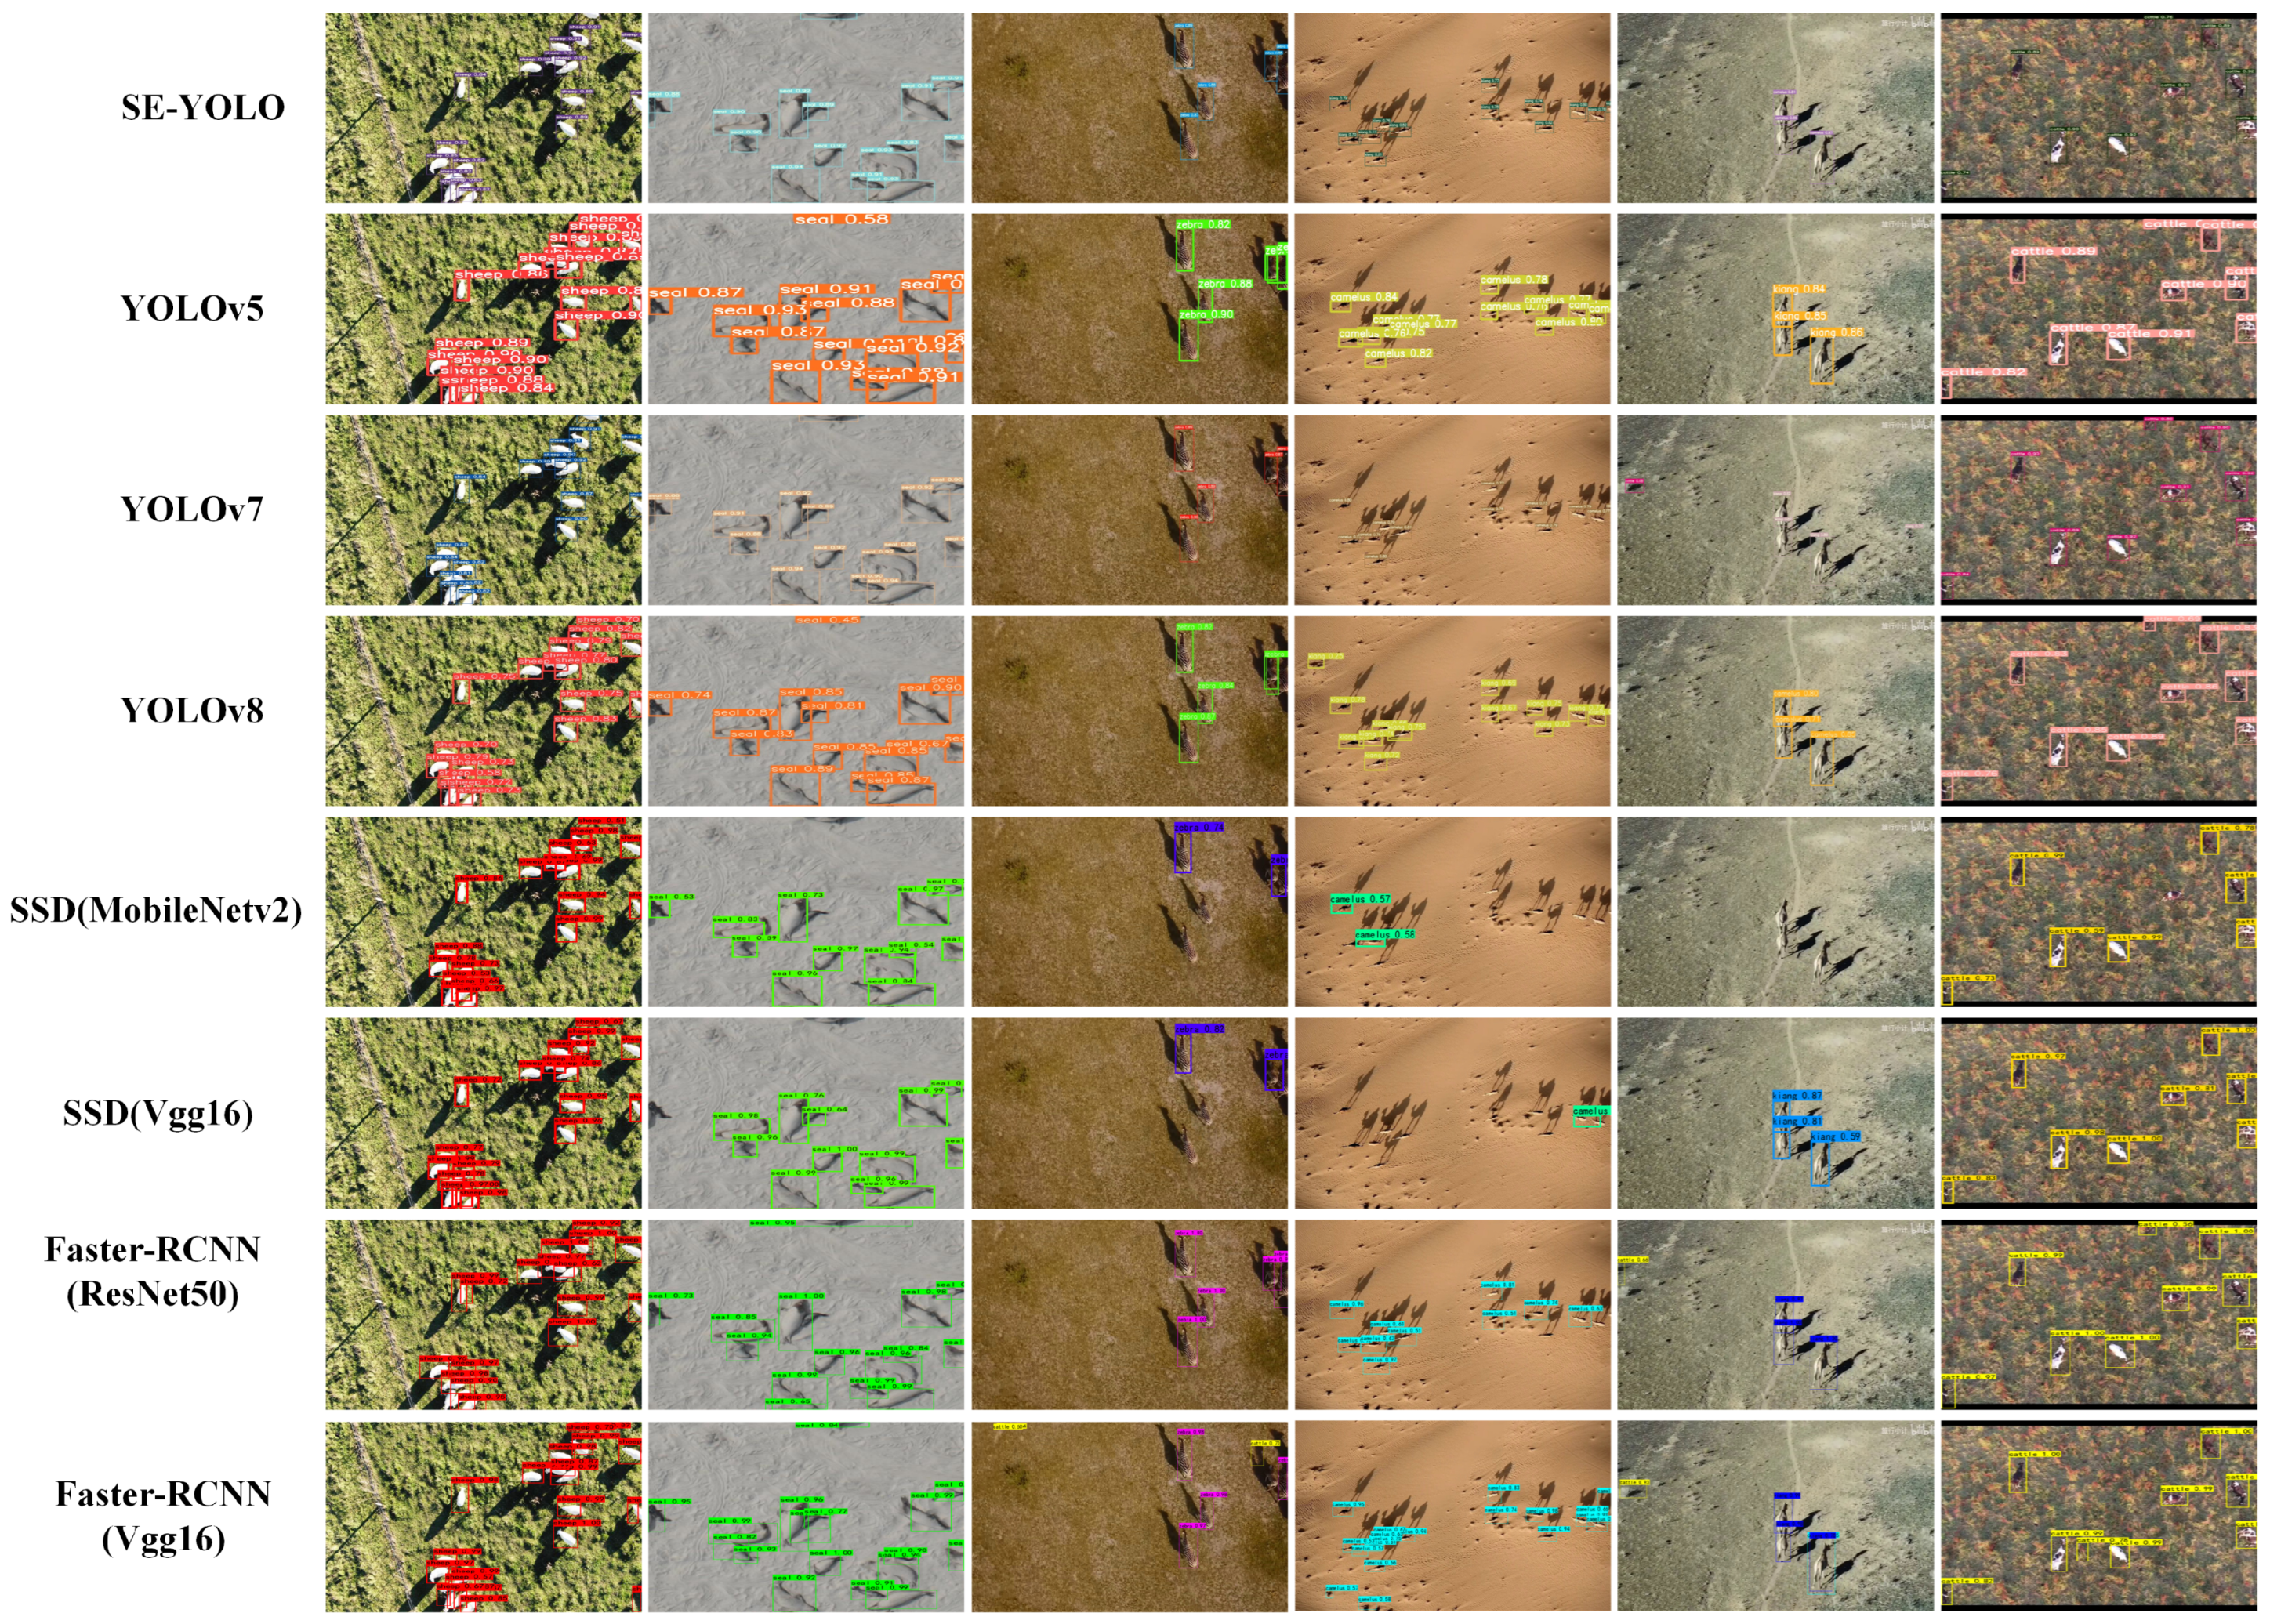
4.2. Experiments of State-of-the-Art Algorithms on WAID

4.2.1. Experimental Setups

We conducted performance comparisons by training and testing the current state-of-the-art object detection algorithms, including Faster R-CNN, SSD, YOLOv5, YOLOv7, and YOLOv8 on the WAID dataset. Additionally, we evaluated the effectiveness of the attention mechanism in small object detection tasks using the SE-YOLO model with an embedded SEBlock module. Among the total 14,375 images in the dataset, we utilized 11,118 images for training, 2054 images for validation, and the remaining 1203 images for testing the six object classes. Random selection was used for distributing images among the training, validation, and test sets, ensuring that various species categories were represented across multiple scenes. During the experiments, we set the input image size to 640 × 640 pixels for the models. The initial learning rate was set to 0.01, the learning rate momentum to 0.937, and the weight decay to 0.0005. Additionally, we configured the batch size for model training to be 32, the IoU threshold for evaluation to be 0.5, and conducted training for a total of 100 epochs. Furthermore, to investigate how small of a target SE-YOLO can actually recognize and its performance, we implemented a case study. We first set data with less than 50 pixels in horizontal as minimal targets, as used in [80], then explored exactly how small targets can be recognized accurately by SE-YOLO and compared the performance of SE-YOLO with YOLOv7 on these data.

4.2.2. Evaluation Metrics

Currently, the most widely used and effective evaluation metrics for object detection are P r e c i s i o n , R e c a l l , and Mean Average Precision ( m A P ). We utilize these evaluation metrics to assess the performance of advanced object detection algorithms on the WAID dataset, aiming to compare the capabilities of different algorithms.
The P r e c i s i o n metric measures the proportion of true positive predictions among all positive predictions made by the algorithm. In other words, it is the ratio of the number of true positive samples to the total number of samples predicted as positive. The R e c a l l metric, on the other hand, measures the proportion of positive samples that are correctly detected by the algorithm. It is the ratio of the number of true positive samples to the total number of actual positive samples. R e c a l l is an important indicator for assessing the accuracy of a detection algorithm. The formulas are as follows:
P r e c i s i o n = T P T P + F P
R e c a l l = T P T P + F N .
Here, T P (True Positive) represents true positive samples, F P (False Positive) represents negative samples incorrectly identified as positive, and F N (False Negative) represents positive samples incorrectly identified as negative.
The m A P is a comprehensive metric used to evaluate the overall performance of object detection algorithms. It is based on the P r e c i s i o n R e c a l l curve and calculates the Average Precision ( A P ) for each class, followed by taking the average A P across all classes to obtain m A P . The formula is as follows:
m A P = 1 N 0 1 P ( R ) d R N .
Here, P ( R ) represents precision at recall R, N is the number of object classes.

4.2.3. Results and Analysis

The network model evaluations on the WAID dataset are listed in Table 3. The model evaluation results divided by category are shown in Table 4. Overall, the YOLO model exhibits the best performance, with YOLOv5, YOLOv7, and YOLOv8 achieving mAP scores of 95.6%, 97.4%, and 95.8% respectively. Additionally, our proposed SE-YOLO model achieved the highest mAP of 98.3%. Although there is not a significant difference between the Faster R-CNN and SSD models overall, Faster R-CNN slightly outperforms the SSD model. Further analysis reveals that among the four YOLO models, YOLOv5 and YOLOv8 achieve similarly high mAP values. This might be attributed to YOLOv8 being an improvement over YOLOv5, and on the WAID dataset, both models find it relatively straightforward and manageable, resulting in similar performance. For a more vivid illustration of the detection advantages of the SE-YOLO over other baseline methods, we selected plots of the detection results of each method, as shown in Figure 8. From Figure 8, we can see that the SE-YOLO method detects all of the targets with the highest level of confidence, whereas all of the other baselines either fail to detect the targets or have a low level of classification confidence. The SE-YOLO model, an enhancement of YOLOv7 with the introduction of the SEBlock, performs optimally across all categories in the dataset. This indicates that the integration of channel attention mechanisms is effective on the WAID dataset.
By comparing SSD and Faster R-CNN models, we find that both one-stage and two-stage approaches face challenges in detecting small objects and densely populated areas. From the model evaluation results based on dataset categories, the two backbone networks of SSD perform poorly on categories other than the “Seal” category. This can be attributed to two main reasons: firstly, SSD adopts a relatively simple network structure and multi-scale feature maps, making it difficult to capture features of intricate and complex objects, resulting in weaker detection capabilities for small objects; secondly, since the WAID dataset is an aerial dataset containing a significant number of small and densely packed objects, SSD’s use of fixed-size default boxes leads to a weaker ability to handle densely packed objects. Overlapping or closely situated targets might result in inaccuracies in box selection or duplicate detections. In addition, significant differences between the Faster R-CNN and YOLO models are observed in the “Sheep” category. This is because Faster R-CNN utilizes an RPN (Region Proposal Network) to generate candidate object boxes. In images where the background is simple and the foreground-background contrast is high, the lack of complexity in the background can make it challenging for the RPN to generate accurate candidate object boxes. This, in turn, affects the subsequent object detection process. In environments with relatively complex backgrounds, the detection performance of Faster R-CNN improves noticeably. For example, with the ResNet50 backbone network, Camelus achieves 91% and Kiang achieves 82.4%. These results suggest that structure of backbone is necessary to be modified in the small target detection, as we have done with our proposed SE-YOLO method.
To demonstrate the recognition performance of SE-YOLO with minimal targets with less than 50 pixel points, the case study has been conducted. As shown in Figure 9, the SE-YOLO works well and accurately detects these minimal targets of about 20 pixels. Meanwhile, the experimental results show that when SE-YOLO detects targets smaller than these, the mAP value drops rapidly by more than 5%. We consider this to be a turning point in the size of targets detected by the SE-YOLO method. Hence, 20 pixels is the lower limit of minimal targets that can be detected by the proposed SE-YOLO. Furthermore, as shown in Table 5, we also compared the recognition performance of SE-YOLO and YOLOv7 on these minimal targets. As seen from Table 5, the recognition performance of SE-YOLO for minimal targets with 20–50 pixels offer 10% more performance (mAP) than YOLOv7, and achieves 0.926, 0.894, and 0.929 in terms of mAP, recall, and precision, respectively. At the same time, as can be seen in Table 3 and Table 5, the YOLOv7 performance drops rapidly by 15% (the mAP drops from 0.972 to 0.822) when encountering minimal targets, whereas the SE-YOLO drops by only 5% and still maintains an overall performance above 0.92 (mAP = 0.926). Therefore, the results suggest that the SE-YOLO works effectively on minimal targets of 20–50 pixels.

4.3. Experiments of Cross-Dataset Validation

We conducted a cross-dataset generalization experiment to evaluate the generalization ability of the WAID dataset. This experiment aimed to determine if models trained on different datasets could perform well on new datasets. Furthermore, this experiment can illustrate the applicability and usefulness of our proposed dataset in the field of UAV wildlife detection. Through this experiment, we aimed to assess the effectiveness and robustness of the trained models and training datasets in broader contexts. Due to differences in animal categories and aerial heights between existing aerial imagery datasets like AED and Arctic Seal, and the WAID dataset, we selected various source-specific aerial wildlife datasets with the same categories. We combined these datasets to create a small-scale multi-category dataset called the Multi-Source Aerial Wildlife Image Dataset (MSAWID), which was then compared against the WAID dataset. The SE-YOLO model was selected for verification experiments, and the mean Average Precision (mAP) was used as the evaluation metric.
The results of the experiment are presented in Table 6. We found that the model trained on the WAID dataset achieved a mAP of 39.5% on the MSAWID dataset, indicating that the model retained relatively high detection accuracy on unseen data sources. However, this score was 28.1% lower than the mAP achieved by a model trained directly on MSAWID. This decrease in performance can be attributed to the uneven distribution of categories in MSAWID, where some categories had fewer images. Objects in these limited images could be influenced by various factors like natural environment, occlusion, and aerial height, leading to significant differences in the learned features between the models trained on different datasets and potentially resulting in detection errors. In summary, the generalization ability of the WAID dataset benefits from its relative stability across cross-dataset experiments. Nevertheless, challenges might arise when dealing with multi-source datasets that have different origins and uneven category distributions. This finding emphasizes the importance of dataset diversity and class balance in enhancing model generalization. Additionally, given that the annotation quality in WAID is notably higher than that in MSAWID, some false positives in the comparison could stem from the detection of animals that were often unannotated or overlooked in MSAWID due to their small sizes. As for MSAWID, models trained on it achieved only 15.3% mAP on the WAID dataset (an 83% drop in comparison to models trained on WAID). This reflects WAID’s greater diversity and challenges compared to the available datasets, making it well-suited for real-world wildlife detection scenarios.

5. Discussion

5.1. UAV Wildlife Dataset

Compared to general wildlife datasets, collecting and curating aerial wildlife datasets come with higher costs, primarily due to the challenges associated with obtaining high-quality aerial imagery. On the one hand, gathering aerial wildlife data demands significant human, financial, and logistical resources. It involves careful selection of appropriate locations, weather conditions, and shooting times. Additionally, it requires the use of high-quality aerial equipment and skilled professionals proficient in aerial photography techniques. All of these factors make the data collection process exceedingly difficult. On the other hand, due to the relatively small size of individual wildlife subjects and the complex environments they inhabit within aerial images, annotating aerial wildlife datasets demands substantial time and expertise from professionals well-versed in wildlife behavior and characteristics. Ensuring the quality and usability of the data necessitates meticulous labeling efforts. This greatly amplifies the difficulty of collecting and curating aerial wildlife datasets. In combination, these challenges emphasize the intricate nature of gathering and producing aerial wildlife datasets, making them more demanding in terms of resources, expertise, and effort compared to conventional wildlife datasets.

5.2. Research Contributions

Considering the current landscape of wildlife detection in aerial imagery and aiming to drive advancements in the field of wildlife research, this study contributes to two main aspects. Firstly, the proposed enhancements address the challenge of detecting small objects in aerial imagery using deep learning. The incorporation of channel attention mechanisms aids in better feature extraction for small objects, consequently enhancing the detection of small animals in aerial images. This approach introduces novel insights and solutions to advance the development of wildlife detection algorithms tailored to aerial imagery. Secondly, this research introduces the Wildlife Aerial Image Dataset (WAID), which fills a significant gap in the domain of wildlife monitoring using aerial imagery by offering a multi-category public dataset. This dataset serves as a valuable resource for wildlife research and conservation efforts, providing a benchmark for evaluating and improving wildlife detection algorithms. In combination, these contributions provide a strong foundation for the development of techniques and methodologies focused on wildlife detection in aerial imagery, which in turn can have broader implications for conservation efforts, ecological research, and environmental monitoring.

5.3. Future Work

Although this research has achieved promising results, there are several aspects that still require further exploration and improvement. Firstly, the scale and diversity of the dataset could be expanded even further, especially targeting species that are challenging to identify. This could enhance the model’s robustness and generalize its performance to a wider array of wildlife categories. Secondly, the channel attention mechanism proposed in this study is a starting point, and in the future, it might be worth exploring other attention mechanisms or methods for fusing multi-modal information to further enhance model performance. Furthermore, the algorithm developed in this study could be extended to other domains, such as species identification in botany or object detection in different aerial imagery applications, allowing the methodology to have a broader impact. In addition, existing studies have shown that UAVs are vulnerable to intrusion and sabotage, and can be threatened by wireless signal hijacking or GPS spoofing [81]. Therefore, when our method is applied in practice in the future, we need to send back the monitoring data, and therefore many practical issues such as communication security [81,82,83] need to be addressed. By addressing these areas, the research can not only build upon its current achievements but also contribute more comprehensively to the field of wildlife detection and beyond.

6. Conclusions

In this study, we focus on the small target detection problem faced by wildlife monitoring drones. To solve this problem, we propose the SE-YOLO method, which dramatically improves wildlife detection from aerial image data by integrating the SEAttention module into YOLOv7. In particular, SE-YOLO can accurately detect minimal targets with a size of 20–50 pixels. Experimental results show that SE-YOLO detects better than the other seven baseline models with the highest mAP of 0.983. For minimal targets with a size of 20–50 pixels, SE-YOLO also achieves a mAP metric of 0.926. In addition, to solve the problem of lack of aerial wildlife training data from the UAV perspective, we constructed the first large-scale, diverse, and high-quality aerial wildlife dataset, WAID, and made it freely available to researchers. In summary, this research not only proposes new and improved models for the field of aerial wildlife detection but also makes publicly available a valuable large-scale, high-quality aerial data training set. By openly sharing these resources, this research aims to contribute to the broader cause of wildlife conservation and research.

Author Contributions

Conceptualization, C.M., T.L. and X.C.; methodology, C.M. and T.L.; software, C.M. and X.C.; validation, C.M., T.L. and X.C.; formal analysis, C.M.; investigation, T.L.; resources, C.M. and X.C.; data curation, C.M., C.Z. and T.L.; writing—original draft preparation, C.M. and T.L.; visualization, C.M. and T.L.; supervision, C.M. and X.C.; project administration C.M. and X.C.; funding acquisition C.M. and X.C.; C.M., T.L. and X.C.: significant contributions to the manuscript. All authors have read and agreed to the published version of the manuscript.

Funding

This research was supported by Nation Key R&D Program of China (2022YFF1302700), the Emergency Open Competition Project of National Forestry and Grassland Administration (202303) and Outstanding Youth Team Project of Central Universities (QNTD202308).

Institutional Review Board Statement

Not applicable.

Informed Consent Statement

Not applicable.

Data Availability Statement

WAID is available at https://github.com/xiaohuicui/WAID (accessed on 12 September 2023).

Acknowledgments

The authors are grateful to Zheng Xie for valuable discussion. The authors thank the anonymous reviewers for their valuable comments.

Conflicts of Interest

The authors declare no conflict of interest.

References

  1. Valdez, R.; Guzmán-Aranda, J.C.; Abarca, F.J.; Tarango-Arámbula, L.A.; Sánchez, F.C. Wildlife conservation and management in Mexico. Wildl. Soc. Bull. 2006, 34, 270–282. [Google Scholar] [CrossRef]
  2. Teel, T.L.; Manfredo, M.J. Understanding the diversity of public interests in wildlife conservation. Conserv. Biol. 2010, 24, 128–139. [Google Scholar] [CrossRef]
  3. Keil, P.; Storch, D.; Jetz, W. On the decline of biodiversity due to area loss. Nat. Commun. 2015, 6, 8837. [Google Scholar] [CrossRef]
  4. Prokop, P.; Fančovičová, J. Animals in dangerous postures enhance learning, but decrease willingness to protect animals. Eurasia J. Math. Sci. Technol. Educ. 2017, 13, 6069–6077. [Google Scholar] [CrossRef]
  5. Descamps, S.; Béchet, A.; Descombes, X.; Arnaud, A.; Zerubia, J. An automatic counter for aerial images of aggregations of large birds. Bird Study 2011, 58, 302–308. [Google Scholar] [CrossRef]
  6. Ševo, I.; Avramović, A. Convolutional neural network based automatic object detection on aerial images. IEEE Geosci. Remote Sens. Lett. 2016, 13, 740–744. [Google Scholar] [CrossRef]
  7. Chabot, D.; Francis, C.M. Computer-automated bird detection and counts in high-resolution aerial images: A review. J. Field Ornithol. 2016, 87, 343–359. [Google Scholar] [CrossRef]
  8. Li, X.; Xing, L. Use of unmanned aerial vehicles for livestock monitoring based on streaming K-means clustering. IFAC-PapersOnLine 2019, 52, 324–329. [Google Scholar] [CrossRef]
  9. Sundaram, D.M.; Loganathan, A. FSSCaps-DetCountNet: Fuzzy soft sets and CapsNet-based detection and counting network for monitoring animals from aerial images. J. Appl. Remote Sens. 2020, 14, 026521. [Google Scholar] [CrossRef]
  10. Ward, S.; Hensler, J.; Alsalam, B.; Gonzalez, L.F. Autonomous UAVs wildlife detection using thermal imaging, predictive navigation and computer vision. In Proceedings of the 2016 IEEE Aerospace Conference, Big Sky, MT, USA, 5–12 March 2016; pp. 1–8. [Google Scholar]
  11. Barbedo, J.G.A.; Koenigkan, L.V.; Santos, T.T.; Santos, P.M. A study on the detection of cattle in UAV images using deep learning. Sensors 2019, 19, 5436. [Google Scholar] [CrossRef]
  12. Brown, J.; Qiao, Y.; Clark, C.; Lomax, S.; Rafique, K.; Sukkarieh, S. Automated aerial animal detection when spatial resolution conditions are varied. Comput. Electron. Agric. 2022, 193, 106689. [Google Scholar] [CrossRef]
  13. Hong, S.J.; Han, Y.; Kim, S.Y.; Lee, A.Y.; Kim, G. Application of deep-learning methods to bird detection using unmanned aerial vehicle imagery. Sensors 2019, 19, 1651. [Google Scholar] [CrossRef]
  14. Padubidri, C.; Kamilaris, A.; Karatsiolis, S.; Kamminga, J. Counting sea lions and elephants from aerial photography using deep learning with density maps. Anim. Biotelem. 2021, 9, 27. [Google Scholar] [CrossRef]
  15. Linchant, J.; Lisein, J.; Semeki, J.; Lejeune, P.; Vermeulen, C. Are unmanned aircraft systems (UASs) the future of wildlife monitoring? A review of accomplishments and challenges. Mammal Rev. 2015, 45, 239–252. [Google Scholar] [CrossRef]
  16. Wang, D.; Shao, Q.; Yue, H. Surveying wild animals from satellites, manned aircraft and unmanned aerial systems (UASs): A review. Remote Sens. 2019, 11, 1308. [Google Scholar] [CrossRef]
  17. Weiss, K.; Khoshgoftaar, T.M.; Wang, D. A survey of transfer learning. J. Big Data 2016, 3, 9. [Google Scholar] [CrossRef]
  18. Deng, J.; Dong, W.; Socher, R.; Li, L.J.; Li, K.; Fei-Fei, L. Imagenet: A large-scale hierarchical image database. In Proceedings of the 2009 IEEE Conference on Computer Vision and Pattern Recognition, Miami, FL, USA, 20–25 June 2009; pp. 248–255. [Google Scholar]
  19. Lin, T.Y.; Maire, M.; Belongie, S.; Hays, J.; Perona, P.; Ramanan, D.; Dollár, P.; Zitnick, C.L. Microsoft Coco: Common objects in context. In Proceedings of the Computer Vision—ECCV 2014, 13th European Conference, Zurich, Switzerland, 6–12 September 2014; Springer: Cham, Switzerland, 2014; pp. 740–755. [Google Scholar]
  20. Zheng, X.; Kellenberger, B.; Gong, R.; Hajnsek, I.; Tuia, D. Self-supervised pretraining and controlled augmentation improve rare wildlife recognition in UAV images. In Proceedings of the IEEE/CVF International Conference on Computer Vision, Montreal, BC, Canada, 11–17 October 2021; pp. 732–741. [Google Scholar]
  21. Okafor, E.; Smit, R.; Schomaker, L.; Wiering, M. Operational data augmentation in classifying single aerial images of animals. In Proceedings of the 2017 IEEE International Conference on INnovations in Intelligent SysTems and Applications (INISTA), Gdynia, Poland, 3–5 July 2017; pp. 354–360. [Google Scholar]
  22. Kellenberger, B.; Marcos, D.; Tuia, D. Best practices to train deep models on imbalanced datasets—A case study on animal detection in aerial imagery. In Proceedings of the Joint European Conference on Machine Learning and Knowledge Discovery in Databases, Dublin, Ireland, 10–14 September 2018; Springer: Cham, Switzerland, 2018; pp. 630–634. [Google Scholar]
  23. Wang, Y.; Han, D.; Wang, L.; Guo, Y.; Du, H. Contextualized Small Target Detection Network for Small Target Goat Face Detection. Animals 2023, 13, 2365. [Google Scholar] [CrossRef]
  24. Gao, C.; Meng, D.; Yang, Y.; Wang, Y.; Zhou, X.; Hauptmann, A.G. Infrared patch-image model for small target detection in a single image. IEEE Trans. Image Process. 2013, 22, 4996–5009. [Google Scholar] [CrossRef]
  25. Chen, C.; Liu, M.Y.; Tuzel, O.; Xiao, J. R-CNN for small object detection. In Proceedings of the Computer Vision—ACCV 2016, 13th Asian Conference on Computer Vision, Taipei, Taiwan, 20–24 November 2016; Springer: Cham, Switzerland, 2017; pp. 214–230. [Google Scholar]
  26. Zhou, P.; Ni, B.; Geng, C.; Hu, J.; Xu, Y. Scale-transferrable object detection. In Proceedings of the IEEE Conference on Computer Vision and Pattern Recognition, Salt Lake City, UT, USA, 18–23 June 2018; pp. 528–537. [Google Scholar]
  27. Pham, M.T.; Courtrai, L.; Friguet, C.; Lefèvre, S.; Baussard, A. YOLO-Fine: One-stage detector of small objects under various backgrounds in remote sensing images. Remote Sens. 2020, 12, 2501. [Google Scholar] [CrossRef]
  28. Zhong, J.; Li, M.; Qin, J.; Cui, Y.; Yang, K.; Zhang, H. Real-time marine animal detection using YOLO-based deep learning networks in the coral reef ecosystem. Int. Arch. Photogramm. Remote Sens. Spat. Inf. Sci. 2022, 46, 301–306. [Google Scholar] [CrossRef]
  29. Roy, A.M.; Bhaduri, J.; Kumar, T.; Raj, K. WilDect-YOLO: An efficient and robust computer vision-based accurate object localization model for automated endangered wildlife detection. Ecol. Inform. 2023, 75, 101919. [Google Scholar] [CrossRef]
  30. Wang, C.Y.; Bochkovskiy, A.; Liao, H.Y.M. YOLOv7: Trainable bag-of-freebies sets new state-of-the-art for real-time object detectors. In Proceedings of the IEEE/CVF Conference on Computer Vision and Pattern Recognition, Vancouver, BC, Canada, 18–22 June 2023; pp. 7464–7475. [Google Scholar]
  31. He, Y.; Su, B.; Yan, J.; Tang, J.; Liu, C. Research on underwater object detection of improved YOLOv7 model based on attention mechanism: The underwater detection module YOLOv7-C. In Proceedings of the 2022 4th International Conference on Robotics, Intelligent Control and Artificial Intelligence, Dongguan, China, 16–18 December 2022; pp. 302–307. [Google Scholar]
  32. Pashler, H.; Johnston, J.C.; Ruthruff, E. Attention and performance. Annu. Rev. Psychol. 2001, 52, 629–651. [Google Scholar] [CrossRef]
  33. Wang, Y.; Zhang, T.; Wang, G. Small-target predetection with an attention mechanism. Opt. Eng. 2002, 41, 872–885. [Google Scholar] [CrossRef]
  34. Zuo, Z.; Tong, X.; Wei, J.; Su, S.; Wu, P.; Guo, R.; Sun, B. AFFPN: Attention fusion feature pyramid network for small infrared target detection. Remote Sens. 2022, 14, 3412. [Google Scholar] [CrossRef]
  35. Zhu, W.; Wang, L.; Jin, Z.; He, D. Lightweight small object detection network with attention mechanism. Opt. Precis. Eng. 2022, 30, 998–1010. [Google Scholar] [CrossRef]
  36. Kim, M.; Jeong, J.; Kim, S. ECAP-YOLO: Efficient channel attention pyramid YOLO for small object detection in aerial image. Remote Sens. 2021, 13, 4851. [Google Scholar] [CrossRef]
  37. Dai, Y.; Gieseke, F.; Oehmcke, S.; Wu, Y.; Barnard, K. Attentional feature fusion. In Proceedings of the IEEE/CVF Winter Conference on Applications of Computer Vision, Waikoloa, HI, USA, 3–8 January 2021; pp. 3560–3569. [Google Scholar]
  38. Guo, C.; Fan, B.; Zhang, Q.; Xiang, S.; Pan, C. AugFPN: Improving multi-scale feature learning for object detection. In Proceedings of the IEEE/CVF Conference on Computer Vision and Pattern Recognition, Seattle, WA, USA, 13–19 June 2020; pp. 12595–12604. [Google Scholar]
  39. Wang, Z.; Wang, B.; Xu, N. SAR ship detection in complex background based on multi-feature fusion and non-local channel attention mechanism. Int. J. Remote Sens. 2021, 42, 7519–7550. [Google Scholar] [CrossRef]
  40. Song, H.; Kim, M.; Lee, J.G. Selfie: Refurbishing unclean samples for robust deep learning. In Proceedings of the International Conference on Machine Learning, Long Beach, CA, USA, 9–15 June 2019; pp. 5907–5915. [Google Scholar]
  41. Ng, X.L.; Ong, K.E.; Zheng, Q.; Ni, Y.; Yeo, S.Y.; Liu, J. Animal Kingdom: A large and diverse dataset for animal behavior understanding. In Proceedings of the IEEE/CVF Conference on Computer Vision and Pattern Recognition, New Orleans, LA, USA, 19–24 June 2022; pp. 19023–19034. [Google Scholar]
  42. Cao, J.; Tang, H.; Fang, H.S.; Shen, X.; Lu, C.; Tai, Y.W. Cross-domain adaptation for animal pose estimation. In Proceedings of the IEEE/CVF International Conference on Computer Vision, Seoul, Republic of Korea, 27 October–2 November 2019; pp. 9498–9507. [Google Scholar]
  43. Khan, M.H.; McDonagh, J.; Khan, S.; Shahabuddin, M.; Arora, A.; Khan, F.S.; Shao, L.; Tzimiropoulos, G. Animalweb: A large-scale hierarchical dataset of annotated animal faces. In Proceedings of the IEEE/CVF Conference on Computer Vision and Pattern Recognition, Seattle, WA, USA, 13–19 June 2020; pp. 6939–6948. [Google Scholar]
  44. Maggiori, E.; Tarabalka, Y.; Charpiat, G.; Alliez, P. Can semantic labeling methods generalize to any city? The inria aerial image labeling benchmark. In Proceedings of the 2017 IEEE International Geoscience and Remote Sensing Symposium (IGARSS), Fort Worth, TX, USA, 23–28 July 2017; pp. 3226–3229. [Google Scholar]
  45. Chen, Q.; Wang, L.; Wu, Y.; Wu, G.; Guo, Z.; Waslander, S. Aerial imagery for roof segmentation: A large-scale dataset towards automatic mapping of buildings. arXiv 2018, arXiv:1807.09532. [Google Scholar] [CrossRef]
  46. Van Etten, A.; Lindenbaum, D.; Bacastow, T.M. Spacenet: A remote sensing dataset and challenge series. arXiv 2018, arXiv:1807.01232. [Google Scholar]
  47. Lee Son, G.; Romain, S.; Rose, C.; Moore, B.; Magrane, K.; Packer, P.; Wallace, F. Development of Electronic Monitoring (EM) Computer Vision Systems and Machine Learning Algorithms for Automated Catch Accounting in Alaska Fisheries; Alaska Fisheries Science Center; NOAA; National Marine Fisheries Service: Seattle, WA, USA, 2023.
  48. Naude, J.; Joubert, D. The Aerial Elephant Dataset: A New Public Benchmark for Aerial Object Detection. In Proceedings of the IEEE/CVF Conference on Computer Vision and Pattern Recognition Workshops, Long Beach, CA, USA, 16–20 June 2019; pp. 48–55. [Google Scholar]
  49. Friedrich, N.O.; Meyder, A.; de Bruyn Kops, C.; Sommer, K.; Flachsenberg, F.; Rarey, M.; Kirchmair, J. High-quality dataset of protein-bound ligand conformations and its application to benchmarking conformer ensemble generators. J. Chem. Inf. Model. 2017, 57, 529–539. [Google Scholar] [CrossRef]
  50. Kazmi, H.; Munné-Collado, Í.; Mehmood, F.; Syed, T.A.; Driesen, J. Towards data-driven energy communities: A review of open-source datasets, models and tools. Renew. Sustain. Energy Rev. 2021, 148, 111290. [Google Scholar] [CrossRef]
  51. Redmon, J.; Divvala, S.; Girshick, R.; Farhadi, A. You only look once: Unified, real-time object detection. In Proceedings of the IEEE Conference on Computer Vision and Pattern Recognition, Las Vegas, NV, USA, 27–30 June 2016; pp. 779–788. [Google Scholar]
  52. Liu, W.; Anguelov, D.; Erhan, D.; Szegedy, C.; Reed, S.; Fu, C.Y.; Berg, A.C. SSD: Single shot multibox detector. In Proceedings of the Computer Vision—ECCV 2016, 14th European Conference, Amsterdam, The Netherlands, 11–14 October 2016; Springer: Cham, Switzerland, 2016; pp. 21–37. [Google Scholar]
  53. Simonyan, K.; Zisserman, A. Very deep convolutional networks for large-scale image recognition. arXiv 2014, arXiv:1409.1556. [Google Scholar]
  54. Zhang, S.; Wen, L.; Bian, X.; Lei, Z.; Li, S.Z. Single-shot refinement neural network for object detection. In Proceedings of the IEEE Conference on Computer Vision and Pattern Recognition, Salt Lake City, UT, USA, 18–23 June 2018; pp. 4203–4212. [Google Scholar]
  55. Girshick, R.; Donahue, J.; Darrell, T.; Malik, J. Rich feature hierarchies for accurate object detection and semantic segmentation. In Proceedings of the IEEE Conference on Computer Vision and Pattern Recognition, Columbus, OH, USA, 23–28 June 2014; pp. 580–587. [Google Scholar]
  56. He, K.; Zhang, X.; Ren, S.; Sun, J. Spatial pyramid pooling in deep convolutional networks for visual recognition. IEEE Trans. Pattern Anal. Mach. Intell. 2015, 37, 1904–1916. [Google Scholar] [CrossRef] [PubMed]
  57. Girshick, R. Fast R-CNN. In Proceedings of the IEEE International Conference on Computer Vision, Santiago, Chile, 7–13 December 2015; pp. 1440–1448. [Google Scholar]
  58. Ren, S.; He, K.; Girshick, R.; Sun, J. Faster R-CNN: Towards real-time object detection with region proposal networks. Adv. Neural Inf. Process. Syst. 2015, 28, 91–99. [Google Scholar] [CrossRef] [PubMed]
  59. Dai, J.; Li, Y.; He, K.; Sun, J. R-FCN: Object detection via region-based fully convolutional networks. Adv. Neural Inf. Process. Syst. 2016, 29, 379–387. [Google Scholar]
  60. Li, Z.; Peng, C.; Yu, G.; Zhang, X.; Deng, Y.; Sun, J. Light-head R-CNN: In defense of two-stage object detector. arXiv 2017, arXiv:1711.07264. [Google Scholar]
  61. Szegedy, C.; Vanhoucke, V.; Ioffe, S.; Shlens, J.; Wojna, Z. Rethinking the inception architecture for computer vision. In Proceedings of the IEEE Conference on Computer Vision and Pattern Recognition, Las Vegas, NV, USA, 27–30 June 2016; pp. 2818–2826. [Google Scholar]
  62. Yu, C.; Wang, J.; Peng, C.; Gao, C.; Yu, G.; Sang, N. BiSeNet: Bilateral segmentation network for real-time semantic segmentation. In Proceedings of the European Conference on Computer Vision (ECCV), Munich, Germany, 8–14 September 2018; pp. 325–341. [Google Scholar]
  63. Fu, J.; Liu, J.; Jiang, J.; Li, Y.; Bao, Y.; Lu, H. Scene segmentation with dual relation-aware attention network. IEEE Trans. Neural Netw. Learn. Syst. 2020, 32, 2547–2560. [Google Scholar] [CrossRef] [PubMed]
  64. Wang, Q.; Wu, B.; Zhu, P.; Li, P.; Zuo, W.; Hu, Q. ECA-Net: Efficient channel attention for deep convolutional neural networks. In Proceedings of the IEEE/CVF Conference on Computer Vision and Pattern Recognition, Seattle, WA, USA, 13–19 June 2020; pp. 11534–11542. [Google Scholar]
  65. Tong, W.; Chen, W.; Han, W.; Li, X.; Wang, L. Channel-attention-based DenseNet network for remote sensing image scene classification. IEEE J. Sel. Top. Appl. Earth Obs. Remote Sens. 2020, 13, 4121–4132. [Google Scholar] [CrossRef]
  66. Yang, X.; Shi, J.; Zhang, J. Gated channel attention mechanism YOLOv3 network for small target detection. Adv. Multimed. 2022, 2022, 8703380. [Google Scholar] [CrossRef]
  67. Hodgson, J.C.; Baylis, S.M.; Mott, R.; Herrod, A.; Clarke, R.H. Precision wildlife monitoring using unmanned aerial vehicles. Sci. Rep. 2016, 6, 22574. [Google Scholar] [CrossRef]
  68. Sirmacek, B.; Wegmann, M.; Cross, A.; Hopcraft, J.; Reinartz, P.; Dech, S. Automatic population counts for improved wildlife management using aerial photography. In Proceedings of the 6th International Congress on Environmental Modelling and Software, Leipzig, Germany, 1–5 July 2012. [Google Scholar]
  69. Ruwaimana, M.; Satyanarayana, B.; Otero, V.; Muslim, A.M.; Syafiq, A.M.; Ibrahim, S.; Raymaekers, D.; Koedam, N.; Dahdouh-Guebas, F. The advantages of using drones over space-borne imagery in the mapping of mangrove forests. PLoS ONE 2018, 13, e0200288. [Google Scholar] [CrossRef]
  70. Raoult, V.; Colefax, A.P.; Allan, B.M.; Cagnazzi, D.; Castelblanco-Martínez, N.; Ierodiaconou, D.; Johnston, D.W.; Landeo-Yauri, S.; Lyons, M.; Pirotta, V.; et al. Operational protocols for the use of drones in marine animal research. Drones 2020, 4, 64. [Google Scholar] [CrossRef]
  71. Mnih, V.; Hinton, G.E. Learning to detect roads in high-resolution aerial images. In Proceedings of the Computer Vision—ECCV 2010, 11th European Conference on Computer Vision, Heraklion, Crete, Greece, 5–11 September 2010; Springer: Cham, Switzerland, 2010; pp. 210–223. [Google Scholar]
  72. Fang, Y.; Du, S.; Abdoola, R.; Djouani, K.; Richards, C. Motion based animal detection in aerial videos. Procedia Comput. Sci. 2016, 92, 13–17. [Google Scholar] [CrossRef]
  73. Bennitt, E.; Bartlam-Brooks, H.L.; Hubel, T.Y.; Wilson, A.M. Terrestrial mammalian wildlife responses to Unmanned Aerial Systems approaches. Sci. Rep. 2019, 9, 2142. [Google Scholar] [CrossRef] [PubMed]
  74. Fust, P.; Loos, J. Development perspectives for the application of autonomous, unmanned aerial systems (UASs) in wildlife conservation. Biol. Conserv. 2020, 241, 108380. [Google Scholar] [CrossRef]
  75. Tan, L.; Lv, X.; Lian, X.; Wang, G. YOLOv4_Drone: UAV image target detection based on an improved YOLOv4 algorithm. Comput. Electr. Eng. 2021, 93, 107261. [Google Scholar] [CrossRef]
  76. Benjdira, B.; Khursheed, T.; Koubaa, A.; Ammar, A.; Ouni, K. Car detection using unmanned aerial vehicles: Comparison between faster R-CNN and YOLOv3. In Proceedings of the 2019 1st International Conference on Unmanned Vehicle Systems-Oman (UVS), Muscat, Oman, 5–7 February 2019; pp. 1–6. [Google Scholar]
  77. Hu, J.; Shen, L.; Albanie, S.; Sun, G.; Wu, E. Squeeze-and-excitation networks. IEEE Trans. Pattern Anal. Mach. Intell. 2020, 42, 2011–2023. [Google Scholar] [CrossRef]
  78. Vaswani, A.; Shazeer, N.; Parmar, N.; Uszkoreit, J.; Jones, L.; Gomez, A.N.; Kaiser, Ł.; Polosukhin, I. Attention is all you need. Adv. Neural Inf. Process. Syst. 2017, 30, 5998–6008. [Google Scholar]
  79. Van der Maaten, L.; Hinton, G. Visualizing data using t-SNE. J. Mach. Learn. Res. 2008, 9, 2579–2605. [Google Scholar]
  80. Xia, G.S.; Bai, X.; Ding, J.; Zhu, Z.; Belongie, S.; Luo, J.; Datcu, M.; Pelillo, M.; Zhang, L. DOTA: A large-scale dataset for object detection in aerial images. In Proceedings of the IEEE Conference on Computer Vision and Pattern Recognition, Salt Lake City, UT, USA, 18–23 June 2018; pp. 3974–3983. [Google Scholar]
  81. Krichen, M.; Adoni, W.Y.H.; Mihoub, A.; Alzahrani, M.Y.; Nahhal, T. Security challenges for drone communications: Possible threats, attacks and countermeasures. In Proceedings of the 2022 2nd International Conference of Smart Systems and Emerging Technologies (SMARTTECH), Riyadh, Saudi Arabia, 9–11 May 2022; pp. 184–189. [Google Scholar]
  82. Ko, Y.; Kim, J.; Duguma, D.G.; Astillo, P.V.; You, I.; Pau, G. Drone secure communication protocol for future sensitive applications in military zone. Sensors 2021, 21, 2057. [Google Scholar] [CrossRef]
  83. Vergouw, B.; Nagel, H.; Bondt, G.; Custers, B. Drone technology: Types, payloads, applications, frequency spectrum issues and future developments. In The Future of Drone Use: Opportunities and Threats from Ethical and Legal Perspectives; T.M.C. Asser Press: The Hague, The Netherlands, 2016; pp. 21–45. [Google Scholar]
Figure 1. Example of aerial images of zebra migration at different flight heights.
Applsci 13 10397 g001
Figure 2. Some images from our (a) WAID dataset and four other datasets for comparison: (b) ANIMAL, (c) APD, (d) AnimalWeb, and (e) Animal Kingdom.
Applsci 13 10397 g002
Figure 3. Framework for dataset design and construction.
Applsci 13 10397 g003
Figure 4. Architecture for SEBlock module.
Applsci 13 10397 g004
Figure 5. Comparison of the original YOLOv7 backbone network after improvement.
Applsci 13 10397 g005
Figure 6. Histogram of the number of instances per class and annotation box situation.
Applsci 13 10397 g006
Figure 7. The results of density-based clustering of low-dimensional feature embedding obtained by using the t-stochastic neighbor embedding (t-SNE) method.
Applsci 13 10397 g007
Figure 8. The results and comparison of wildlife detection in aerial image using the different network models.
Applsci 13 10397 g008
Figure 9. The detection examples of case study. The targets in yellow boxes are the minimal objects of about 20 pixel points that can be detected. The targets in fluorescent blue boxes are the minimal objects less than 20 pixel points can not be detected.
Applsci 13 10397 g009
Table 1. A summary of the animal image datasets currently available. Some images from the datasets are shown in Figure 2.
DatasetAnimal10Animal-PoseAnimalWebAnimal KingdomWAID (Ours)
Year20192019202020222023
multicategory
Wilderness×
Multiscale××
ValidationSet×××
AerialView××××
Table 2. The numbers of wildlife in different classes used for training, validation, and testing for each class in the WAID dataset.
ClassSheepCattleSealCamelusZebraKiang
Training360233012709512443551
Validation349943330149126157
Testing173471329826574
Total412447153368743643782
Table 3. The performance of object detection using different algorithms.
MethodBackbonePrecisionRecallmAP
YOLOv5CSPDarknet530.9490.9160.956
YOLOv7CSPDarknet530.9640.9530.972
YOLOv8CSPDarknet530.9480.9060.958
Faster-RCNNResNet500.5170.8550.779
Faster-RCNNVGG160.2790.7560.610
SSDMobileNetv20.7570.4460.591
SSDVGG160.9300.4300.739
SE-YOLOCSPDarknet530.9780.9690.983
Table 4. Class-wise object detection results on WAID test set. Bold in black is the best result of different models on the same animal category.
SE-YOLOYOLOv5YOLOv7YOLOv8SSD
(VGG16)
SSD
(MobileNetv2)
Faster-RCNN
(VGG16)
Faster-RCNN
(ResNet50)
Sheep0.9880.9700.9720.9810.6270.4250.3160.484
Cattle0.9870.9840.9880.9710.8240.7210.6220.761
Seal0.9940.9800.9800.9840.9260.8210.6840.922
Camelus0.9830.9430.9780.9210.7630.6540.7460.910
Kiang0.9710.9250.9500.9450.6360.4440.6610.824
Zebra0.9770.9320.9640.9440.6600.4790.6290.771
mAP0.9830.9560.9720.9580.7390.5910.6100.779
Table 5. The recognition performance of SE-YOLO and YOLOv7 on the minimal targets.
MethodsPrecisionRecallmAP
YOLOv70.7960.8750.822
SE-YOLO0.9290.8470.926
Table 6. Comparison of results on WAID and MSAWID using SE-YOLO (scores in mAP).
Training SetTest SetPrecisionRecallmAP@0.5mAP@0.5:0.95
WAIDWAID0.9780.9690.9830.677
WAIDMSAWID0.4690.4220.3950.226
MSAWIDMSAWID0.7510.6570.6760.396
MSAWIDWAID0.3030.1690.1530.076
Disclaimer/Publisher’s Note: The statements, opinions and data contained in all publications are solely those of the individual author(s) and contributor(s) and not of MDPI and/or the editor(s). MDPI and/or the editor(s) disclaim responsibility for any injury to people or property resulting from any ideas, methods, instructions or products referred to in the content.

