Article

Dynamic Measuring Method of Laser Beam Incident Angle for Laser Doppler Vibrometer

Research Institute of Highway Ministry of Transport, Beijing 100088, China
*
Authors to whom correspondence should be addressed.
Appl. Sci. 2023, 13(18), 10396; https://doi.org/10.3390/app131810396
Submission received: 24 August 2023 / Revised: 8 September 2023 / Accepted: 13 September 2023 / Published: 17 September 2023

Abstract

:
Accurately measuring the incident angle of the laser Doppler vibrometer (LDV) laser beam is crucial for calculating the accurate dynamic response of a target. Nonetheless, conventional measuring methods may encounter limitations due to spatial constraints. To address this issue, a novel high-precision dynamic measuring method is proposed based on the measuring principle of LDV. Furthermore, a compact dynamic measuring device is constructed to facilitate this method. The proposed method involves the simulation of various tangential velocities utilizing a high precision rotating disk system. Subsequently, the laser beam incident angle is computed based on the projection relationship established between the average value of LDV measurements and the simulated velocities. To validate the feasibility of the dynamic measuring method and the correctness of the obtained incident angle, the paper compares this angle with that obtained through a conventional laser beam measuring method and device. This paper analyzes four key factors that may affect the angle measuring results theoretically and experimentally: environmental noise, laser spot position error, roll angle, and pitch angle of the rotating disk. The results indicate that the laser spot position error and the pitch angle of the rotating disk are more influential than the other two factors. Corresponding optimization measures are also proposed to improve the measuring accuracy.

1. Introduction

Doppler vibrometer technology was proposed in 1964 along with the fluid velocity measurement [1] and was gradually commercialized as a typical laser Doppler vibrometer (LDV). This technique measures the Doppler frequency shift caused by a light beam reflected by a vibrating object [2]. The Doppler frequency shift is proportional to the surface velocity of the target. It is not affected by the distance between the LDV and the target [3] (the distance will affect the received power of the reflected beam), so it is a convenient and non-contact method to measure the vibration velocity and displacement.
At present, LDVs are widely used in various fields, such as the monitoring of bridge structures [4,5], the oscillation amplitude of high-speed hard drives [6], defects in structural parts [7], fruit maturity [8], and angular displacement measurement [9], and have become adequate substitutes for traditional contact sensors. In these cases, the LDV measurements were not used directly for quantitative analysis; instead, features implicit in the measured signals, such as frequency, were explored. When the LDV values are used as an intermediate quantity of the final test result, it is necessary to calibrate the direction of the LDV laser beam. This is mainly because the direction of the laser beam determines the displacement/velocity component measured by the LDV. From the perspective of the measurement principle, LDV picks up the vibration response of a single point on the target surface in the direction of the laser beam (not necessarily equal to the vibration direction) [10]. If the laser beam is aligned with the vibration direction, the measurement is accurate; otherwise, the measurement will be affected. Therefore, to accurately calculate the actual vibration response of the measured point, it is necessary to measure the incident angle of the laser beam accurately. However, affected by the precision error of the LDV itself, the processing error of the fixed structural parts, and the assembly error of the two, the direction of the laser beam may be different from the expected one, and the result will inevitably affect the subsequent measurement accuracy based on LDV values [1].
An excellent application of LDVs in the transportation industry is the Laser High-Speed Deflectometer [11], commonly referred to as the Traffic Speed Deflectometer (TSD) [12,13,14] or Laser Dynamic Deflectometer (LDD) [15,16]. Multiple LDVs are installed on a stiff beam inside the trailer compartment of this detection instrument, which can efficiently measure the deformation velocity of the road surface under the rolling of the vehicle’s weight in real-time [13,17,18] and back-calculate the deflection value based on the Euler–Bernoulli beam model. The practical results show that this measuring method is greatly affected by the incident angle of the LDV laser beam. Wix et al. [19] pointed out that a deviation of 0.005° in the incident angle would cause a 25% error in the velocity measurement. Therefore, it is crucial to calibrate the incident angle of the LDV laser beam.
As a successful case in the field of road detection, the manufacturers and users of laser high-speed deflectometers have proposed various ways to obtain the incident angle of LDV, but the inability to trace the source limits the timely promotion and application of this advanced technology. To obtain the accurate incident angle of the laser beam, the British Transport Research Laboratory, Denmark’s Green Wood company, and Wix et al. proposed the absolute calibration method [20], the ballast method [21], and the offset method [19], respectively. Although the above techniques can theoretically obtain the accurate incident angle of the LDV laser beam, it needs to embed the accelerometer, find the ideal long-distance rigid road surface, load and unload the counterweight, or lengthen the trailer body and other harsh conditions, and the implementation process is complicated. In addition, Li et al. [16] proposed the method of relative motion to calibrate the incident angle. This method introduces a controllable flat plate that moves along a straight line under the stiff beam (used to fixing the LDVs). Nevertheless, this method is only suitable for research in the laboratory. When the LDVs are installed on the detection instrument and work with the vehicle bumps for some time, the calibrated angle may change again. Therefore, it is essential to propose a convenient and feasible high-precision measuring method for the incident angle of the LDV laser beam.
Various kinds of lasers have been used in engineering practice [22], providing reference for calibration and measurement methods. These methods include methods based on camera images [23], methods based on differential mathematical models [24], methods based on three-dimensional distance [25], methods based on data processing fusion technology [26], methods based on high-precision laser probes [27], methods based on chessboards [28,29], and methods based on large laser planar systems [30]. These researchers solved and calibrated the laser orientation using geometric constraints such as plane, sphere, and cone [27]. However, these calibration methods or measurement models are complex, and the measuring devices may require relatively large space, which is unsuitable for limited space. For example, the LDV laser beam of the Laser High-speed Deflectometer passes through the middle of the twin tires of the trailer, and the narrow space hinders these traditional measuring methods. Wu et al. [31] proposed that measurement accuracy strongly depends on the measuring methods. Therefore, presenting a targeted measuring method for LDV in a specific situation is necessary.
The rotating disk is essential for calibrating LDVs [32,33]. Shiral et al. [32] studied the uncertainty of LDV measurement velocity by using a rotating disk processed with slits. Terra and Hussein [33] developed a system based on a commercial optical chopper (essentially a rotating disk) for calibrating the velocity and uncertainty of LDV. Huang et al. [34] adopted a rotating cylinder with a radius of 600 mm to provide a more extensive velocity range, lower velocity uncertainty, and more minor alignment errors. However, these research works focus on calibrating the accuracy of LDV itself, such as speed measurement range, measurement uncertainty, etc., while ignoring the influence of the actual working scene on the direction of the LDV laser beam.
Inspired by the above work, this paper proposes a dynamic measuring method for the LDV laser beam incident angle. This method uses a rotating disk to simulate the dynamic response of the measured object. It calculates the incident angle according to the projected relationship between the LDV values and simulated speed. To verify the correctness of the measuring method, this paper obtains the actual value of the laser beam incident angle based on the traditional measuring method. The correctness of the dynamic measuring method is verified according to the comparison results of the two methods. This new dynamic measuring method can replace the angle measuring method of the original laser high-speed deflectometer, and can also be used as a metrological calibration means to verify the measurement results of the original method.
The structure of the rest of this paper is organized as follows. In Section 2, the measuring principle of LDV and its application on the laser high-speed deflection instrument is briefly explained. Section 3 reproduces the traditional measuring device and method for the laser beam angle, and calculates one of the critical parameters through image recognition: the physical displacement of the laser spot. In Section 4, this paper proposes a dynamic measuring method, builds an experimental test device, and completes the dynamic angle measurement. In Section 5, this paper analyzes four primary error sources of the proposed dynamic measuring device and proposes targeted optimization measures, respectively. The conclusions of the paper are in Section 6.

2. Basic Measurement Principles

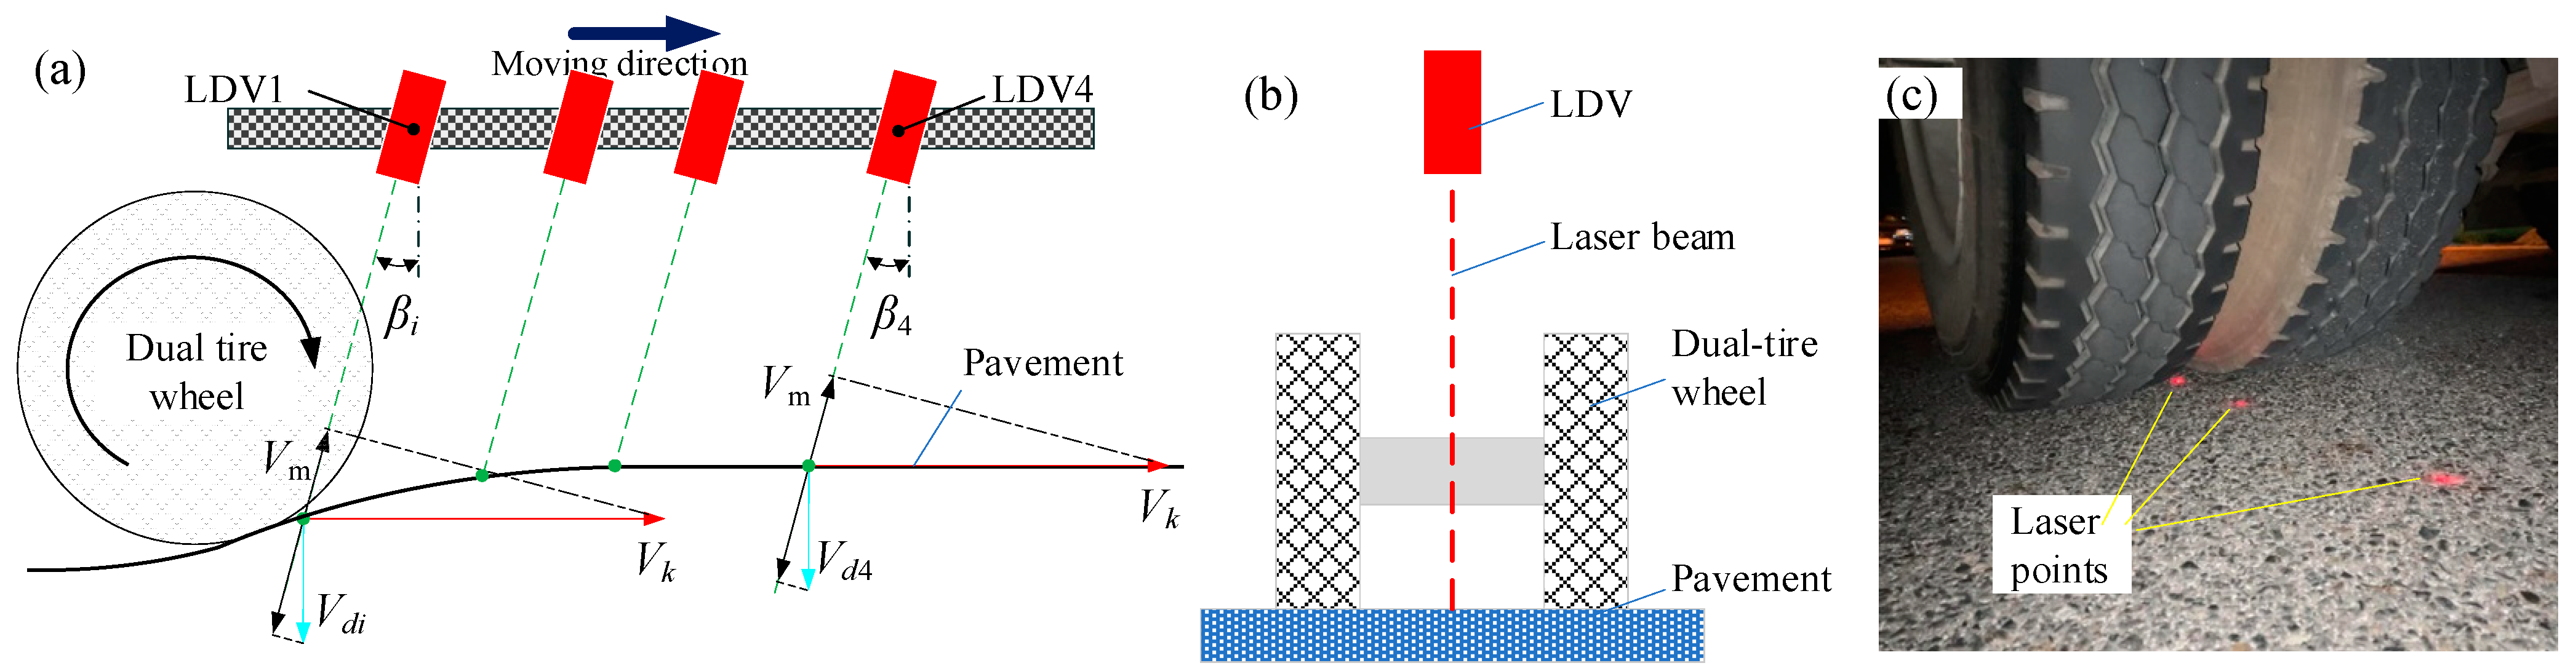
2.1. Measurement Principle of LDV

LDV measures velocity and displacement using the Doppler effect and heterodyne interference principle [35]. It emits a laser beam to the test object and is scattered back by it. Based on the Doppler effect, a slight frequency shift occurs in the signal returned to the LDV, known as the Doppler frequency shift fD. The functional relationship between the frequency fD and velocity V of the object to be measured along the beam direction can be calculated by Equation (1).
f D = 2 f C V c = 2 V λ
where, fC, c, and λ represent the laser’s frequency, wave velocity, and wavelength, respectively.

2.2. Measurement Principle of Pavement Deflection Velocity

The principle of the laser high-speed deflectometer using LDV to measure pavement deflection velocity is briefly described below. The self-weight of the deflectometer will cause the road surface to form a deflection basin in an extensive range. When the deflectometer is in motion, the deflection basin also moves. It brings trouble to traditional contact measurement. As a typical non-contact measurement tool, LDVs non-destructively measure the deformation velocity of different points in the deflection basin and then calculate the deflection value of the road surface [18]. Figure 1a shows the synthesis principle of the LDV measurement Vm. The expressions among velocity Vm, vehicle speed Vk, and pavement deformation velocity Vd are shown in Equation (2). Based on the measurement principle of LDV, Vm is the velocity of the road surface relative to the sensor itself along the direction of the laser beam. That is to say, Vm is the coupling of the component Vk·sin(β) and Vd. In the subsequent calculation based on Vd, component Vk·sin(β) must be removed from Vm.
V m = V d cos ( β ) + V k sin ( β )
According to engineering experience, angle β is generally set to about 2°, but its precise value needs to be measured and calibrated. Figure 1b,c show that the laser beam of LDV is located in the middle of the dual tire wheel, and the angle measuring methods must overcome the limitation of the narrow space. At present, equipment manufacturers and users have purposefully proposed angle measuring methods suitable for laser high-speed deflectometers, such as the ballast method [21] and the offset method [19]. However, these current methods are cumbersome and time-consuming, such as the need to increase or decrease counterweights, and the search for long straight rigid roads. When the experimental conditions are all available, the angle measurement and calibration process will also take more than 3 h.
In the following, we will use static and dynamic methods to realize the angle measurement of LDV based on experiments. Considering that the mass of the laser high-speed deflectometer is large (the total weight is more than 10 t), which makes it difficult to move in the vertical direction with high precision, we removed one LDV (Model: Polytec OFV 505/5000) and carried out experiments indoors. The static measuring method draws on the research work of Ma et al. [30]. Furthermore, since this method is traceable, we take its measurement as the true value. For the dynamic measuring method, it is a new method proposed in this paper based on the measurement principle of LDV. The work of the two measuring methods will be described in detail in Section 3 and Section 4, respectively. The key processes of static and dynamic measurement methods and their connections are shown in Figure 2.

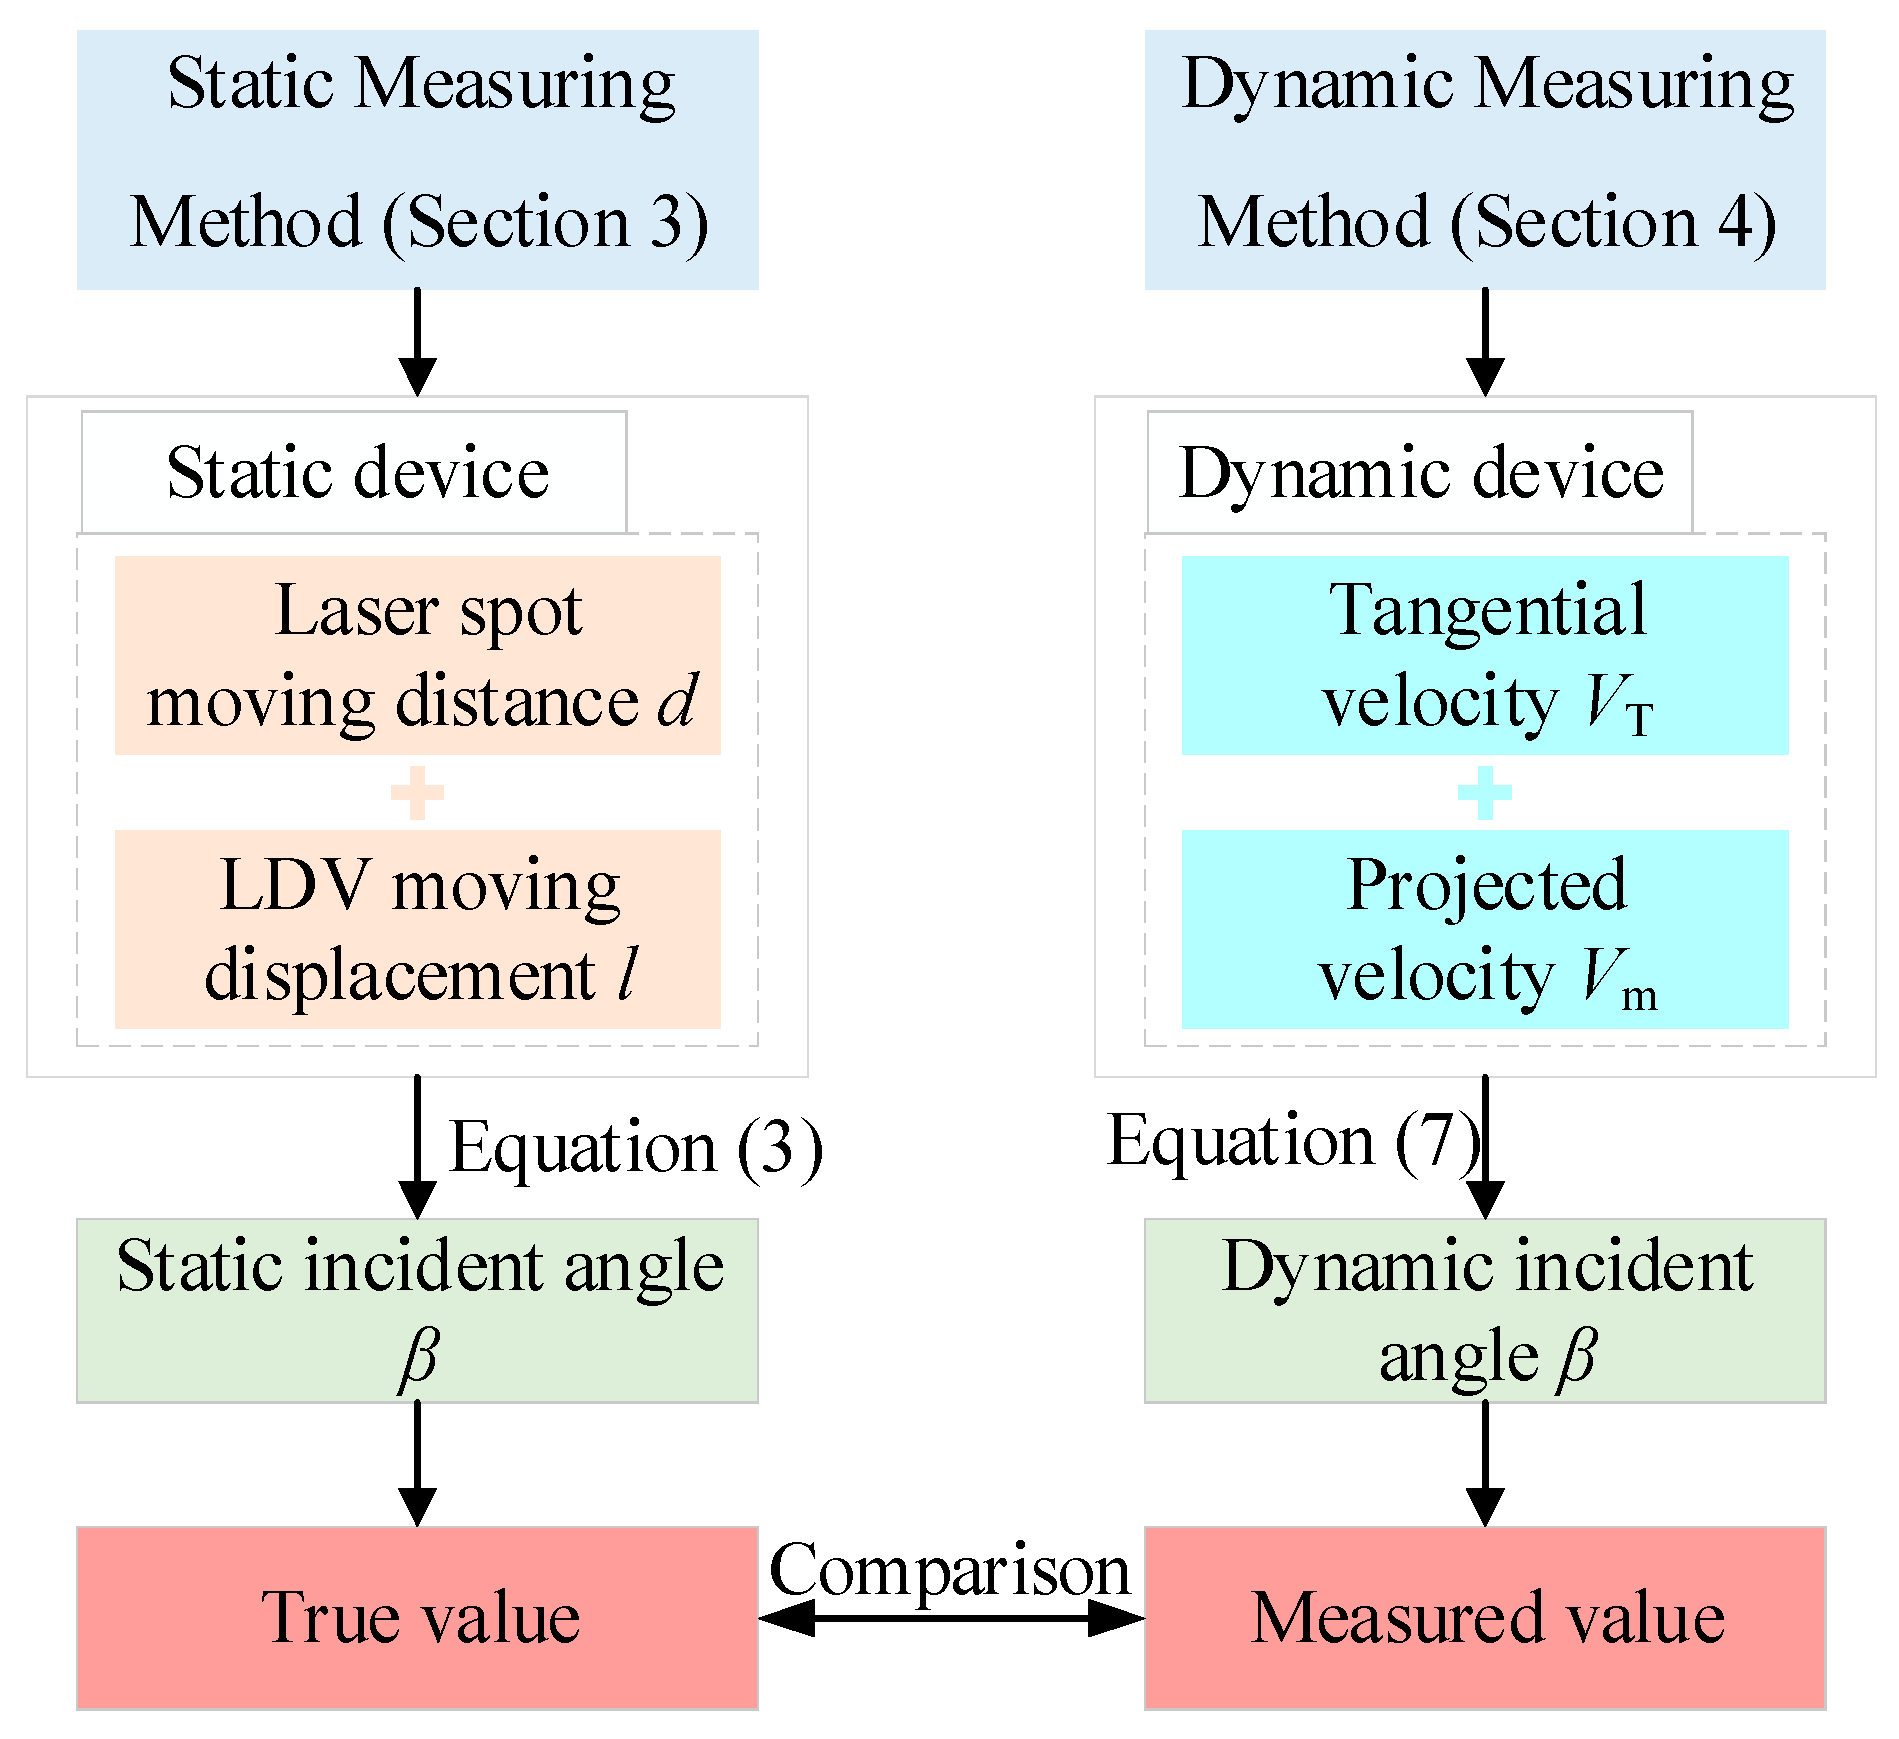
3. Static Measuring Method of Incident Angle

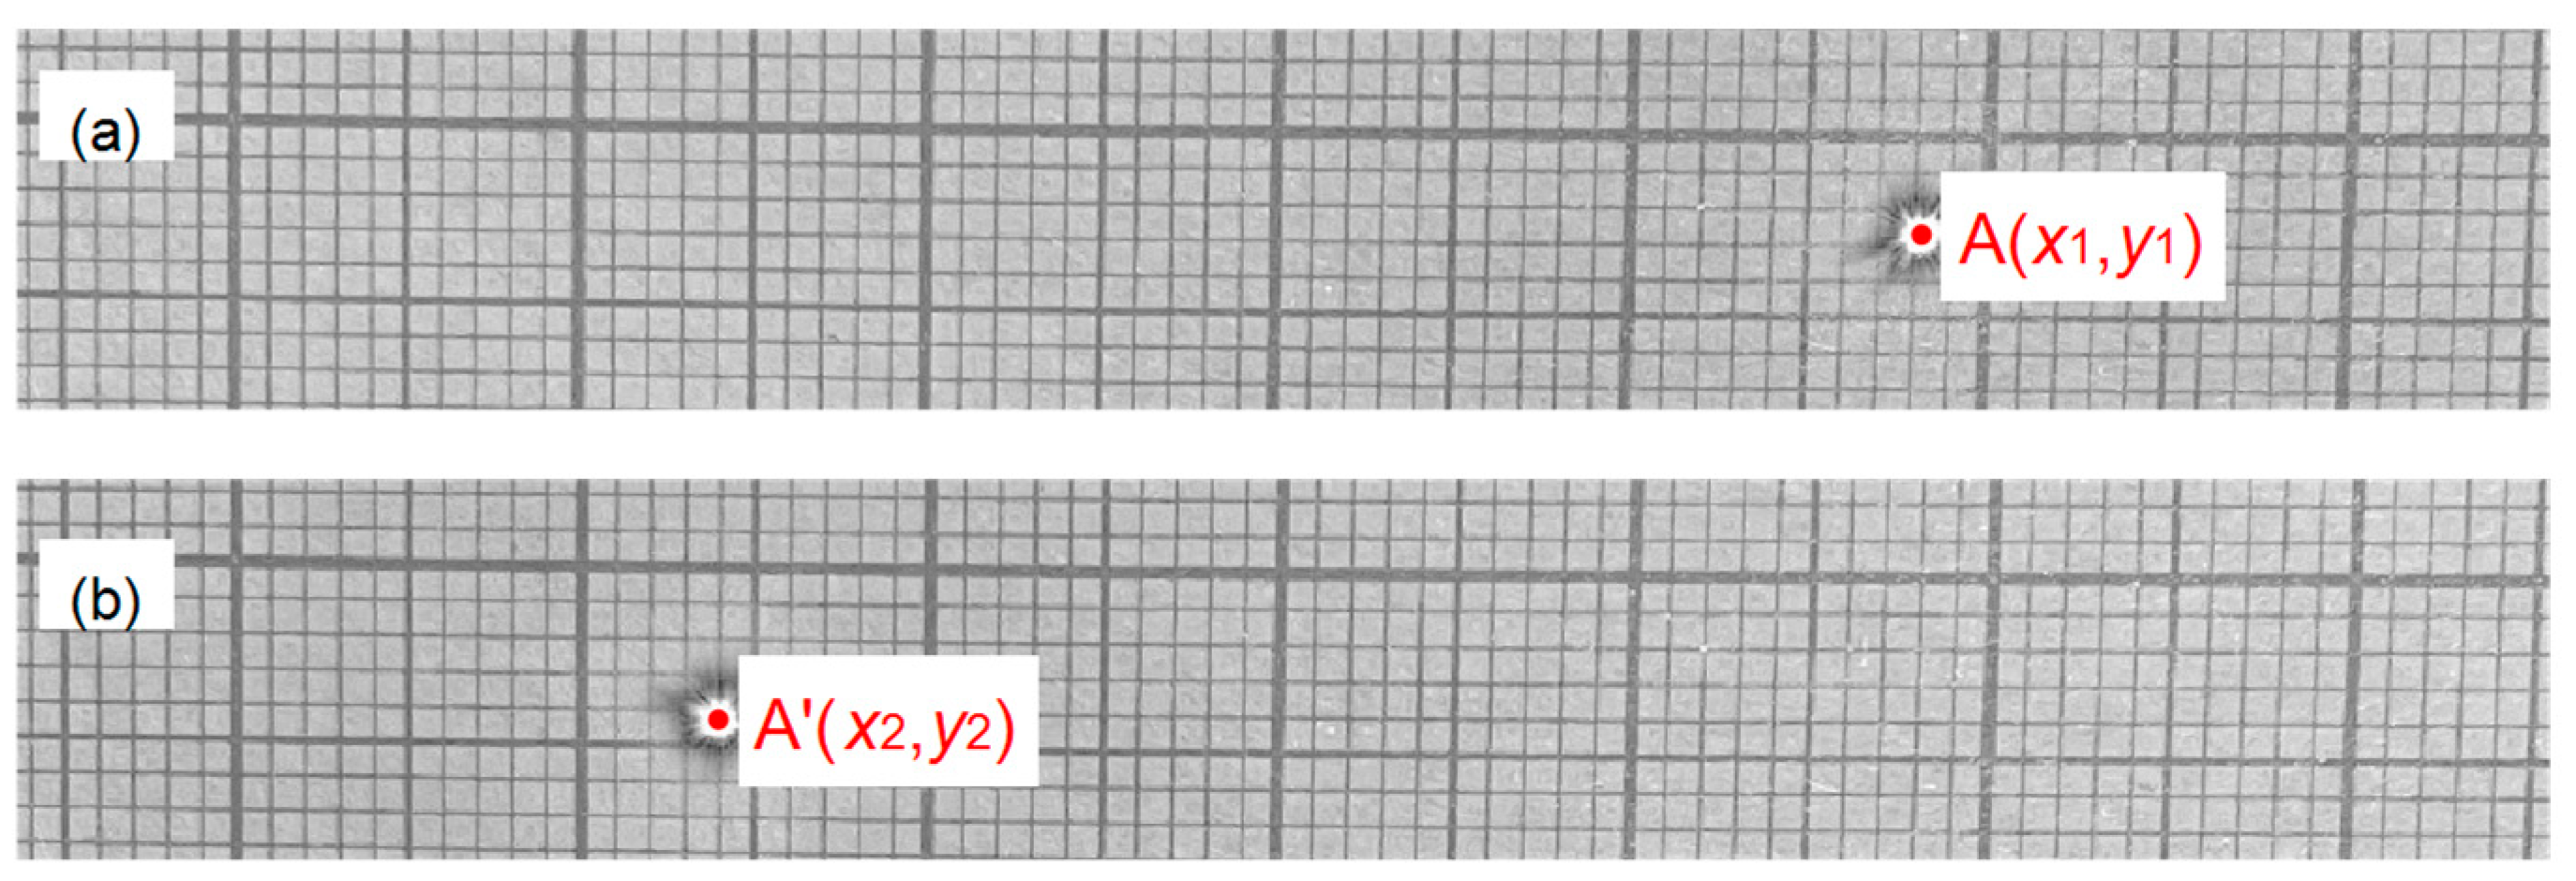
3.1. Principle of Static Measurement

The basic principle of the traditional measuring method for a laser beam angle is shown in Figure 3. A right-handed coordinate system o-xyz is established in space. The laser beam is irradiated on a piece of coordinate paper in the oxy plane with an incident angle β of about 2°. Since angle β ≠ 0, the laser spot on the coordinate paper changes with the distance between the coordinate paper and the LDV, such as moving from point A to point A′. Assuming that the moving distance of the LDV along the z-axis is l, and the moving distance of the laser spot in the oxy plane is d, then the angle β can be accurately calculated according to the geometric relationship of the triangle, see Equation (3).
β = arctan ( d / l ) · 180 / π

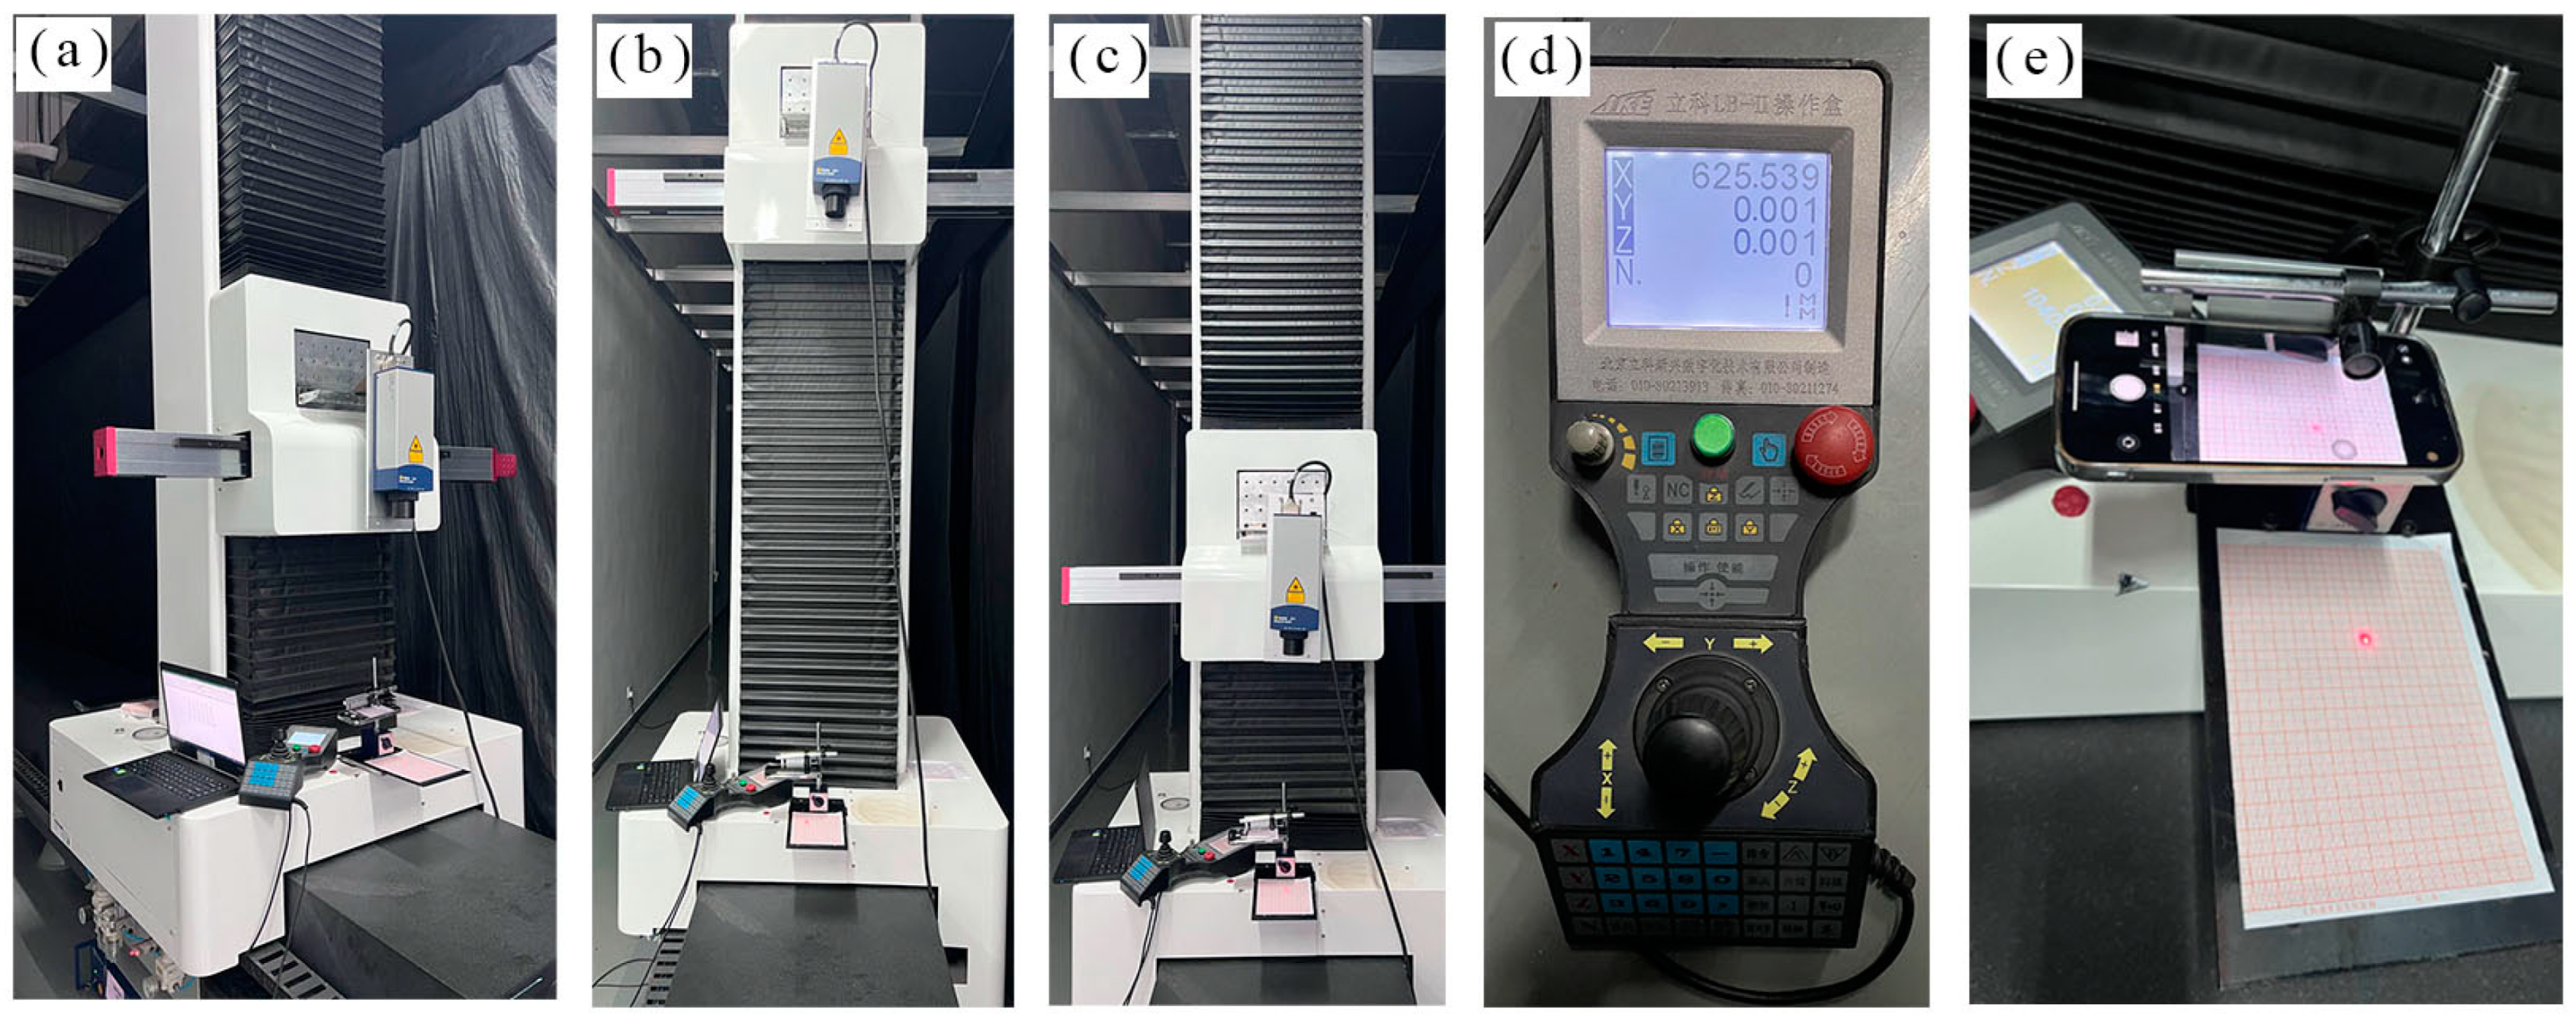
3.2. Static Measuring Device and Results

The experimental setup for static measurement is shown in Figure 4. A high-precision air-floating marble platform provides horizontal support for the entire practical device. A coordinate system o-xyz was established on the marble plane, and the marble plane was on the oxy plane. A piece of coordinate paper (120 mm × 170 mm) was pasted on this plane. One LDV (Model: Polytec OFV 505) was mounted on a sliding table perpendicular to the marble table and moved in the z-direction. The incident angle of the LDV laser beam was adjusted so that the included angle β with the z-axis was about 2°. According to Equation (3), the measuring process of angle β was transformed into the accurate measurement of two length parameters: d and l. Their operation steps and calculation methods are as follows:
Step 1. Adjust the focal length of the LDV to minimize the spot of the laser beam on the coordinate paper, and record the positions of the laser spot and the LDV, i.e., A and C;
Step 2. Move the sliding table in the z direction to change the distance between the coordinate paper and the LDV;
Step 3. Adjust the focal length of the LDV again, and record the positions of the laser spot and the LDV, i.e., A′ and C′;
Step 4. Calculated distance d and l, respectively, and then calculate angle β according to Equation (3).
On the one hand, the actual displacement l of the LDV moving along the z-axis is calculated according to Equation (4). Parameters z1 and z2 represent the corresponding coordinates of the LDV at positions C and C′, respectively. They are provided to the digital display handle by the steel tape raster gauge (position accuracy: 0.001 mm) installed on the side of the marble platform, as shown in Figure 4d.
l = z 2 z 1
On the other hand, this paper introduces the image recognition method to measure the distance d accurately, that is, to locate points A and A′. The coordinate paper containing the laser spot A (or A′) was photographed using an iPhone 12 (system version: 14.5); see Figure 4e. The camera system was fixed on the horizontal plane, and the coordinate paper had no relative movement. This process can ensure that the view fields of multiple images are consistent, thereby reducing image differences. Subsequently, pixel positions (coordinates) of the laser spots, A and A′, on the two images were identified, and their centers of gravity were, respectively, recorded as (x1, y1) and (x2, y2), as shown in Figure 5. The pixel distance dpix between points A and A′ was calculated using Equation (5).
d pix = ( x 1 x 2 ) 2 + ( y 1 y 2 ) 2
However, the pixel distance of the image is not equal to the actual physical distance. To improve the accuracy of the measuring results, a physical distance of 10 mm on the coordinate paper was selected for pixel calibration to determine the pixel value dp corresponding to each millimeter distance on the coordinate paper. Assuming that the total number of pixels corresponding to 10 mm is P, dp pixels in the image correspond to a physical distance of 1 mm on the coordinate paper, dp = P/10. In this calibration process, the mean value of 5 measurements were selected as the actual value of P. Finally, in these images, the pixel point corresponding to 10 mm was P = 202.5, and dp = 20.25.
The physical distance d of the laser spot moving from points A to A′ on the coordinate paper is calculated using Equation (6).
d = d pix / d p
The angle β was obtained using repeated measurement and averaging to reduce systematic error. Throughout the testing process, a total of 10 groups of experiments were completed. The displacements li and di corresponding to the ten tests are shown in Table 1, i = 1, 2, 3, …, 10. The table also lists the LDV incident angle βi corresponding to the ten measurement results.
According to the table, the mean value of the ten angle results of βi is 1.91204°, the standard deviation is 0.002455°, and the variation coefficient is 0.1284%. It should be noted that image processing is also affected by many factors, such as the calculation of the spot center, the resolution of the camera image, etc. When multiple factors above are combined, the error of distance d may reach 0.1 mm (i.e., 100 μm). To verify the impact of this error on the static measurement results, we modified the di values in Table 1 to di′ = di + 0.1 mm and di″ = di − 0.1 mm, i = 1, 2, 3, …, 10. Subsequently, Equation (3) was used to calculate the results of βi after considering the measurement accuracy error, and were recorded as βi′ and βi″, respectively, i = 1, 2, 3, …, 10. The summarized measurement results are also shown in the table.
The table shows that the average values of the angle static measurement results βi, βi, and βi″ are 1.9120°, 1.9172°, and 1.9055°, respectively. The differences between the latter two values and the first value are 0.0052° and −0.0065°, respectively. These results show that the measurement accuracy caused by factors such as camera image resolution and LDV focus position does not have a serious impact on the results of this experiment. Therefore, we believe that the experimental design of the angle static measurement meets the testing requirements.
Since the standard deviation and variation coefficient of the measurement results meet the engineering requirements, it is considered here that the measuring value of the LDV laser beam incident angle in this state is βCAL = 1.9120°.

4. Dynamic Measuring Method of Incident Angle

In Section 3, the true value of the incident angle of the LDV laser beam in the current installation state is obtained utilizing static measurement. However, this method is not suitable for space-constrained situations. Therefore, this section will propose a dynamic measuring method to measure the incident angle of the same LDV again. By comparing the measurement results of the two methods, it is demonstrated that the new method can replace the traditional measuring method.

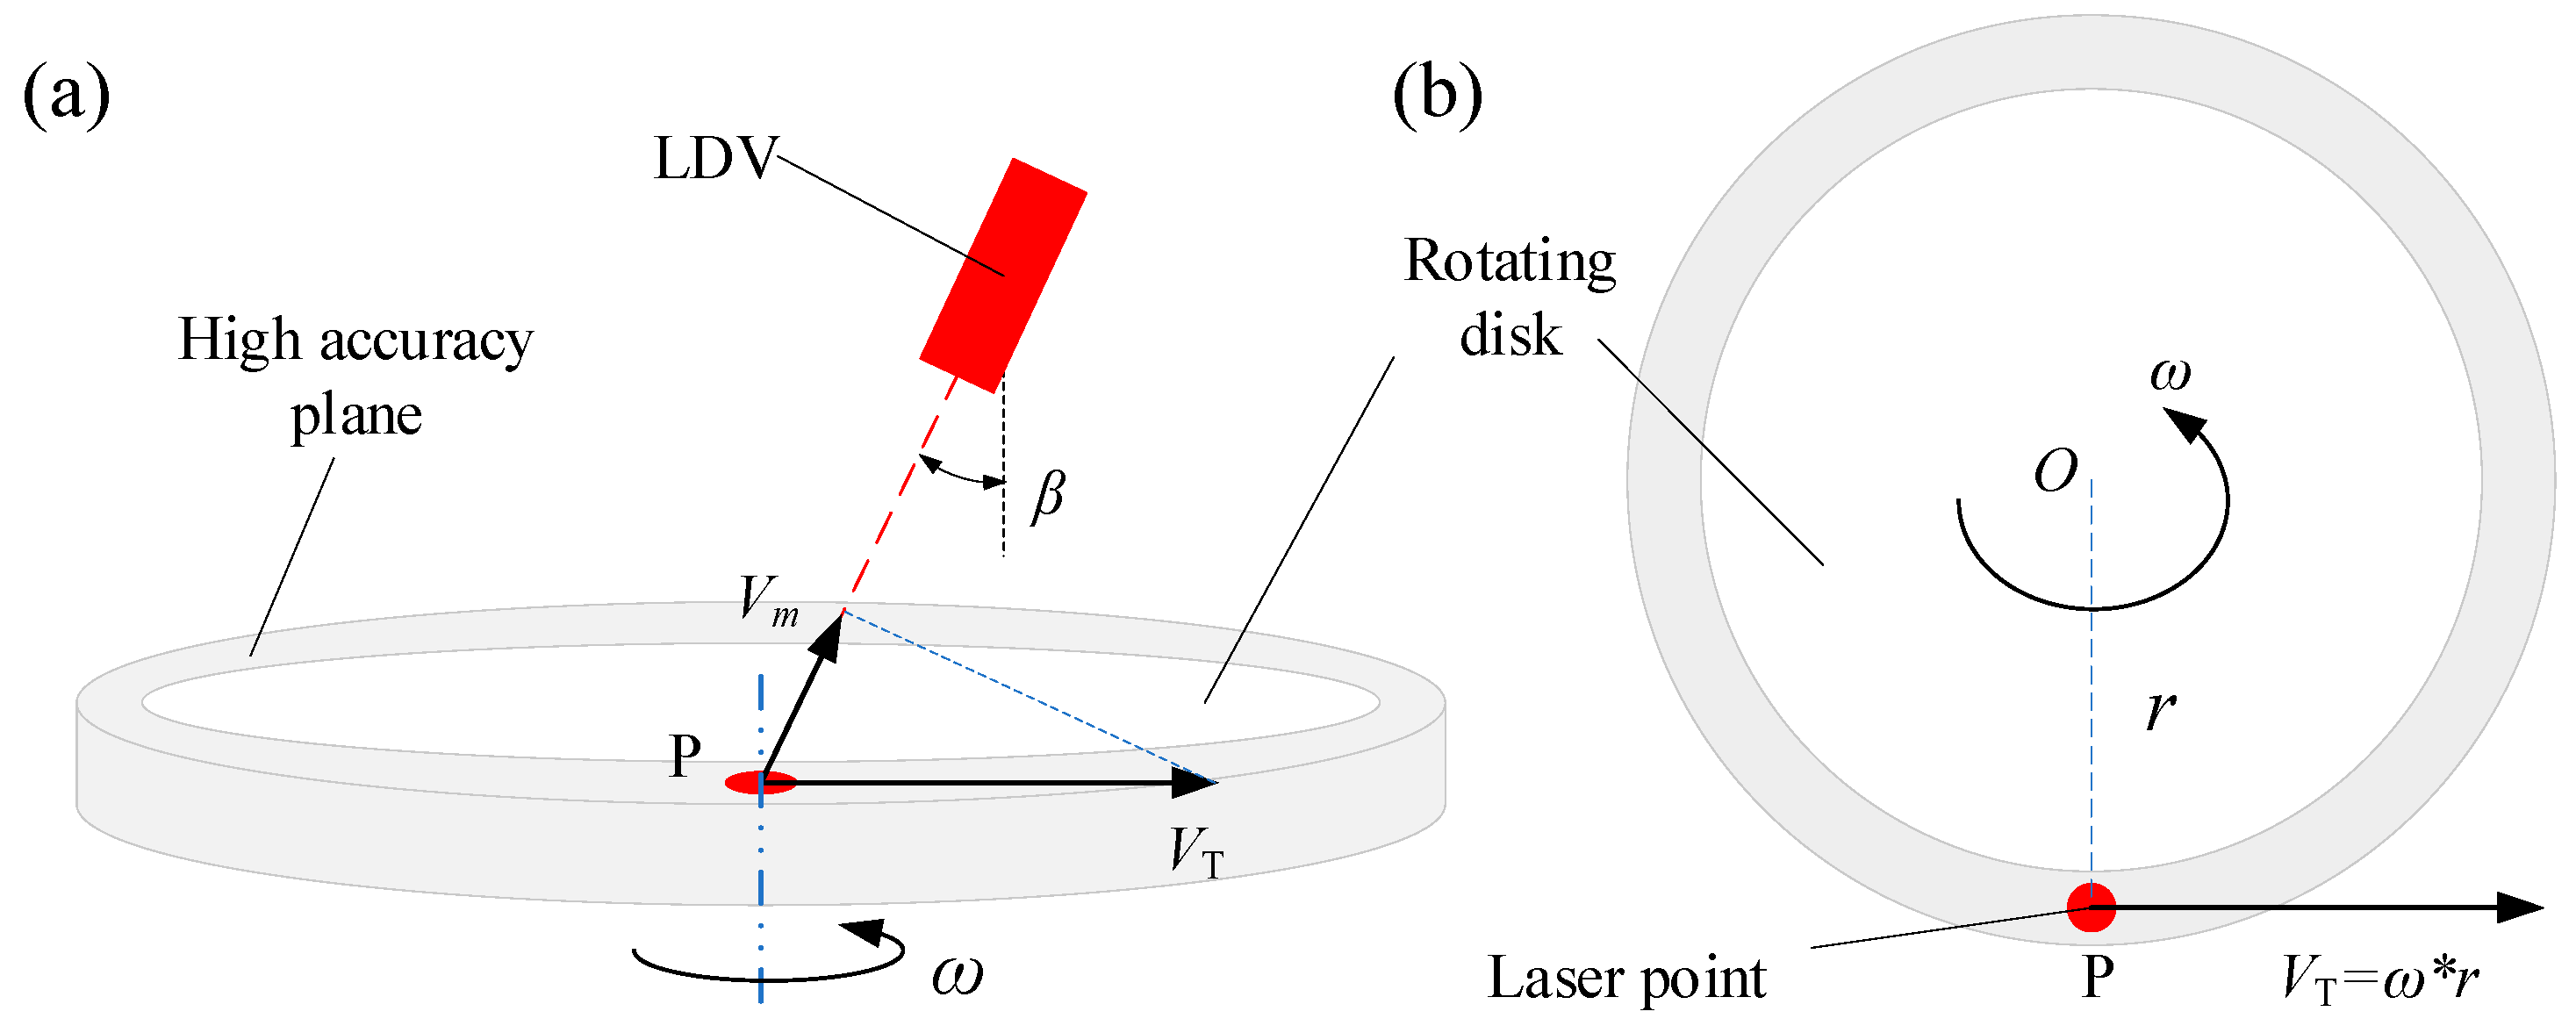
4.1. Principle of Dynamic Measurement

Based on the measurement principle of LDV, this paper proposes a method of dynamic angle measurement, the basic principle of which is shown in Figure 6.
In the figure, a rotating disk performs a high-precision rotating motion in the horizontal plane; the laser beam emitted by LDV is irradiated at point P of the rotating disk. Because the angle between the laser beam and the vertical direction is β, the LDV can measure the component Vm of the tangential velocity VT of the rotating disk at point P along the laser beam. Further, the angle β can be calculated according to the projection relationship between Vm and VT.
More specifically, under the motor’s drive, the rotating disk performs a counterclockwise circular motion at an angular velocity ω. Assuming that the distance from the laser spot P to the rotation center O of the rotating disk is r, then the tangential velocity VT at point P can be calculated as VT = ω · r. According to the triangular relationship in the figure, LDV picks up the projected velocity Vm of VT, and Vm = VT · sin(β). This expression shows that Vm is a function of ω, r, and β. When these three parameters are fixed, Vm is a fixed value. Based on this, the incident angle β of the LDV can be calculated by Equation (7).
β = arcsin ( V m / ( ω r ) ) 180 / π
The feasibility of the proposed angle dynamic measuring method is verified in the following experiment.

4.2. Dynamic Measuring Device and Results

The dynamic measuring device of the LDV laser beam incident angle is shown in Figure 7. The main difference from the angular static measuring device is that the coordinate paper is replaced by a rotating disk system. This rotating disk system is controlled by a bi-directional high-precision displacement platform and can move in the x and y directions. In addition, this system also includes angel fine-tuning devices for high-precision rotation around the x-axes and y-axes.
Compared with the static measuring method, the newly proposed dynamic measuring method utilizes the measurement principle of LDV. The involved measuring device has a compact structure, and its three-dimensional size is less than 100 × 100 × 110 mm. With a more refined design, this device can achieve a smaller size. Such features ensure that the new measuring device has the advantages of being portable with the vehicle and measuring the LDV incident angle at any time. Most importantly, this measuring method takes less time.
The main steps of the dynamic measuring method are as follows:
Step 1. Drive the rotating disk to rotate stably at a certain velocity ω, and start the data acquisition system of the measuring device;
Step 2. Fine-tune the focal length of the LDV to minimize the size of the laser spot. In this case, the signal quality received by LDV is the best;
Step 3. Use a high-precision angle sensor to measure the inclination angle of the rotating disk and correct the angle to 0 through the angle fine-tuning device;
Step 4. Adjust the position of the rotating disk along the x and y directions simultaneously, and record the average value of the LDV measurement Vm when the laser spot is located on the radius r. When the mean value of Vm is at its maximum, the rotating disk is in the ideal position. At this time, the projection of the laser beam on the oxy plane coincides with the tangential direction of point P;
Step 5. Tighten the constraints of the entire system to avoid introducing unexpected system errors during the experimental test;
Step 6. Set different angular velocity ω for the rotating disk system, and record the angular velocity ω of the rotating disk and the measured value Vm of LDV in real time;
Step 7. Perform mean value processing on the measured value Vm, and calculate the angle βi according to Equation (7);
Step 8. Perform mean value processing on the angle βi to obtain the dynamic measurement angle β.
During this test, the desired radius r at the laser spot P was equal to 47.5 mm. Under the control of the DC motor, the rotating disk can achieve a smooth rotation of 1000~5000 rpm, and the rotation error accuracy is less than 2 rpm. Figure 8 shows the curves of the measured value Vm and its mean value V m ¯ of LDV at different angular velocities ω. It can be seen from these curves that Vm is not constant. This result has many reasons, which will be explained later in Section 5. In addition, from the perspective of amplitude, Vm fluctuates randomly around its mean value, indicating that the measured value has a strong signal-to-noise ratio. Therefore, Vm in Equation (7) can be replaced by V m ¯ to calculate the incident angle β of the laser beam.
Table 2 lists the corresponding V m ¯ and β of seven kinds of angular velocity ω. The mean value of β is 1.8714°, the standard deviation is 0.0014°, and the coefficient of variation is 0.074%. Like the static measuring method, the measurement results of the new method also have high stability. However, the measurement results of the two methods are not the same. In particular, the result of the dynamic measurement method is 0.0406° smaller than that of the static measurement. In the next section, the main reasons for errors in the dynamic measuring device will be analyzed and discussed below.

5. Error Analysis and Discussion

Affected by processing technology, installation technology, and other factors, the LDV values may have a specific difference from the expected value, leading to errors in the angle dynamic measuring results. The following analyzes and discusses four key error sources and proposes corresponding improvement and optimization methods.

5.1. Environmental Noise

Environmental noise is inevitable in testing. During this measurement process, the noise mainly comes from the rotating disk’s surface roughness and the entire system’s abnormal vibration. This kind of noise belongs to Gaussian white noise and obeys normal distribution. Then, the actual measured value Vmn of LDV can be expressed using Equation (8). In this equation, Vm represents the expected velocity, and n(t) represents the time series of the noise signal.
V mn = V m + n ( t )
Based on the uncorrelated characteristics of the noise signal, after averaging, the amplitude of the noise signal becomes 1/ N , and N represents the total number of samples in the test data. Without loss of generality, the noise signal n(t = 1) at t = 1 s is selected to analyze the result of mean processing. So, the mean value V mn ¯ of the measurement Vmn containing environmental noise can be expressed as Equation (9).
V mn ¯ = V m + n ( t = 1 ) / N
This equation indicates that averaging the measurement signal can significantly reduce the impact of noise. Therefore, to effectively reduce the effects of environmental noise, the number of sampling points N can be increased by increasing the sampling rate or sampling time. In addition, the high-precision machining of the rotating disk’s outer circle (at P point) can also be considered. It should be noted that noise does not fundamentally affect the amplitude of the signal. Therefore, although averaging reduces the energy of the noisy signal, it does not have a significant impact on the measurement results. Since averaging processing has been widely used in academic and engineering fields, the paper will no longer carry out experimental verification on it.

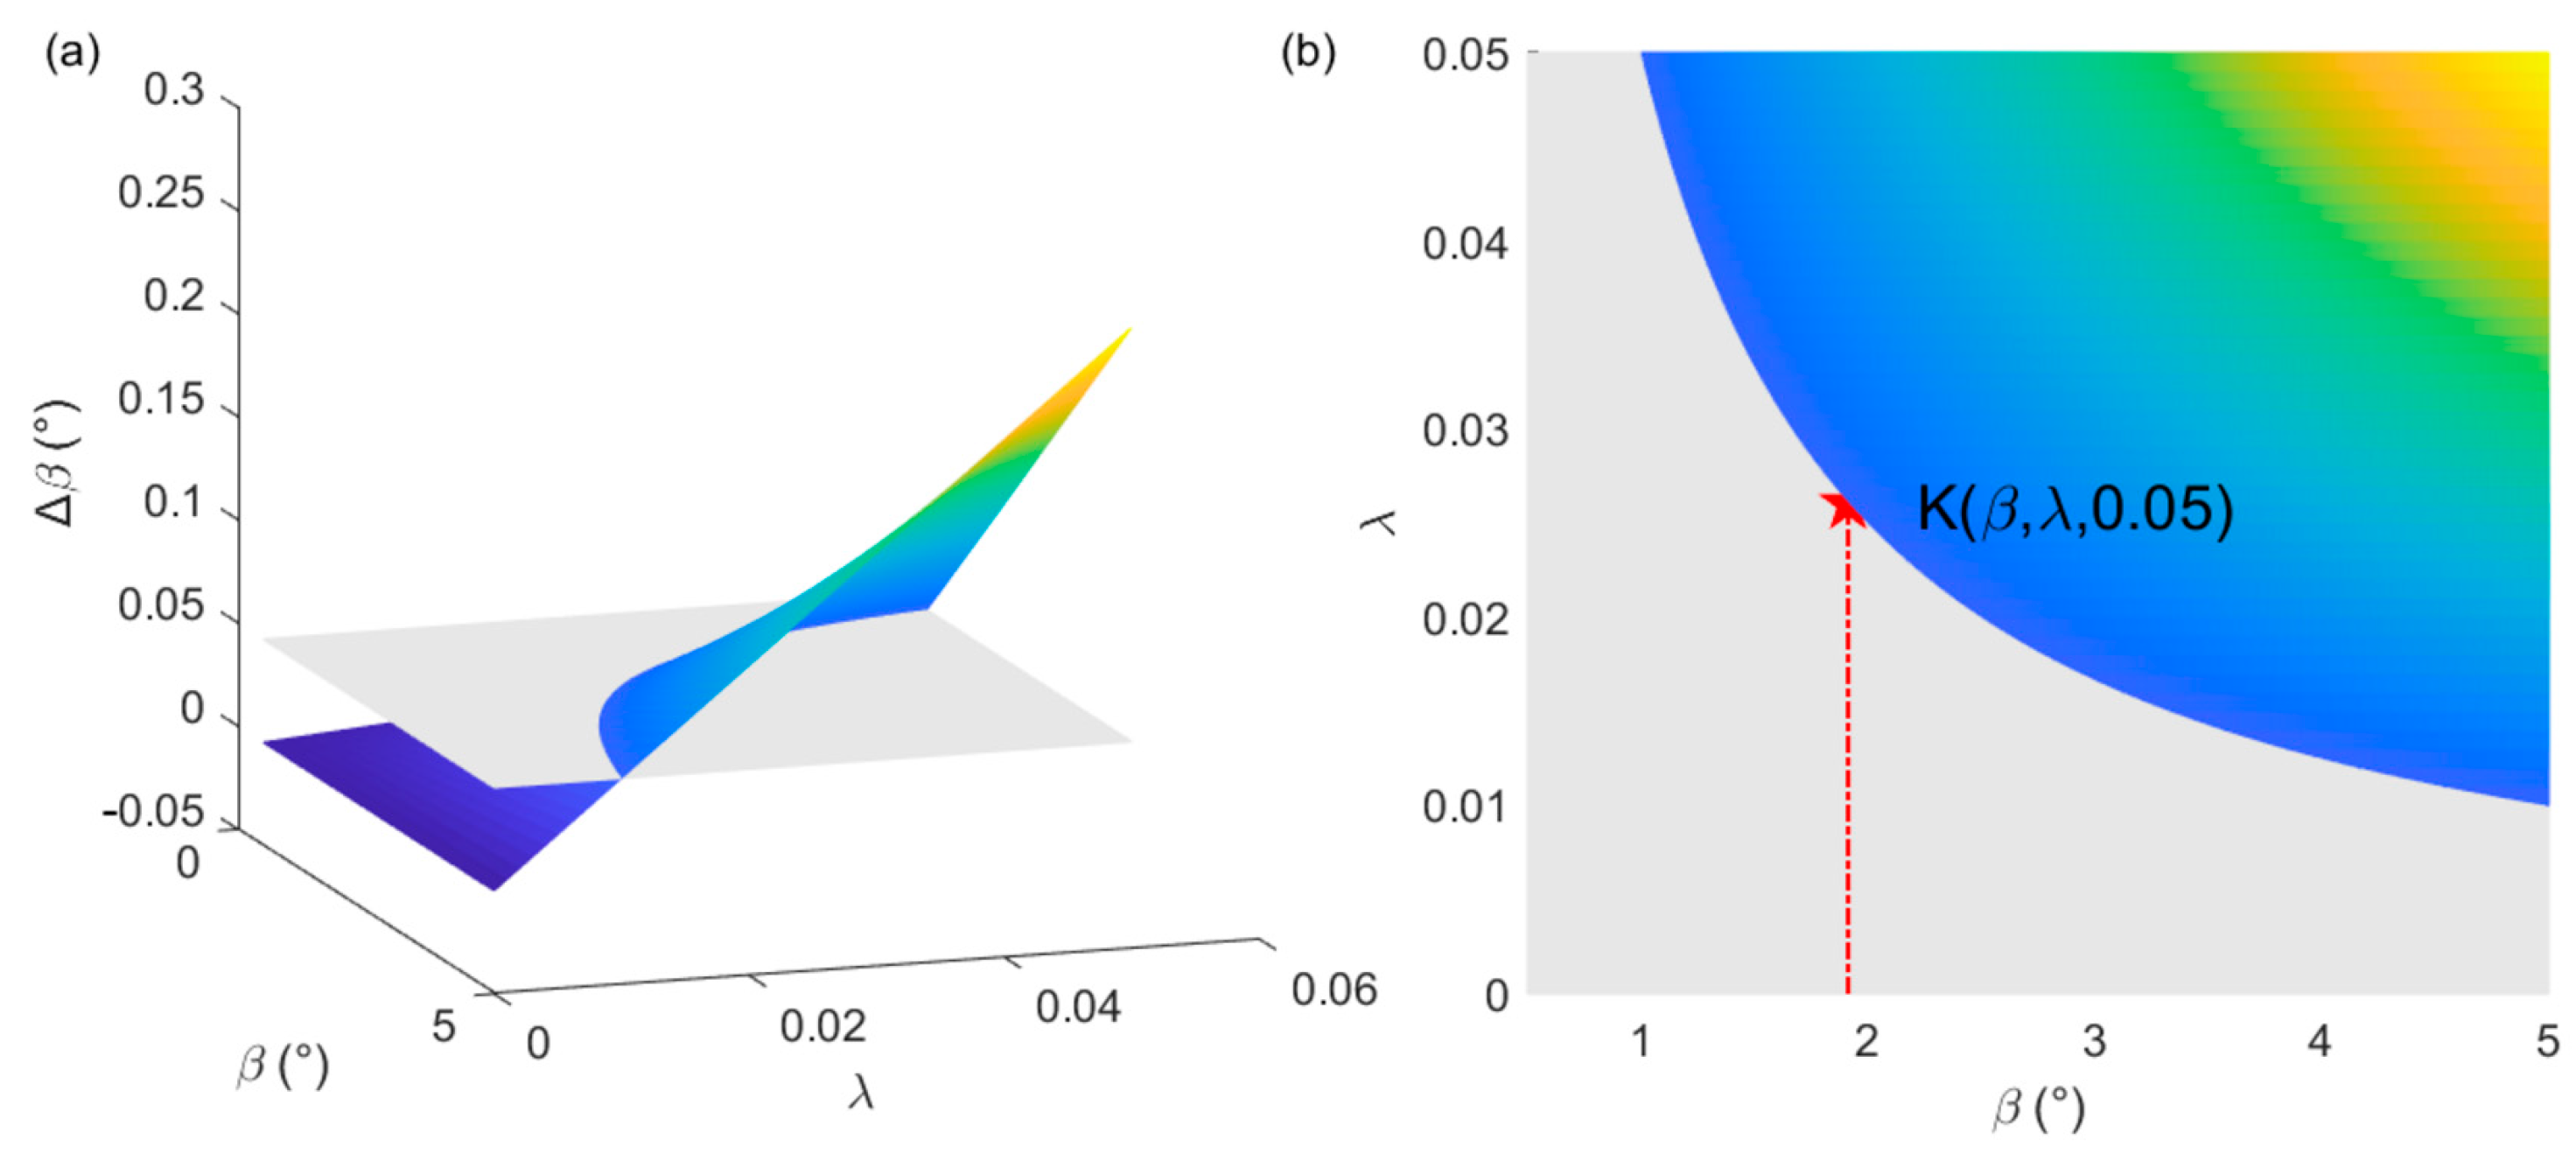
5.2. Laser Spot Position Error

Due to the untouchability of the laser beam, there may be errors in accurately locating the laser spot position, leading to the failure of dynamic measurement. According to the characteristics of the probability distribution, laser spot P′, which deviates from the ideal position P, will be concentrated within a circle centered on point P with a radius of R0, as shown in Figure 9a,b.
Assuming the distance from the actual laser spot P′ to the rotation center O of the rotating disk is R and ∠POP′ = ξ, the following constraint relationships hold.
abs ( ξ ) arctan ( R 0 / r ) r R 0 R r + R 0
The tangential velocity at the expected measurement point P is denoted as VT. The tangential velocity provided at the actual measurement point P′ and the actual measurement velocity of LDV are recorded as VTR and VmR, respectively. In Figure 9c, the lines P′Q and P′M are in the same direction as the velocities VT and VTR, respectively, P′N is in the same direction as the actual laser beam, and NQ and MQ are both perpendicular to P′Q. The following relationships exist in triangles P′NQ, P′MQ, and NQM.
NQ ¯ = P Q ¯ / tan ( β ) P N ¯ = P Q ¯ / sin ( β )
MQ ¯ = P Q ¯ tan ( ξ ) P M ¯ = P Q ¯ / cos ( ξ )
NM ¯ = NQ ¯ 2 + MQ ¯ 2
Then, in the triangle NP′M,
cos ( N P M ) = P M ¯ 2 + P N ¯ 2 NM ¯ 2 2 P M ¯ P N ¯ = sin β cos ξ
The actual measured value VmR of LDV in this state is expressed by Equation (15).
V mR = V TR cos ( N P M ) = ω R sin β cos ξ
Combining the physical meaning of Equation (7), the actual angle βmR is shown in Equation (16).
β mR = arcsin ( V mR / V T ) = arcsin ( sin ( β ) cos ( ξ ) R / r )
According to the monotonicity of trigonometric function and inverse trigonometric function in Equation (16): (a) when R = rR0 and ξ = ±R0/r, βmR takes the minimum value of βmR1; (b) when R = r + R0 and ξ = 0, βmR takes the maximum value of βmR2. The calculation process is shown in Equation (17).
β mR 1 = arcsin ( sin ( β ) cos ( R 0 / r ) ( 1 R 0 / r ) ) β mR 2 = arcsin ( sin ( β ) ( 1 + R 0 / r ) )
Define λ represents the position deviation ratio of P′, and λ = R0/r, and the value range of λ is [0, 1]. Due to cos(λ) ≤ 1, 1 − λ ≤ 1, and 1 + λ ≥ 1, when analyzing dynamic measuring errors, only considering βmR2 is sufficient.
Based on the above analysis, the maximum measurement error ΔβmR, caused by laser spot position error, is represented by Equation (18).
Δ β mR = β mR 2 β = arcsin ( sin ( β ) ( 1 + λ ) ) β
The curves of ΔβmR changing with λ and β are shown in Figure 10. The figure shows that ΔβmR increases with the increase in λ and β. To meet the engineering requirements, it is necessary to select an appropriate λ. For angles βCAL, when λCAL = 0.026, abs(ΔβmR) ≤ 0.05° and λCAL represent the maximum position deviation ratio allowed by βCAL. Then, assuming the expected radius r = 47.5 mm during the experimental test, the allowable laser spot position error radius R0 = r · λCAL = 1.235 mm.
Therefore, in this experiment, it is only necessary to control the laser spot to be within a circle with a radius of 1.235 mm centered on the ideal position point P to meet the experimental measuring requirements.
The results of the above theoretical analysis show that the position error of the laser spot affects the measurement results of the angle β. To verify the influence of the laser point position error, we can adjust the displacement platforms 1 and 2 to shorten the distance between points P′ and P. However, since the geometric size of the laser spot is not zero, we currently have no clear technical means to determine the actual positions of these two points. In addition, the difference between dynamic and static measuring results is caused by a combination of multiple factors. Changing the position of the laser spot alone may not lead to the desired results.

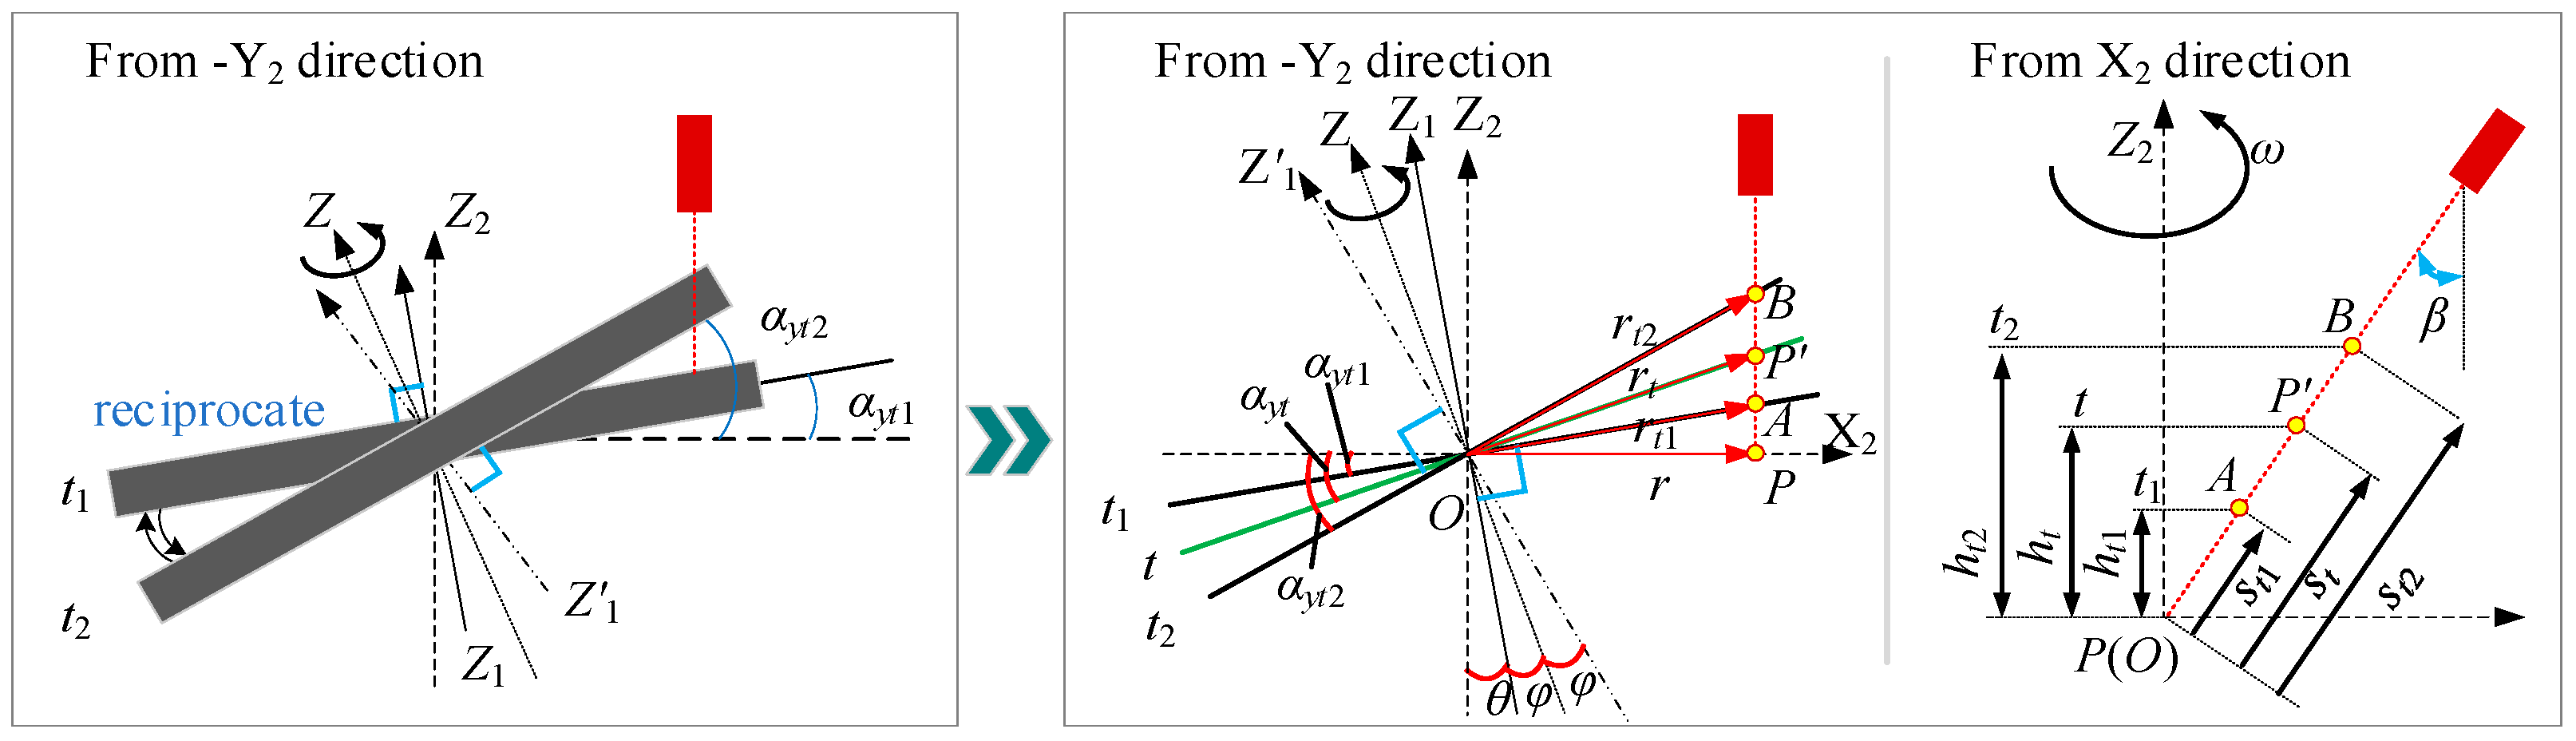
5.3. Rotating Disk System Error

The machining accuracy and abnormal installation of the system are also the main reasons for measuring errors. Figure 11 shows a schematic diagram of the non-ideal installation state of the rotating disk and LDV in space.
Three right-handed Cartesian coordinate systems, O-XYZ, O-X1Y1Z1, and O-X2Y2Z2, are established at the mass center O of the rotating disk. Define the actual rotation axis of the rotating disk as Z, the normal of the rotating disk plane as Z1, and the vertical direction of space as Z2. Due to unsatisfactory processing and installation, Z, Z1, and Z2 may not coincide. Theoretically, they are not necessarily in the same plane except for the intersection point O. The coordinate system O-X2Y2Z2 is an ideal space coordinate system. Theoretically, the laser spot P should be located on the X2-axis. However, due to installation errors, the actual measuring point P′ may be found on the coordinate axis X1 (the thickness of the rotating disk is ignored). Set the X-axis in the OX1X2 plane, and assume that the included angles between Z1 and Z and Z2 in space are θ and φ, respectively. To study the error introduced by the installation accuracy, it is necessary to analyze the combined effect of these two angles.
Theoretically, angles θ and φ can be coupled into an infinite number of situations in space. However, these two angles can always be decomposed into the planes OX2Z2 and OY2Z2 and are denoted as θy, φy, and θx, φx, respectively. These two sets of angles are superimposed to form the roll angle αy and the pitch angle αx of the rotating disk, respectively. However, the two situations affect the LDV values and dynamic measuring results differently and thus need to be analyzed and discussed separately.

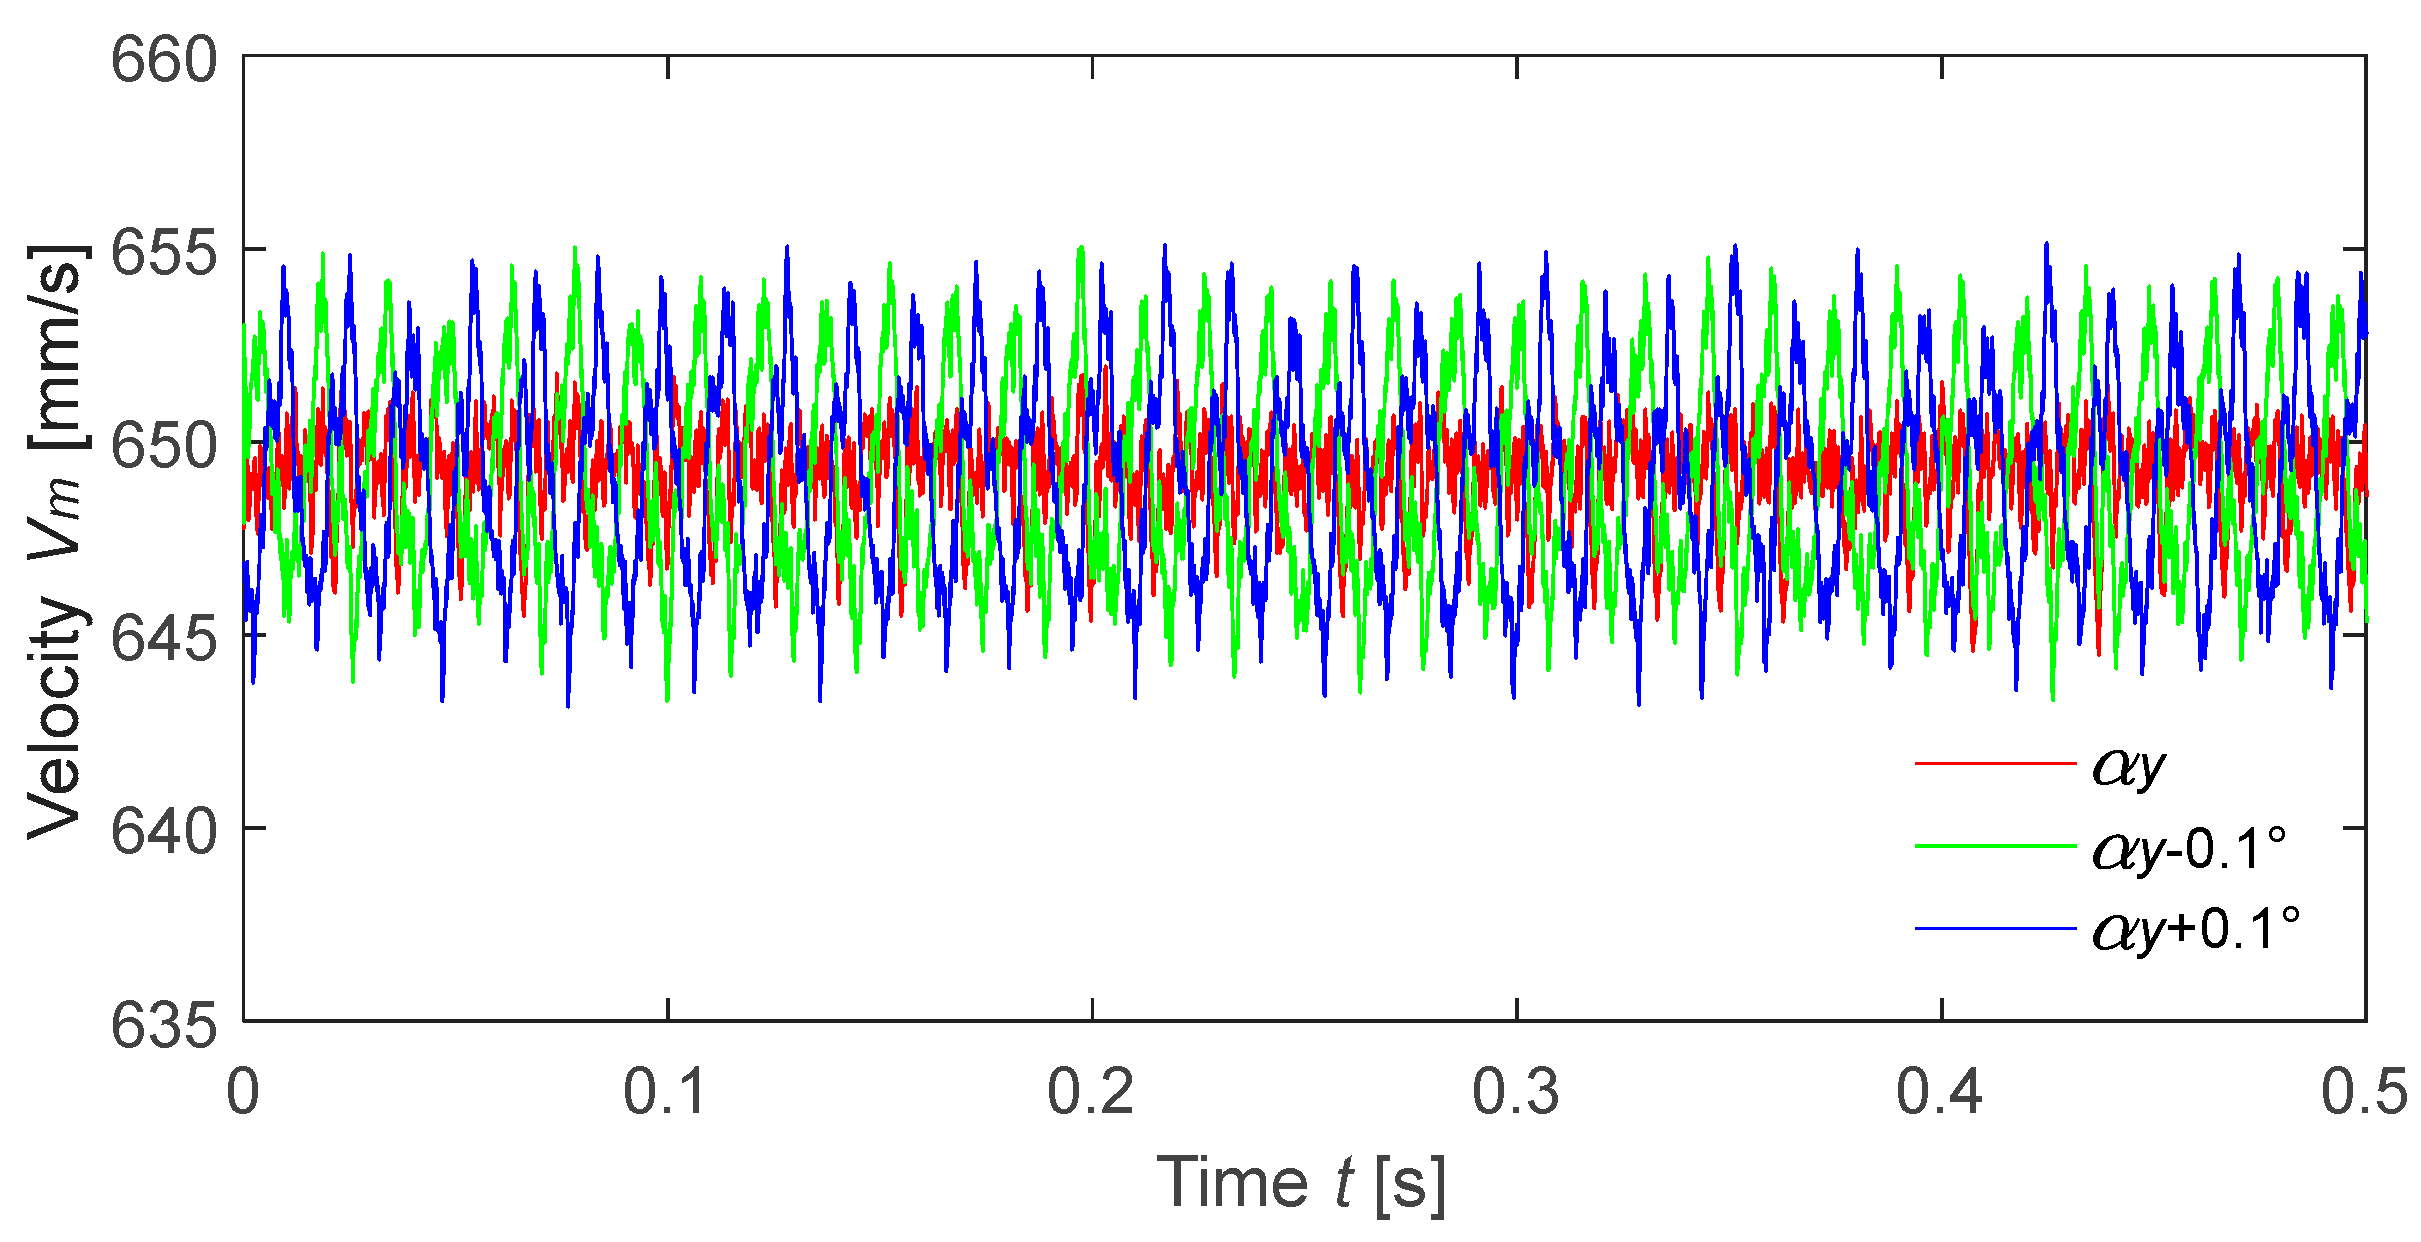
5.3.1. Roll Angle αy

When θy = θ and φy = φ, the roll angle αy may reach a maximum value, which will have a more significant impact on the measured value of LDV. In this case, the axes Y, Y1, and Y2 are coincident, and the axes Z, Z1, and Z2 are coplanar. See Figure 12 for the positional relationship between the rotating disk and the LDV laser beam.
Since Z and Z1 do not coincide, the rotating disk will periodically ‘vibrate’ around the Z-axis. From the perspective of −Y2, the rotating disk is reciprocating, as shown in Figure 13. Assume that the positions indicated by t1 and t2 are the upper and lower limits of the rotating disk, where t2t1 = (n + 0.5) · T, n = 1, 2, 3, …, Parameter T represents the rotation period of the rotating disk, T = 2π/ω. Without a loss of generality, let n equal 0, then t2t1 = 0.5 · T. Its physical meaning means starting from time t1, after 0.5 · T, the normal line Z1 of the rotating disk rotates to Z1′. For the roll angle αy, it is a variable in this process. At two moments, t1 and t2, αy reaches the minimum and maximum values αyt1 and αyt2, respectively. In the following, αyt will be used to represent the roll angle αy of the rotating disk at any time t.
Ideally, the laser spot on the rotating disk should be at point P, with the corresponding rotation radius of r. However, due to the reciprocating motion of the rotating disk, the actual laser spot P′ will fluctuate periodically within the range of points B and A. This causes the distance rt from the laser spot P′ to the center O to change at any time t, and its range is [rt1, rt2]. The radius rti represents the distance from the actual laser spot P′ to the center O at time ti, i = 1, 2, and the calculation method is shown in Equation (19).
r t = r / cos ( α y t ) r t 1 = r / cos ( α y t 1 ) r t 2 = r / cos ( α y t 2 )
where αyt1 = θ, αyt2 = θ + 2φ, and αyt = (αyt2 + αyt1) · sin(ωt)/2.
The circumferential velocity Vt provided by point P′ at time t can be expressed as Vt = ω · rt, then the first velocity component Vm1 picked up by LDV can be calculated by Equation (20).
V m 1 = V t sin ( β ) = ω r sin ( β ) cos ( θ + φ sin ( ω t ) )
In addition, the roll angle αyt causes the rotating disk to move periodically in space with T, affecting the LDV measurement. Viewed from the −Y2 direction, the laser spot P′ reciprocates between points A and B, and its amplitude Am can be calculated according to Equation (21).
A m = ( s t 2 s t 1 ) / 2 = ( h t 2 h t 1 ) / ( 2 cos ( β ) )
where
h t 2 = r tan ( α y t 2 ) h t 1 = r tan ( α y t 1 )
The displacement introduced by the reciprocating motion of the rotating disk can be expressed by Equation (22).
S ( t ) = A m sin ( ω t + ψ )
Without a loss of generality, let the initial phase ψ = 0. Based on the differential relationship between velocity and displacement, the velocity component Vm2 generated by reciprocating motion is shown in Equation (23).
V m 2 = S ( t ) = A m ω cos ( ω t )
Combining the velocity components Vm1 and Vm2, the actual measured velocity Vmy of the LDV can be obtained as shown in Equation (24).
V m y = V m 1 + V m 2
Bring Equations (19)~(23) into (24), and calculate them to get
V m y = ω r sin β cos θ + φ sin ω t + tan θ + 2 φ tan θ cos ω t 2 cos β
This equation shows that the actual measured speed Vmy of LDV is time-varying. Considering the averaging process for subsequent signals, the periodic signal terms related to time t in this equation, such as sin(ωt) and cos(ωt), have approximately zero influence on calculating the incident angle β. That is, the average value V my ¯ of the actual measured speed of LDV is consistent with the expected value Vm, which can be expressed by Equation (26). The following uses a particular case to illustrate the feasibility of simplifying Equation (25) into (26).
V m y ¯ = ω r sin β
Figure 14 is a simulation case based on Equation (25). The values of multiple parameters are as follows: ω = 400 rad/s, r = 47.50 mm, θ = 0.50°, φ = 0.25°, and β = βCAL = 1.9120°. The waveforms of the two velocity components Vm1 and Vm2 changing with time t are shown by the solid red and the dotted blue lines in the figure, respectively. The figure shows that both curves have prominent periodic characteristics. The mean value V my ¯ of coupling velocity Vmy equals 633.9679 mm/s. Based on Equation (26), the angle βmy under this condition is 1.9121°. In this simulated case, the difference between the measured value βmy and the expected value βCAL is 0.0001°. Such results show that the roll angle αy has little effect on the dynamic measuring system.
In a physical sense, although angles θy and φy will cause the rotating disk to appear at a roll angle αy and cause the rotating disk to vibrate along the direction of the laser beam, they will not affect the dynamic measurement of the laser beam angle. However, in an engineering sense, vibrations should be avoided as much as possible to prevent the adverse effects of unexpected motion on the entire measuring system.

5.3.2. Pitch Angle αx

The pitch angle αx is synthesized by the projections θx and φx of θ and φ on OY2Z2. When θx = θ and φx = φ, the pitch angle αx in OY2Z2 can reach the maximum. In this state, the coordinate axes X, X1, and X2 coincide, and Z, Z1, and Z2 are coplanar. The schematic diagram of the positional relationship between the rotating disk and the LDV is shown in Figure 15.
Since axes Z and Z1 do not coincide, when the rotating disk rotates at an angular velocity ω, the angle αx will also change with a period of 2π/ω, that is, αx = θ + φ·sin(ωt). This expression shows that the rotating disk will produce a periodic pitching motion, which will cause the actual measured value Vmx to change. Since Vmx will be averaged during subsequent data processing, the influence of φ on Vmx can be ignored. However, for θ, it always exists and will not be eliminated due to averaging. Therefore, when discussing the influence of pitch angle αx on Vmx, it can be considered that αx = θ.
Combined with the influence of the position error of the laser spot, when θ is small, it is reasonable to ignore the position change in the measuring point caused by the pitching motion. In this case, the actual laser spot P′ can always be considered at the desired point P. Then, according to the projection relationship in Figure 15, the measured value Vmx can be obtained by Equation (27).
V m x = V T sin ( β α x ) = ω r sin ( β α x )
Finally, the laser beam angle βmx is reversed according to Equation (27), and βmx = βαx = βθ. In this case, the error Δβmx, due to installation accuracy, is shown in Equation (28).
Δ β m x = θ
According to Equation (28), angle θ between the normal line Z1 of the rotating disk and the vertical direction Z2 greatly influences the dynamic measurement result of β. Therefore, when performing angle measurement based on the newly proposed measuring method and device, a high-precision inclinometer can be used to measure the inclination angle of the rotating disk to correct the measuring results, or an angle fine-tuning device can be used to make the rotating disk as horizontal as possible.

5.3.3. Experimental Verification

To verify the influence of the roll angle αy and the pitch angle αx on the measurement results, we changed the relative angle between the LDV laser beam and the rotating disk by adjusting the angle fine-tuning platforms 1 and 2. However, adjusting the angle fine-tuning platforms will cause the actual position of the laser spot on the rotating disk to change. To ensure that the relative position of the light spot P′ and the desired point P does not change significantly, we need to adjust the displacement platforms 1 and 2. No matter which platform is adjusted, the constraint state of the dynamic measuring system will be changed. Changes in system constraints may bring unpredictable measurement effects.
By adjusting the angle fine-tuning platform 1 to change the roll angle of the rotating disk, two roll angles are obtained: αy − 0.1° and αy + 0.1°. Adjusting the angle fine-tuning platform 1 essentially changes θy in Figure 12. According to Equation (25), θy will cause the LDV signal to exhibit periodicity. Start the motor and measurement system, and record the signals provided by the rotating disk to the LDV in these abnormal installation conditions. Note that during each adjustment, it is necessary to release and lock the constraints of the measuring device. Subsequently, restore the roll angle of the dynamic measuring device to its initial state. When the motor speed ω is 4000 rpm, the LDV velocity signals in three roll angle states are shown in Figure 16.
The figure shows that under these three roll angles, the LDV measurement values all exhibit periodicity, with lower fluctuations in the initial state (red solid line in the figure), which is consistent with our expectations. For roll angles αy − 0.1° and αy + 0.1°, their variation relative to the initial roll angle αy is 0.1°. In theory, the amplitude fluctuation of two curves should be the same except for the phase. However, the actual roll angle increment may not have reached 0.1° due to system clearance. According to the average value of the last two curves, the incident angle β of the LDV laser beam is calculated to be 1.86963° and 1.86983°, respectively. These two results are not much different from the 1.86959° corresponding to αy in Table 2. Therefore, it can be considered that the roll angle αy has little influence on the proposed dynamic measuring device.
Adjusting the angle fine-tuning platform 2 will change the relative angle between the LDV beam and the rotating disk. This will result in amplitude changes in the LDV measurements without significantly changing the periodic fluctuation of the signal. Two pitch angles are obtained by adjusting the angle fine-tuning platform 2: αx − 0.1° and αx + 0.1°. The velocity signals picked up by LDV are shown in Figure 17 when the motor speed is 4000 rpm.
The figure shows that after changing the pitch angle αx, the two newly obtained LDV curves significantly deviate from the initial one, but do not exhibit periodic fluctuations. According to the average value of the latter two curves, the incident angle β of the LDV laser beam is calculated to be 1.79751° and 1.95316°, respectively. Compared with 1.86959° in the initial state, they are reduced by 0.07208° and increased by 0.08357°, respectively. Both differences are less than the angle fine adjustment increment of 0.1°. This is likely related to the system clearance and the position error of the laser spot, but it also indicates that αx has a significant impact on the dynamic measuring device.

5.4. Other Factors

The result of the dynamic measuring device is also affected by other factors, such as the angular velocity ω of the motor. The measuring process requires the motor speed ω to remain constant during the measuring process. Before this experiment, the speed ω was monitored in a targeted manner. The monitoring results show that most selected motor speeds can keep the preset speed unchanged and occasionally deviate from 1~2 rpm. The influence of this deviation is negligible relative to the set value up to several thousand revolutions. Therefore, this article no longer considers the influence of motor speed fluctuation.
In addition, the environmental temperature is also an important factor affecting the measurement system. However, this effect is considered to be negligible when conducting a short-term indoor test.

6. Conclusions

Based on the measurement principle of LDV, this paper proposes a dynamic measuring method for the laser beam incident angle of LDV, establishes a high precision dynamic measuring device, and analyzes the errors of the proposed dynamic measuring method and device from four key aspects: environmental noise, measurement point position error, roll angle, and pitch angle of the rotating disk. The main research conclusions are as follows:
(1)
The traditional method can measure and calibrate the incident angle of the LDV laser beam with high precision but requires an extensive spatial range. In contrast, the dynamic measuring method proposed in this paper utilizes the vibration measurement principle of LDV, overcomes the shortcomings of the traditional method to a large extent, and can also achieve a high precision measurement of the laser beam incident angle of the space-limited LDV;
(2)
Affected by many factors, the actual measured value of LDV is not constant but has a high signal-to-noise ratio. Using the average value instead of the actual measured value of LDV can reduce the measurement error caused by the environmental noise and the roll angle αy of the rotating disk;
(3)
The position error of the laser spot will significantly impact the measuring results of the incident angle. When the ratio of the error radius of the actual laser spot to the expected radius is less than or equal to 0.026, the error of the measuring result can be guaranteed to be less than 0.05°;
(4)
The pitch angle αx of the rotating disk directly determines the component of the circumferential velocity of the measuring point along the laser beam, and is the most critical factor affecting the measuring result of the incident angle. A high-precision inclinometer can be used to correct the measurement results, or an angle fine-tuning device can reduce the angle between the rotating disk and the horizontal plane to improve the dynamic measuring results.

Author Contributions

Conceptualization, Y.L. and G.J.; Funding acquisition, Y.L. and G.J.; Investigation, Y.L., X.L. and H.A.; Methodology, Y.L. and G.J.; Software, X.L. and H.A.; Supervision, G.J.; Validation, Y.L., X.L. and H.A.; Visualization, H.A. and Y.L.; Writing—original draft, Y.L. and H.A.; Writing—review and editing, Y.L. and G.J. All authors have read and agreed to the published version of the manuscript.

Funding

This research was partially funded by the Fundamental Research Funds for Central Public Welfare Research Institutes of China under Grant 2022-9045, the China Postdoctoral Science Foundation under Grant 2022M721428, and the Pilot Program for Advanced Transportation Systems of China under Grant QG2021-4-20-1.

Institutional Review Board Statement

Not applicable.

Informed Consent Statement

Not applicable.

Data Availability Statement

Not applicable.

Acknowledgments

The authors thank the anonymous reviewers and editors for their constructive comments on this manuscript.

Conflicts of Interest

The authors declare no conflict of interest.

Nomenclature

Symbols
fDDoppler frequency shift, Hz
fCLaser’s frequency, Hz
CLaser’s wavelength, m
VmLDV measurement, mm/s
VkVehicle speed, mm/s
VdPavement deformation velocity, mm/s
dMoving distance of the laser spot, mm
lMoving distance of LDV along the z-axis, mm
dpixPixel distance, mm/pix
VTTangential velocity, mm/s
ωAngular velocity of rotating disk, rad/s
βAngle between the laser beam and the vertical direction, known as the incident angle, °
V m ¯ Mean value of Vm, mm/s
VmnLDV values with noise, mm/s
n(t)Environment noise, mm/s
V mn ¯ Mean value of Vmn, mm/s
ξ∠POP′ = ξ, °
R0Radius of laser spot position error, mm
rDistance of ideal laser spot P to rotation center O, mm
RDistance of actual laser spot P′ to the rotation center O, mm
VTRTangential velocity of the actual laser spot P′, mm/s
VmRLDV values measured from laser spot P′, mm/s
βmRActual angle β considering the laser spot position error, °
ΔβmRMeasurement error caused by laser spot position error, °
θIncluded angles between Z1 and Z in space, °
φIncluded angles between Z1 and Z2 in space, °
θxProjection of the angle θ on the plane OY2Z2, °
φxProjection of the angle φ on the plane OY2Z2, °
θyProjection of the angle θ on the plane OX2Z2, °
φyProjection of the angle φ on the plane OX2Z2, °
αyRoll angle, °
αxPitch angle, °
rtDistance from the laser spot P′ to the center O at time t
VtCircumferential velocity provided by point P′ at time t, mm/s
Vm1The first velocity component of LDV, mm/s
AmReciprocates amplitude between points A and B, mm/s
Vm2Velocity component generated by reciprocating motion, mm/s
VmyActual measured velocity of the LDV considering the roll angle αy, mm/s
V my ¯ Mean value of coupling velocity Vmy, mm/s
βmyIncident angle considering the roll angel αy, °
VmxActual measured velocity of the LDV considering the pitch angle αx, mm/s
βmxIncident angle considering the pitch angle αx, °
ΔβmxError due to pitch angle αx, °

References

  1. Rothberg, S.J.; Allen, M.S.; Castellini, P.; Di Maio, D.; Dirckx, J.J.J.; Ewins, D.J.; Halkon, B.J.; Muyshondt, P.; Paone, N.; Ryan, T.; et al. An international review of laser Doppler vibrometry: Making light work of vibration measurement. Opt. Lasers Eng. 2017, 99, 11–22. [Google Scholar] [CrossRef]
  2. Altmann, B.; Betker, T.; Pape, C.; Reithmeier, E. Alignment strategy for an optomechanical image derotator using a laser Doppler vibrometer. Appl. Opt. 2019, 58, 6555–6568. [Google Scholar] [CrossRef] [PubMed]
  3. Fu, Y.; Liu, H.; Xie, J. 100-m standoff detection of a QCL-induced photo-vibrational signal on explosives using a laser vibrometer. Opt. Lasers Eng. 2018, 107, 241–246. [Google Scholar] [CrossRef]
  4. Kim, J.; Kim, K.; Sohn, H. In situ measurement of structural mass, stiffness, and damping using a reaction force actuator and a laser Doppler vibrometer. Smart Mater. Struct. 2013, 22, 85001–85004. [Google Scholar] [CrossRef]
  5. Garg, P.; Fernando Moreu, M.A.; Ozdagli, A.; Mahmoud Reda Taha, M.A.; Mascareñas, D.; Mascareñas, A.D. Noncontact Dynamic Displacement Measurement of Structures Using a Moving Laser Doppler Vibrometer. J. Bridge Eng. 2019, 24, 4019089. [Google Scholar] [CrossRef]
  6. Zhu, S.; Zhou, W.; Song, Y. Detecting oscillation amplitude and defects of hard disk rotating in high speed by laser Doppler technique. Measurement 2012, 45, 74–78. [Google Scholar] [CrossRef]
  7. Huang, Z.; Chaoping, Z. Damage Detection Using Modal Rotational Mode Shapes Obtained with a Uniform Rate CSLDV Measurement. Appl. Sci. 2019, 9, 4982. [Google Scholar] [CrossRef]
  8. Zhang, W.; Cui, D.; Ying, Y. Nondestructive measurement of pear texture by acoustic vibration method. Postharvest Biol. Technol. 2014, 96, 99–105. [Google Scholar] [CrossRef]
  9. Chen, L.; Zhang, D.; Zhou, Y.; Liu, C.; Che, S. Design of a high-precision and non-contact dynamic angular displacement measurement with dual-Laser Doppler Vibrometers. Sci. Rep. 2018, 8, 9094. [Google Scholar] [CrossRef]
  10. Sels, S.; Vanlanduit, S.; Bogaerts, B.; Penne, R. Three-dimensional full-field vibration measurements using a handheld single-point laser Doppler vibrometer. Mech. Syst. Signal Process. 2019, 126, 427–438. [Google Scholar] [CrossRef]
  11. Zhang, M.; Zhang, J.; Gong, H.; Jia, X.; Xiao, R.; Huang, H.; Huang, B. Numerical investigation of pavement responses under TSD and FWD loading. Constr. Build. Mater. 2022, 318, 126014. [Google Scholar] [CrossRef]
  12. Uddin Ahmed Zihan, Z.; Elseifi, M.A.; Gaspard, K.; Zhang, Z. Development of a structural capacity prediction model based on traffic speed deflectometer measurements. Transp. Res. Rec. J. Transp. Res. Board 2018, 2672, 315–325. [Google Scholar] [CrossRef]
  13. Nasimifar, M.; Kamalizadeh, R.; Heidary, B. The available approaches for using traffic speed Deflectometer data at network level pavement management system. Measurement 2022, 202, 111901. [Google Scholar] [CrossRef]
  14. Katicha, S.; Flintsch, G.; Diefenderfer, B. Ten Years of Traffic Speed Deflectometer Research in the United States: A Review. Transp. Res. Rec. J. Transp. Res. Board 2022, 2676, 152–165. [Google Scholar] [CrossRef]
  15. Liao, J.; Lin, H.; Li, Q.; Zhang, D. A correction model for the continuous deflection measurement of pavements under dynamic loads. IEEE Access 2019, 7, 154770–154785. [Google Scholar] [CrossRef]
  16. Li, Q.; Zou, Q.; Mao, Q.; Chen, X.; Li, B. Efficient calibration of a laser dynamic deflectometer. IEEE Trans. Instrum. Meas. 2013, 62, 806–813. [Google Scholar] [CrossRef]
  17. Luo, Y.; Li, X.; Jing, G.; Guo, H.; Yin, Q.; Zhang, Y. Performance Evaluation of Traffic Speed Deflectometer Based on Virtual Standard Test Road. IEEE Access 2023, 11, 977–986. [Google Scholar] [CrossRef]
  18. Xiao, F.; Xiang, Q.; Hou, X.; Amirkhanian, S.N. Utilization of traffic speed deflectometer for pavement structural evaluations. Measurement 2021, 178, 109326. [Google Scholar] [CrossRef]
  19. Wix, R.; Murnane, C.; Moffatt, M. Experience gained investigating, acquiring and operating the first traffic speed deflectometer in Australia. Transp. Res. Procedia 2016, 14, 3060–3069. [Google Scholar] [CrossRef]
  20. Ferne, B.W.; Langdale, P.; Round, N.; Fairclough, R. Development of a calibration procedure for the U.K. highways agency traffic-speed deflectometer. Transp. Res. Rec. J. Transp. Res. Board 2009, 2093, 111–117. [Google Scholar] [CrossRef]
  21. Simonin, J.; Lièvre, D.; Rasmussen, S.; Hildebrand, G. Assessment of the Danish high speed deflectograph in France. In Proceedings of the International Conferences on the Bearing Capacity of Roads, Railways and Airfields, Trondheim, Norway, 25–27 June 2005. [Google Scholar]
  22. Flores-Fuentes, W.; Trujillo-Hernández, G.; Alba-Corpus, I.Y.; Rodríguez-Quiñonez, J.C.; Mirada-Vega, J.E.; Hernández-Balbuena, D.; Murrieta-Rico, F.N.; Sergiyenko, O. 3D spatial measurement for model reconstruction: A review. Measurement 2023, 207, 112321. [Google Scholar] [CrossRef]
  23. Sun, J.; Zhang, J.; Liu, Z.; Zhang, G. A vision measurement model of laser displacement sensor and its calibration method. Opt. Lasers Eng. 2013, 51, 1344–1352. [Google Scholar] [CrossRef]
  24. Kang, J.; Wu, B.; Sun, Z.; Wang, J. Calibration method of a laser beam based on discrete point interpolation for 3D precision measurement. Opt. Express 2020, 28, 27588. [Google Scholar] [CrossRef] [PubMed]
  25. Bi, C.; Liu, Y.; Fang, J.; Guo, X.; Lv, L.; Dong, P. Calibration of laser beam direction for optical coordinate measuring system. Measurement 2015, 73, 191–199. [Google Scholar]
  26. Yang, T.; Wang, Z.; Wu, Z.; Li, X.; Wang, L.; Liu, C. Calibration of Laser Beam Direction for Inner Diameter Measuring Device. Sensors 2017, 17, 294. [Google Scholar] [CrossRef] [PubMed]
  27. Shen, Y.; Zhang, X.; Wang, Z.; Wang, J.; Zhu, L. A robust and efficient calibration method for spot laser probe on CMM. Measurement 2020, 154, 107523. [Google Scholar] [CrossRef]
  28. Liu, Z.; Lu, D.; Qian, W.; Gu, G.; Zhang, J.; Kong, X. Extrinsic calibration of a single-point laser rangefinder and single camera. Opt. Quantum Electron. 2019, 51, 186. [Google Scholar] [CrossRef]
  29. Hu, Z.; Li, Y.; Li, N.; Zhao, B. Extrinsic Calibration of 2-D Laser Rangefinder and Camera from Single Shot Based on Minimal Solution. IEEE Trans. Instrum. Meas. 2016, 65, 915–929. [Google Scholar] [CrossRef]
  30. Ma, L.; Wang, L.; Cao, T.; Wang, J.; He, X.; Xiong, C. A large-scale laser plane calibration system. Meas. Sci. Technol. 2007, 18, 1768–1772. [Google Scholar] [CrossRef]
  31. Wu, D.; Chen, T.; Li, A. A High Precision Approach to Calibrate a Structured Light Vision Sensor in a Robot-Based Three-Dimensional Measurement System. Sensors 2016, 16, 1388. [Google Scholar] [CrossRef]
  32. Shirai, K.; Ishimura, S.; Kawanami, T.; Hirasawa, S. Development of a new velocity calibration method for laser velocimetry using multiple scattering points on a single slit aperture. Microsyst. Technol. 2016, 22, 1351–1357. [Google Scholar] [CrossRef]
  33. Terra, O.; Hussein, H.M. Simple and accurate calibration system for Laser Doppler Velocimeters. Optik 2019, 179, 733–739. [Google Scholar] [CrossRef]
  34. Huang, R.; Nie, X.; Zhou, J. Laser Doppler velocimeter and its calibration system. Meas. J. Int. Meas. Confed. 2019, 134, 286–292. [Google Scholar] [CrossRef]
  35. Sheng, Z.; Chen, B.; Hu, W.; Yan, K.; Miao, H.; Zhang, Q.; Yu, Q.; Fu, Y. LDV-induced stroboscopic digital image correlation for high spatial resolution vibration measurement. Opt. Express 2021, 29, 28134. [Google Scholar] [CrossRef]
Figure 1. Measurement principle of pavement deflection velocity. (a) Synthesis principle of velocity Vm, (b) Relative position of the laser beam and the wheel, (c) Physical photo.
Applsci 13 10396 g001
Figure 2. Key processes of static and dynamic measurement methods and their connections.
Applsci 13 10396 g002
Figure 3. Schematic diagram of the principle of angle static measuring method. (a) View 1, (b) View 2.
Applsci 13 10396 g003
Figure 4. Static measuring experimental device, (a) Main view; (b) LDV at position C; (c) LDV at position C′; (d) High-precision digital display handle; (e) Coordinate paper and image recording equipment.
Applsci 13 10396 g004
Figure 5. Image recognition results, (a) before moving; (b) after moving.
Applsci 13 10396 g005
Figure 6. Schematic diagram of the dynamic measuring principle of LDV laser beam incident angle, (a) front view; (b) top view.
Applsci 13 10396 g006
Figure 7. Dynamic measuring device. (a) Physical photos; (b) Structure diagram.
Applsci 13 10396 g007
Figure 8. The actual measured Vm of LDV at different angular velocities ω.
Applsci 13 10396 g008
Figure 9. Laser spot position error analysis. (a) Schematic diagram of laser spot position deviation; (b) Schematic diagram of partial enlargement; (c) Velocity relationship.
Applsci 13 10396 g009
Figure 10. Relationship of Δβmr vs. β and λ. (a) Main view; (b) Projected view.
Applsci 13 10396 g010
Figure 11. Schematic diagram of the non-ideal installation state of the rotating disk and LDV in space. (a) Three coordinate systems of the rotating disk system; (b) Schematic diagram of the installation position of the rotating disk and LDV.
Applsci 13 10396 g011
Figure 12. When the roll angle is the largest, the positional relationship between the rotating disk and the LDV laser beam are in the X2 and −Y2 directions, respectively.
Applsci 13 10396 g012
Figure 13. Schematic diagram of the reciprocating motion of the rotating disk.
Applsci 13 10396 g013
Figure 14. Waveform curves of velocity components Vm1 and Vm2 changing with time t.
Applsci 13 10396 g014
Figure 15. When the pitch angle is the largest, the positional relationship between the rotating disk and the LDV.
Applsci 13 10396 g015
Figure 16. Velocity curves corresponding to different αy.
Applsci 13 10396 g016
Figure 17. Velocity curves corresponding to different αx.
Applsci 13 10396 g017
Table 1. The results of 10 test data sets, i = 1, 2, 3, …, 10.
Groupli (mm)di (mm)di′ (mm)di″ (mm)βi (°)βi (°)βi (°)
11029.99434.32734.42734.2271.90881.91441.9033
2930.61931.02131.12130.9211.90921.91531.9030
31015.02333.88233.98233.7821.91181.91751.9062
4976.00632.55232.65232.4521.91021.91611.9044
5960.84532.05932.15931.9591.9111.91691.9050
61011.9733.83533.93533.7351.9151.92061.9093
7919.5330.70930.80930.6091.91271.91901.9065
8984.96632.93433.03432.8341.91511.92091.9093
9956.84231.98632.08631.8861.91461.92061.9086
10971.95832.32732.42732.2271.90881.91081.8990
Table 2. Dynamic measurement results of V m ¯ and β.
ω (rpm)(mm/s)β (°)
1000162.6321.8736
1500243.7681.8722
2000325.0351.8723
2500406.1691.8717
3000487.1171.8705
3500568.2011.8703
4000649.1451.8696
Disclaimer/Publisher’s Note: The statements, opinions and data contained in all publications are solely those of the individual author(s) and contributor(s) and not of MDPI and/or the editor(s). MDPI and/or the editor(s) disclaim responsibility for any injury to people or property resulting from any ideas, methods, instructions or products referred to in the content.

