


Influence of Induced Environment Oscillations on Limits of Stability in Healthy Adults


Abstract
:1. Introduction
2. Materials and Methods
2.1. Study Group
- Women and men aged between 18 and 40 years;
- No pathological deformations in bones of feet;
- No reports of injuries in lower limbs in the past three years;
- No reports of balance-maintaining ability dysfunctions;
- No motion sickness/simulation sickness.
2.2. Study Design
- movement along the sagittal axis (AP direction) of the currently tested participant:
- ft—frequency of the scenery movements,
- Ay—amplitude of the scenery movements in centimeters, and
- t—time.
- movement around the transverse axis of a given test participant:
- fr—frequency of the scenery movements,
- Aφ—amplitude of the scenery movements in degrees, and
- t—time.
- The following designations were adopted for the purpose of the tests under discussion:
- Ay = 15 [cm],
- Aφ = 1 [deg], and
- fr = depending on the trial: 0.2 Hz, 0.5 Hz, 0.7 Hz or 1.4 Hz.
- Test with open eyes, without leaning: the participant stood calmly in an upright position without any disturbances and was supposed to focus their sight on one point at around 2.5 m in front of them.
- Test with closed eyes, without leaning: as above, but with closed eyes.
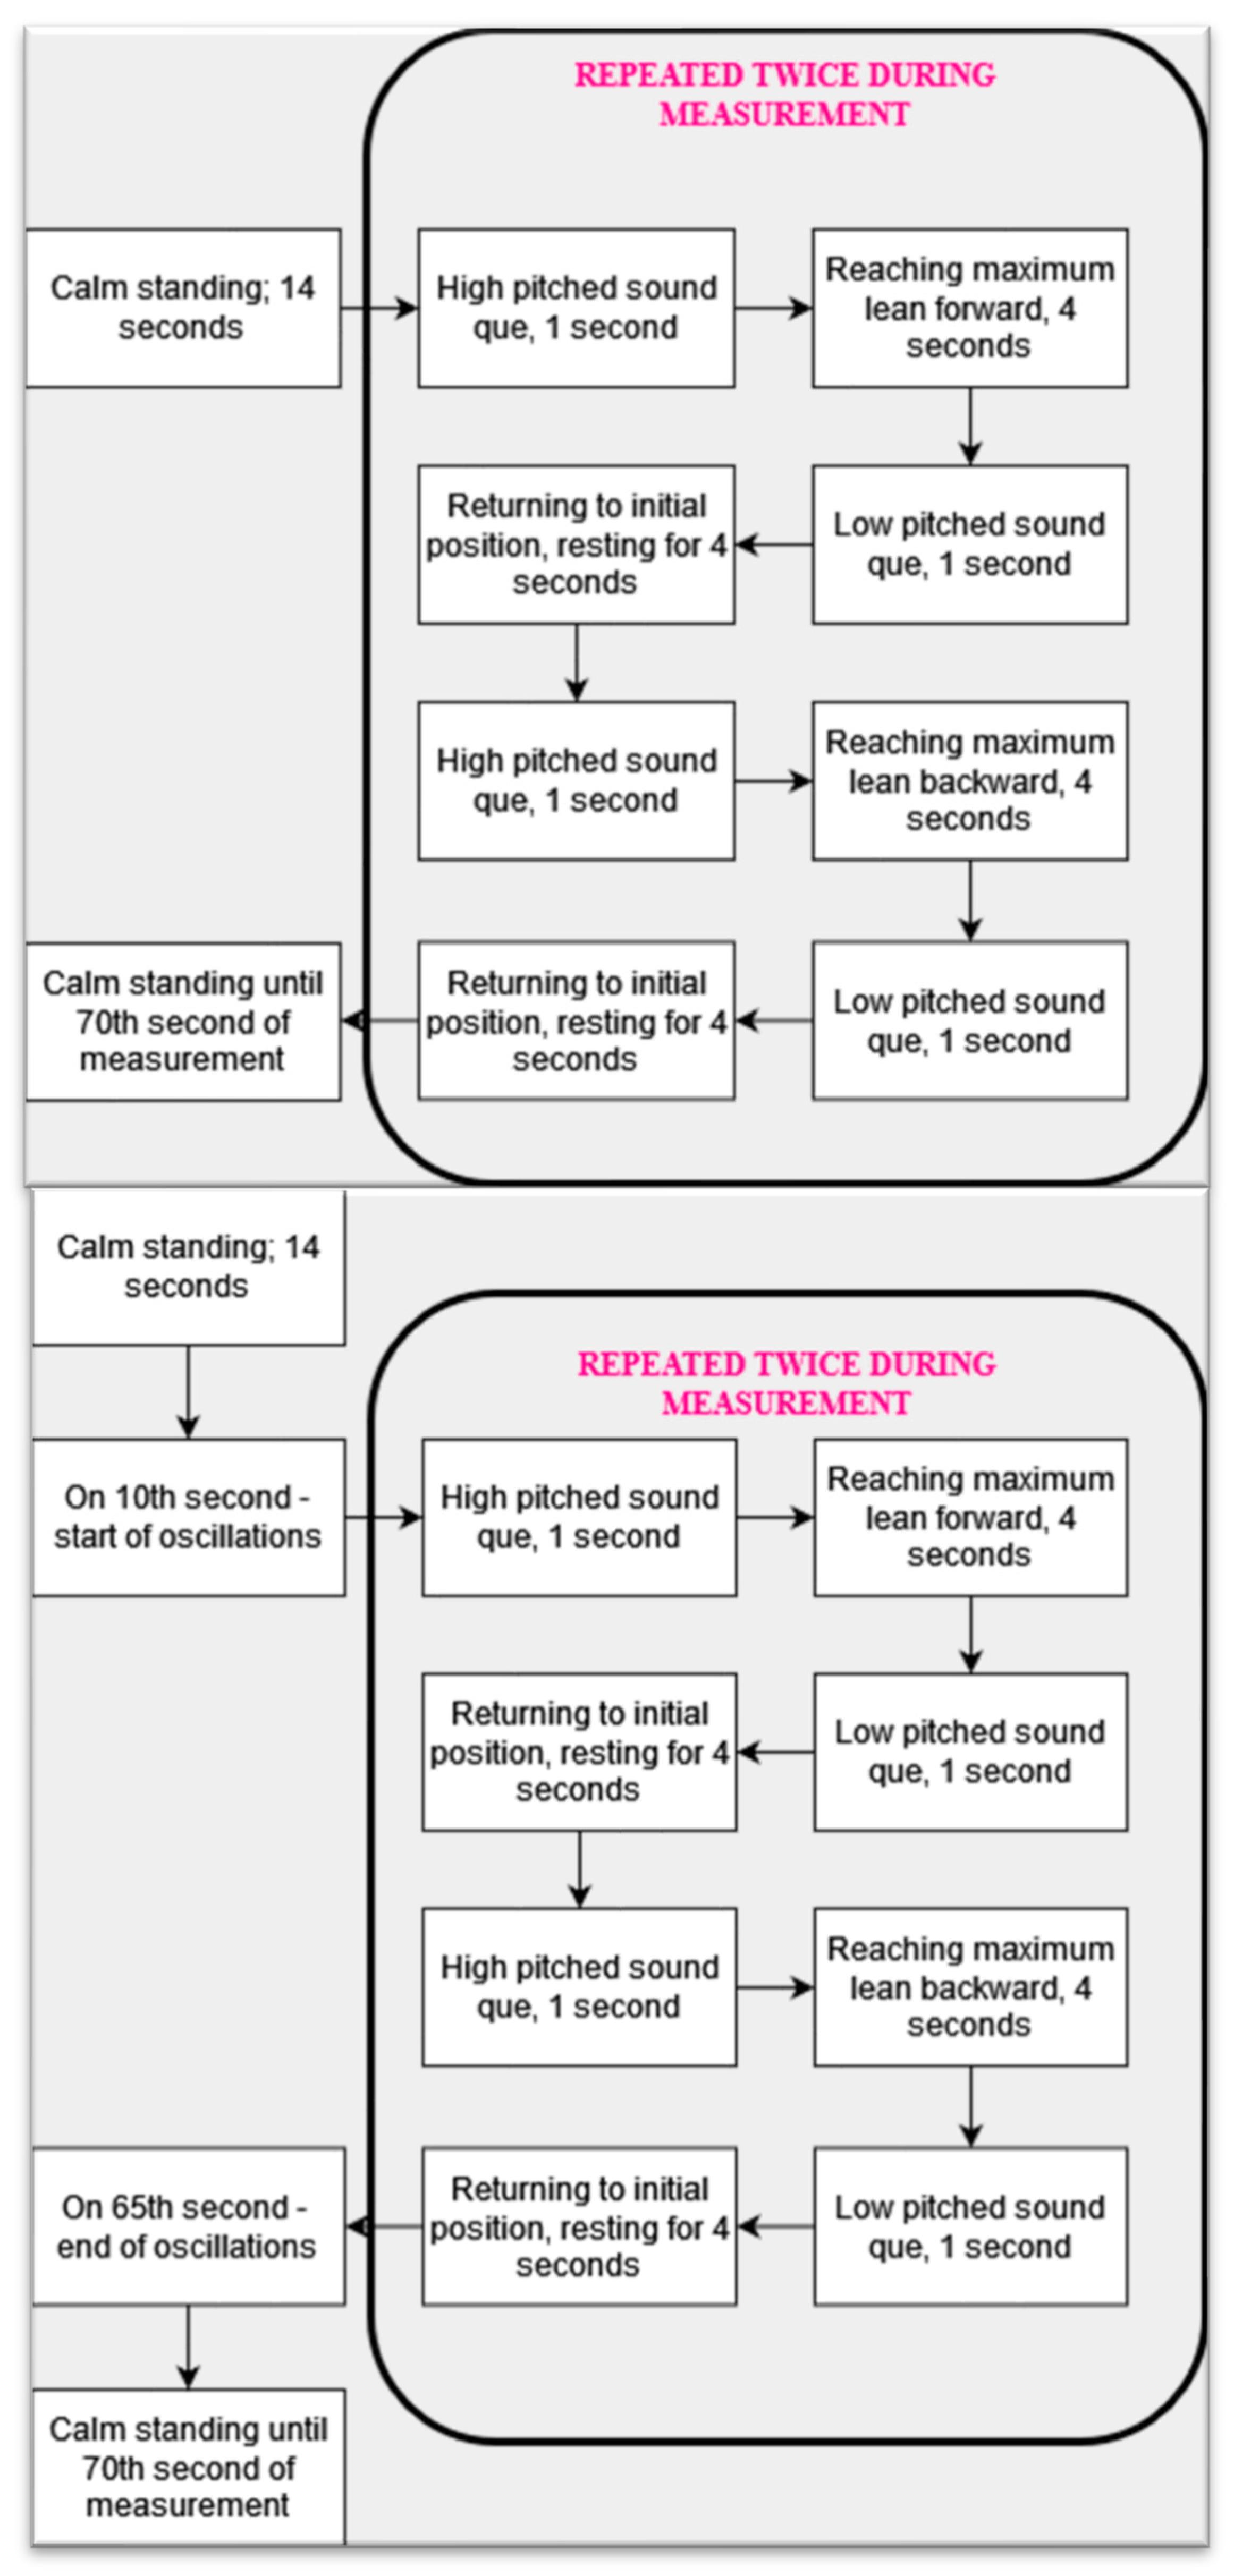
- Test with open eyes and leaning: the participant stood calmly in an upright position and, in response to a high-pitched sound cue, was supposed to lean forward, keep the leaned position for four seconds, and return to the initial position after hearing a low-pitched sound.
- Test with closed eyes and leaning: as above but with closed eyes.
- Test in stationary VR scenery: the participant wore the VR HMD, and the scenery was displayed and stationary. The task of the participant was as described in the trial with eyes open.
- Test in darkness displayed in VR: the participant wore the VR HMD, displaying darkness (the screen was black). The task of the participant was as described in the trial with eyes open.
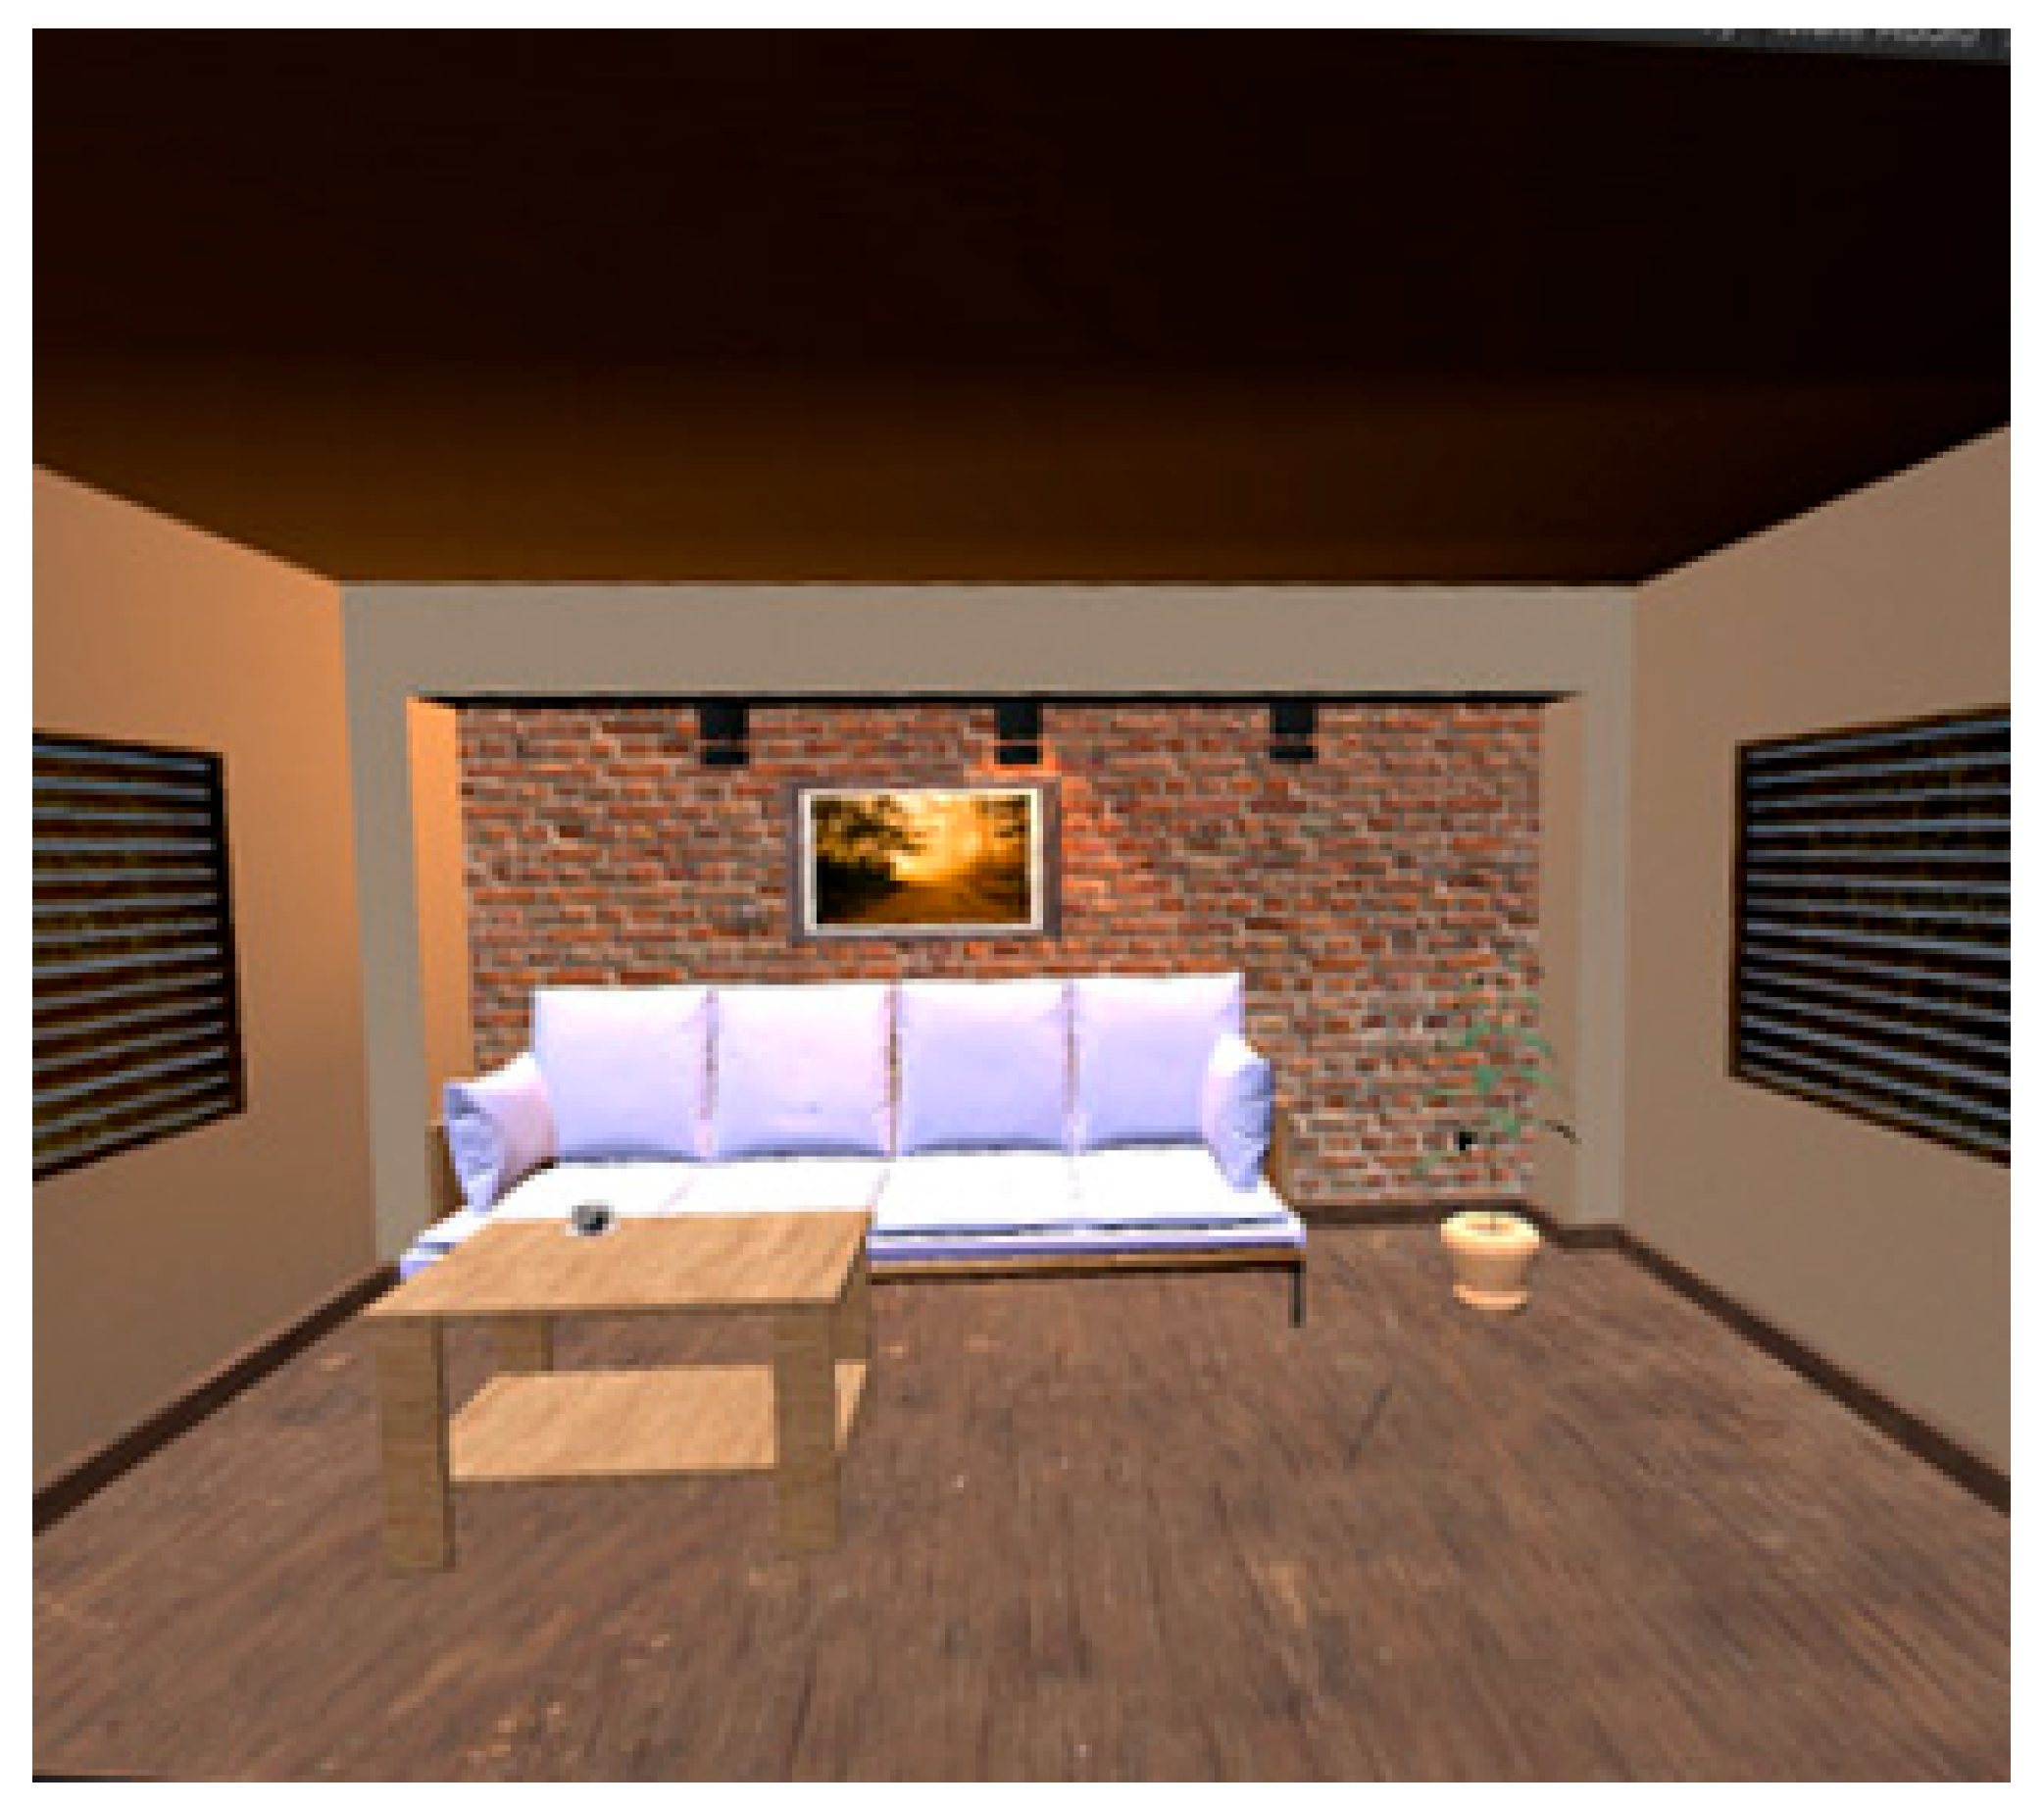
- Test in oscillating VR scenery (0.2; 0.5; 0.7 and 1.4 Hz): 4 trials were performed with the participant wearing the VR HMD, which was displaying the same scenery as in the test with stationary scenery (shown in Figure 1), but in 10th second of measurement, the scenery began to oscillate in the A/P axis with the chosen frequency. Oscillations were in effect until the 65th second of measurement. Otherwise, the subject performed the leaning as described in the test with open eyes.
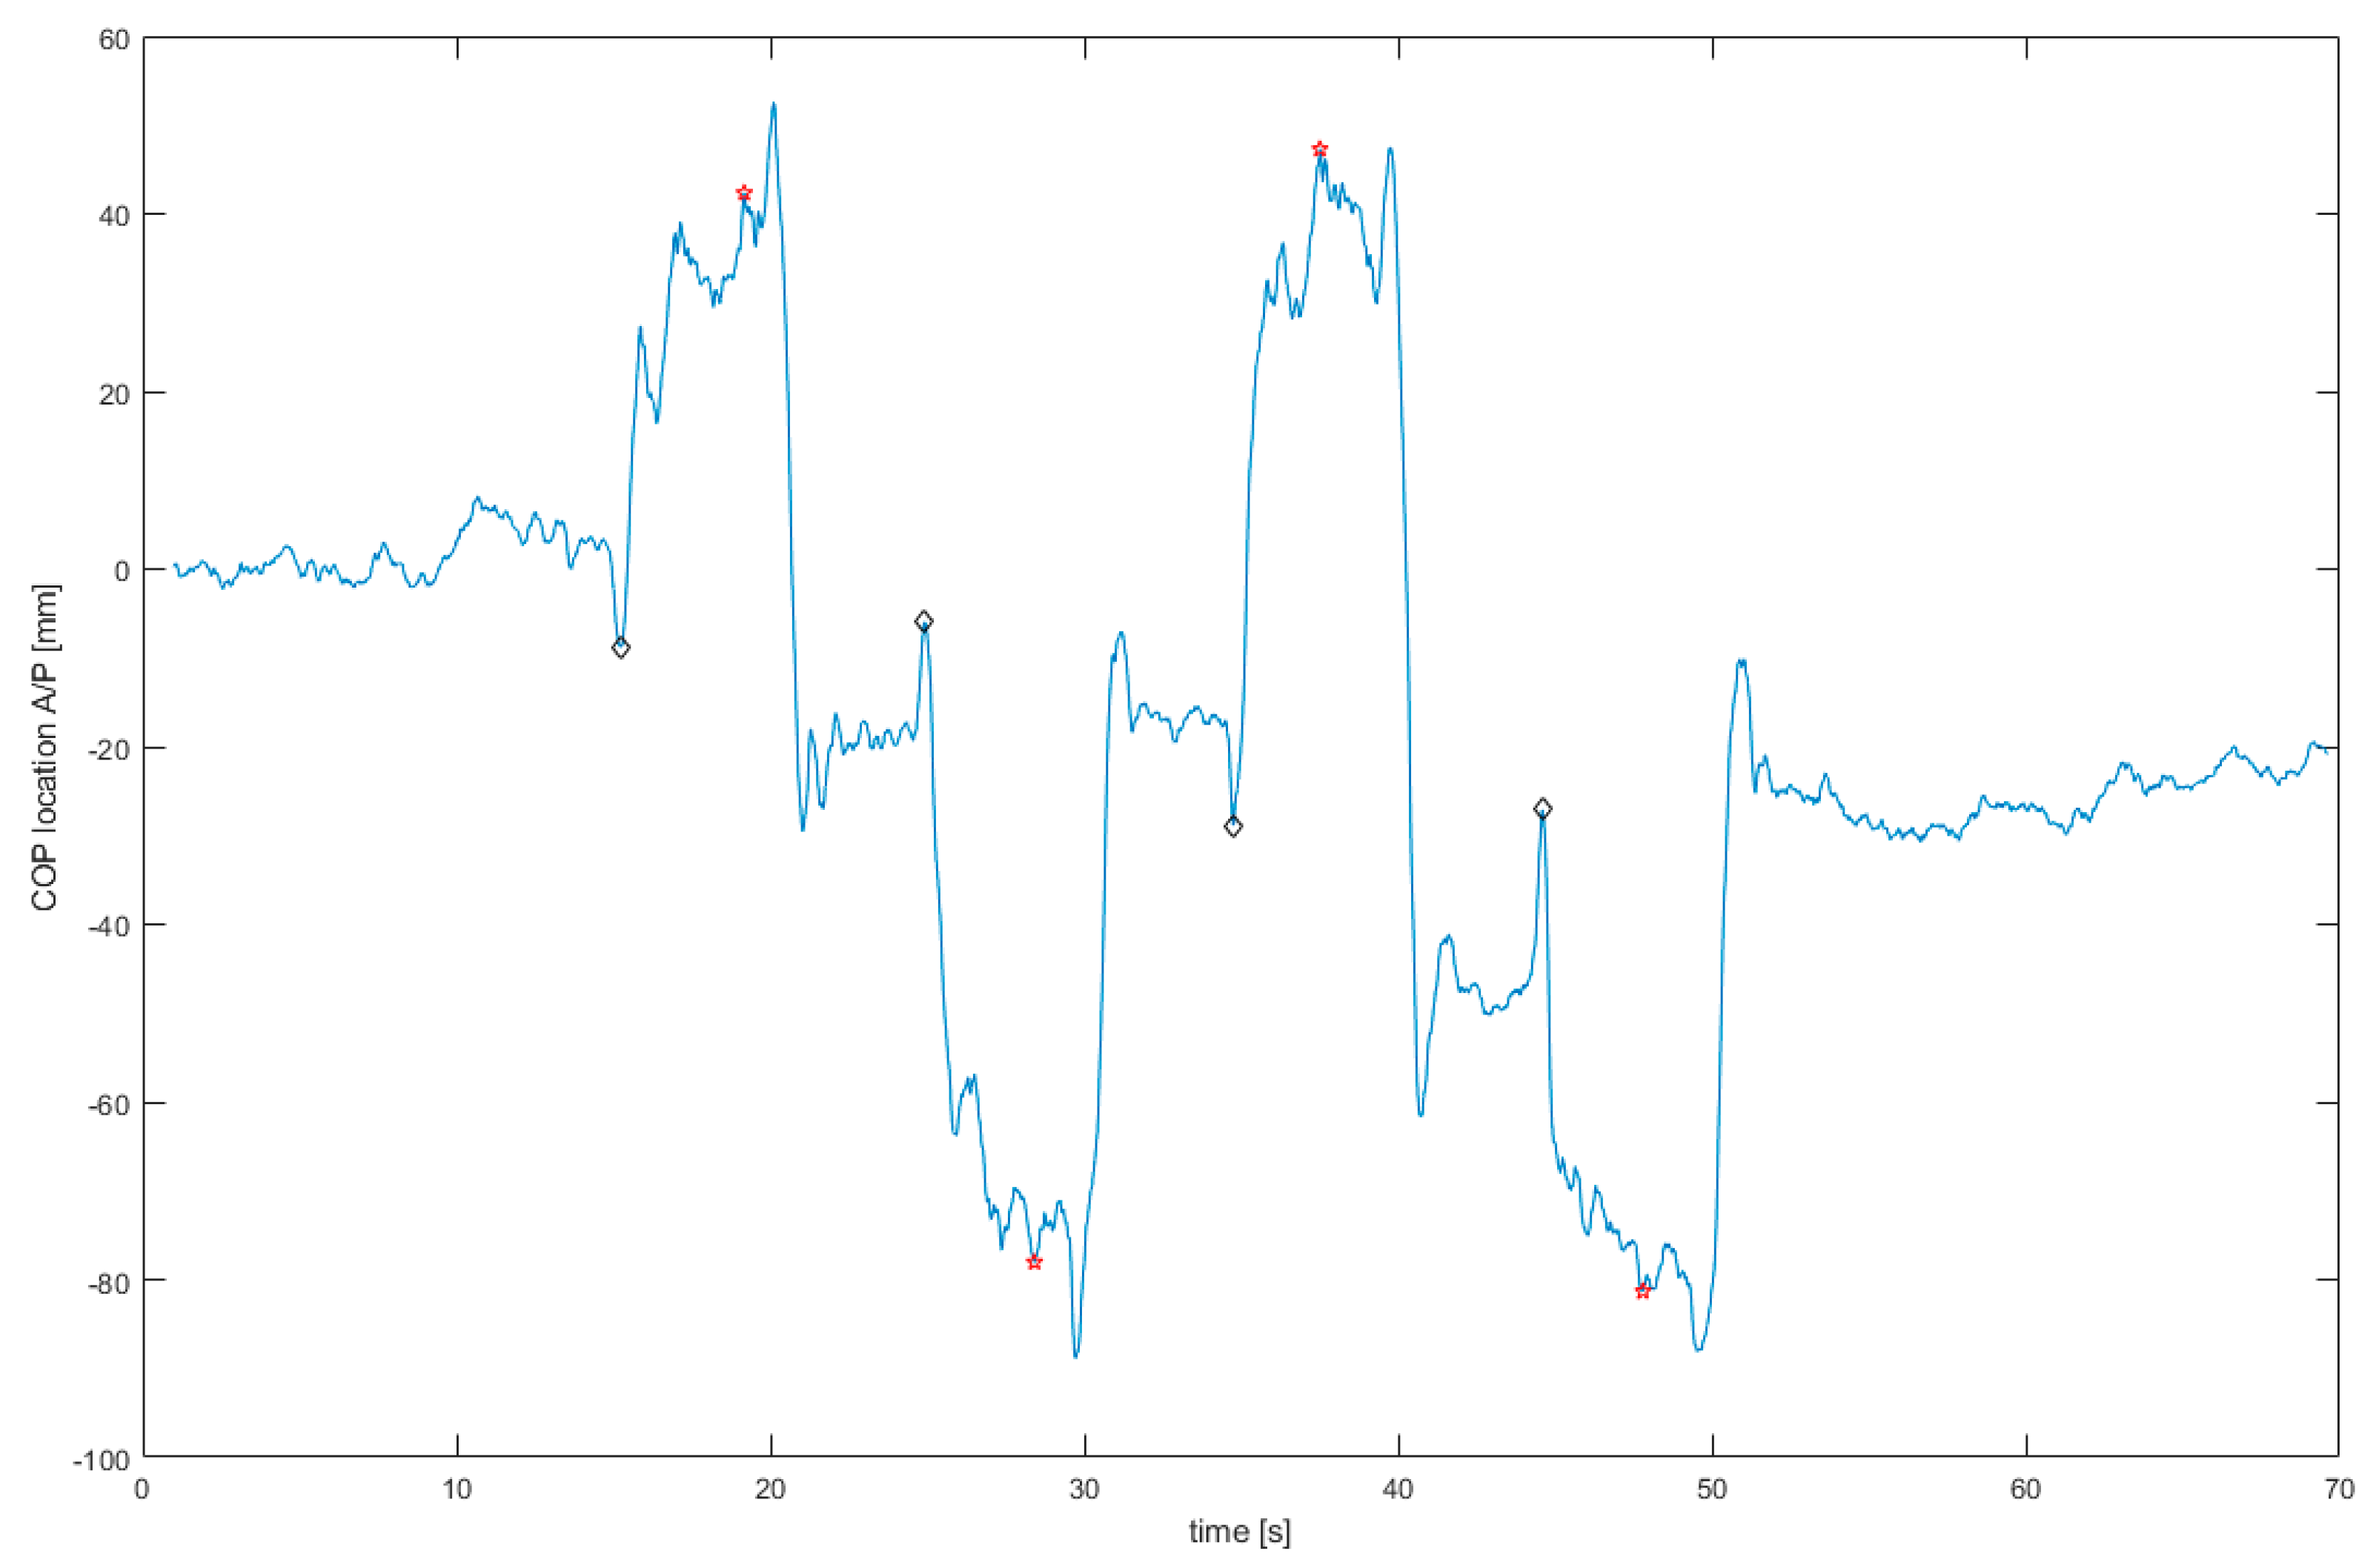
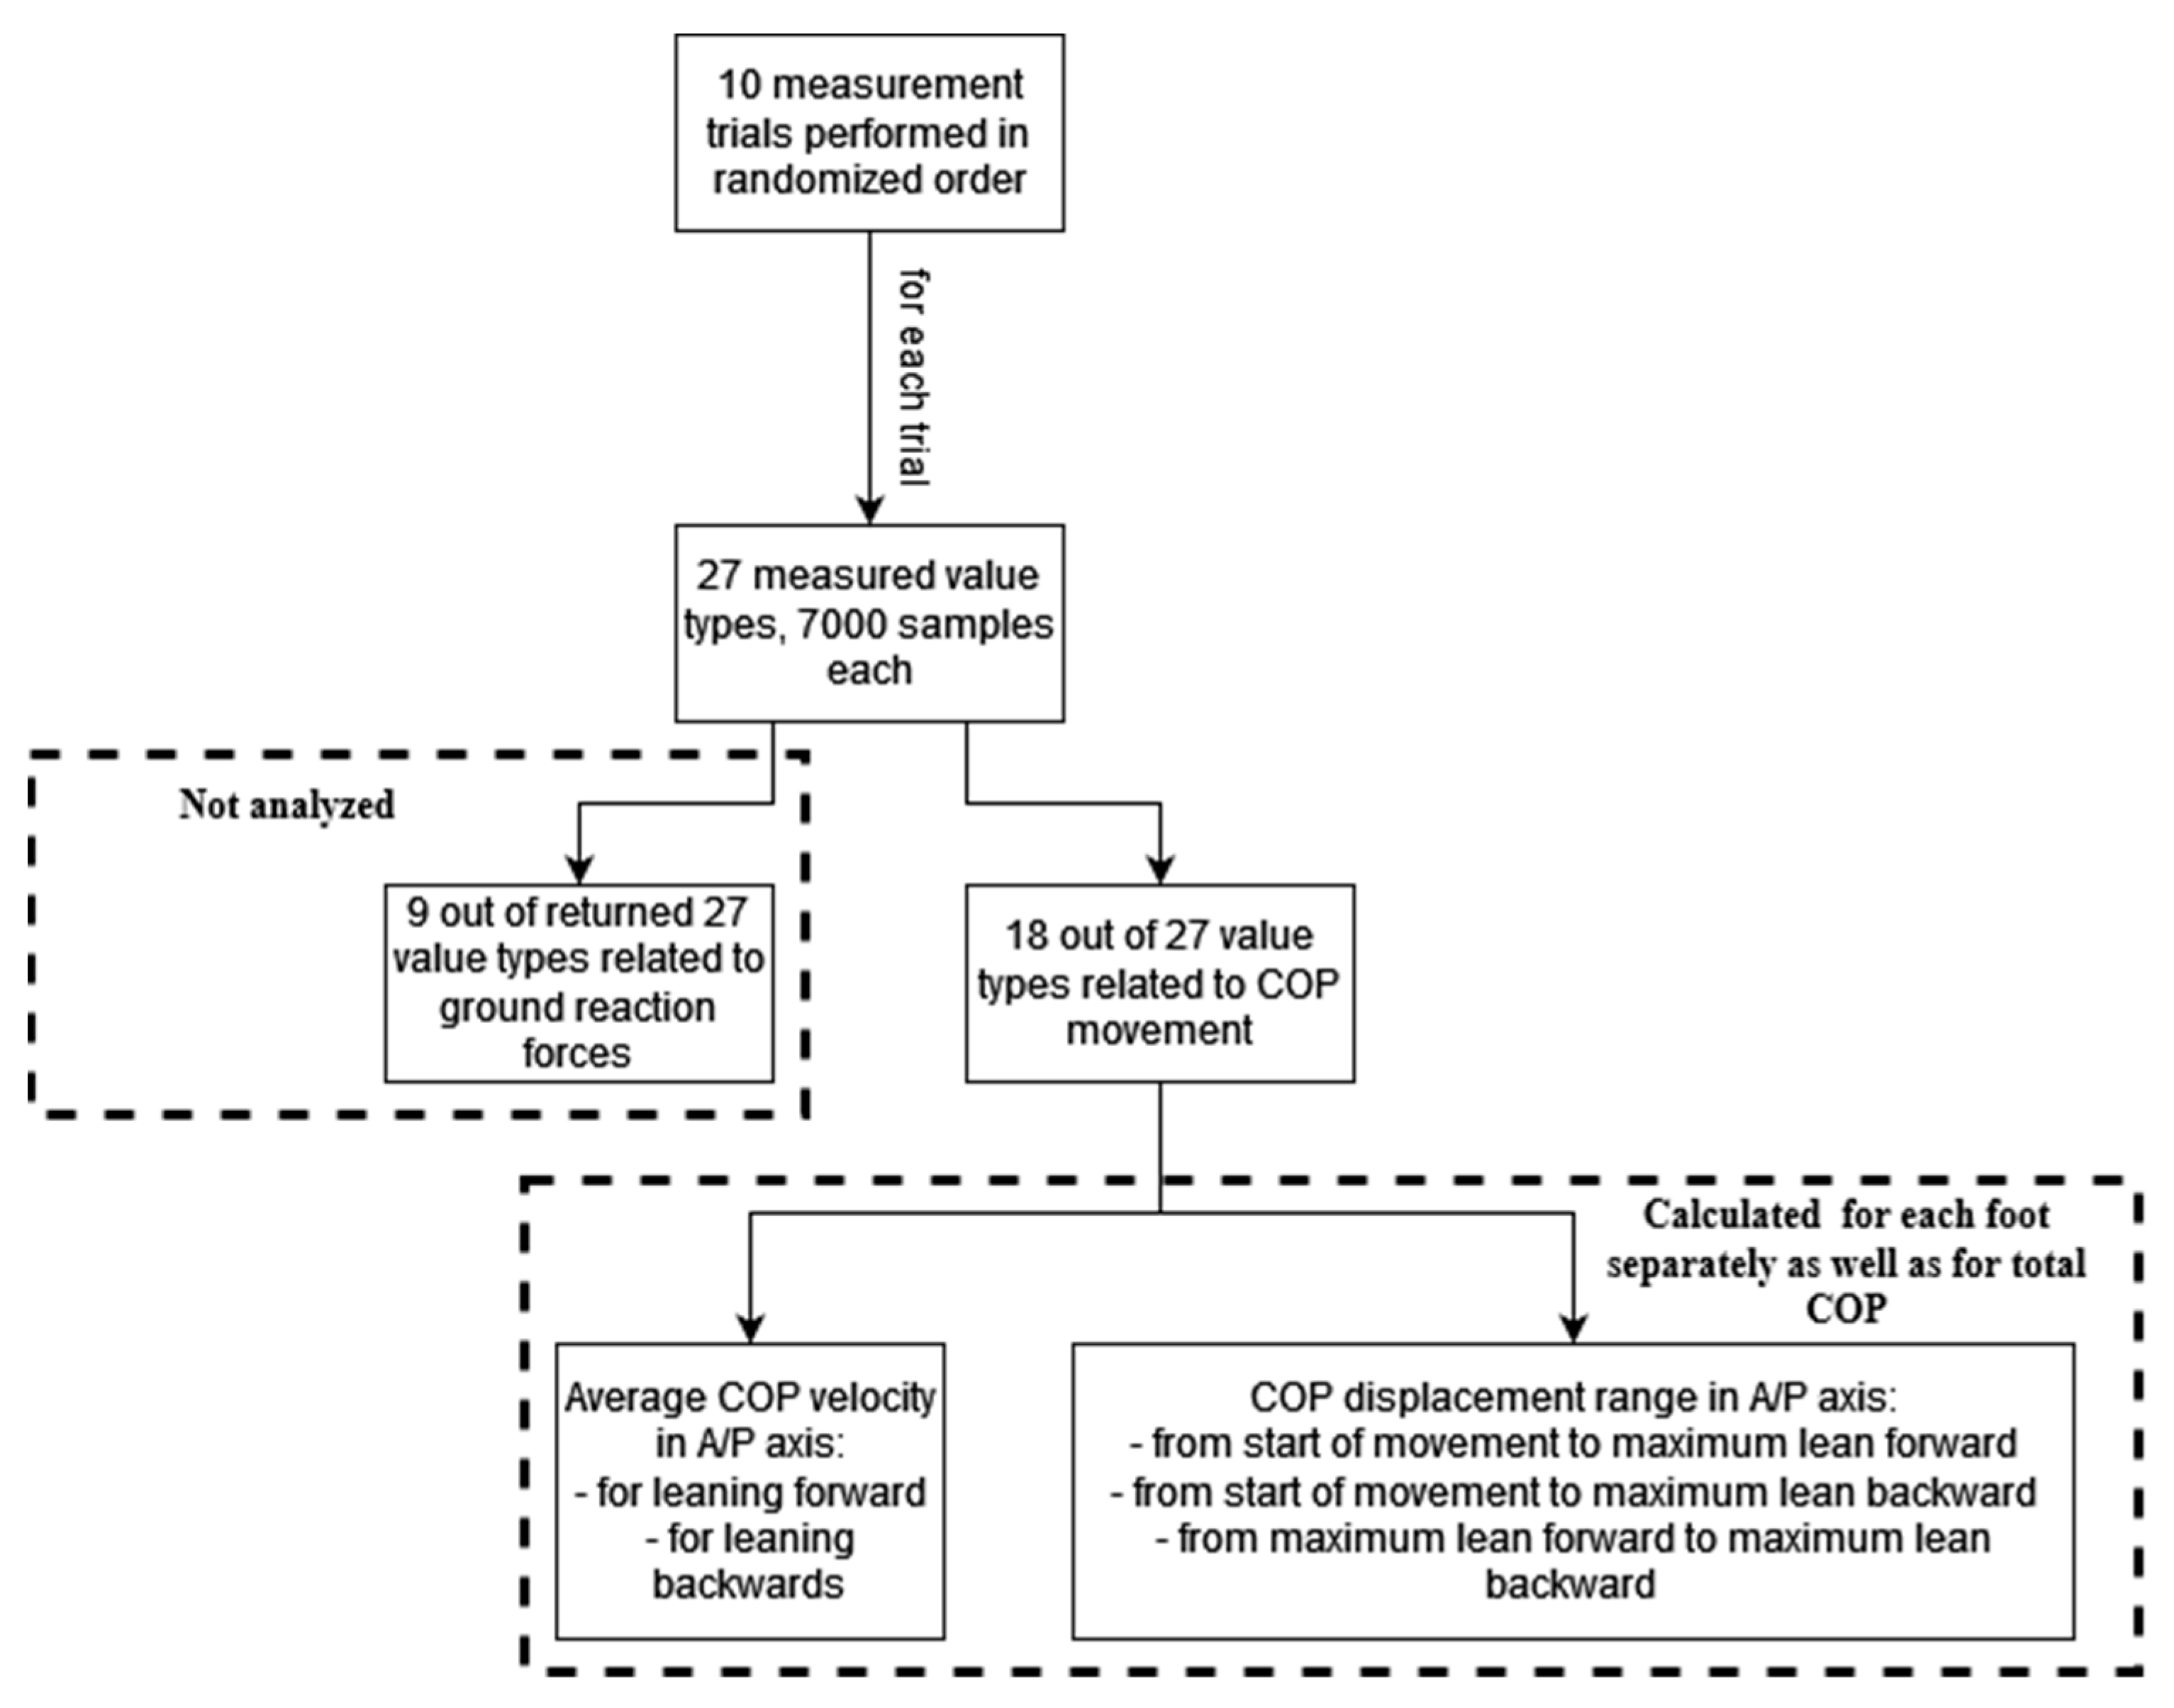
2.3. Processed Data
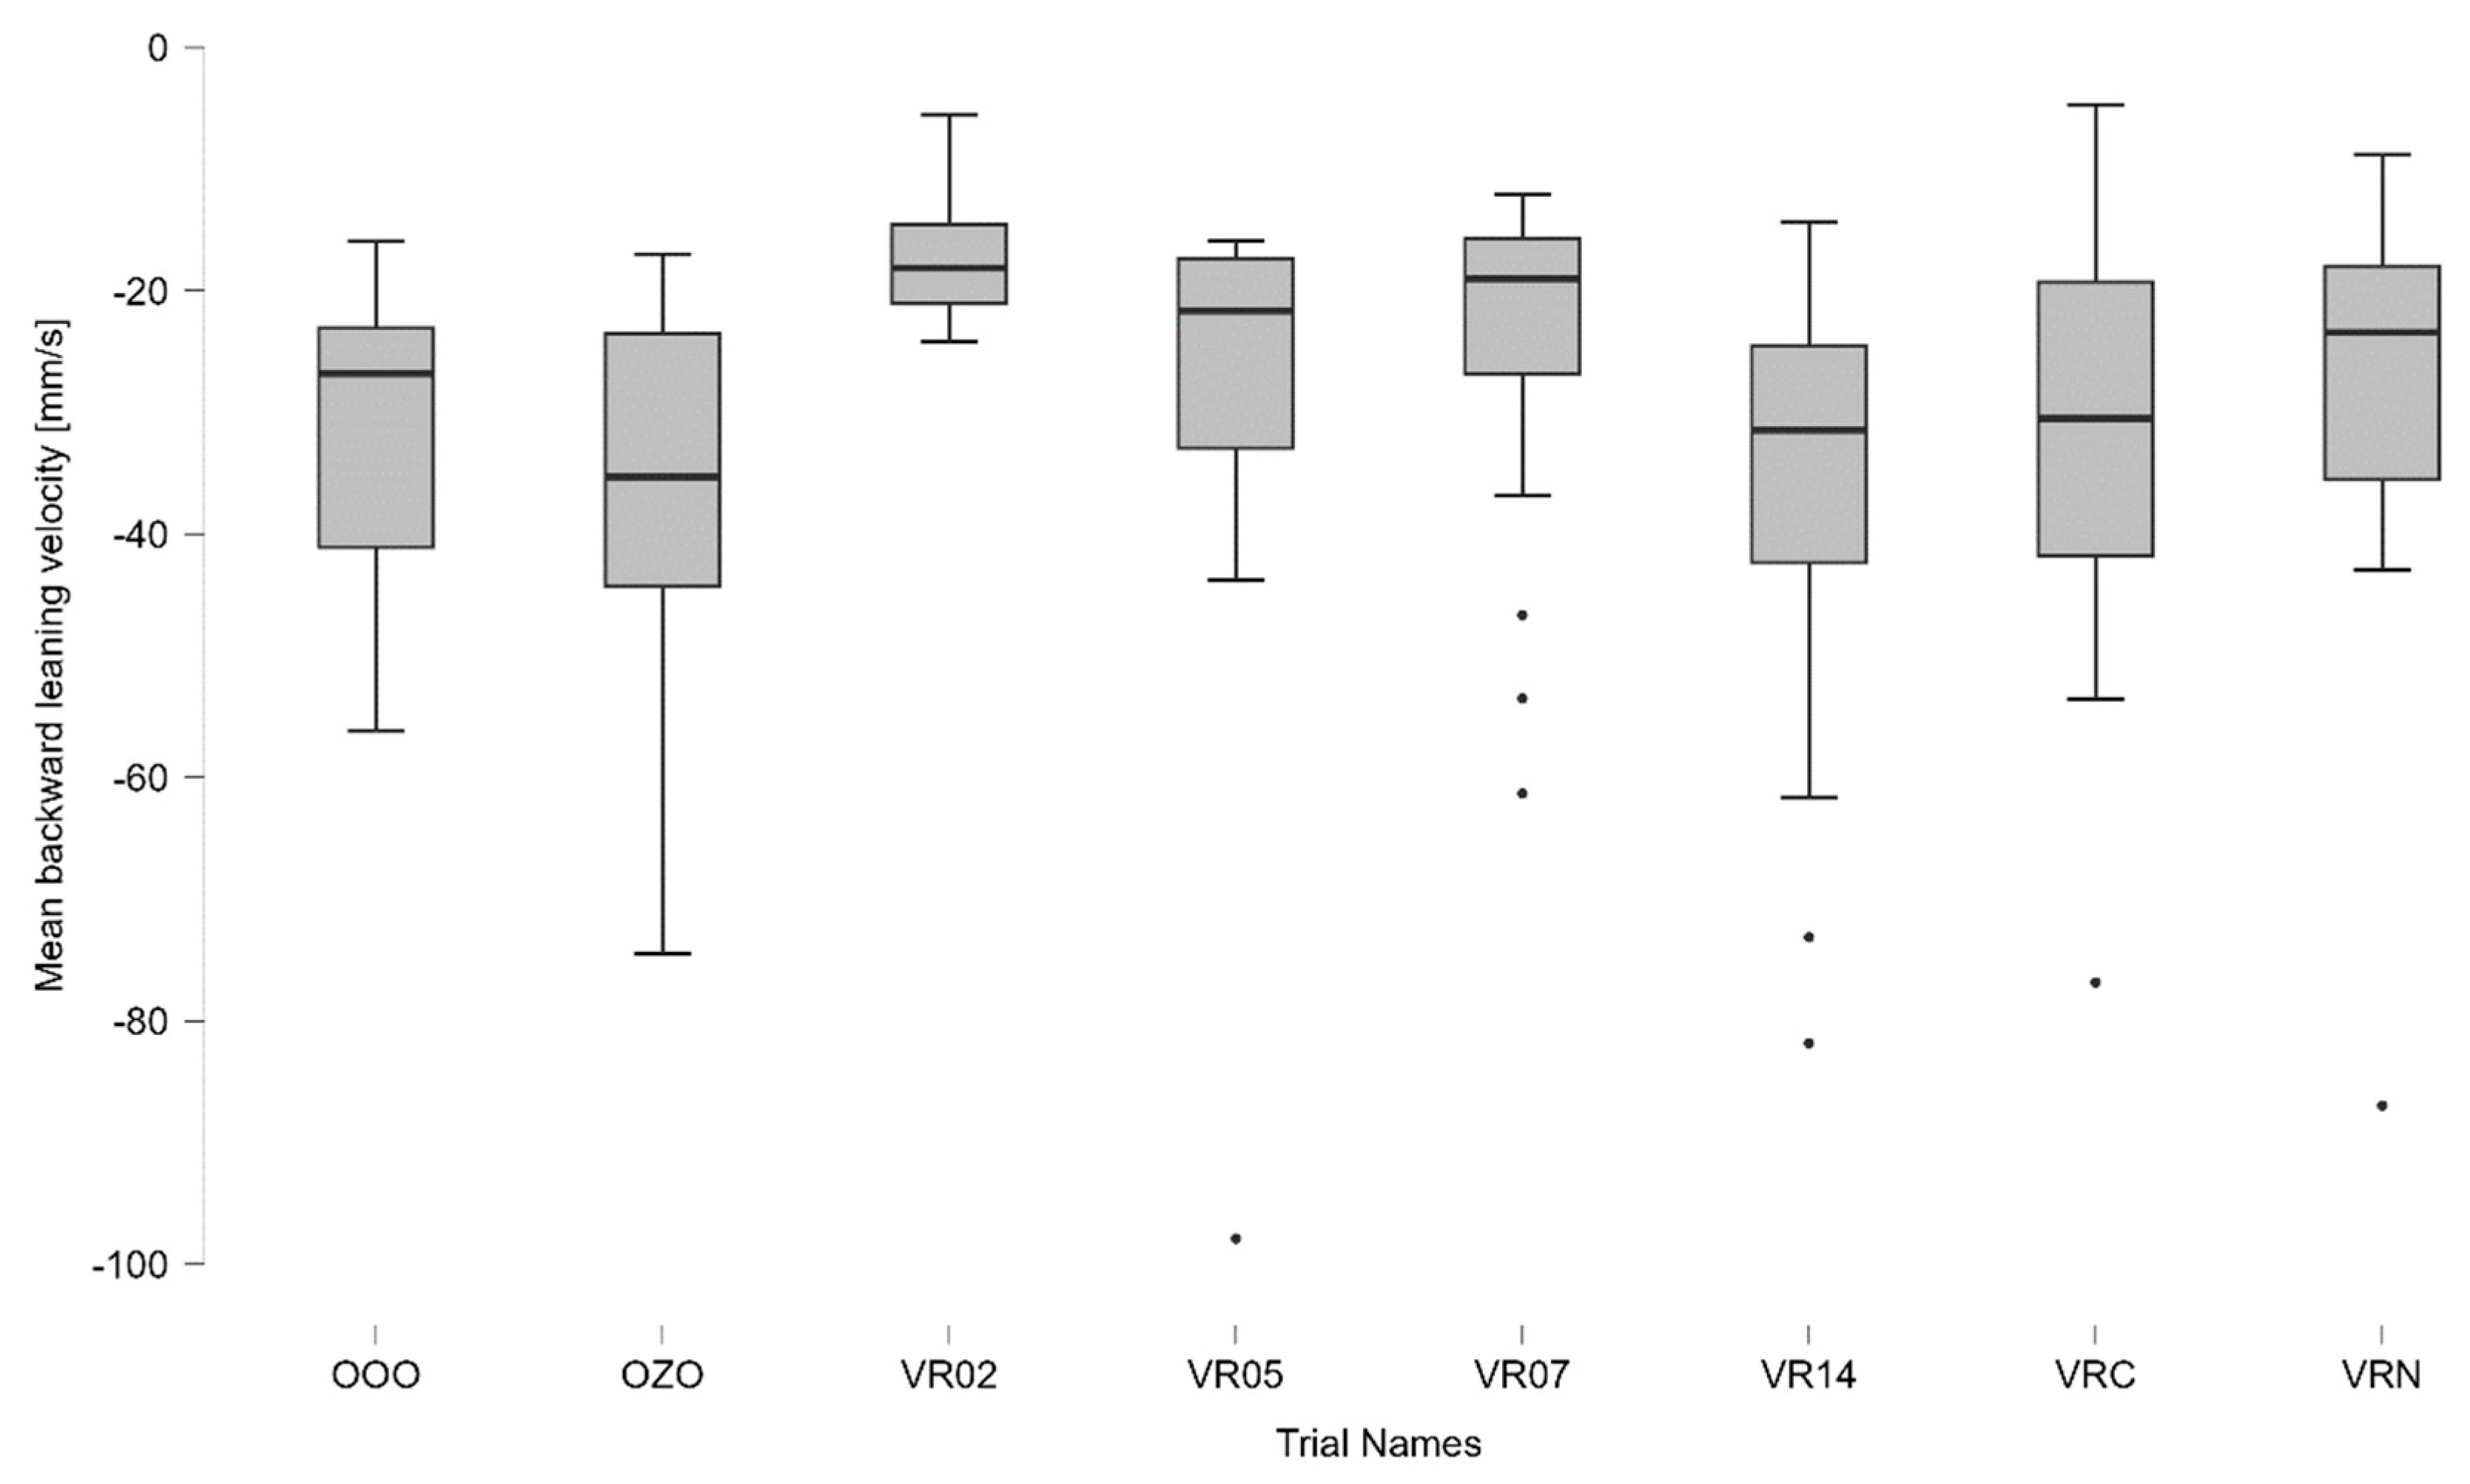
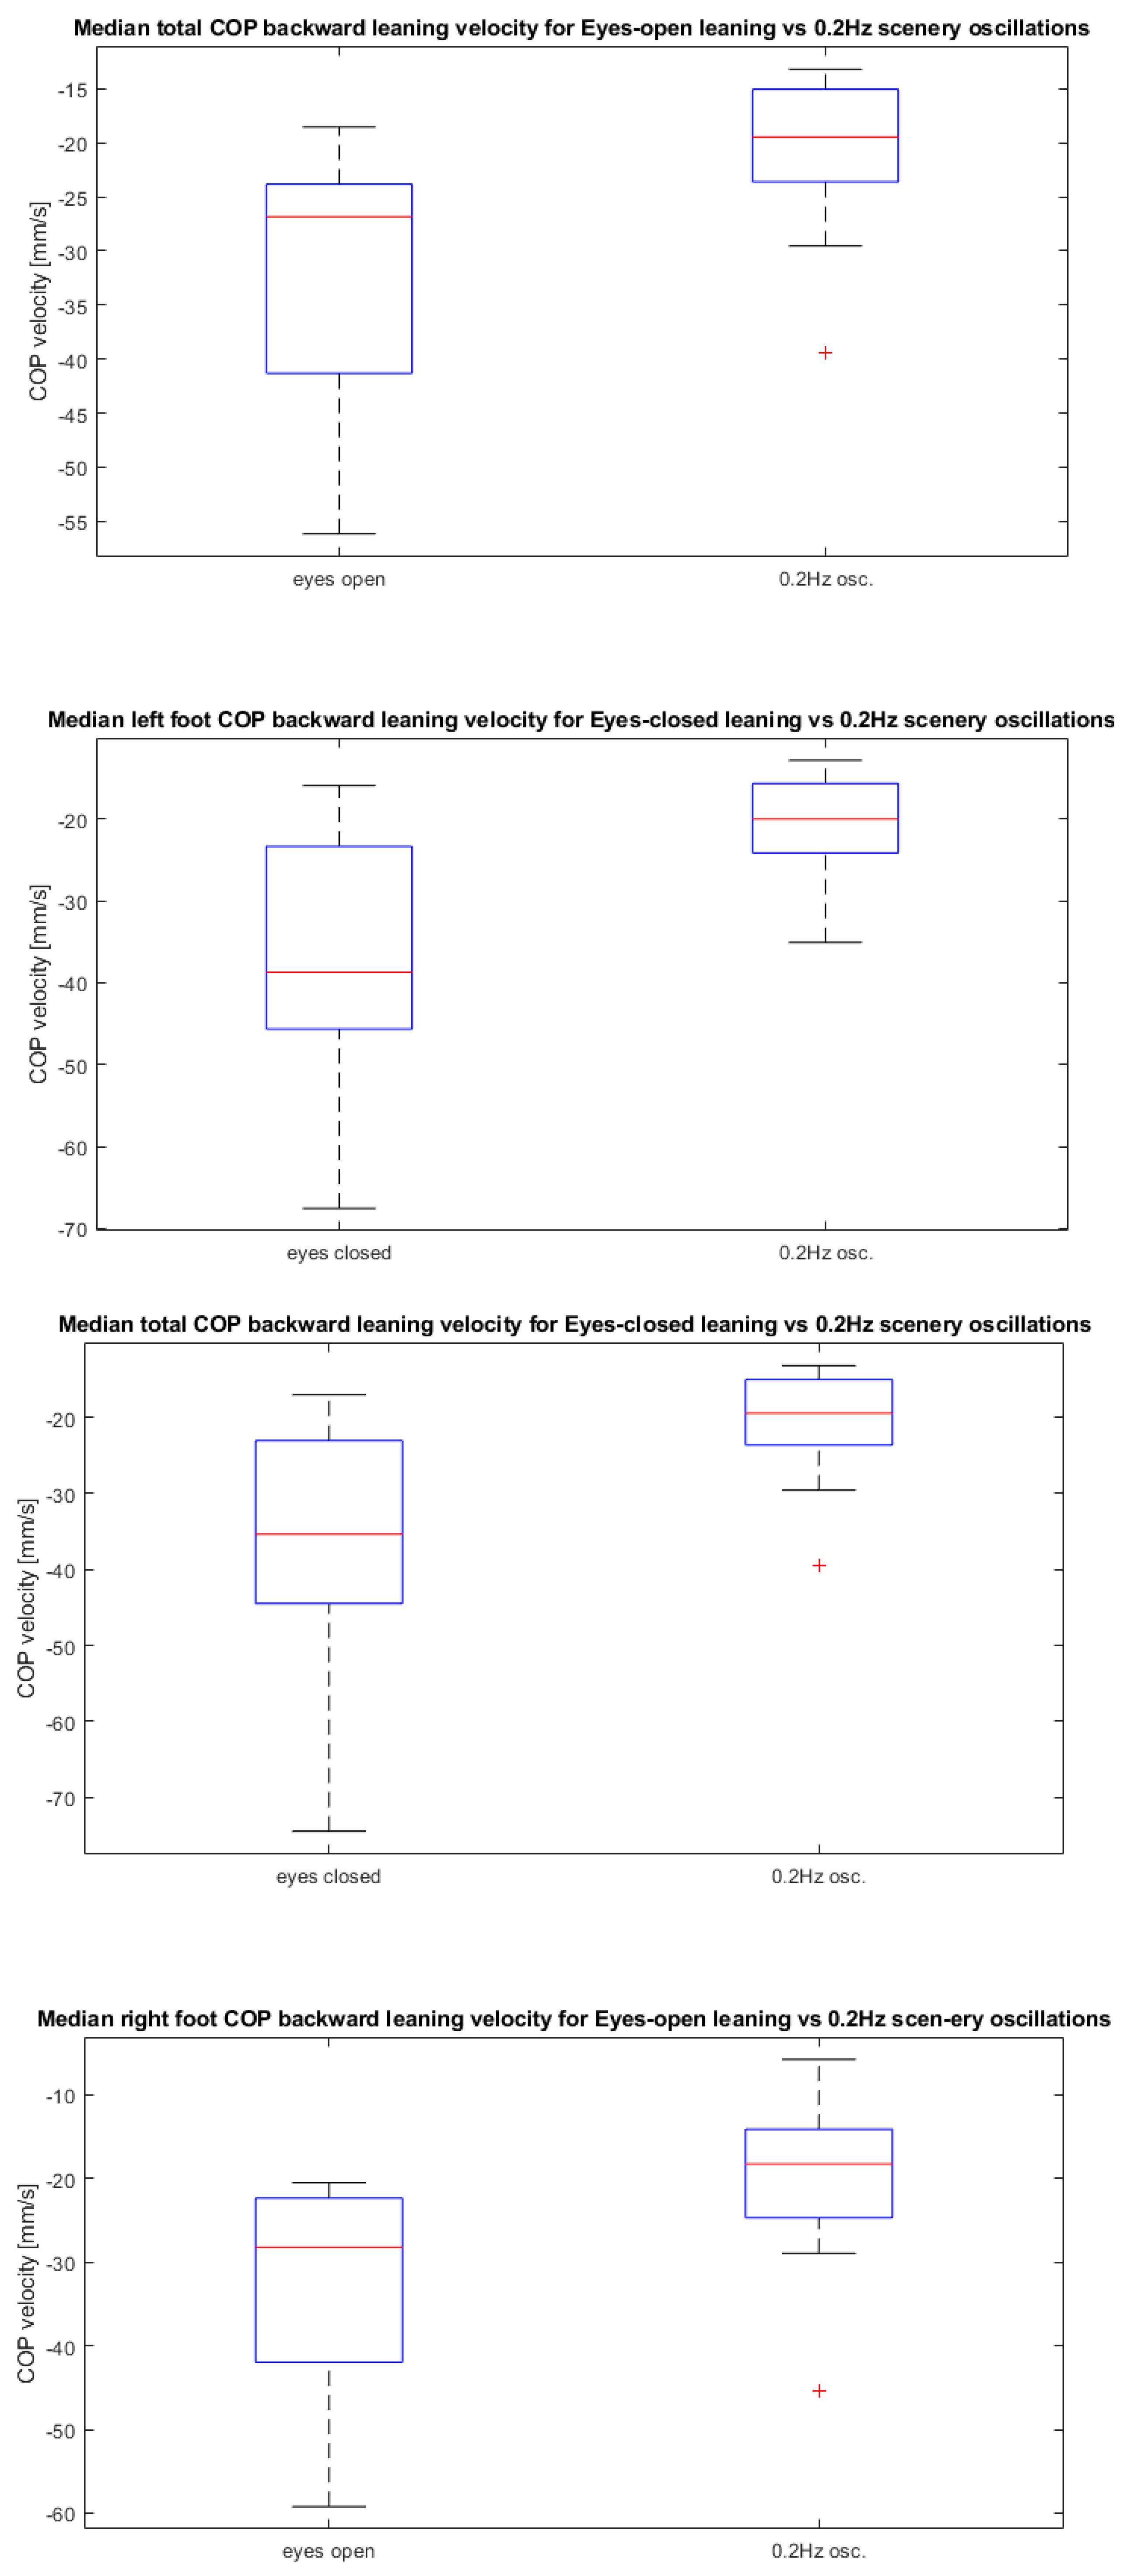
3. Results
- Median total COP backward leaning velocity for eyes-open leaning vs. 0.2 Hz scenery oscillations;
- Median total COP backward leaning velocity for eyes-closed leaning vs. 0.2 Hz scenery oscillations;
- Median left foot COP backward leaning velocity for eyes-closed leaning vs. 0.2 Hz scenery oscillations;
- Median right foot COP backward leaning velocity for eyes-open leaning vs. 0.2 Hz scenery oscillations.
4. Discussion
5. Conclusions
Author Contributions
Funding
Institutional Review Board Statement
Informed Consent Statement
Data Availability Statement
Conflicts of Interest
References
- Lee, R.B.; Lee, Y.S.; Kweon, H.; Kim, H.K.; Kim, Y.S. A Mobile Gait Training System Providing an Active Interaction. Appl. Sci. 2023, 13, 580. [Google Scholar] [CrossRef]
- Gzik, M.; Wodarski, P.; Jurkojć, J.; Michnik, R.; Bieniek, A. Interactive system of enginering support of upper limb diagnosis. Adv. Intell. Syst. Comput. 2017, 526, 115–123. [Google Scholar] [CrossRef]
- Clark, S.; Rose, D.J.; Fujimoto, K. Generalizability of the limits of stability test in the evaluation of dynamic balance among older adults. Arch. Phys. Med. Rehabil. 1997, 78, 1078–1084. [Google Scholar] [CrossRef] [PubMed]
- Blanchet, M.; Prince, F.; Messier, J. Development of postural stability limits: Anteroposterior and mediolateral postural adjustment mechanisms do not follow the same maturation process. Hum. Mov. Sci. 2019, 63, 164–171. [Google Scholar] [CrossRef] [PubMed]
- Lininger, M.R.; Leahy, T.E.; Haug, E.C.; Bowman, T.G. Test-Retest Reliability of the Limits of Stability Test Performed by Young Adults Using Neurocom® Vsr Sport. Int. J. Sports Phys. Ther. 2018, 13, 800–807. [Google Scholar] [CrossRef] [PubMed]
- Wodarski, P.; Jurkojć, J.; Chmura, M.; Bieniek, A.; Guzik-Kopyto, A.; Michnik, R. Analysis of the Ability to Maintain the Balance of Veterans of Stabilization Missions. In Innovations in Biomedical Engineering; Springer: Cham, Switzerland, 2021; pp. 197–207. [Google Scholar]
- Blanchet, M.; Prince, F.; Chouinard, S.; Messier, J. Postural stability limits in manifest and premanifest Huntington’s disease under different sensory conditions. Neuroscience 2014, 279, 102–112. [Google Scholar] [CrossRef] [PubMed]
- Faraldo-García, A.; Santos-Pérez, S.; Crujeiras, R.; Soto-Varela, A. Postural changes associated with ageing on the sensory organization test and the limits of stability in healthy subjects. Auris Nasus Larynx 2016, 43, 149–154. [Google Scholar] [CrossRef] [PubMed]
- Benda, B.J.; Riley, P.O.; Krebs, D.E. Biomechanical Relationship Between Center of Gravity and Center of Pressure during Standing. IEEE Trans. Rehabil. Eng. 1994, 2, 3–10. [Google Scholar] [CrossRef]
- In, T.; Lee, K.; Song, C. Virtual reality reflection therapy improves balance and gait in patients with chronic stroke: Randomized controlled trials. Med. Sci. Monit. 2016, 22, 4046–4053. [Google Scholar] [CrossRef] [PubMed]
- Rutkowski, S.; Rutkowska, A.; Kiper, P.; Jastrzebski, D.; Racheniuk, H.; Turolla, A.; Szczegielniak, J.; Casaburi, R. Virtual reality rehabilitation in patients with chronic obstructive pulmonary disease: A randomized controlled trial. Int. J. COPD 2020, 15, 117–124. [Google Scholar] [CrossRef] [PubMed]
- Feng, H.; Li, C.; Liu, J.; Wang, L.; Ma, J.; Li, G.; Gan, L.; Shang, X.; Wu, Z. Virtual reality rehabilitation versus conventional physical therapy for improving balance and gait in parkinson’s disease patients: A randomized controlled trial. Med. Sci. Monit. 2019, 25, 4186–4192. [Google Scholar] [CrossRef] [PubMed]
- Cho, C.; Hwang, W.; Hwang, S.; Chung, Y. Treadmill training with virtual reality improves gait, balance, and muscle strength in children with cerebral palsy. Tohoku J. Exp. Med. 2016, 238, 213–218. [Google Scholar] [CrossRef] [PubMed]
- Juras, G.; Słomka, K.; Fredyk, A.; Sobota, G.; Bacik, B. Evaluation of the Limits of Stability (LOS) Balance Test. J. Hum. Kinet. 2008, 19, 39–52. [Google Scholar] [CrossRef]
- Kiemel, T.; Oie, K.S.; Jeka, J.J. Slow Dynamics of Postural Sway Are in the Feedback Loop. J. Neurophysiol. 2006, 95, 1410–1418. [Google Scholar] [CrossRef] [PubMed]
- JScholz, P.; Park, E.; Jeka, J.J.; Schöner, G.; Kiemel, T. How visual information links to multijoint coordination during quiet standing. Exp. Brain Res. 2012, 222, 229–239. [Google Scholar] [CrossRef] [PubMed]
- Borger, L.L.; Whitney, S.L.; Redfern, M.S.; Furman, J.M. The influence of dynamic visual environments on postural sway in the elderly. J. Vestib. Res. 1999, 9, 197–205. [Google Scholar] [CrossRef] [PubMed]
- Lafond, D.; Corriveau, H.; Hébert, R.; Prince, F. Intrasession reliability of center of pressure measures of postural steadiness in healthy elderly people. Arch. Phys. Med. Rehabil. 2004, 85, 896–901. [Google Scholar] [CrossRef] [PubMed]
- Wodarski, P.; Jurkojć, J.; Gzik, M. Wavelet decomposition in analysis of impact of virtual reality head mounted display systems on postural stability. Sensors 2020, 20, 7138. [Google Scholar] [CrossRef] [PubMed]


| Name of 1st Trial | Name of 2nd Trial | Median of 1st Trial [mm/s] | Median of 2nd Trial [mm/s] | Difference in Medians [mm/s] | p-Value | Effect Size |
|---|---|---|---|---|---|---|
| Total COP backward leaning velocity for eyes-open leaning | Total COP backward leaning velocity for 0.2 Hz scenery oscillations | −32.4892 | −20.5013 | −11.9878 | 0.0323 | 0.80 |
| Total COP backward leaning velocity for eyes-closed leaning | Total COP backward leaning velocity for 0.2 Hz scenery oscillations | −34.9797 | −20.5013 | −14.4784 | 0.0323 | 0.80 |
| Left foot COP backward leaning velocity for eyes-closed leaning | Left foot COP backward leaning velocity for 0.2 Hz scenery oscillations | −35.8722 | −20.8022 | −15.0700 | 0.0074 | 0.89 |
| Right foot COP backward leaning velocity for Eyes-open leaning | Right foot COP backward leaning velocity for 0.2 Hz scenery oscillations | −32.2740 | −20.1337 | −12.1403 | 0.0257 | 0.84 |
Disclaimer/Publisher’s Note: The statements, opinions and data contained in all publications are solely those of the individual author(s) and contributor(s) and not of MDPI and/or the editor(s). MDPI and/or the editor(s) disclaim responsibility for any injury to people or property resulting from any ideas, methods, instructions or products referred to in the content. |
© 2023 by the authors. Licensee MDPI, Basel, Switzerland. This article is an open access article distributed under the terms and conditions of the Creative Commons Attribution (CC BY) license (https://creativecommons.org/licenses/by/4.0/).
Share and Cite
Wodarski, P.; Gruszka, G.; Chmura, M.; Ples, M.; Gzik, M.; Jurkojć, J. Influence of Induced Environment Oscillations on Limits of Stability in Healthy Adults. Appl. Sci. 2023, 13, 10331. https://doi.org/10.3390/app131810331
Wodarski P, Gruszka G, Chmura M, Ples M, Gzik M, Jurkojć J. Influence of Induced Environment Oscillations on Limits of Stability in Healthy Adults. Applied Sciences. 2023; 13(18):10331. https://doi.org/10.3390/app131810331
Chicago/Turabian StyleWodarski, Piotr, Grzegorz Gruszka, Marta Chmura, Marek Ples, Marek Gzik, and Jacek Jurkojć. 2023. "Influence of Induced Environment Oscillations on Limits of Stability in Healthy Adults" Applied Sciences 13, no. 18: 10331. https://doi.org/10.3390/app131810331
APA StyleWodarski, P., Gruszka, G., Chmura, M., Ples, M., Gzik, M., & Jurkojć, J. (2023). Influence of Induced Environment Oscillations on Limits of Stability in Healthy Adults. Applied Sciences, 13(18), 10331. https://doi.org/10.3390/app131810331