Article

Uniaxial Testing of Soil–Cement Composites to Obtain Correlations to Be Used in Numerical Modeling

by
Małgorzata Jończyk-Szostek
1,
Piotr Kanty
1,
Jarosław Rybak
2,*,
Jakub Saloni
1 and
Karolina Trybocka
1
1
Menard Sp. z.o.o., 00-203 Warsaw, Poland
2
Faculty of Civil Engineering, Wroclaw University of Science and Technology, 50-370 Wroclaw, Poland
*
Author to whom correspondence should be addressed.
Appl. Sci. 2023, 13(18), 10268; https://doi.org/10.3390/app131810268
Submission received: 23 April 2023 / Revised: 20 August 2023 / Accepted: 6 September 2023 / Published: 13 September 2023

Abstract

:
This paper presents the results of laboratory testing of samples obtained from soil–cement composite columns produced on a real-world test site as part of a research and development project. The introduction presents the motivation of the research and the goals that guided the layout of a research program. The general geotechnical conditions, initially assumed methodology of soil–cement composite sampling, and finally, the methodology of strength tests were presented. In tests conducted with the measurement of the strain-stress path, the strength and stiffness of the material were determined in various modes of the stress–strain path, including unloading/reloading cycles. The test results were presented in the form of graphs presenting soil–cement composite stiffness in the function of material strength and subjected to a short critical discussion against the background of reference samples from composites prepared in laboratory conditions. This allowed for their qualitative and quantitative assessment and the formulation of conclusions and guidelines, concerning the execution of works and especially the potential practical outcomes (benefits for numerical modeling), juxtaposed in the summary. Some prospects and needs for future developments were also formulated on the basis of actual experience.

1. Introduction

Deep soil mixing (DSM) technologies are being widely used in foundation (civil) engineering, with a large variety of execution modes [1,2] and engineering applications [3,4]. In environmental engineering, DSM technologies are mainly applied in seepage control [5,6] and contamination immobilization and spreading prevention [7].
DSM is an in situ ground improvement technique that enhances the parameters of a weak subsoil by introducing a hydraulic binder into its structure, e.g., lime [8,9,10], cement [11,12,13,14,15,16], fly ashes [17,18,19,20], or a combination of different types of binders and activators [21,22,23]. It must be noticed here that the issue of this study is very much related to the production of backfill materials for the mining industry. Strengthening weak soils and the reuse of mining and construction waste for geotechnical works are currently widely discussed and tested. The purpose of it is to compose valuable backfill, removing harmful waste from the ground surface [24,25]. Currently, the leading soil mixing technologies are DSM columns and wet or dry mass stabilization [26,27,28]. Both wet and dry methods make it possible to mix the soil with a hydraulic binder; the difference is the way that the binder (cement, lime) is transferred into the ground. The wet method uses the slurry, and in the case of dry mixing, the binder needs the groundwater to initiate the hardening (setting) process. The problems that are still under study, due to the diversity of combinations of tested soils, binders and mixing technologies, are issues related to the final product quality control [29,30,31,32] and further applications of measured or presumed parameters in numerical studies [33,34,35,36]. At the same time, the requirement of continuous technological progress in the aspect of mixing techniques and used binders makes unconventional technologies more and more popular. The observed diversity of results, depending on soils and binders, brings the need for calibration and optimization of technology, especially when we consider the carbon footprint and the need for sustainable development. It must be underlined that the former authors’ experiences with DSM production and testing [26,28,29,30,31,32] formed the basis for the current research program. The current research directions focus on promoting sustainable development, which is understood as reducing the broadly understood carbon emissions while ensuring the required effect of soil reinforcement and reliability of the implemented design solution.
One of the core aims of this research is to show how various technological issues affect the quality of the final product (soil–cement composite), aiming to determine the most efficient and sustainable way of production using the same machine. The presented study focuses on just one aspect, meaning the possibility to estimate material stiffness on the basis of its measured compressive strength, with regard to a large variability of the obtained results.

2. The Current State of Knowledge and Basic Data on the Research Project

This article presents a broadly defined research project of deep soil mixing technology, carried out in Poland by Menard Sp. z.o.o. (Warszawa, Poland), co-financed by the Polish National Center for Research and Development under the “Operational Intelligent Development 2014–2022” program. The project “Construction and validation of an innovative system for mixing soil in many technologies” assumes the development of an innovative mobile system for deep soil mixing. In the field of innovative solutions, technological devices are being developed to increase the efficiency of works, such as a multifunctional mast mounted to an excavator, a cement truck, wet DSM performed with foldable tools, and a system for monitoring work parameters during soil mixing in the solidification technology.
The development of an innovative deep soil mixing system that breaks the barriers of technology application in more demanding conditions of the construction site is a multi-stage task that requires the work of many specialists in the fields of machine construction, mechanics, automation, geotechnics, and others. This article presents a fragment of a broad research and development process, including the following:
  • Preliminary concepts of technology modification;
  • Analysis of the possibility of hardware modifications in the field of mixing tools, hydraulic binder transport, and mobility of mixing devices;
  • Detailed research projects carried out in field conditions on a natural scale with various methods of sampling for laboratory tests;
  • Execution of DSM columns with various technological parameters monitored during the production process, with the sampling method adjusted to the assumed technology and time of probing;
  • Laboratory procedures spread over time allowing for the validation and final assessment of the modified soil parameters. The entire testing program was based on tests of uniaxial compression strength and an oedometric compressibility modulus and, to a limited extent, tests in a triaxial compression apparatus.
This paper presents a part of the research project, including the presentation of the results of the laboratory tests carried out together with the conclusions regarding the strength and deformation parameters of the strengthened soil. The focus was on geotechnical elements and quality control elements, which consisted of an extensive system recording production parameters such as the mixing time, location of the mixer, depth of the mixer, drilling pressure, rotational speed, output, and parameters of the pumped grout.

2.1. Preliminary Literature Analyses and Past Experience

Issues related to deep soil mixing in the DSM technology and, more broadly, modifications of the soil substrate by its mechanical or hydraulic (jet-grouting technology) mixing with a binding agent are currently one of the leading research topics carried out on a global scale. Most research projects, however, focus on local aspects of technology, such as the selection of a binder for the type of substrate at the research site (e.g., in loess common in China, or in an organic substrate common in coastal areas and river valleys).
The MENARD company has been conducting research and development works related to deep soil mixing technologies for many years. The experience so far has been based on extended quality control programs on contracts using DSM columns or various dry or wet solidification methods. Such research allows for the accumulation of a knowledge and experience base, but they usually have a limited scope and, due to the diversity of geotechnical conditions, do not allow for drawing more general conclusions, not to mention formulating precise guidelines for the implementation of subsequent investment tasks. The present research and development program made it possible to plan research in “typical” conditions of DSM application.

2.2. Geotechnical Conditions at the Site of the Test Columns

The choice of the test site where the test columns were carried out was not accidental. The main drawback of deep mixing technology is the risk of obtaining a composite with low strength and stiffness. Such a risk occurs especially when cohesive (fine-grained) soils containing organic parts (i.e., silts) or peats are mixed. In the location in question, to a depth of approx. 6 m, there are clays and silts in various states (from low plasticity to high plasticity). A typical section is given in Figure 1, taken from a geological survey [37]. The weak layer of peat/organic soil marked red is situated 4–5 m below the ground surface (working platform). Detailed laboratory tests confirmed the content of organic components in the layers defined as silt and silty clays. The fine sands lying below 6 m are in a medium-density state, and despite possible contamination with organic parts in the top part, they are soils with better geotechnical parameters and do not carry the risk of significant settlements under load.
Basic data about the soils that were subject to improvement by means of various soil mixing techniques are juxtaposed in Table 1. It should be emphasized that the site geotechnical investigation was performed in an unconventional scope for tests carried out for typical construction investments. Apart from drilled boreholes and static soundings (CPT), the soil samples were collected, which were then subjected to oedometric tests. The content of organic matter in samples from various depths was determined, and the effective values of the angle of internal friction and cohesion in the direct shear apparatus were determined.
Oedometric tests were then planned for the composite obtained in the process of deep mixing, which allowed us to estimate the scale of the ground improvement. Also, the effective geotechnical parameters (angle of internal friction and cohesion) of the composite were planned and are currently performed to be determined in tests in the triaxial compression apparatus.

2.3. Implementation of Test Columns

The research program aims to build and test an innovative device for making soil–cement columns. Modifications (calibration) of the method of making the columns are also aimed at the selection of appropriate operational parameters, such as the selection of the density of the injected cement slurry, the applied injection pressure, and the process of feeding the hydraulic binder to the substrate, considering the mixing efficiency. Another important element of the implementation of the test columns was the selection of a hydraulic binder that met the criteria of sustainable development to the maximum extent while guaranteeing the target material parameters of the composite obtained. Through preliminary analyses, it was decided to choose the cement of multi-component Portland cement CEM II B-V with the addition of by-products from coal combustion in the power industry. The choice was determined by the fact that silica fly ashes, which are in fact processed post-production waste, are a significant addition to this cement. As part of recycling, they are reused in the technological process of manufacturing the cement.
The following devices were used on the test plot:
-
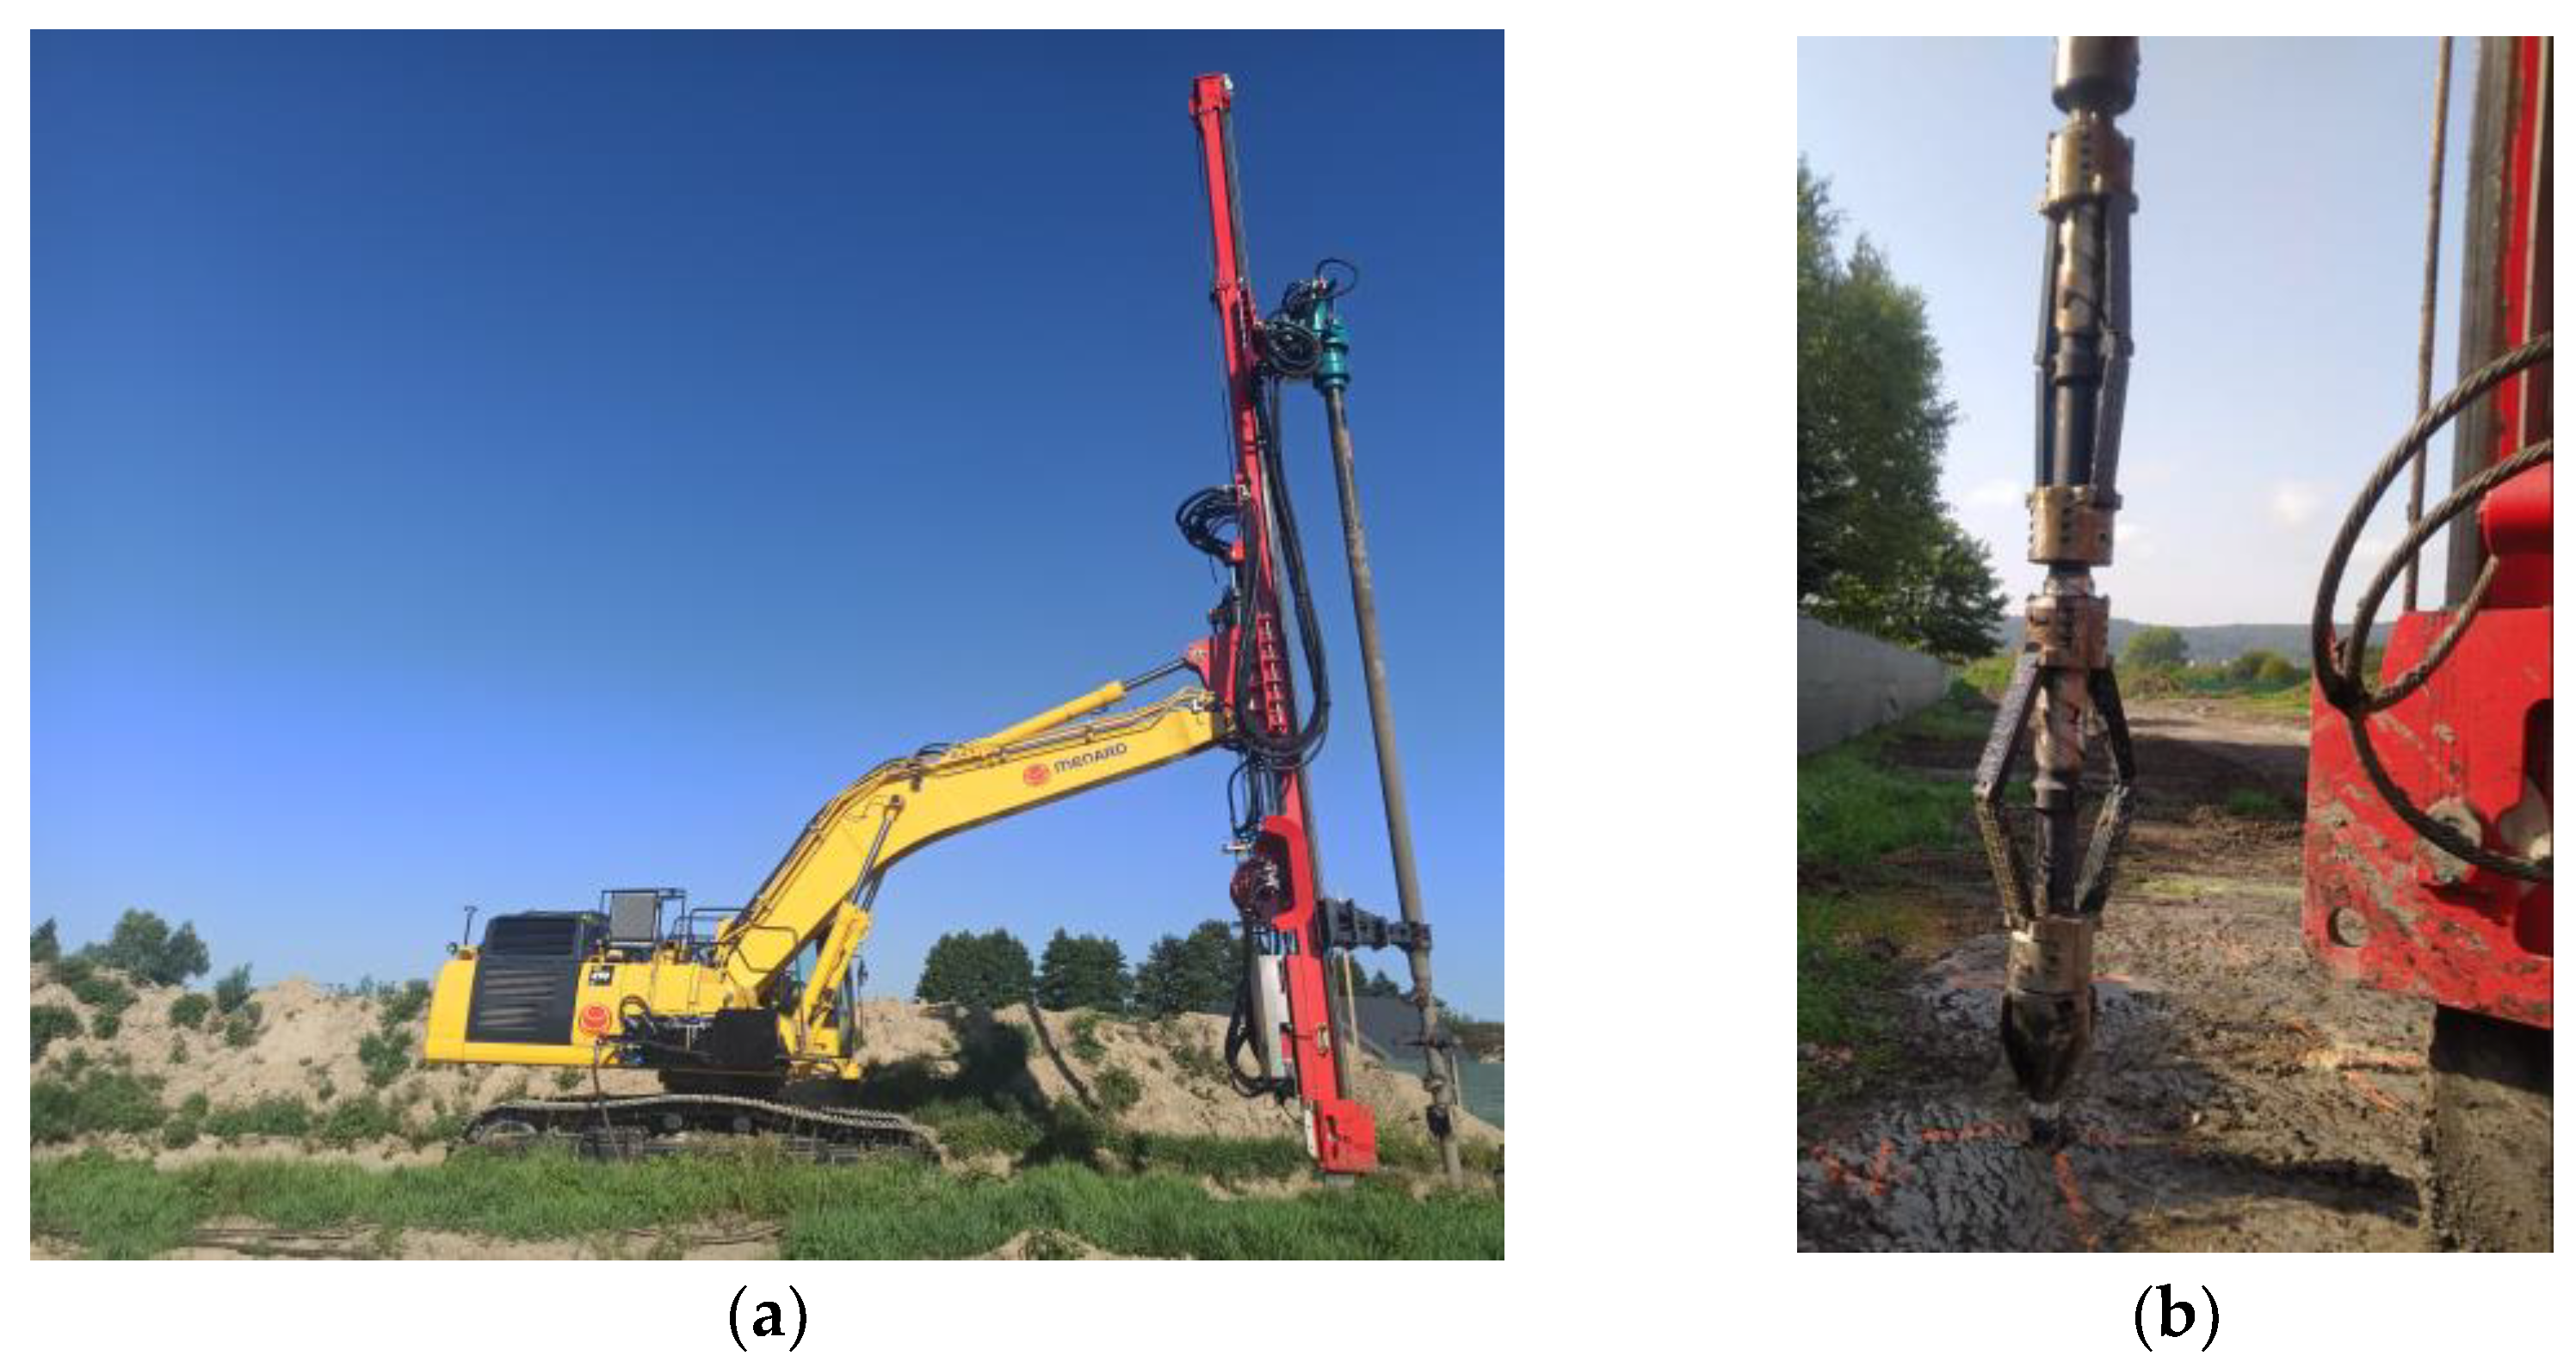
Crawler excavator (yellow color—see Figure 2a).
-
Multifunctional SPD mast (red color—see Figure 2b).
-
Various mixing devices: DSM dry, standard wet DSM (Figure 2a), foldable tool for DMS wet (Figure 2b), and soil stabilization.
DSM columns were successfully installed at a depth of 6 m using various construction methodologies presented above. The foldable tool has been patented since 2021. Further considerations are focused on the effects of the work performed, focusing attention on the quality of soil–cement composite measured in terms of compressive strength and stiffness achieved for various modes of composite production, e.g., rotation speed, mixing cycles, and grout density and pressure, with one constant value of cement amount for every cubic meter of soil–cement composite. Such a procedure made it possible to evaluate the impact of production technology on practically uniform composites (in terms of their composition—soil/water/cement).

2.4. Methods of Preparing Samples for Laboratory Tests

The preparation of standard samples from test mixes in laboratory conditions consists of mechanical mixing of the soil collected in successive layers of the substrate with a hydraulic binder and mixing water (prepared in the lab using a standard concrete mixer). In the present case, the depth was divided into two ranges (up to 2 m and in the 2–6 m layer), differing essentially in the content of organic parts, which significantly affects the quality of the obtained composite. Exemplary samples taken from the “weaker” layer are shown in Figure 3.
The samples have a similar shape (cubes 15 × 15 × 15 cm3) and surface roughness; however, they were produced using different variants of the mixing technology. Figure 3 on the left shows three samples of composite formed from the original ground and injected cement slurry. The samples shown in Figure 3 on the right were mixed with an additional assist with air stream to obtain better homogenization.
The choice of the method of collecting soil–cement samples from the formed columns is important for the representativeness of the research. In field conditions, during the execution of contracts, the collection of material for testing is usually carried out from the ground level by collecting the so-called “spoils”, i.e., the excess excavated material pushed out during the injection of the substrate, and mixing the cement slurry with the soil. Proper wet sampling can also be collected at depth using a special sampler. Wet sampling in fresh columns and coring of cured DSM columns are commonly used to verify strength and permeability.
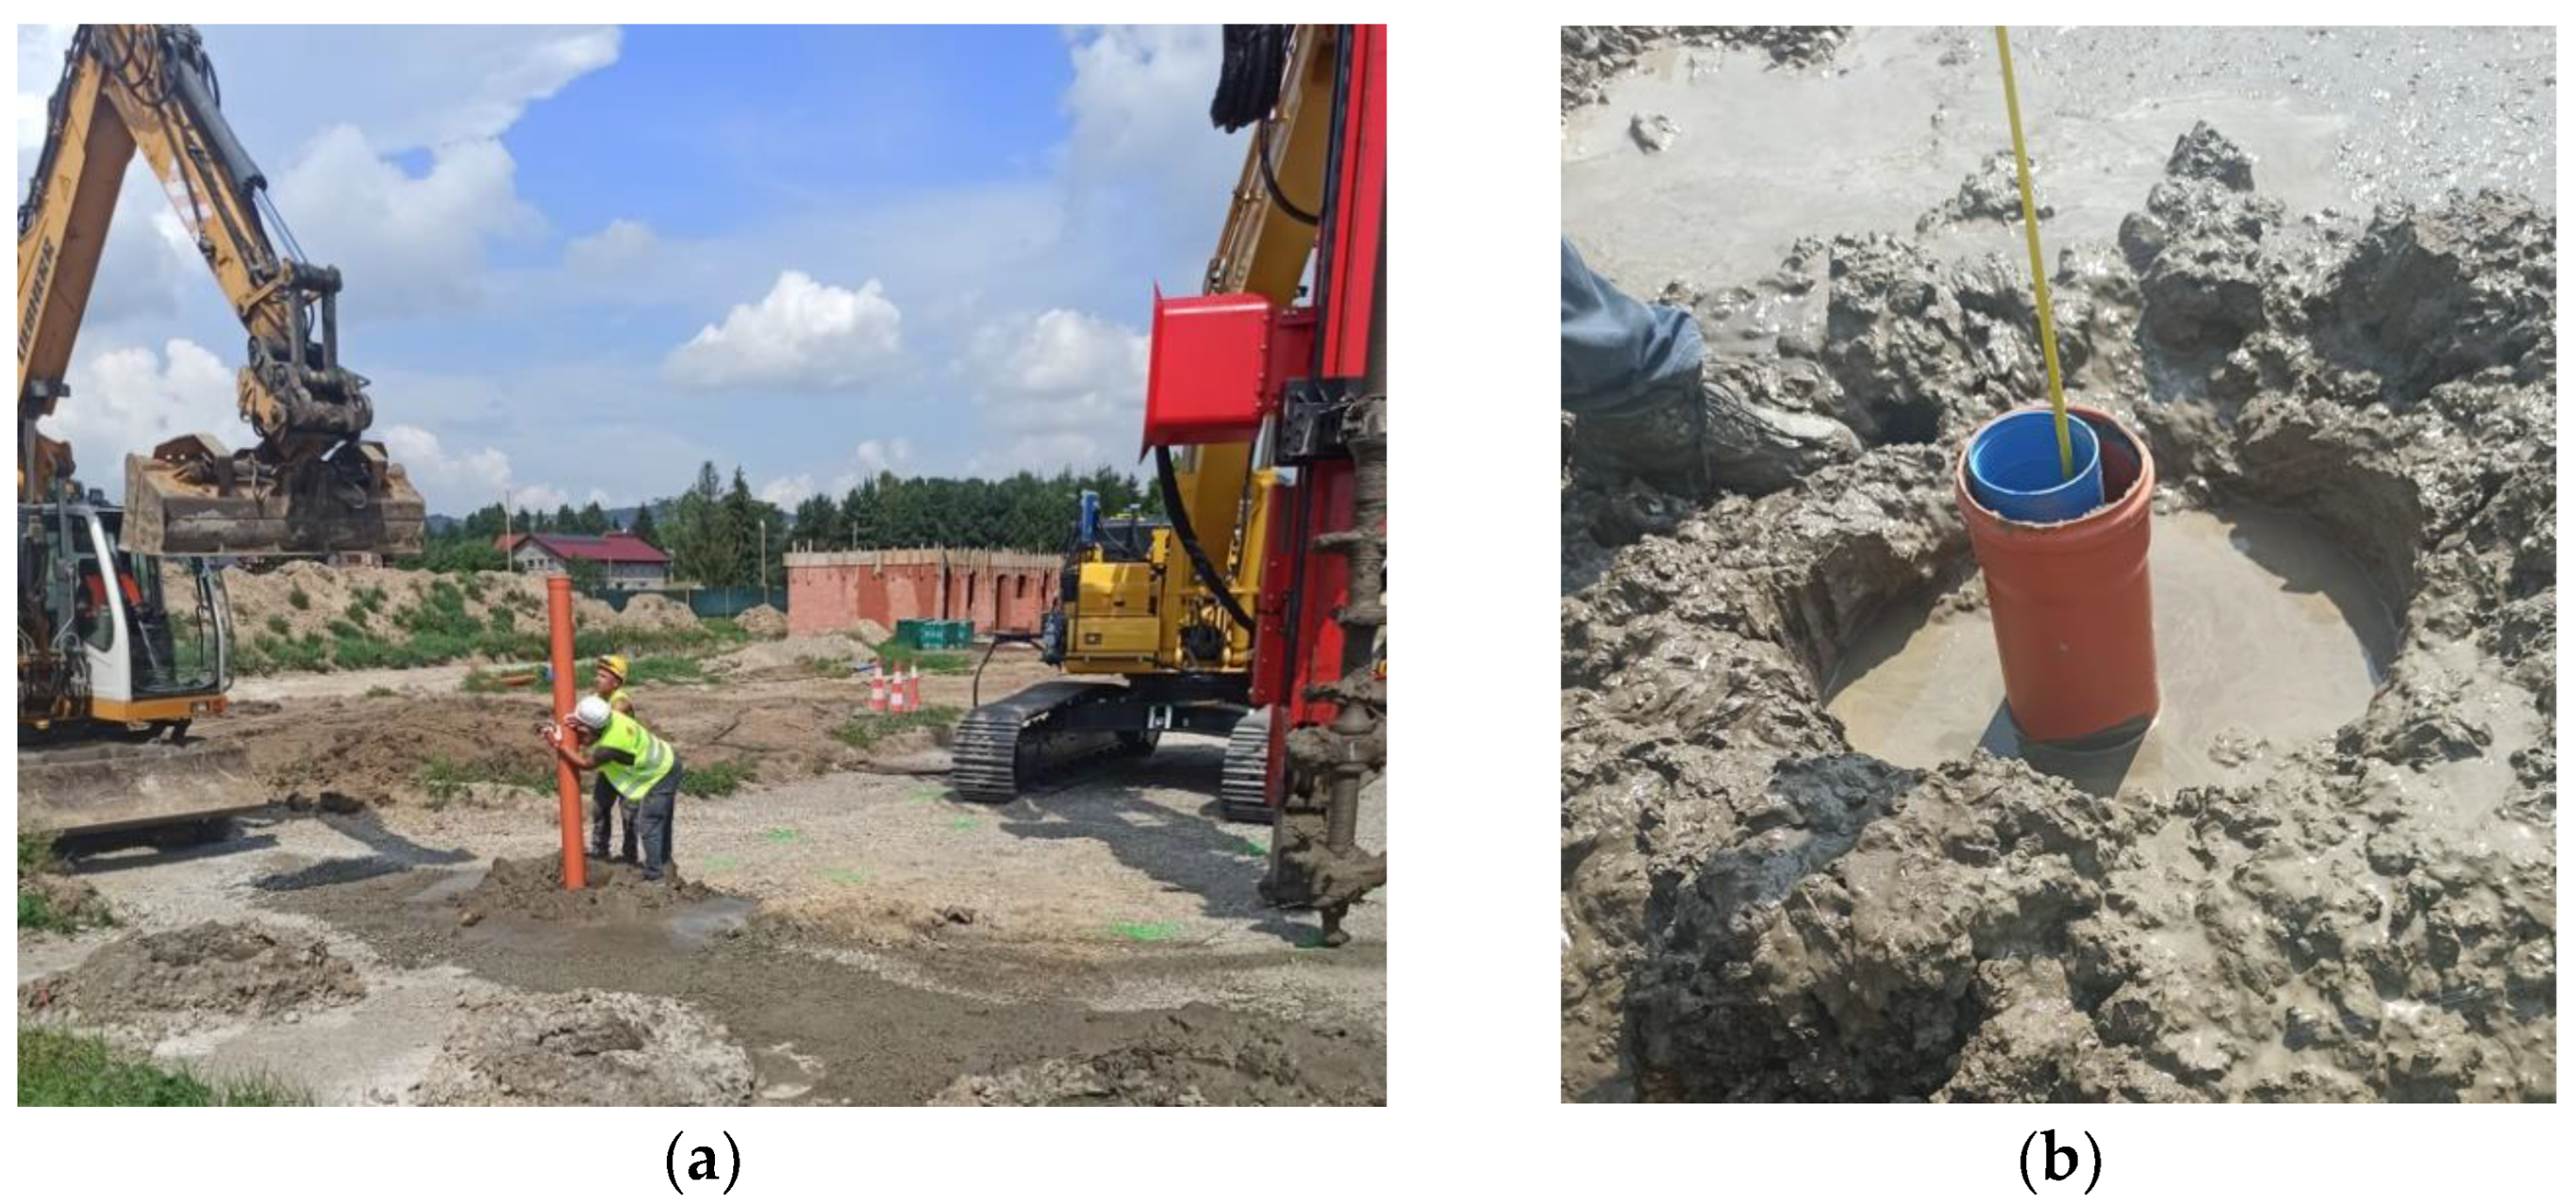
Initial considerations aimed at maximizing the objectivity of the obtained results indicated the need to collect cylindrical samples of appropriate slenderness (H/D = 2) obtained from the entire profile of the column using the “pipe in pipe” method, i.e., by embedding a PVC pipe in the fresh material of the column (after cycles of injection and mixing but before the soil–cement composite hardens). An example of such a continuous core in a PVC pipe is shown in Figure 4.
Optionally, the possibility of a full-cored borehole of DSM columns was allowed after the composite obtained the required strength, allowing for continuous cores (28 days). Example cores are shown in Figure 5 and Figure 6. It is worth noting that where thorough mixing with the binder has not taken place, there is no possibility of taking the core. Cores from well-mixed columns are also fractured, but these fractures are due to dynamic influences during drilling. With a strength below 1 MPa, even a minimal movement of the tool can cause the core to break (Figure 5a). It is worth mentioning that the entire columns could be extracted from the ground without losing their integrity (Figure 5b).

2.5. Laboratory Procedures Used to Test the Composite

The laboratory tests included three types of tests: uniaxial compression of cubic (15 × 15 × 15 cm3) and cylindrical samples in a testing machine, oedometer tests, and triaxial tests. This study focuses on the results of the uniaxial strength tests of composites. Compression tests were carried out for various modifications to the column construction technology. These results were referred to as tests of test batches prepared in the laboratory regime. Such a combination of tests, apart from the advantages of quantitative analysis, allows for the development of guidelines for the design of columns based on test batches with the required safety factor for the material of the columns.

3. Methodology of Laboratory Tests

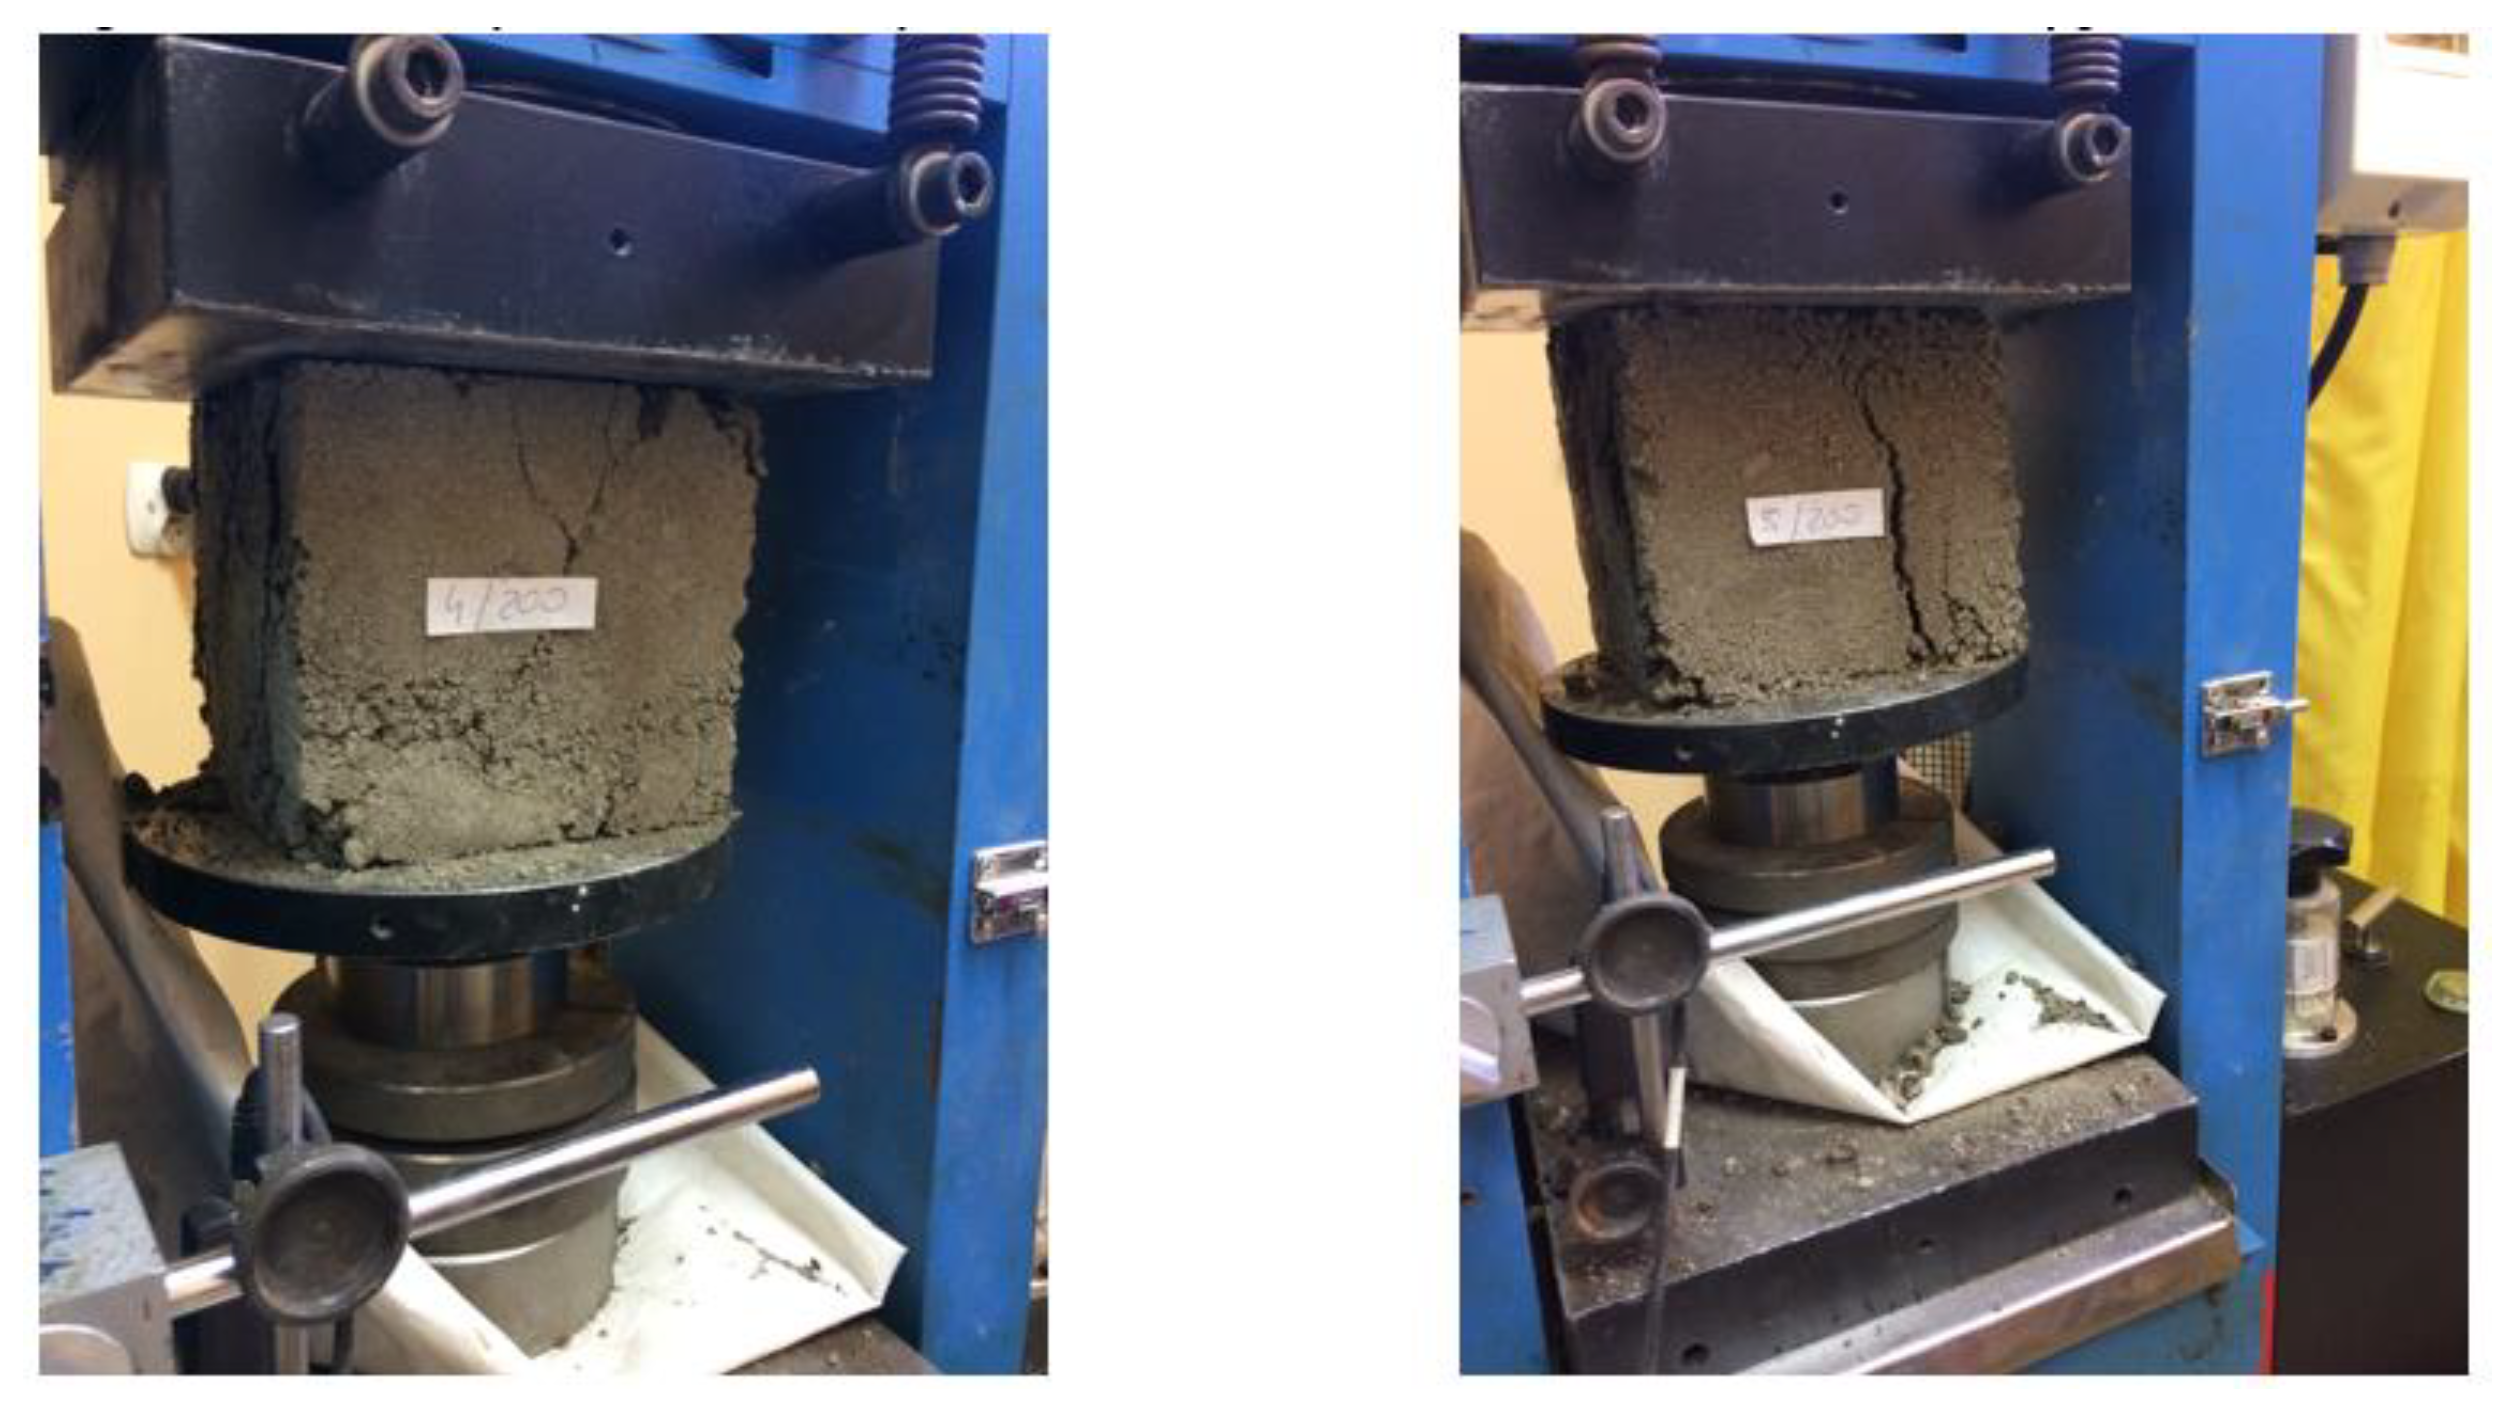
All test results given in the following sections come from the certified laboratory that prepared a “test report” [38] and were based on the methodology of [39] and code [40]. For the purpose of this article, the results of the tests in uniaxial compression with recording of the stress path will be presented, which determine the compressive strength, stiffness measured by the modulus of deformation (in the original laboratory procedure), and the measurement of deformation at failure (see Figure 6). Such a definition of the subject of research is particularly useful when parameters are needed to build a numerical model of a reinforced subsoil (e.g., in currently widely used programs of the finite element method FEM [33,34,35]). It should be emphasized that the currently conducted research is an extension of earlier research projects, and the research techniques used were also selected in terms of the possibility of discussing the results obtained in light of research that has already been completed.

3.1. General Comments on the Methods of Sample Preparation and Collection

Samples from test laboratory-prepared batches are characterized by the highest possible degree of mixing, and based on previous experience, it can be concluded that the test results of samples prepared in this way constitute the “upper estimate” of parameters that are obtainable in field conditions.
It should be noted that the “pipe in pipe” method for taking shaft samples directly from the column, despite its apparent attractiveness and proven reliability in the case of composites, including mainly granular soils, turned out to be unreliable in the geotechnical conditions at the actual test site. In some cases, the composite did not fill the height (length) of the pipe, probably due to the difficulties in driving and pulling PVC pipes and possible partial plug in the inner pipe. Consequently, a majority of the tested samples were obtained with this method. “Missing” samples were extracted from the finished columns by core drilling. The method of core drilling also has a major disadvantage consisting of the numerous damages and cracks of the cores presented earlier. Paradoxically, the tests are performed on those parts of the cores that are not cracked and can be cut to the required height. Under contractual conditions, this could raise reservations about the supervision because such fragments obviously have better strength than those that are broken in the drilling process. However, it should be remembered that the diameters of the columns are usually an order of magnitude larger (10 times wider) than the diameter of the drilled cores, and small inclusions constituting a significant defect within the core with a diameter of 10 cm do not determine the strength of a column with a diameter of several dozen centimeters (sometimes over 1 m).
In the following sections, the results of the tests in terms of the setting time, amount of binder, mixing method, and injection parameters will be presented. The presented results are credible and possible to conclude and analyze because the samples were collected in a similar (equally imperfect) way.

3.2. Compression in a Testing Machine

Testing of soil–cement composites requires some corrections and modifications in relation to the prepared standard procedures that are commonly used for testing concrete. Due to the much lower strength (especially when cohesive and/or organic soil is considered) and achieving maximum strength with much greater deformations, higher compression rates can be used. To a greater extent, the determined modulus of deformation is also influenced by the “laying error”, i.e., the so-called “bedding error”, which can be eliminated by precompressing the sample with a predetermined stress range. However, such a procedure is troublesome when it is not known what strength to expect. It seems very reasonable to determine the strain modulus as the slope of the strain–load relationship in the range around half the strength of the sample. In the tests conducted in the AGH laboratories, a range of 0.30–0.70 Rc was used (where Rc is just the compressive stress capacity of the sample), similar to the ranges used in earlier research projects by MENARD carried out in cooperation with the Wroclaw University of Technology. Exemplary pictures of samples in a testing machine (WrUST laboratory) are shown in Figure 6 [36].

3.3. Testing of Cylindrical Samples

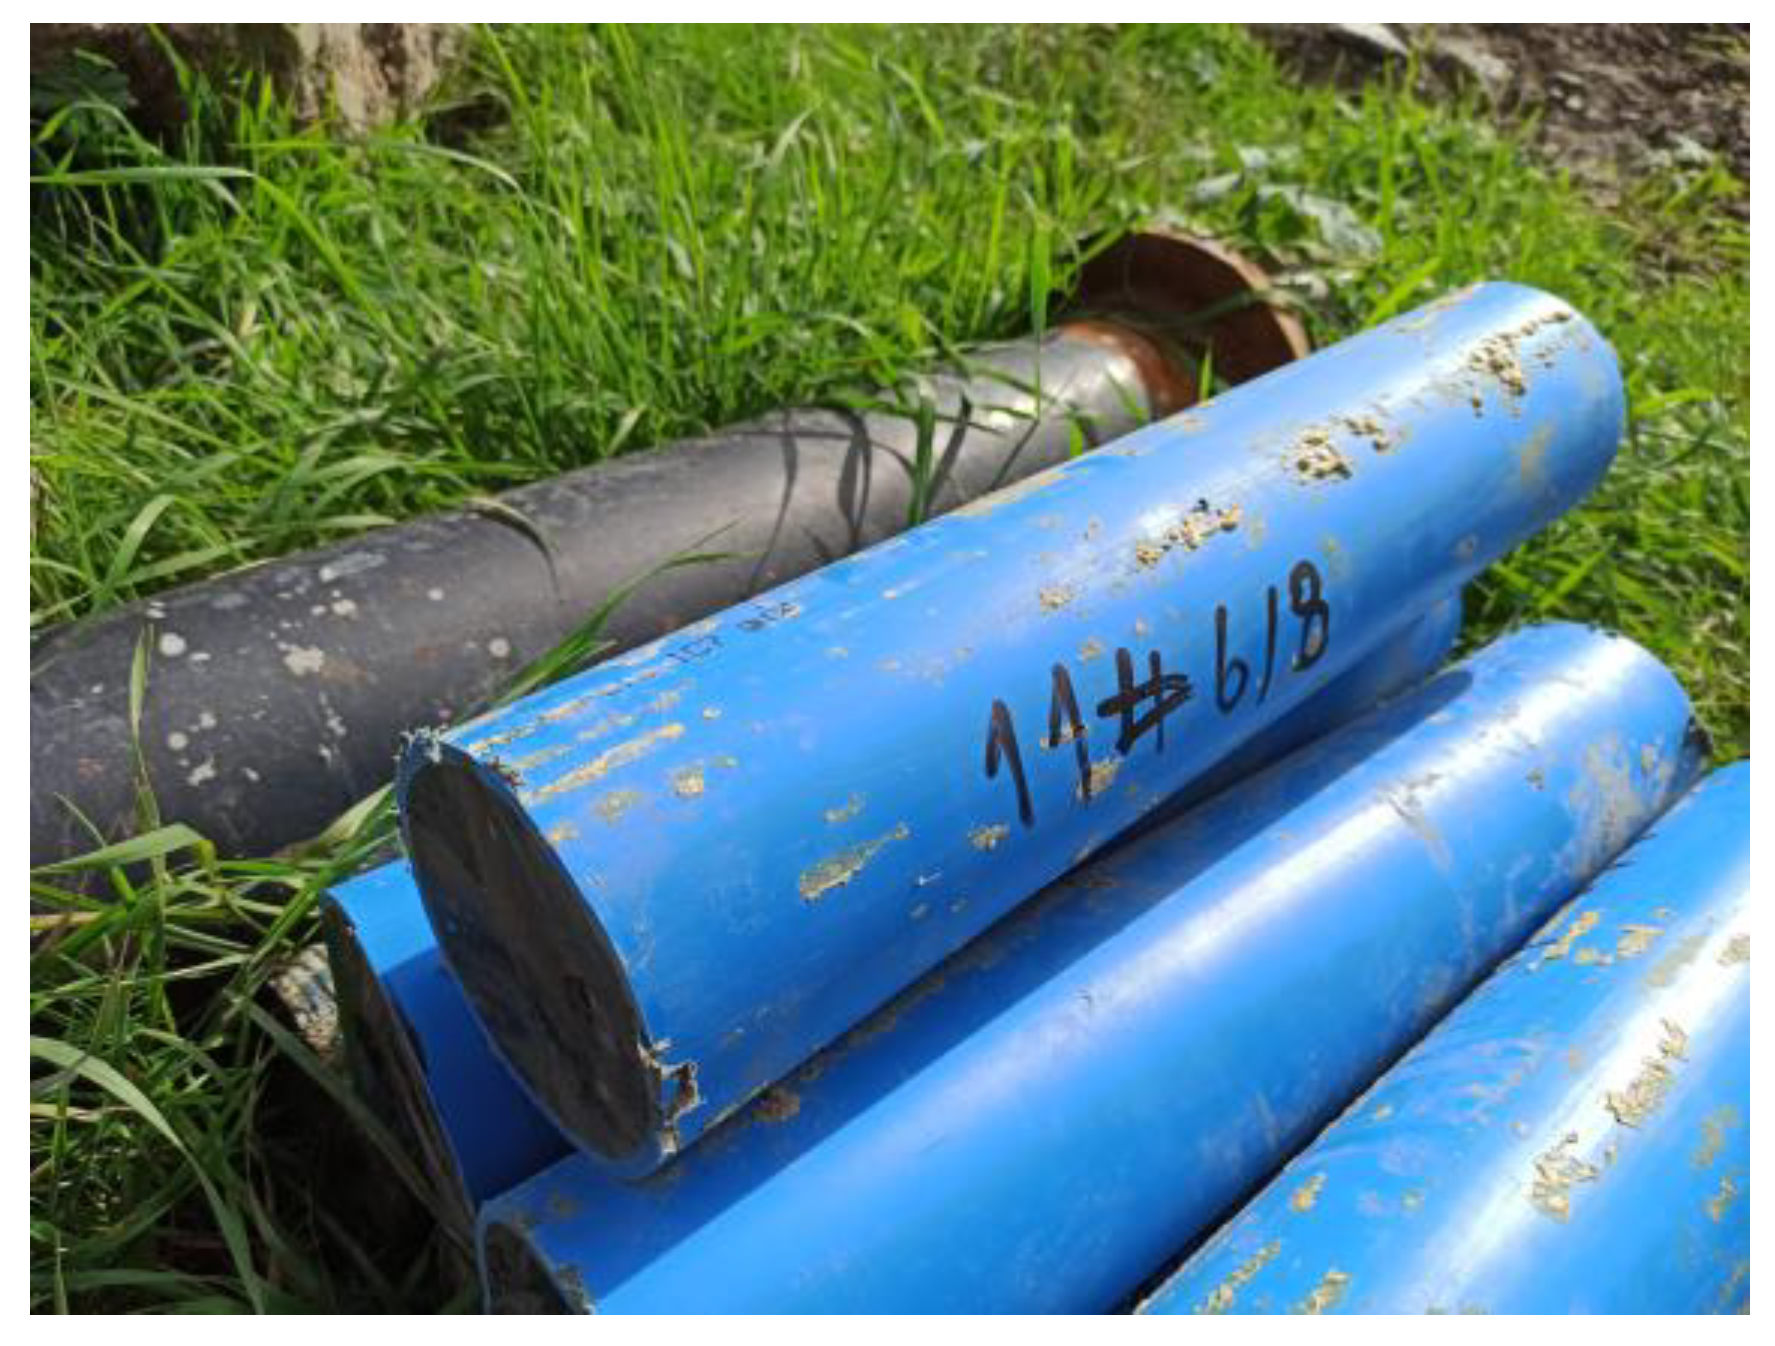
Cylindrical samples with a diameter of approx. 10 cm were planned to be obtained by the “pipe in pipe” method and from core boreholes (see Figure 7). As mentioned earlier, the specificity of the samples taken from the DSM columns consists of the need to select and test continuous fragments of the core. Basically, samples with an assumed slenderness were tested. If the samples were lower than required, appropriate conversion factors for the determined strength of the material were used.

3.4. Cubic Sample Testing (Laboratory Prepared)

The choice of the method of collecting soil and cement samples from the formed columns is important for the representativeness of the research. In field conditions, during the execution of contracts, the collection of material for testing is usually carried out from the ground level by collecting the so-called “spoils”, i.e., excess excavated material pushed out during the injection of the substrate and mixing the cement slurry with the soil. The samples collected in this way, usually in the form of cubic cubes, have an excess amount of cement slurry in relation to the native soil and manifest better quality than expected average value in the column. In most of the cases, provided proper curing conditions, they can be considered “upper bound” samples.

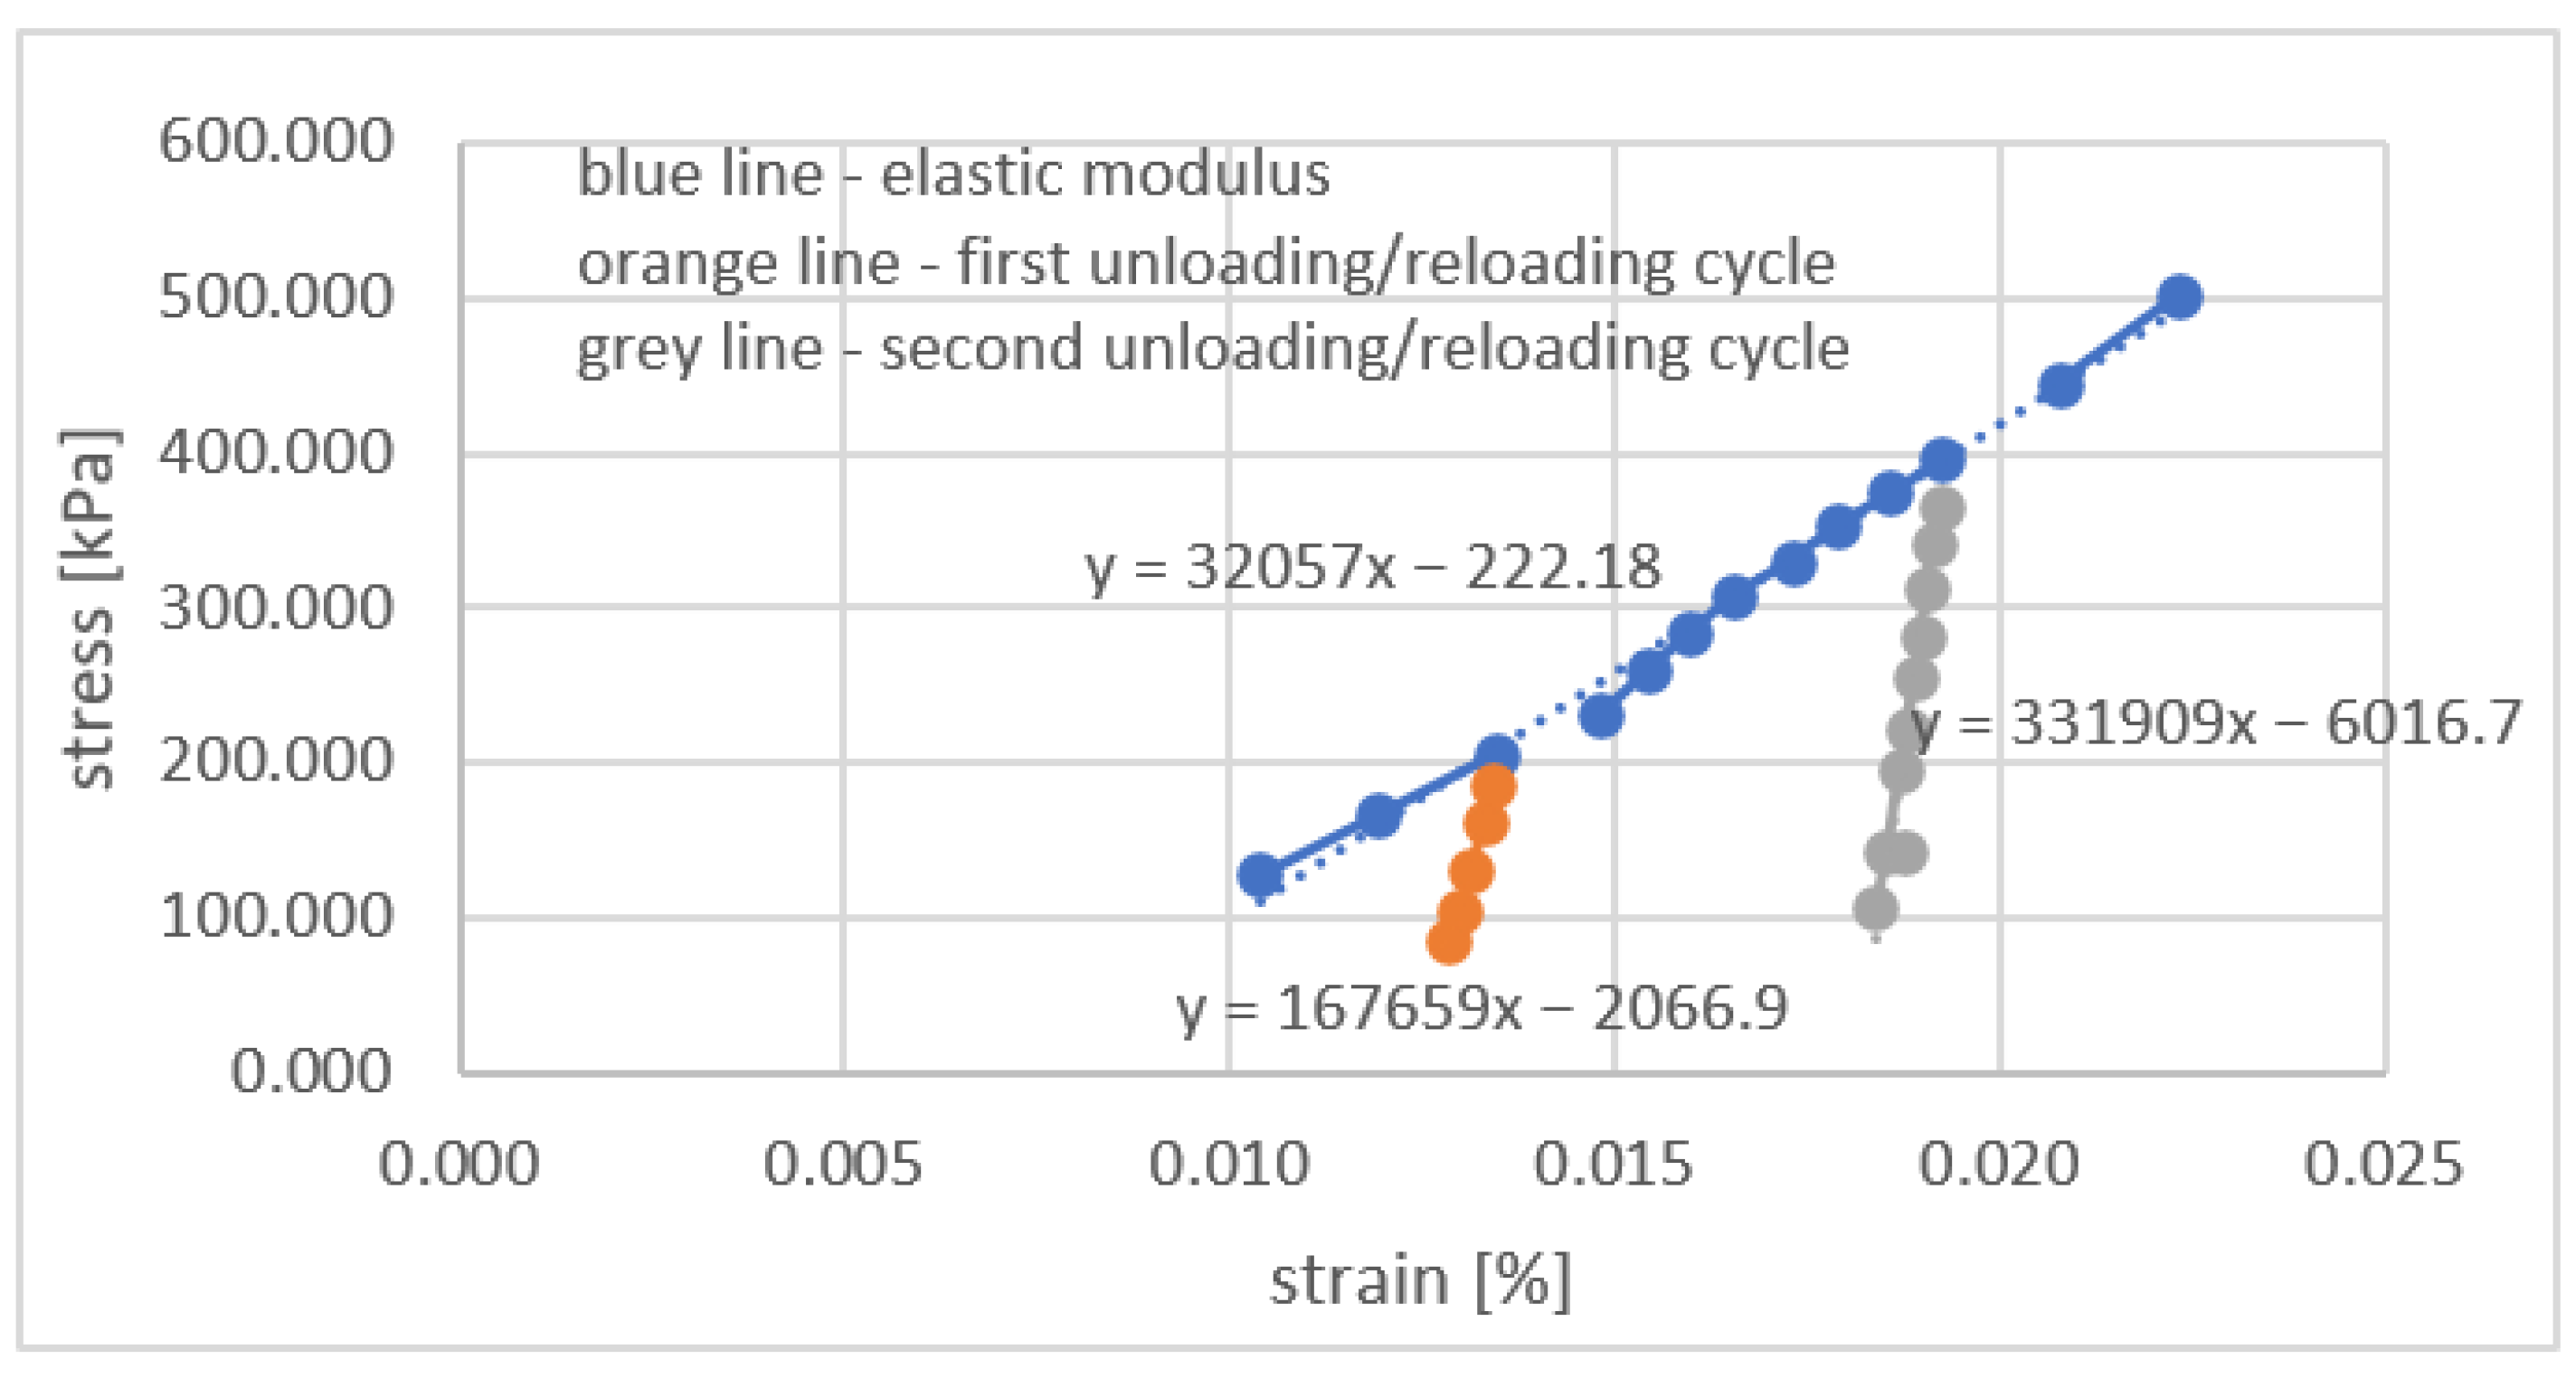
3.5. Unloading/Reloading Procedures Derive Material Stiffness in Cycling Loading

Maintained load test in laboratory conditions makes it possible to control several unloading/reloading cycles. Elastic modulus may be derived from the stress–strain curve. In the test, two procedures were applied, depending on the number of unloading/reloading cycles. If the sample was unloaded/reloaded only once, the cycle was scheduled at 50% of expected compressive strength. If the procedure had to be repeated twice, the unloading was scheduled at 33% and 66% of the estimated compressive strength. Such a procedure is presented in Figure 8.
One may observe a very significant increase in material stiffness in the first unloading/reloading cycle and a further increase in the second cycle. That information, if quantified, may be crucial for more sophisticated constitutive models of soil–cement composites [41,42], especially, when we deal with cyclic loading in the infrastructural engineering [43,44]. Even for the simplest elastic model of composites loaded at the erection phase of the building structure, it is worth knowing what the subgrade stiffness is.

4. Laboratory Test Results and Discussion of the Obtained Results

For the purpose of this article, the results of the tests in uniaxial compression will be presented below. The compressive strength for cement–soils was determined in accordance with the EN ISO 17892-7:2018 Geotechnical investigation and testing—Laboratory testing of soil—Part 7: Unconfined compression test (ISO 17892-7:2017) [40]. A hydraulic press with an automatic registration of force and displacements was used to test the uniaxial compressive strength. The speed of the plates of the strength press was 0.6 mm of axial displacement per minute (the testing time for one sample was from 5 to 15 min).

4.1. Testing of Laboratory Made Samples

Reference samples for testing the uniaxial compressive strength of cement–soils were made in four variants. These variants were differentiated by the type of soil used and the density of the cement slurry. Basic information about the combinations (compositions) of soil–cement composites that were prepared as references in the lab is given below:
  • Type I—soil taken from a depth of 1–3 m + cement grout (1500 kg/m3).
  • Type II—soil taken from a depth of 3–6 m + cement grout (1500 kg/m3).
  • Type III—soil taken from a depth of 1–3 m + cement grout (1400 kg/m3).
  • Type IV—soil taken from a depth of 1–3 m + cement grout (1400 kg/m3).
As the target amount of cement in 1.0 m3 of the composite in all testing procedures was fixed at 250 kg, the proposed receipt just meant 330 L and 405 L of cement’s slurry to be pumped for each 1 m3 of the composite, for a target 1500/1400 kg of every 1.0 m3 of grout, respectively. In addition, tests for reference samples were performed depending on the time of their preparation, i.e., after 3, 7, 14, 28, and 56 days. The averaged results of the reference tests of Type I are given in Table 2 below.
Every result juxtaposed in the table above is an average of four results from four tested samples. The results are not surprising because one could expect a reduction in density (due to drying), an increase in compressive strength and elastic modulus, and a probable decrease in the critical deformation (which usually corresponds to increasing stiffness). Generally, these results prove the former authors’ experiences [30,32] and the information provided in the literature [13,17,24]. This preliminary part of the research program also confirmed that in the case of non-standard soil–cement, the time of testing may be a crucial factor in the proper evaluation of the long-term parameters of the tested material [29,31]. Simply referring to codes designed for concrete composites and limiting the curing time to last 28 days may lead to highly inaccurate conclusions (despite proper results).
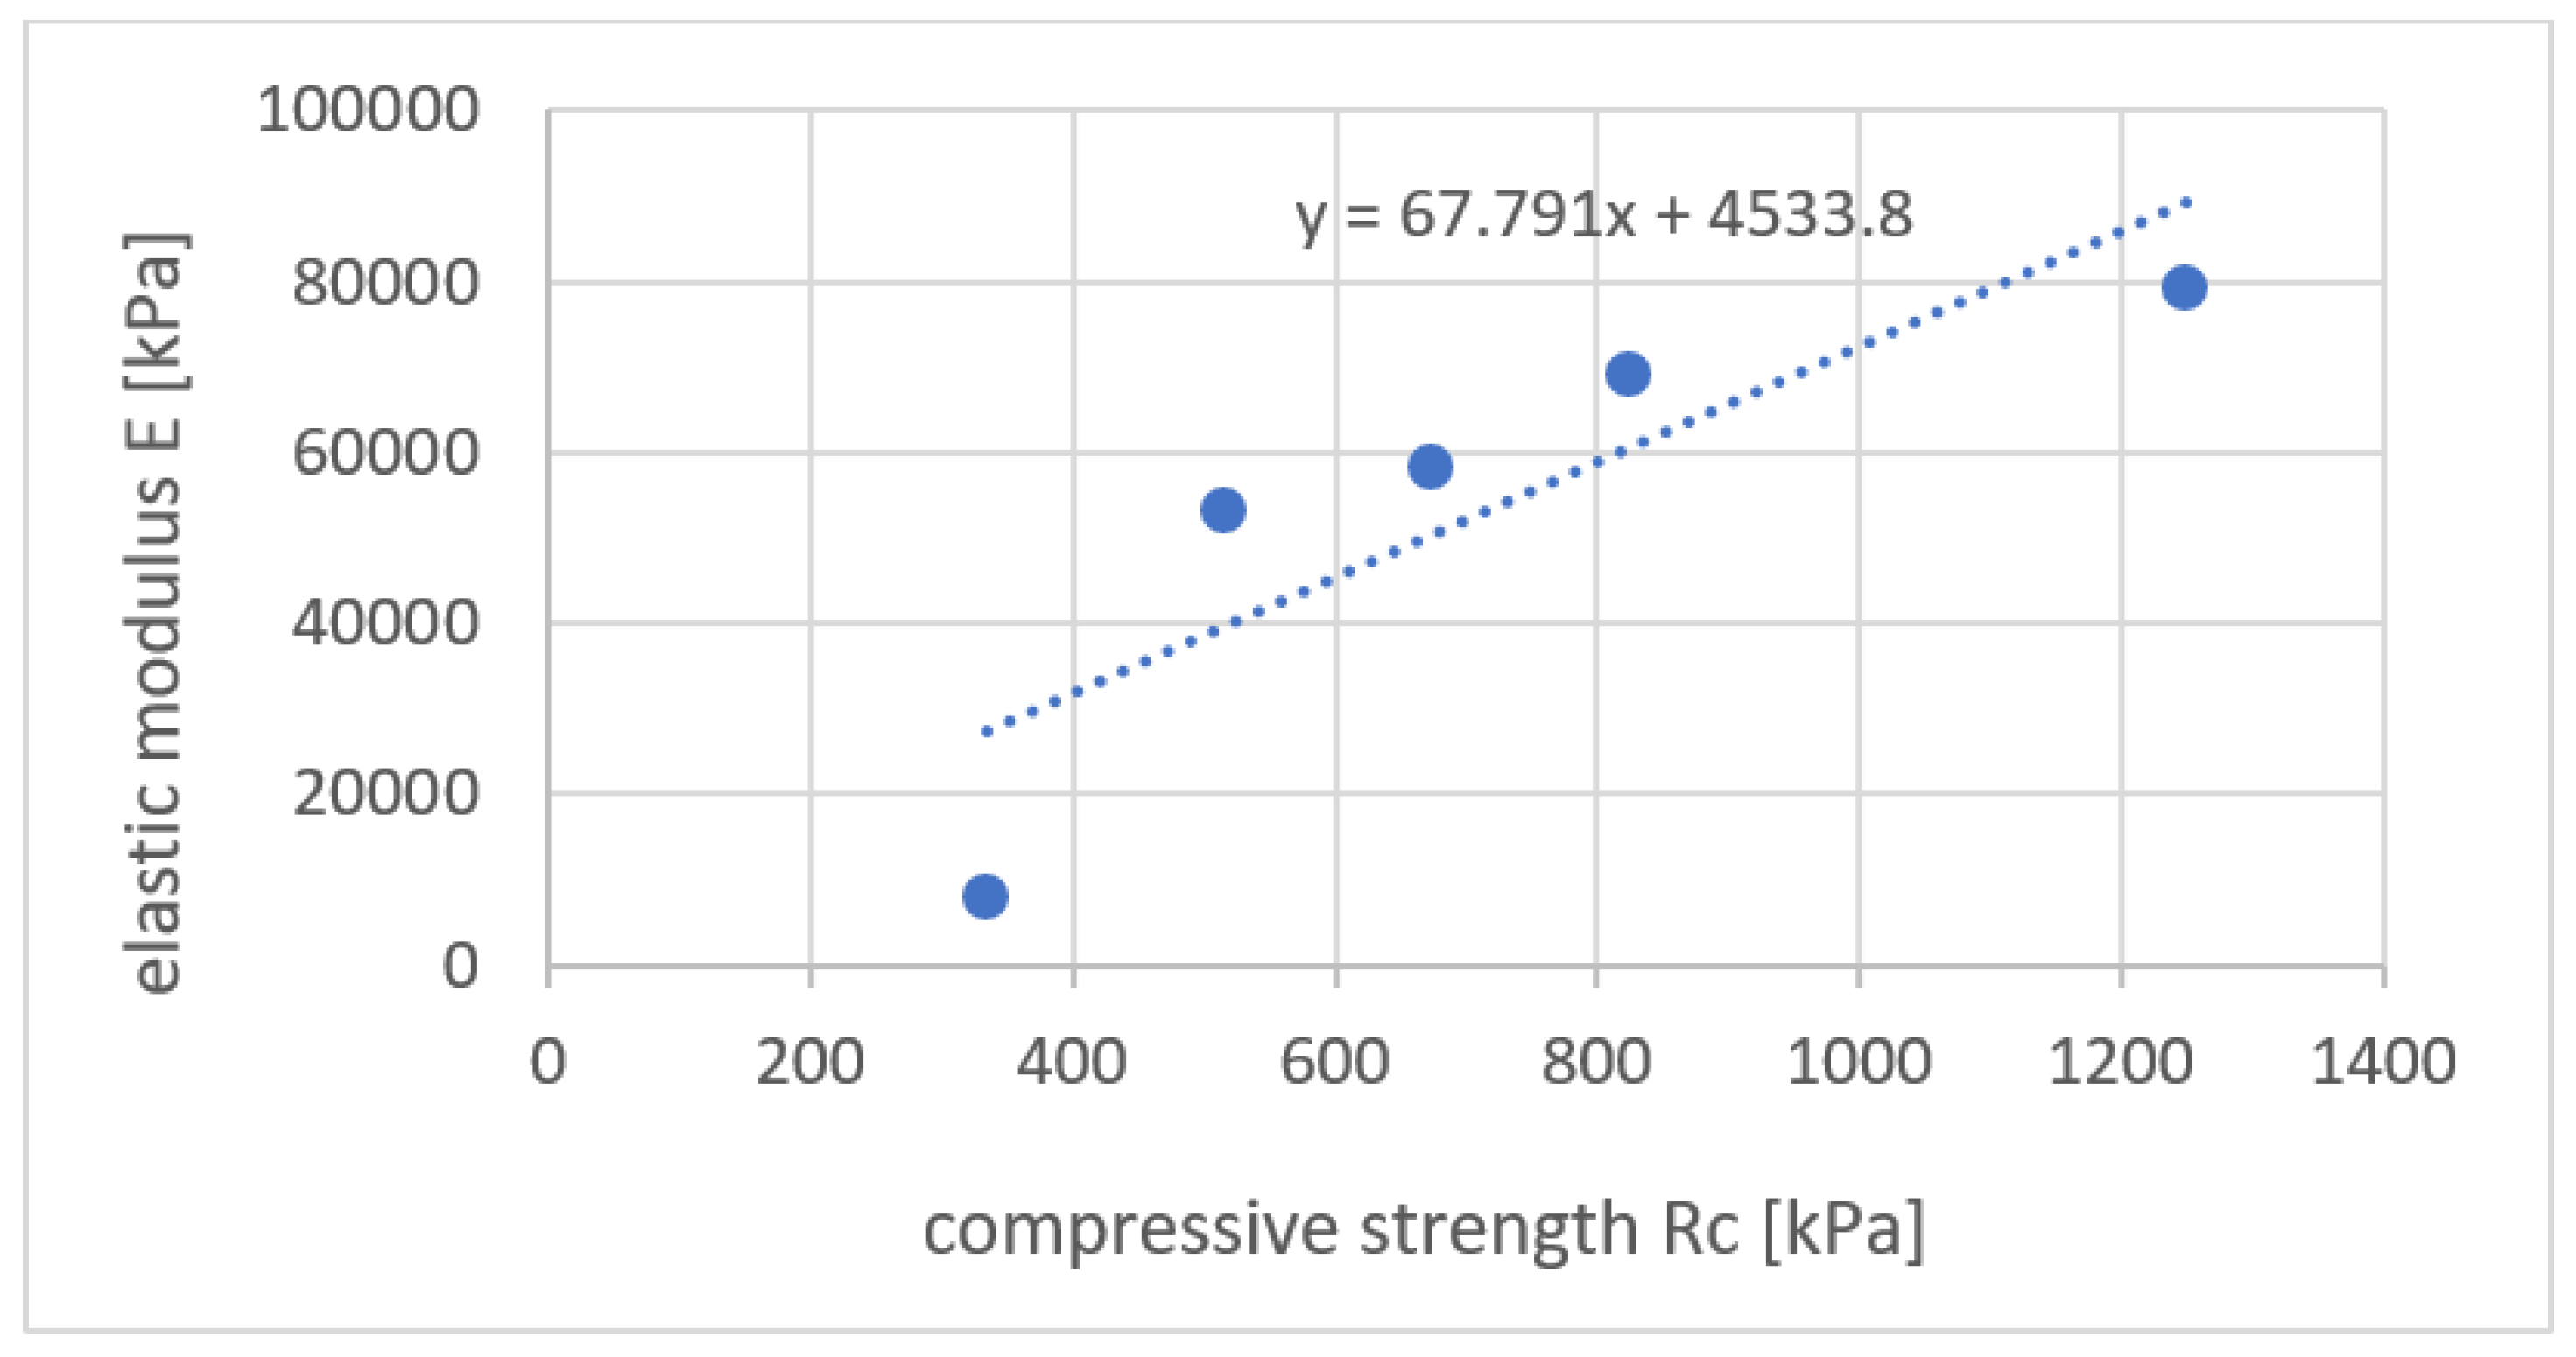
Referring again to the previous authors’ experiences, it is important to check the dependency between the elastic modulus and the compressive strength of the material (see Figure 9). This information is crucial for the numerical modeling of soil–cement composites in the absence of proper stiffness testing (which is unfortunately a common practice in the construction industry). From the results given in Figure 8, we may derive the simplest linear function describing this relationship:
E = 68 × Rc + 4.53 [MPa],
For the proceeding types (Type II, Type III, and Type IV), the results are given in Table 3, Table 4 and Table 5, respectively, together with the stiffness–strength relationships given in Formulas (2)–(4).
E = 135 × Rc i 22.02 [MPa],
E = 8 × Rc + 5.69 [MPa],
E = 118 × Rc − 2.03 [MPa],
It must be underlined again that the presented values are the averaged values from four samples tested within each time period. So, one may suspect some clearly visible trends. The trends indeed confirm common sense and engineering judgement, but the large number of outliers (not filtered) bring some unexpected results. The authors of the study could remove the results that do not fit the theory, but it seems that caution about possible discrepancies is a bigger value (considering soil–cement composites and their reliability) than just confirming well-known facts, especially when we understand that laboratory-made samples were mixed in a more controlled way than the material in the “in situ”-produced column. That is why laboratory production and testing of trial composites are believed to deliver “upper bound” results in compressive strength and elastic modulus.
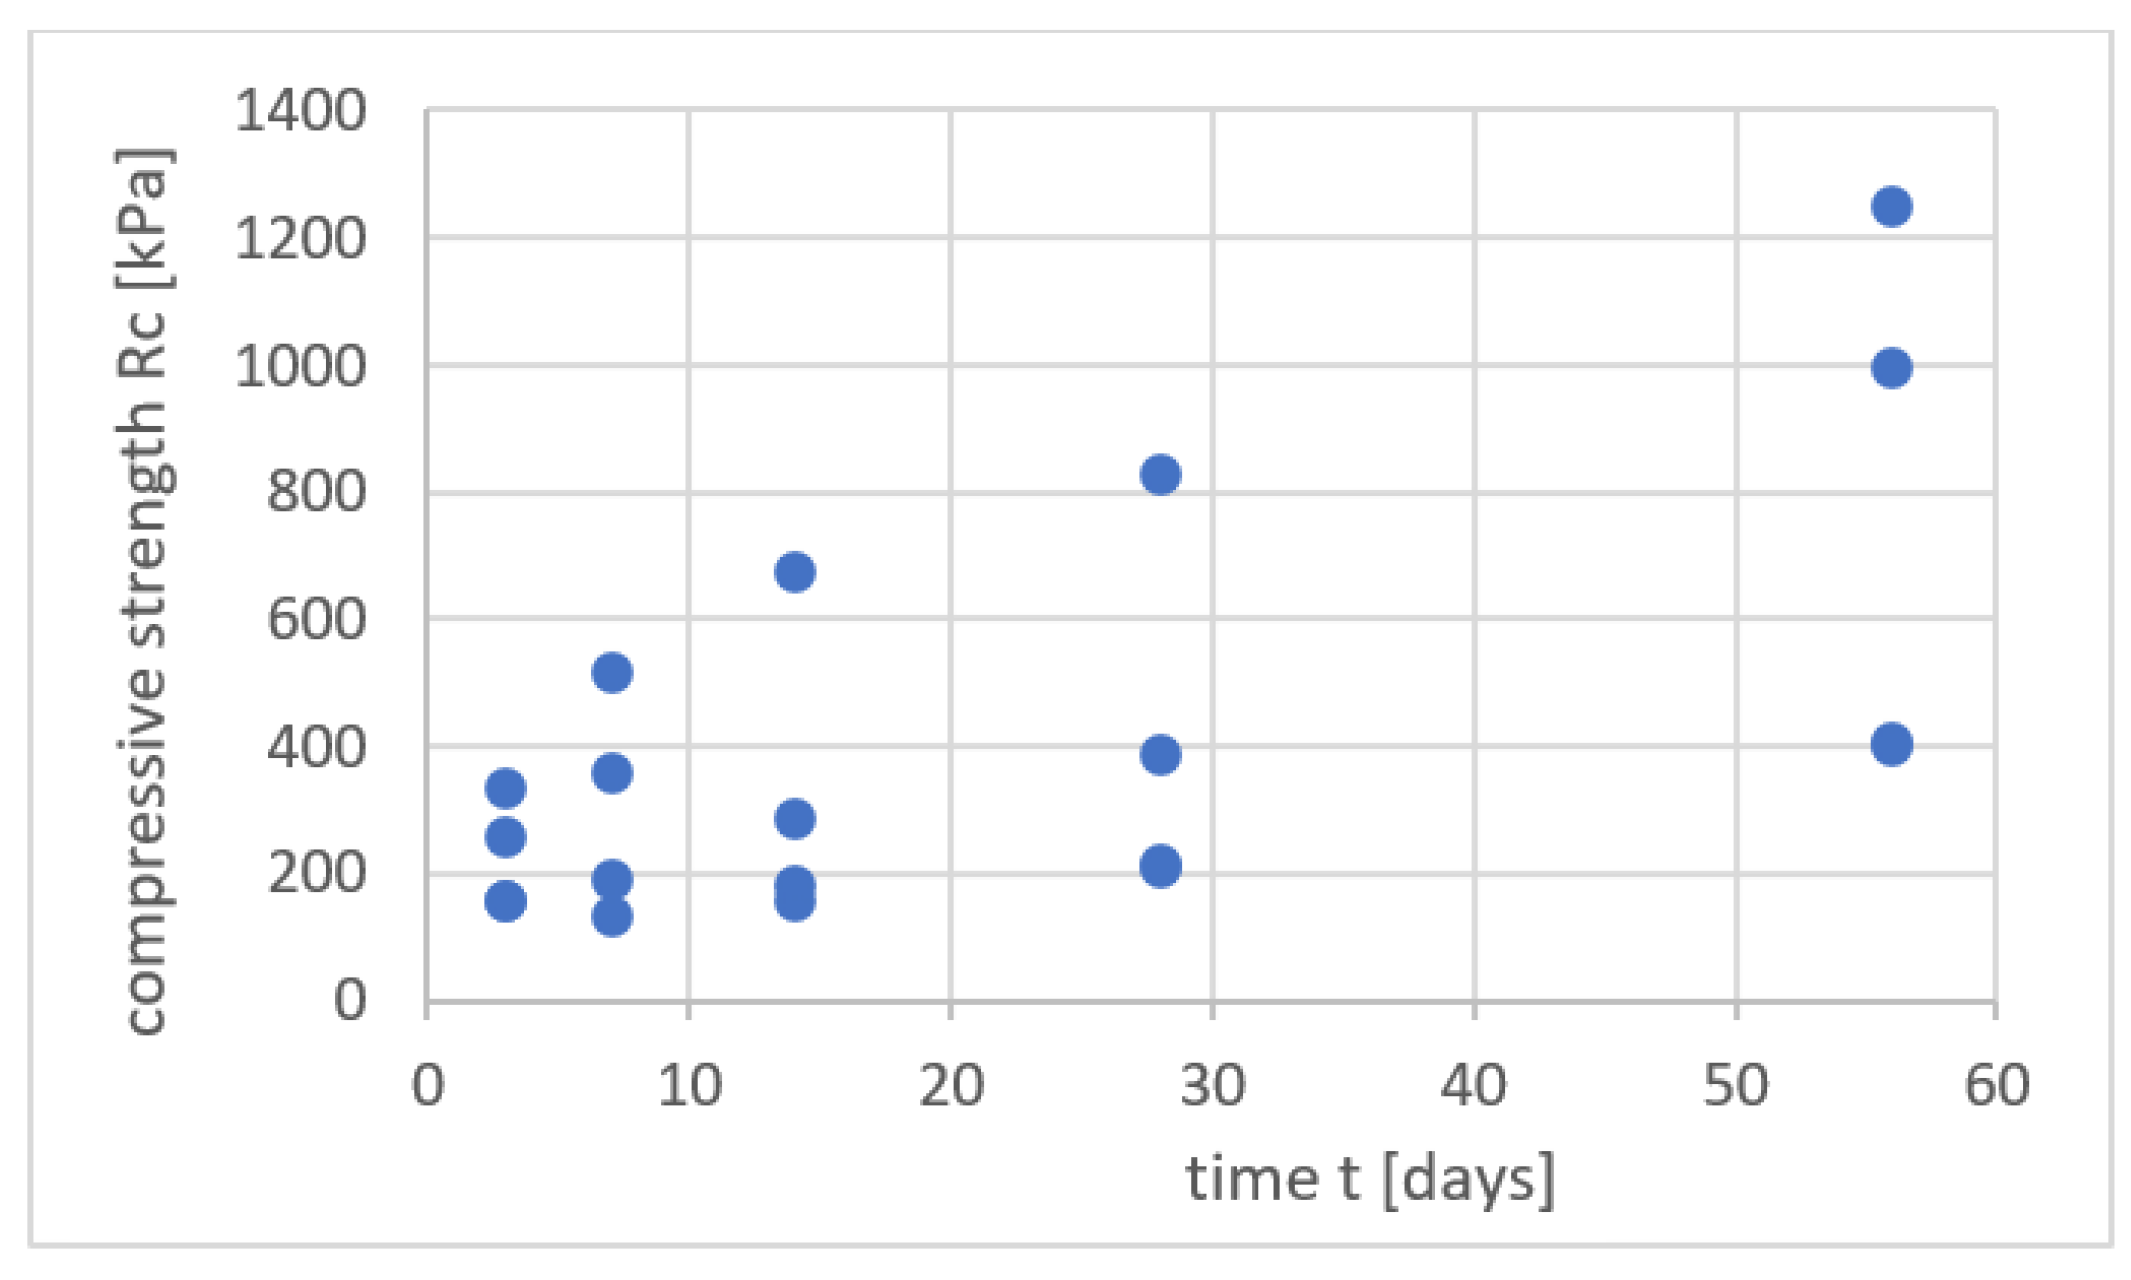
Another problem of major importance is the optimal time for curing. From the figures given below (Figure 10, Figure 11 and Figure 12), we may observe that all the measured values are highly time-dependent. The composite density in Figure 10 decreases slowly in the second month of curing. Changes in compressive strength (Figure 11) and elastic modulus (Figure 12) seem to be far more significant and prove the necessity to prolong the curing times of DSM samples up to two or even three months to gain valuable and reliable information. No trendline was provided in Figure 11 and Figure 12, just so as not to be misleading. One may observe that increasing with time values of Rc and E should still be considered with cautious attention due to the simultaneously increasing standard deviation of the gathered results.
The results of the reference tests presented above formed the basis for the evaluation of the samples taken directly from DSM columns formed in the test field.

4.2. Test Results of Cylindrical Samples from the Test Site

The vast majority of results presented below refer to the cylindrical samples achieved from “pipe in pipe” probing, and they correspond to a curing time equal to 28 days. Some samples were extracted by “core drilling” and were also tested after 28 days. All the samples are listed in Table 5, which juxtaposes the averaged values of all the cylindrical samples gathered (or cut) from “in situ” columns.
The relationship between elastic modulus and compressive strength was established consequently for all the results given in Table 6 and in Formula (5). The authors only decided to exclude two evident outliers: samples named 9 and 12, because the achieved values seemed to be completely unrealistic for DSM composites in cohesive (clayey) soil.
E = 100 × Rc − 17.9 [MPa],
It is important to understand that the correlation of elastic modulus and compressive strength given in Formula (5) is in accordance with the former authors’ experiences [29,30] and also with other researchers’ findings, e.g.,
  • E ≈ 143 × Rc [MPa] in reference [15].
  • E ≈ 120 × Rc [MPa] in reference [17].

4.3. Results of Unloading/Reloading Procedures Derive Material Stiffness in Cycling Loading

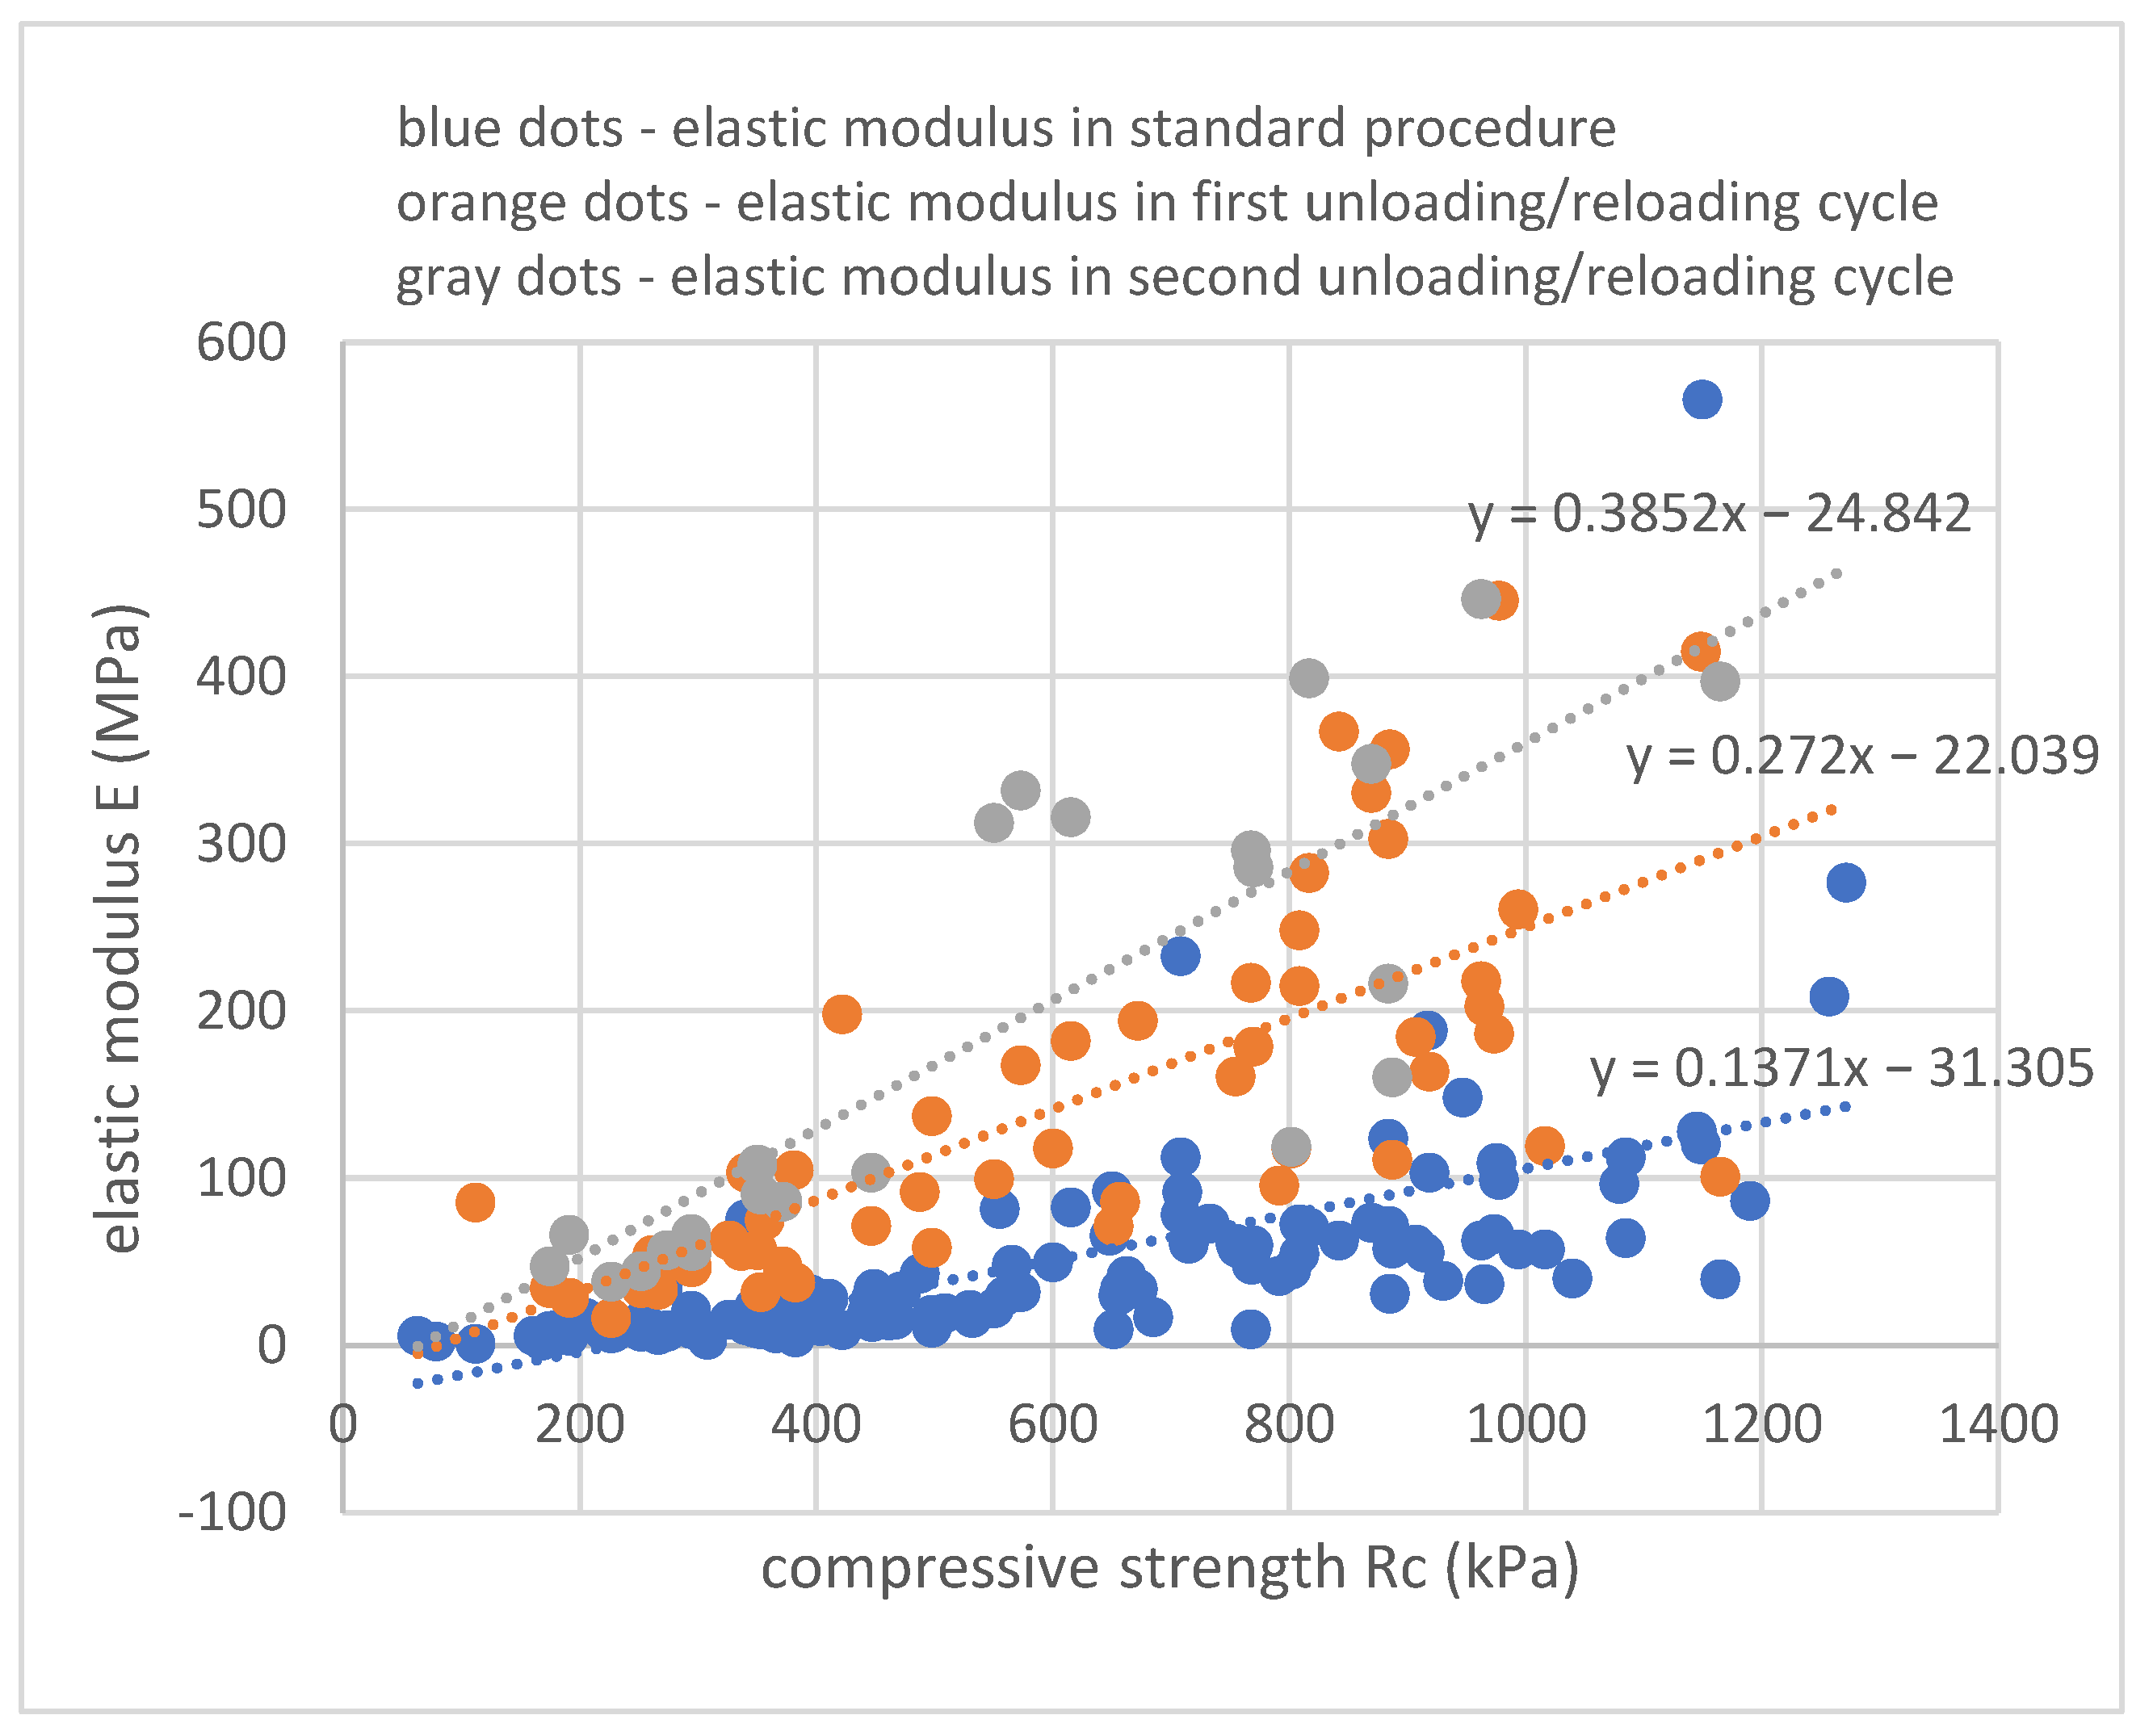
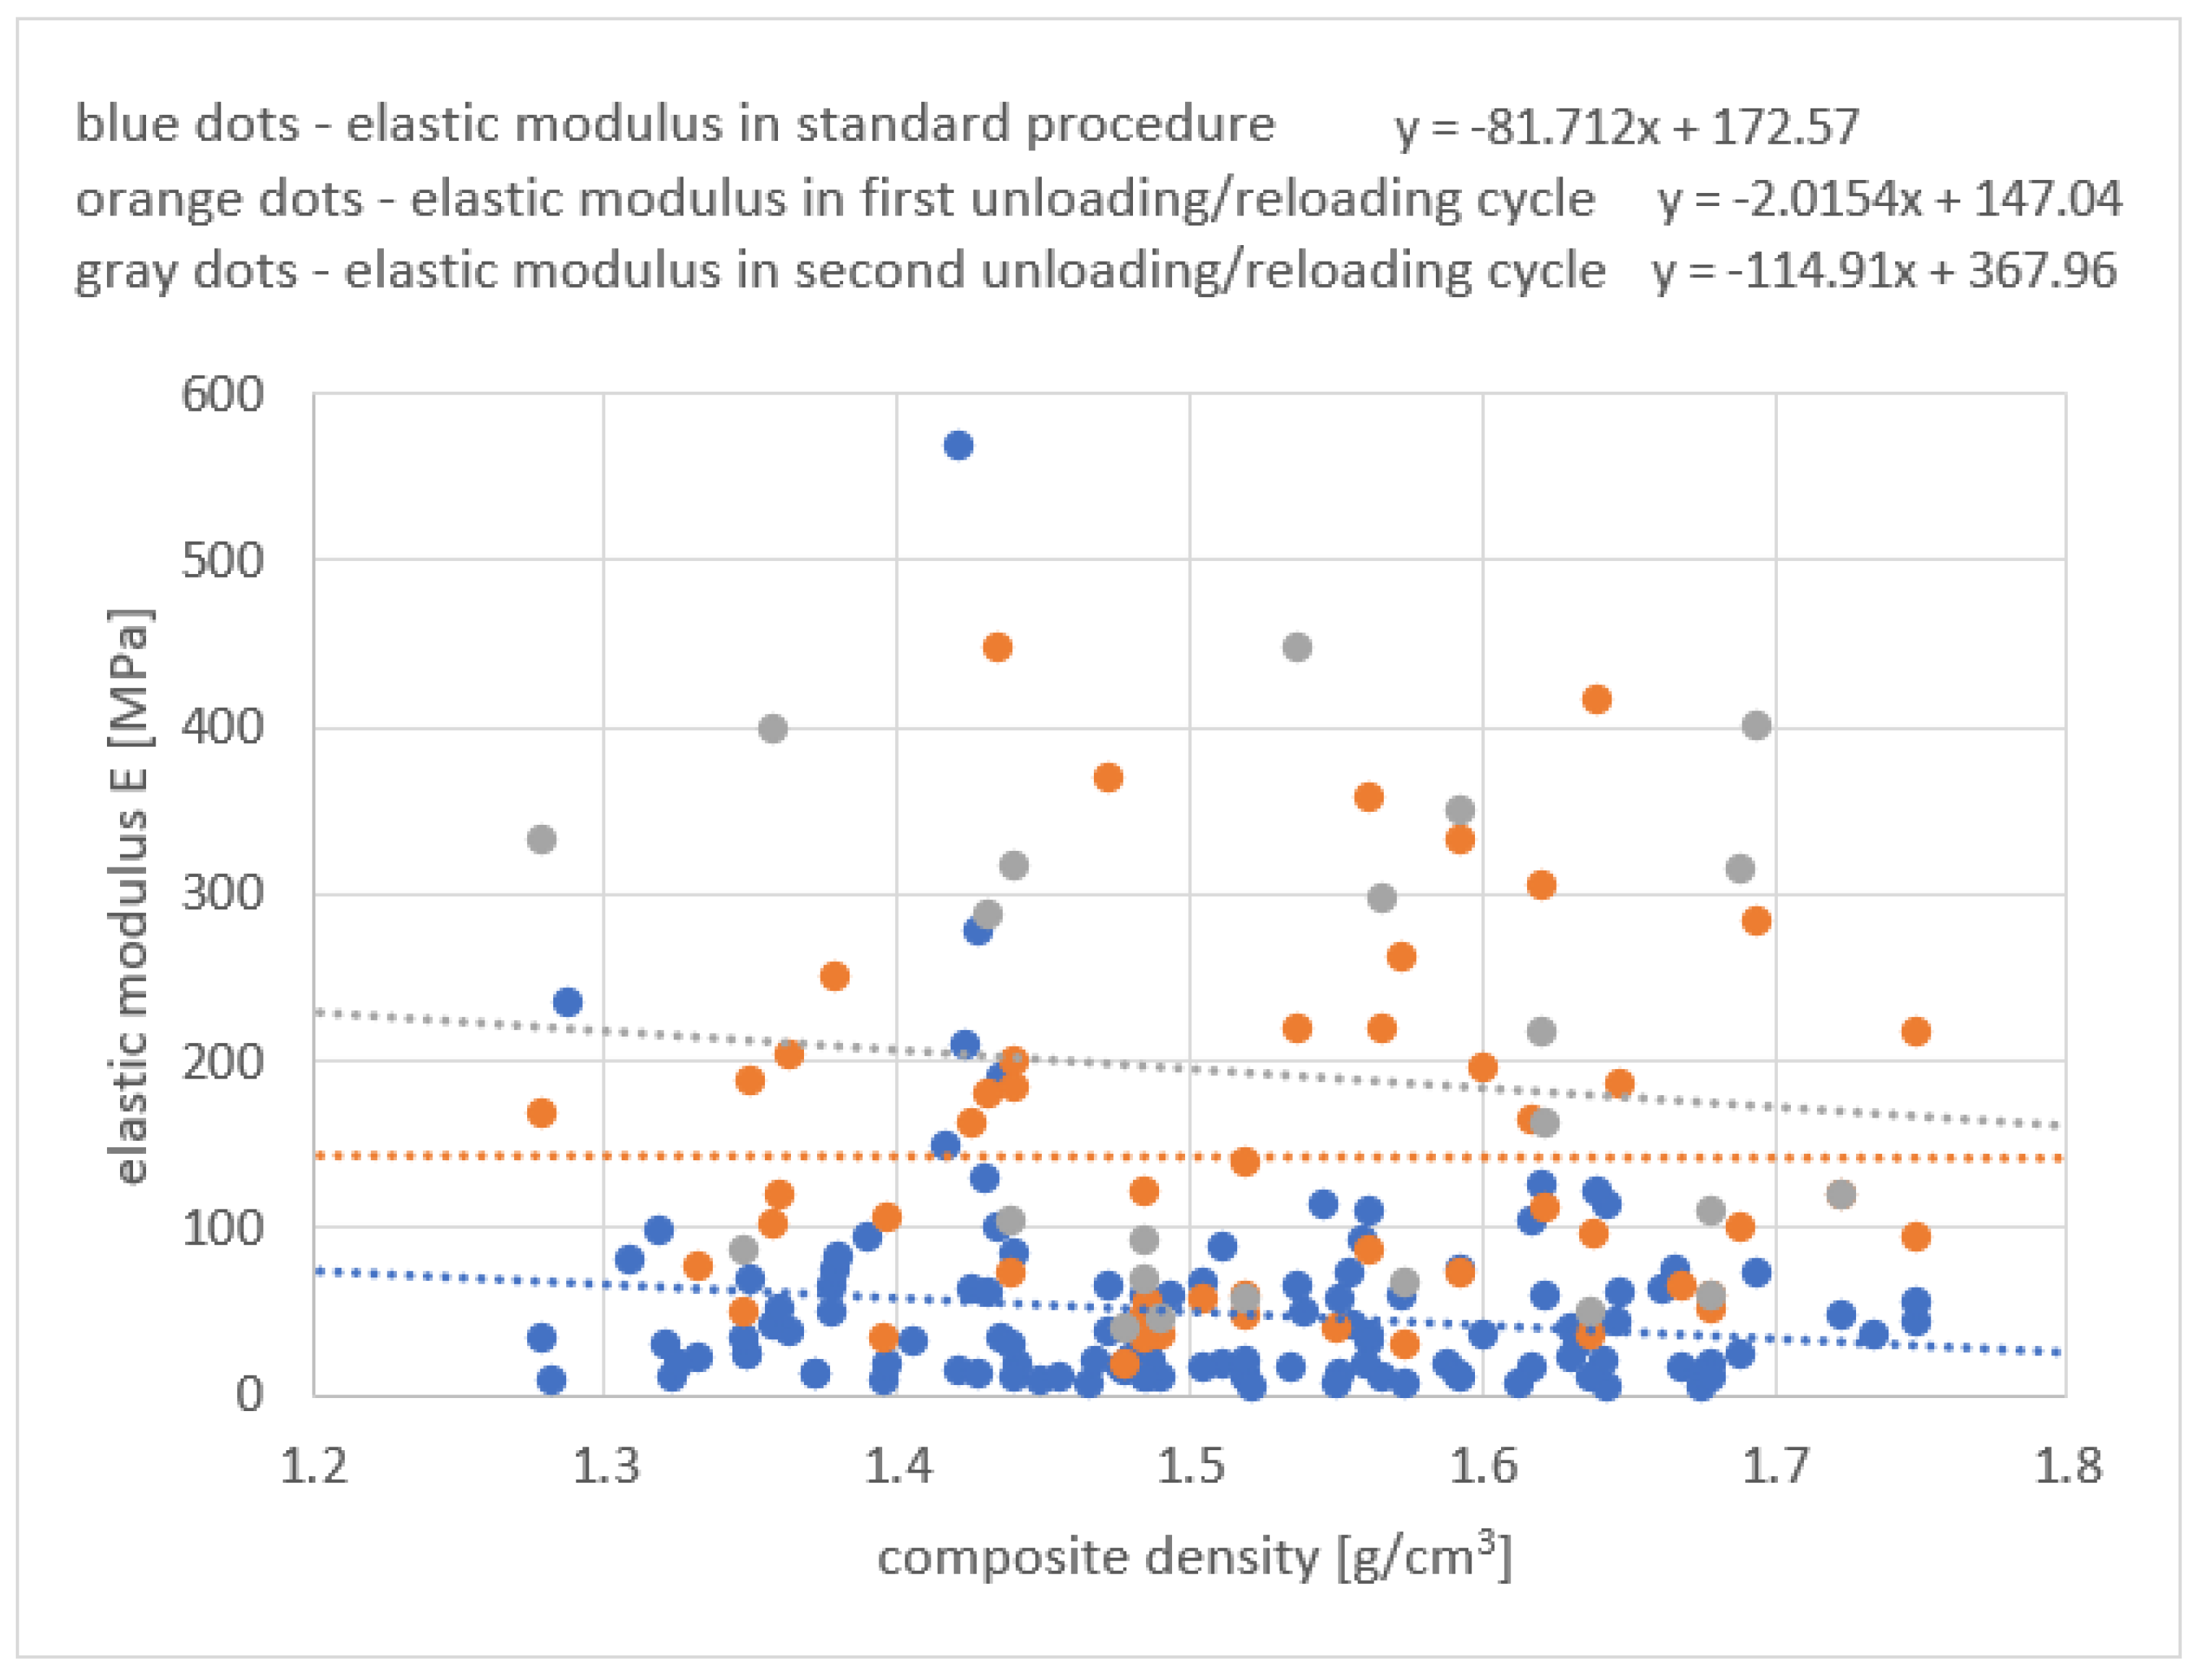
The results presented above are focused on the elastic modulus of soil–cement composites in the first cycle of loading. Some samples were unloaded and reloaded once or twice. A significant increase in stiffness may be observed in the subsequent stages of unloading/reloading. The graph given below presents the results in the composite strength domain and in the composite density domain. As it was presented above, a higher density (better compaction of the composite) is positively correlated with composite compressive strength and, consequently, with the stiffness measured by means of elastic modulus.
Figure 13 presents all the results of maintained compressive strength tests, meaning the continuous tests without unloading (till rapture of the specimen), and tests with a single unloading, and tests with two unloading cycles. All values were consequently derived according to the procedure described in Section 3.5. It may be observed that despite the large variability of the results, a clear increasing trend may be identified for every additional load cycle.
A similar image may be obtained concerning the elastic modules dependence on material density in Figure 14. Despite the fact that strength is usually positively correlated with density, there is no clear trend concerning the density–modulus relationship.
The presented results look slightly paradoxical, but one should bear in mind that concerning well-mixed soil–cement composites, a higher amount of cement grout may result in a higher porosity and a lower amount of natural mineral aggregate, and finally, it may cause a decrease in the material density. Such a phenomenon was observed in the former authors’ experiments. The need to control composite’s density was also expressed in a piece of work [36] concerning the stabilization of organic soils.

4.4. Cubic Sample Test Results (From Spoils)

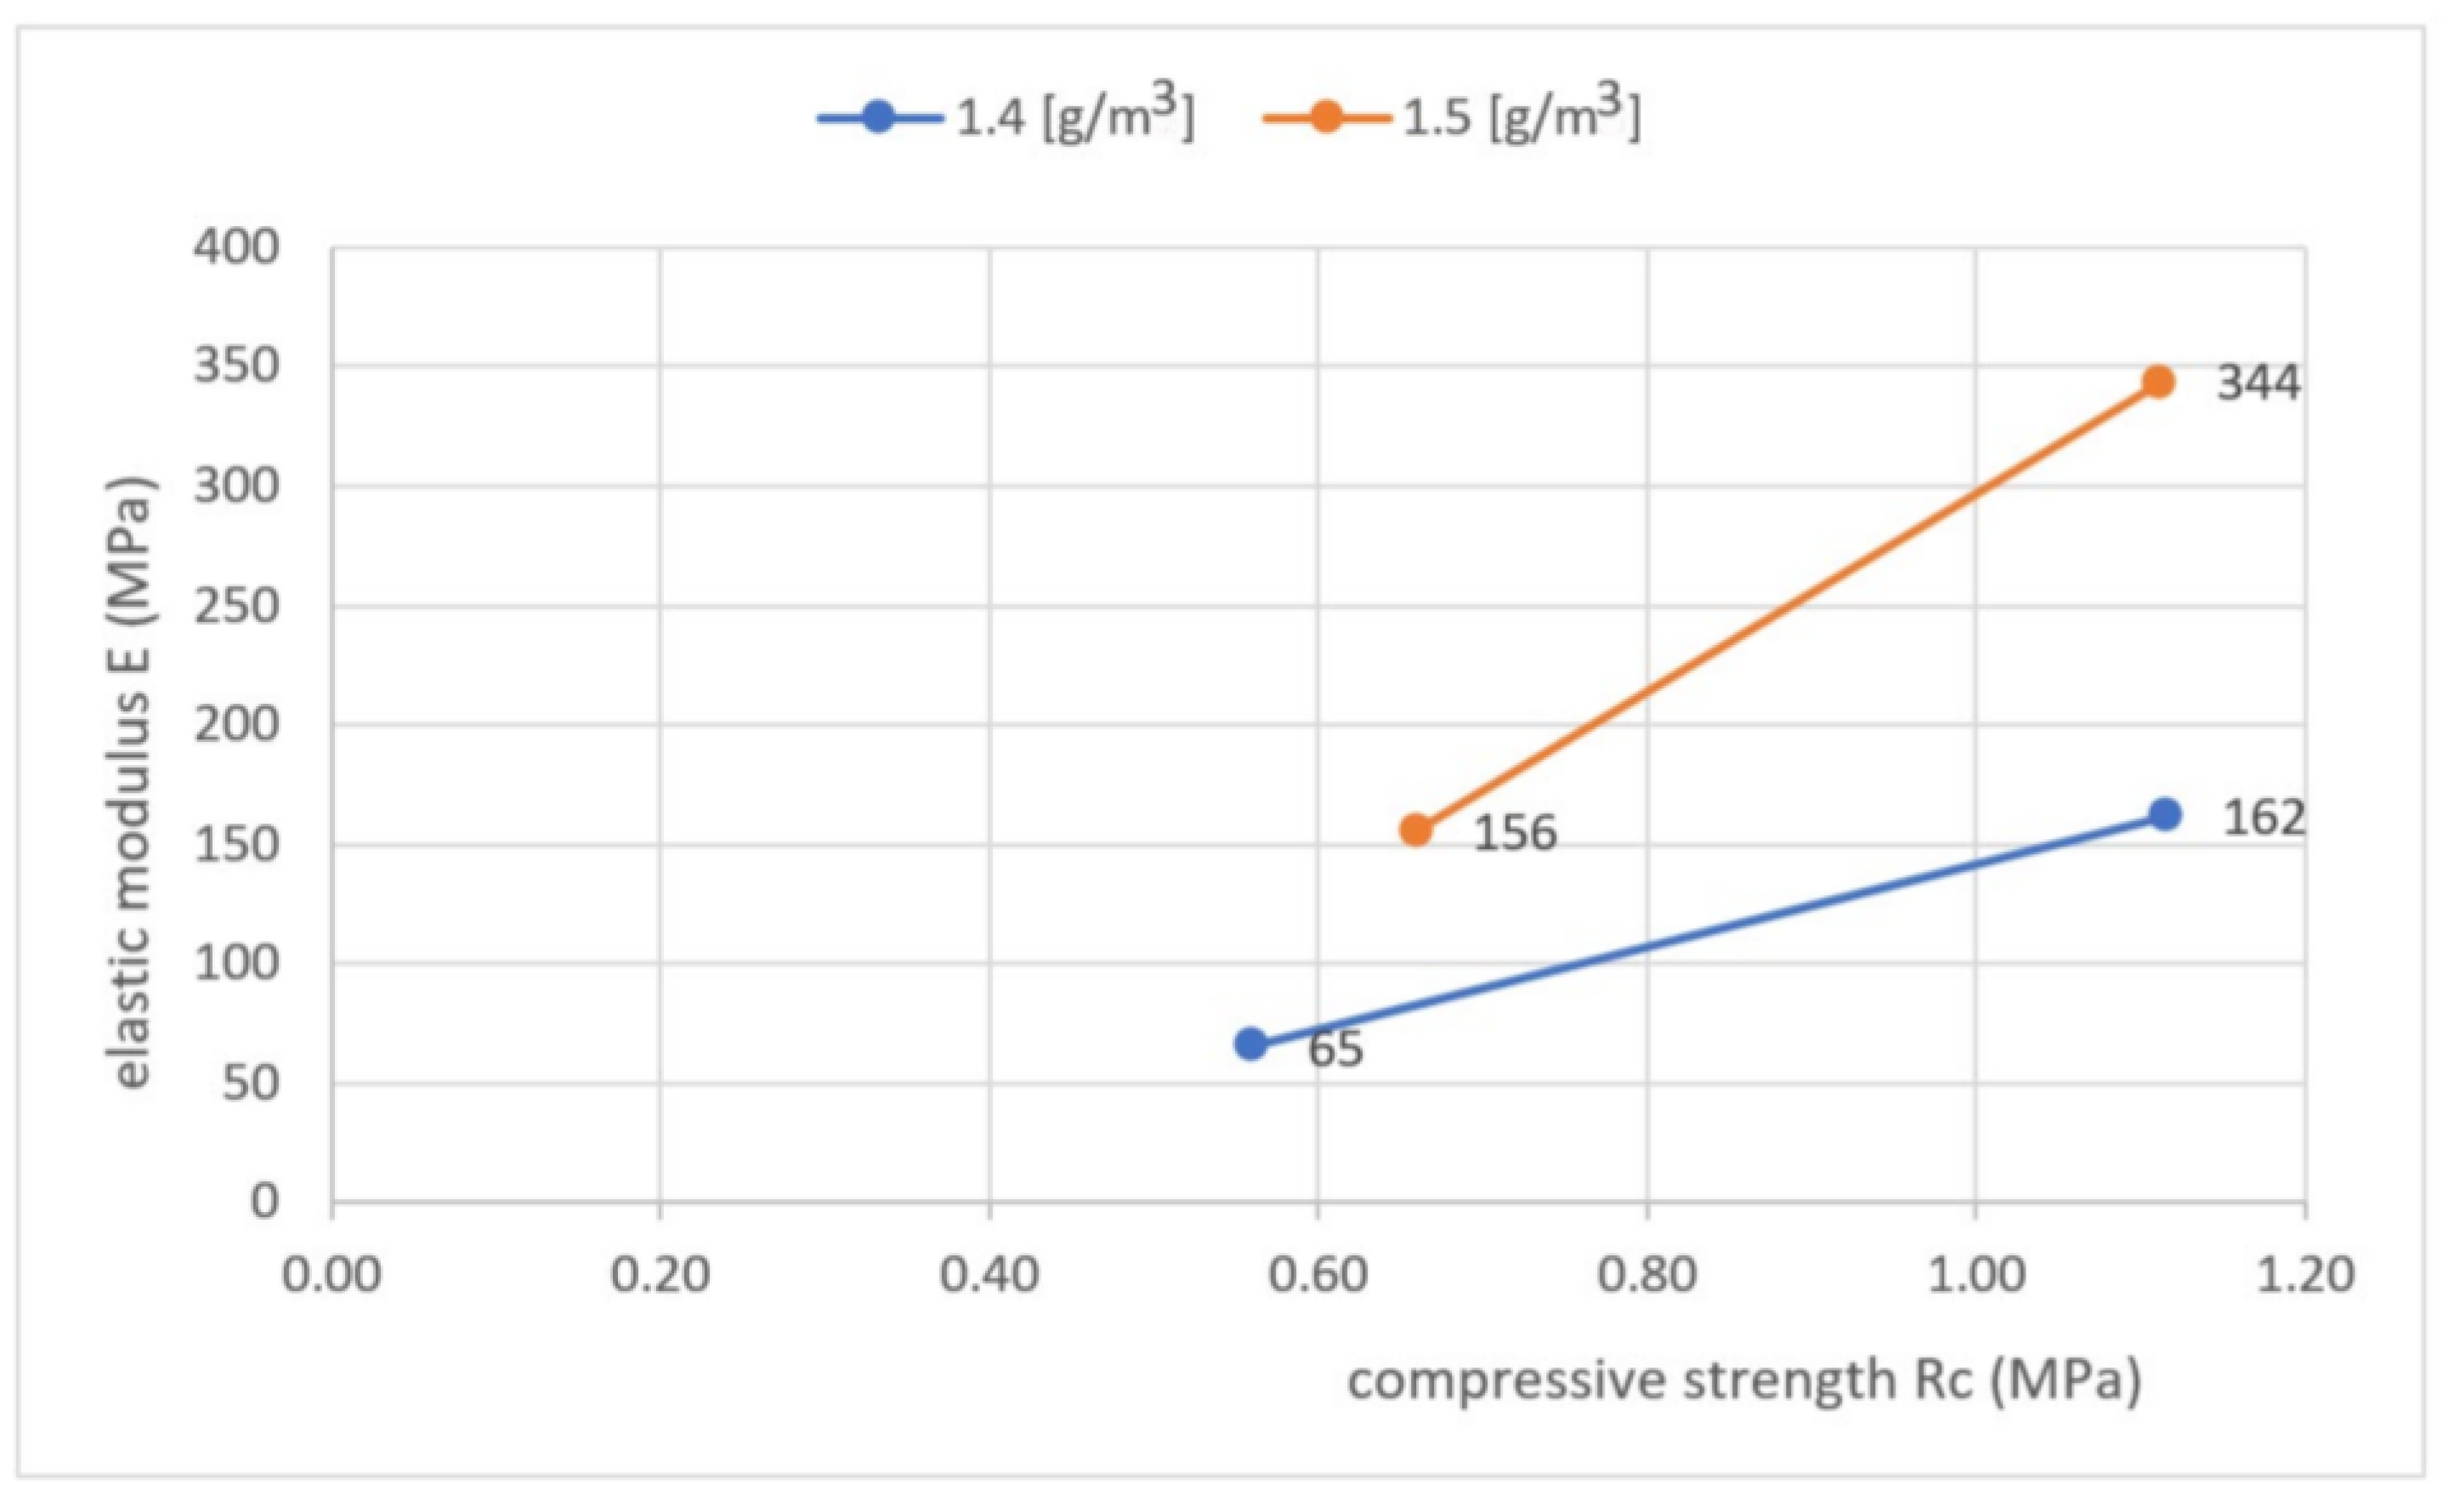
The material gathered “in situ” that formed the cubic samples was taken from the spoil grout that is extracted from the ground in the course of mixing works. The presented results provide one very important conclusion—any action supporting the mixing procedure, like the air injection in the course of mixing, may result in a decrease in the final quality of an achieved composite. It is clearly understood that any kind of “air bubbles” and/or voids will result in a higher porosity of the final product and, consequently, a lower density, strength (Rc), and stiffness (E). The presented results of the four series of samples (averaged) prove that the decrease may reach up to 50% of the original value without air injection (please see Table 7 and the corresponding Figure 15). Obviously, for nearly the same reason, a higher density of cement grout (suspension) provides better outcomes (water also generates increased porosity). The results are given in Table 7, and the relationship between modulus and compressive strength is given in Formula (6).
The information provided in Figure 15 visually represents the data from Table 7. It is worthy to visualize it because the range of parameters decreased by air-jet support in mixing is significant. Also, the difference caused by the cement slurry density is crucial. A relatively small increase in slurry density provides much better outcomes.
E = 293 × Rc − 71.2 [MPa],
One may notice that these samples differ significantly from previous ones in terms of both capacity and stiffness. The most confusing difference is the high stiffness compared to compressive strength derived from Formula (6), which is a result of a linear trendline in Figure 15. This just proves that a high amount of cement grout in the waste material may affect the engineering judgement on soil improvement works performed using mass stabilization technology.

5. Discussion on the Conducted Research

Anticipating the conclusions, it can be said that in the sense of a qualitative analysis, the obtained results basically confirmed the engineering intuitions.
  • Despite the discussed variability of the achieved results, the general conclusion concerning the efficiency of soil improvement using deep mixing is positive. The increase in material stiffness is very significant. If we compare the initial values of the elastic modulus of plastic and organic clays and silts from Table 1 with the values gathered from the trial (reference) samples of the composite and further samples from core drilling, one may observe a very significant increase ranging from 20 to 50 times and higher. That increase in stiffness directly decreases the potential settlements of the structure founded in the improved area. Similar values can be found in other studies [12,17,26] where composite stiffness was defined by elastic modulus.
  • Excessive dilution of cement grout with mixing water (increasing the water/cement W/C ratio) may facilitate the immersion of the mixing tool and speed up the execution of the works. However, it ultimately leads to increased porosity of the ground–cement material, and it potentially weakens the composite, as stated in work [12] (concerning clayey soils). Detailed studies on that issue are still in progress. The results given in Figure 15 suggest a positive impact of the opposite practice, meaning lowering the W/C ratio in order to obtain a higher capacity and stiffness of the composite. In real-world practice, that would mean a longer mixing time and, inevitably, a higher cost of execution. That is the prize for the composite’s quality.
  • The use of compressed air also facilitates the immersion of the mixing tool and speeds up the execution of work. However, it also leads to a significantly increased porosity of the soil–cement composite and a very significant decrease in parameters. Looking at Figure 15, we can see again that compressed-air-supported mixing tends to lower the composite parameters.
  • It should always be kept in mind that an increased porosity will lead to a decrease in the stiffness of the obtained composite (smaller modules) and a decrease in the compressive strength. In the case of “wet” mixed composites, it is not possible to “densify” them before the setting process, so any measures to facilitate the work should be cautiously considered in light of this comment. Considering dry mixing (adding a dry binding agent), it has already been confirmed (reference [26]) that mechanical compaction of the composite before setting provides positive outcomes in terms of strength and stiffness. Additional research is recommended to cover the impact of various mixing technologies on the resulting composite’s density.
  • Diverse results of strength and stiffness of the samples from different levels of deep mixing indicate a lack of homogenization of the parameters of the obtained composite within the column. Each weaker interbedding (e.g., due to an increased content of organic matter) is reflected in the results of the cement–soil samples (cores) taken from this depth. The assessment of column reliability is then determined by the relationship between the thickness of the weak interbedding and the diameter of the column. Based on the observed mechanisms of destruction of cylindrical samples in triaxial tests, it can be assumed that columns with large diameters have a much greater tolerance for weak interbedding or possible inclusions (unmixed soil lumps within the column). The risk of arranging weakened zones on potential failure surfaces is lower. Similar comments were already presented by Karpisz et al. [15].
  • Considering the fact that only whole fragments of the cores (not crushed during sampling) were tested, there may be doubts as to their representativeness for the entire cross-section of the column. This problem is often raised in talks with the construction supervision, which rightly somewhat questions the simple transfer of the test results of the core pieces to the entire column. On the other hand, the chaotic (random) distribution of the stronger zones reduces the probability that the weaker zones will be arranged on the failure surface. Reference samples from test batches are mixed very thoroughly and resemble those from columns formed in injection technologies, e.g., jet grouting. The advantage of DSM columns, however, is the guaranteed diameter (sometimes enlarged in relation to the dimensions of the mixing tool), which ensures column strength despite the potential lack of perfect mixing. That issue was already discussed in the work [36], where the variability of composite parameters was presented in light of statistical analysis.

6. Short Conclusions

The short conclusion should underline some basic information given below:
  • Soil–cement composites manifest a large variability of results concerning both compressive strength and the elastic modulus.
  • The stiffness of soil–cement composites increases significantly in the subsequent stages of loading. The pre-loading of soil–cement composites is recommended.
  • The quality of mixing plays a decisive role in material homogenization, but the effect of size should not be neglected. A one-week sample within a column should not question the quality of the whole structure.
  • The presented studies provide valuable qualitative information for the numerical modeling of soil–cement composites. The elastic modulus for the simplest elastic model of a soil body may be derived on the basis of uniaxial compressive strength.
  • In every case, field testing before the execution of work is the best way to avoid negative surprises concerning material quality due to the interaction between the soil, binder, and mixing tools. Our study tended to point to some trends that should be considered at an early stage of deep soil mixing design (outline proposals).

7. Recommendations for Further Activities

The presented research, due to the large amount of gathered data, just focused on the compressive strength and elastic modulus of soil–cement composites in order to collect reliable data for numerical modeling, considering the composite as an elastic body. More sophisticated constitutive models considering plasticity demand for other data, e.g., effective values of internal friction angle and cohesion and the oedometric modulus of the improved soil. That is why soil samples were subjected to oedometric tests and the effective values of the angle of internal friction and cohesion in the direct shear apparatus were determined. Oedometric tests of the composite obtained in the process of deep mixing were already performed, which allows us to estimate the scale of soil improvement. The effective geotechnical parameters (angle of internal friction and cohesion) of the composite will be determined in tests in the triaxial compression apparatus to provide valuable data for elastic–plastic constitutive models’ validation.
The presented results show the overall trends and generalized variabilities of the results based on technological factors (efficiency of mixing, cement amount, and various mixing process speeding measures that decrease the final quality of the product). The results that have been presented so far as averaged values are intended to be split into separate vectors (multidimensional analysis) to determine random variables and their parameters (mean values and standard deviations). Consequently, a more sophisticated sensitivity analysis is needed in order to establish the basic variables in the mixing process and increase efficiency and quality, which is the goal of research founder.

Author Contributions

Conceptualization, P.K. and M.J.-S.; methodology, M.J.-S. and K.T.; validation, P.K., J.R. and K.T.; formal analysis, P.K., M.J.-S. and J.R; investigation, P.K., M.J.-S. and K.T.; resources, M.J.-S. and J.S.; data curation, M.J.-S. and K.T.; writing—original draft preparation, M.J.-S. and J.R.; writing—review and editing, P.K., K.T., M.J.-S. and J.R.; visualization, J.S. and J.R.; supervision, P.K., J.S. and J.R.; project administration, M.J.-S. and J.S. founding acquisition, J.S. All authors have read and agreed to the published version of the manuscript.

Funding

The presented research was performed by Menard Sp. z o.o. ul. Bonifraterska 7, Warsaw, Poland, and it was co-financed by the National Center for Research and Development under the “Operational Intelligent Development 2014–2022” program, within the grant project “Construction and validation of an innovative system for mixing soil in many technologies”.

Institutional Review Board Statement

Not applicable.

Informed Consent Statement

Not applicable.

Data Availability Statement

Most of presented results (rough data) are available on demand from the corresponding author.

Conflicts of Interest

The authors declare no conflict of interest.

References

  1. Terashi, M. Theme lecture: Deep mixing method—Brief state of the art. In Proceedings of the 14th International Conference of Soil Mechanics and Foundation Engineering, Hamburg, Germany, 6–12 September 1997; Volume 4, pp. 2475–2478. [Google Scholar]
  2. IHS BRE. Design Guide: Soft Soil Stabilisation: EuroSoilStab: Development of Design and Construction Methods to Stabilise Soft Organic Soils; IHS BRE Press: Reading, UK, 2010; ISBN -1860815995. [Google Scholar]
  3. Topolnicki, M. Design and execution practice of wet Soil Mixing in Poland. In Proceedings of the International Symposium on Deep Mixing & Admixture Stabilization, Okinawa, Japan, 19–21 May 2009; pp. 195–202. [Google Scholar]
  4. Topolnicki, M. Geotechnical design and performance of road and railway viaducts supported on DSM columns—A summary of practice. In Proceedings of the International Conference on Deep Mixing, San Francisco, CA, USA, 2–5 June 2015; pp. 1–20. [Google Scholar]
  5. Duszyński, R.; Duszyńska, A.; Cantré, S. New experiences in dike construction with soil-ash composites and fine-grained dredged materials. Stud. Geotech. Mech. 2017, 39, 17–24. [Google Scholar] [CrossRef]
  6. Zhao, X.; Zhao, L.; Yang, Q.; Wang, Z.; Cheng, A.; Mo, L.; Yan, J. Permeability and Disintegration Characteristics of Composite Improved Phyllite Soil by Red Clay and Cement. Minerals 2023, 13, 32. [Google Scholar] [CrossRef]
  7. Xia, W.-Y.; Du, Y.-J.; Li, F.-S.; Li, C.-P.; Yan, X.-L.; Arulrajah, A.; Wang, F.; Song, D.-J. In-situ solidification/stabilization of heavy metals contaminated site soil using a dry jet mixing method and new hydroxyapatite based binder. J. Hazard. Mater. 2019, 369, 353–361. [Google Scholar] [CrossRef]
  8. Prakash, K.G.; Krishnamoorthy, A. Effectiveness of Stone and Deep Mixing Lime Columns on Stability of Embankments Constructed on Soft Consolidating Soil. Geotech. Geol. Eng. 2023, 41, 533–552. [Google Scholar] [CrossRef]
  9. Muhmed, A.; Mohamed, M.; Khan, A. The Impact of Moisture and Clay Content on the Unconfined Compressive Strength of Lime Treated Highly Reactive Clays. Geotech. Geol. Eng. 2022, 40, 5869–5893. [Google Scholar] [CrossRef]
  10. Lindh, P.; Lemenkova, P. Shear bond and compressive strength of clay stabilised with lime/cement jet grouting and deep mixing: A case of Norvik, Nynäshamn. Nonlinear Eng. 2022, 11, 693–710. [Google Scholar] [CrossRef]
  11. Leśniewska, A. Strength and technological issues of soil improvement by means of Deep Soil Mixing Wet technology. Ph.D. Thesis, Gdańsk University of Science and Technology, Gdańsk, Poland, 2007. (In Polish). [Google Scholar]
  12. Brasse, K.; Tracz, T.; Zdeb, T.; Rychlewski, P. Influence of Soil-Cement Composition on its Selected Properties. MATEC Web Conf. 2018, 163, 06006. [Google Scholar] [CrossRef]
  13. Jendrysik, K.; Kiecana, M.; Szabowicz, H. Preliminary results of dry Deep Soil Mixing soil-cement composite testing. MATEC Web Conf. 2018, 251, 01025. [Google Scholar] [CrossRef]
  14. Dou, H.; Wang, Y. Strength of deep mixed soft clay with cement. In Proceedings of the 16th Asian Regional Conference on Soil Mechanics and Geotechnical Engineering, ARC 2019, Taipei, Taiwan, 14–18 October 2019. [Google Scholar]
  15. Karpisz, I.; Pyda, J.; Cichy, L.; Sobala, D. Study of the effect of cement amount on the soil-cement sample strength. IOP Conf. Ser. Mater. Sci. Eng. 2018, 365, 042061. [Google Scholar] [CrossRef]
  16. Tatsuoka, F.; Kohata, Y.; Uchida, K.; Imai, K. Deformation and Strength Characteristics of Cement-Treated Soils in Trans-Tokyo Bay Highway Project. In Proceedings of the Grouting and Deep Mixing: Proceedings of IS-Tokyo 96 2nd International Conference on Ground Improvement Geosystems, Tokyo, Japan, 14–17 May 1996; pp. 453–459.
  17. Karpisz, I.; Jaworski, K. Study of compressive strength evolution in soil cement samples with fly-ash admixtures. IOP Conf. Ser. Mater. Sci. Eng. 2018, 365, 032049. [Google Scholar] [CrossRef]
  18. Jamsawang, P.; Adulyamet, B.; Voottipruex, P.; Jongpradist, P.; Likitlersuang, S.; Tantayopin, K. The free swell potential of expansive clays stabilized with the shallow bottom ash mixing method. Eng. Geol. 2023, 315, 107027. [Google Scholar] [CrossRef]
  19. Arulrajah, A.; Yaghoubi, M.; Disfani, M.M.; Horpibulsuk, S.; Bo, M.W.; Leong, M. Evaluation of fly ash- and slag-based geopolymers for the improvement of a soft marine clay by deep soil mixing. Soils Found. 2018, 58, 1358–1370. [Google Scholar] [CrossRef]
  20. Mypati, V.N.K.; Saride, S. Feasibility of Alkali-Activated Low-Calcium Fly Ash as a Binder for Deep Soil Mixing. J. Mater. Civ. Eng. 2022, 34, 04021410. [Google Scholar] [CrossRef]
  21. Paniagua, P.; Ritter, S.; Moseid, M.; Okkenhaug, G. Bioashes and steel slag as alternative binders in ground improvement of quick clays. In Geo-Congress 2023; American Society of Civil Engineers: Reston, VA, USA, 2023; pp. 25–34. [Google Scholar] [CrossRef]
  22. Sharma, J.K.; Grover, K.S.; Tak, D. Experimental Study of Engineering Properties of Kota Stone Slurry Powder and Fly Ash Mixed Expansive Soil. Lect. Notes Civ. Eng. 2021, 134, 201–216. [Google Scholar] [CrossRef]
  23. Toksöz Hozatlıoğlu, D.; Yılmaz, I. Shallow mixing and column performances of lime, fly ash and gypsum on the stabilization of swelling soils. Eng. Geol. 2021, 280, 105931. [Google Scholar] [CrossRef]
  24. Ermolovich, E.A.; Ivannikov, A.L.; Khayrutdinov, M.M.; Kongar-Syuryun, C.B.; Tyulyaeva, Y.S. Creation of a Nanomodified Backfill Based on the Waste from Enrichment of Water-Soluble Ores. Materials 2022, 15, 3689. [Google Scholar] [CrossRef] [PubMed]
  25. Khayrutdinov, A.; Paleev, I.; Artemov, S. Replacement of traditional components of the backfill mixture with man-made waste. IOP Conf. Ser. Earth Environ. Sci. 2021, 942, 012005. [Google Scholar] [CrossRef]
  26. Ding, F.; Song, L.; Yue, F. Study on Mechanical Properties of Cement-Improved Frozen Soil under Uniaxial Compression Based on Discrete Element Method. Processes 2022, 10, 324. [Google Scholar] [CrossRef]
  27. Forsman, J.; Jyrävä, H.; Lahtinen, P.; Niemelin, T.; Hyvönen, I. Mass Stabilization Manual. Available online: http://projektit.ramboll.fi/massastabilointi/materials/mass_stabilization_manual_2015.pdf (accessed on 10 May 2023).
  28. Jendrysik, K.; Jończyk, M.; Kanty, P. Mass stabilization as a modern method of substrate strengthening. Mater. Today Proc. 2021, 38, 2068. [Google Scholar] [CrossRef]
  29. Egorova, A.A.; Rybak, J.; Stefaniuk, D.; Zajączkowski, P. Basic aspects of deep soil mixing technology control. IOP Conf. Ser. Mater. Sci. Eng. 2017, 245, 022019. [Google Scholar] [CrossRef]
  30. Kanty, P.; Rybak, J.; Stefaniuk, D. Some remarks on practical aspects of laboratory testing of deep soil mixing composites achieved in organic soils. IOP Conf. Ser. Mater. Sci. Eng. 2017, 245, 022018. [Google Scholar] [CrossRef]
  31. Kiecana, M.; Kanty, P.; Łużyńska, K. Optimal control time evaluation for “dry DSM” soil-cement composites. MATEC Web Conf. 2018, 251, 01023. [Google Scholar] [CrossRef]
  32. Chaumeny, J.L.; Kanty, P.; Reitmeier, T. Remarks on wet deep soil mixing quality control. In Proceedings of the XVI DECGE 2018 Proceedings of the 16th Danube—European Conference on Geotechnical Engineering, Skopje, Republic of Macedonia, 7–9 June 2018; Paper No. 039.
  33. Jendrysik, K.; Pachnicz, M.; Dudziński, P. Parameters of the constitutive model of geomaterials formed with the use of DSM dry technology. E3S Web Conf. 2019, 97, 02028. [Google Scholar] [CrossRef]
  34. Abdullah, H.H.; Shahin, M.A. Geomechanical Behaviour of Clay Stabilised with Fly-Ash-Based Geopolymer for Deep Mixing. Geosciences 2022, 12, 207. [Google Scholar] [CrossRef]
  35. Sakai, T.; Nakano, M. Attempt to reproduce the mechanical behavior of cement-treated soil using elasto-plastic model considering soil skeleton structure. Soils Found. 2021, 61, 1464–1474. [Google Scholar] [CrossRef]
  36. Kanty, P.; Kiecana, M.; Prokopowicz, P. Some remarks on statistic approach to strength testing of soil-cement composites. E3S Web Conf. 2019, 97, 04045. [Google Scholar] [CrossRef]
  37. Wincenty Solecki. Geotechnical Opinion for the Determination of Soil and Water Conditions on Plots No. 723/1 and 727/1 in Bolechowice; GeoVis Wincenty Solecki: Więckowice, Poland, 2021. [Google Scholar]
  38. Ostrowski, L. Determination of Strength and Deformation Parameters of Cement-Soils. Tests of Uniaxial Compressive Strength and Oedometric Compressibility Modulus; AGH University of Science and Technology: Kraków, Poland, 2022. [Google Scholar]
  39. Bruce, M.E.C.; Berg, R.R.; Collin, J.G.; Filz, G.M.; Terashi, M.; Yang, D.S. Federal Highway Administration Design Manual: Deep Mixing for Embankment and Foundation Support. Report No. FHWA-HRT-13-046. Available online: https://www.fhwa.dot.gov/publications/research/infrastructure/structures/bridge/13046/index.cfm (accessed on 10 May 2023).
  40. EN ISO 17892-7:2018; Geotechnical Investigation and Testing—Laboratory Testing of soil—Part 7: Unconfined Compression Test. ISO: Geneva, Switzerland, 2018.
  41. Decký, M.; Drusa, M.; Papán, D.; Šrámek, J. The Relationship between Dynamic and Static Deformation Modulus of Unbound Pavement Materials Used for Their Quality Control Methodology. Materials 2022, 15, 2922. [Google Scholar] [CrossRef] [PubMed]
  42. Gago, F.; Valletta, A.; Mužík, J. Formulation of a Basic Constitutive Model for Fine—Grained Soils Using the Hypoplastic Framework. Civ. Environ. Eng. 2021, 17, 450–455. [Google Scholar] [CrossRef]
  43. Ižvolt, L.; Dobeš, P. Analysis of Measuring the Deformation Resistance of the SubgradeSurface of a Modernised Line Považská Teplá—Žilina. Civ. Environ. Eng. 2020, 16, 210–218. [Google Scholar] [CrossRef]
  44. Izvolt, L.; Dobes, P.; Drusa, M.; Kadela, M.; Holesova, M. Experimental and Numerical Verification of the Railway Track Substructure with Innovative Thermal Insulation Materials. Materials 2022, 15, 160. [Google Scholar] [CrossRef]
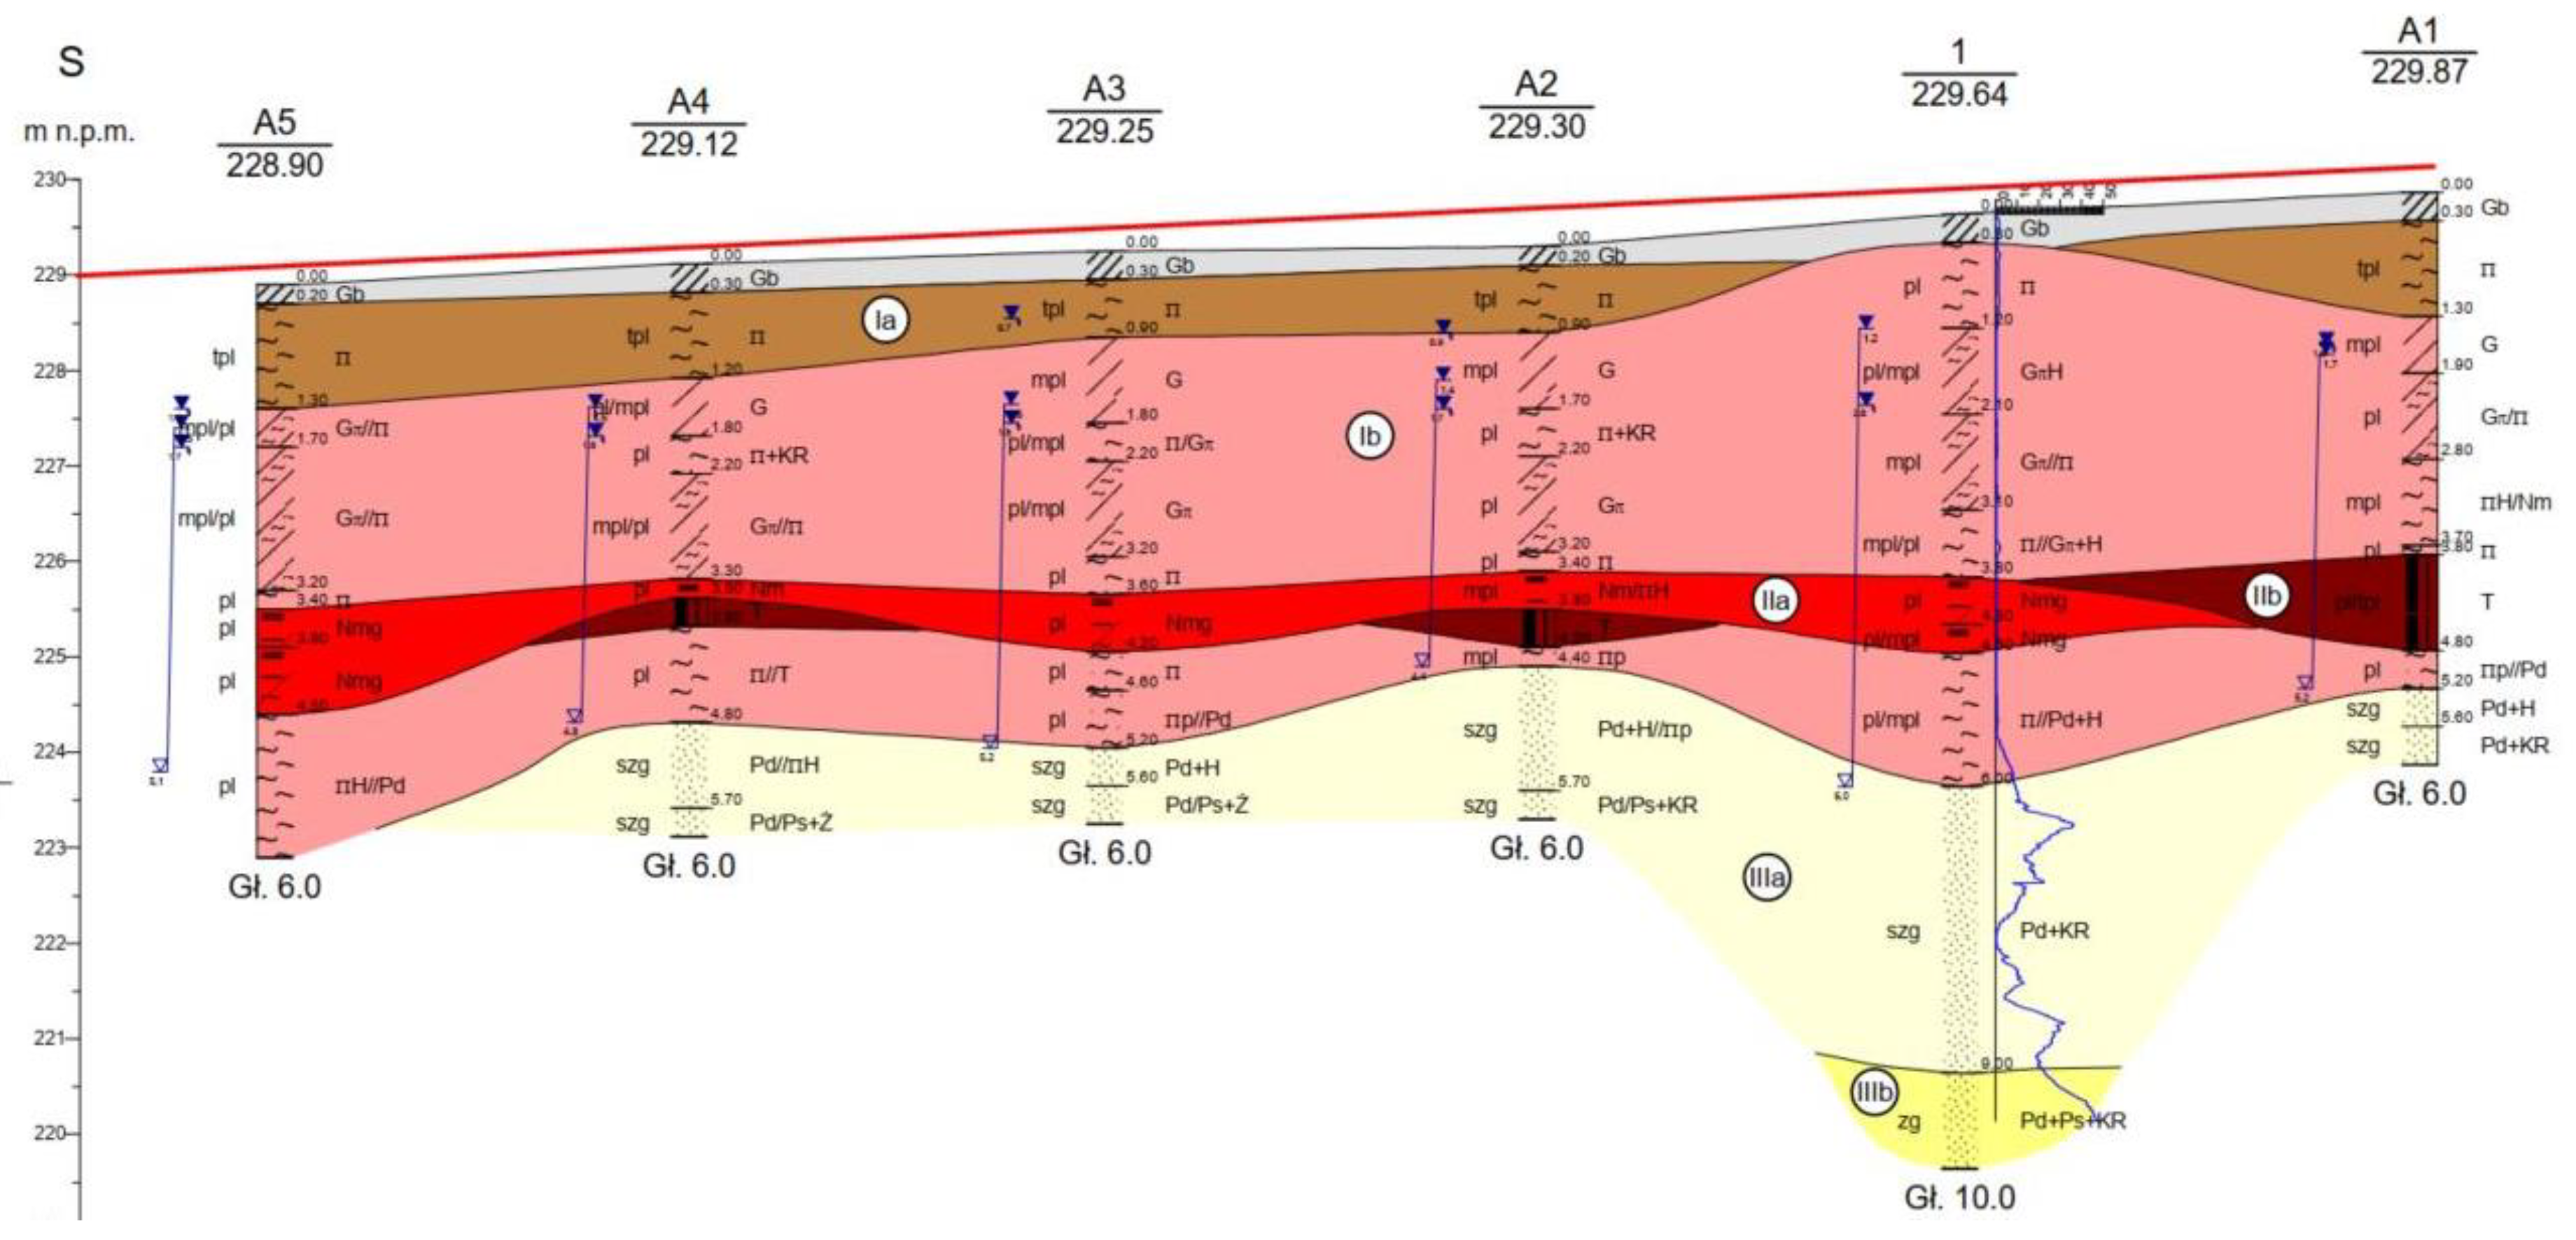
Figure 1. Typical geotechnical section at the location of the test columns [37].
Applsci 13 10268 g001
Figure 2. Deep mixing device during the works. (a) Equipped with standard mixer. (b) Equipped with foldable tool (multidiameter mixer).
Applsci 13 10268 g002
Figure 3. Various samples prepared in real-world conditions (building site).
Applsci 13 10268 g003
Figure 4. “Pipe in pipe” probing system. (a) Installation of the pipe in the “fresh” column. (b) Pipe head just after its plunging.
Applsci 13 10268 g004
Figure 5. (a) The cores drilled from the finished column (in the ground). (b) Measured diameter of DSM column.
Applsci 13 10268 g005
Figure 6. Tests with stress path control—cubic samples [36].
Applsci 13 10268 g006
Figure 7. A sample taken from a PVC pipe before delivery to the lab.
Applsci 13 10268 g007
Figure 8. Chart that embodies uniaxial compressive test performed on soil–cement composite sample.
Applsci 13 10268 g008
Figure 9. A dependency between elastic modulus and the compressive strength of the composite.
Applsci 13 10268 g009
Figure 10. Composite density decreasing in time domain.
Applsci 13 10268 g010
Figure 11. Compressive strength Rc increasing in time domain with large variety.
Applsci 13 10268 g011
Figure 12. Elastic modulus E increasing in time domain with large variety.
Applsci 13 10268 g012
Figure 13. Elastic modulus E vs. compressive strength. Values derived from stress–strain curves in subsequent stages of unloading/reloading cycles.
Applsci 13 10268 g013
Figure 14. Elastic modulus E vs. composite density. Values derived from stress–strain curves in subsequent stages of unloading/reloading cycles.
Applsci 13 10268 g014
Figure 15. Significant increase in parameters when resigning of air jet mixing support.
Applsci 13 10268 g015
Table 1. Basic data from field investigation report [37] derived from laboratory testing and CPT sounding.
Type of SoilDepthPlasticity/Density IndexDensityCohesion cInternal Friction
Angle ϕ
Elastic Modulus E
mIL/IDg/cm3kPa° (deg)MPa
Ia—silty clay0–10.102.088.931.7-
Ib—silt1–3, 4–60.42–0.811.961.217.71.8–7.7
IIa—mud3–40.361.6015.717.32.7
Iib—peat4–5-----
IIIa—sand6–90.781.90-31.234.9
IIIb—sand9–100.782.00-35.979.6
Table 2. Averaged values of Type I reference tests.
Time of
Curing
DensityCompressive StrengthCritical
Deformation
Elastic
Modulus
Daysg/cm3kPa%MPa
31.740335.522.87.721
71.724516.662.052.886
141.775674.202.158.131
281.683825.672.368.926
561.5101249.451.979.153
Table 3. Averaged values of Type II reference tests.
Time of
Curing
DensityCompressive StrengthCritical
Deformation
Elastic
Modulus
Daysg/cm3kPa%MPa
31.840256.012.027.584
71.782355.711.610.761
141.796285.141.529.323
281.725385.162.712.89
561.534995.461.2116.987
Table 4. Averaged values of Type III reference tests.
Time of
Curing
DensityCompressive StrengthCritical
Deformation
Elastic
Modulus
Daysg/cm3kPa%MPa
31.720158.434.37.131
71.724133.455.67.117
141.764154.742.67.030
281.674215.224.96.560
561.474407.574.69.193
Table 5. Averaged values of Type IV reference tests.
Time of
Curing
DensityCompressive StrengthCritical
Deformation
Elastic
Modulus
Daysg/cm3kPa%MPa
31.698155.592.69.377
71.714192.031.629.424
141.743179.632.325.155
281.658208.713.915.182
561.430398.852.544.846
Table 6. Averaged values of all tests performed on real-world samples.
Number of
the Sample
DensityCompressive StrengthCritical
Deformation
Elastic
Modulus
g/cm3kPa%MPa
11.547491.322.70%18.571
21.444796.962.80%54.026
31.658565.763.20%61.36
41.628226.443.00%9.193
51.407941.144.20%74.91
61.447949.722.70%69.351
71.508730.913.70%29.729
81.631359.223.10%16.204
91.6312746.12.40%1050.901
101.536802.552.40%87.131
111.424317.043.60%10.958
121.7123006.621.60%2115.93
131.4741315.141.60%124.869
141.509518.643.00%27.207
151.432702.723.20%15.983
161.603760.643.40%24.394
171.393868.241.90%96.733
181.6711563.243.00%111.525
191.444796.962.80%54.026
201.552315.061.90%28.258
211.697281.365.00%5.464
221.307440.262.10%23.321
231.606804.42.60%71.167
241.347649.522.70%29.878
251.6411045.672.70%196.195
261.512436.462.80%19.493
271.67364.093.70%38.004
281.531112.812.60%53.951
Samples 9 and 12 were considered outliers and excluded from the analysis.
Table 7. Averaged values of results of cubic samples testing.
Name of
Sample
DensityCompressive StrengthCritical
Deformation
Elastic
Modulus
Daysg/cm3kPa%MPa
Solid 1.41.4241116.3541.20%161.791
Solid 1.4 + air1.380560.5591.30%65.209
Solid 1.41.4291112.9700.80%343.852
Solid 1.4 + air1.298660.5051.30%155.771
Disclaimer/Publisher’s Note: The statements, opinions and data contained in all publications are solely those of the individual author(s) and contributor(s) and not of MDPI and/or the editor(s). MDPI and/or the editor(s) disclaim responsibility for any injury to people or property resulting from any ideas, methods, instructions or products referred to in the content.