1. Introduction
Plastics have become an integral part of our daily lives, playing a crucial role in various industries and applications. However, improper disposal and mismanagement of plastic waste have raised significant environmental concerns. The accumulation of plastic waste poses a severe threat to ecosystems, including marine life [
1] and terrestrial habitats [
2], making effective waste management and recycling strategies urgent. For plastic waste sorting, conventional techniques such as NIRS [
3,
4,
5], electrostatic separators [
6], and magnetic density separation [
7] have been employed. NIRS offers several advantages, such as remote and rapid measurement with a high signal-to-noise ratio, making it a global trend for waste plastic sorting systems. Furthermore, recent advances in artificial intelligence (AI) research have led to the integration of AI algorithms and NIRS technology to develop more accurate classification systems for plastic sorting [
4,
8,
9]. However, NIRS relies on variations in the absorption efficiency due to differences in the chemical composition of target samples [
10,
11], presenting challenges when applied to chemically similar samples.
Therefore, there is a critical need for innovative and accurate plastic waste classification methods that can overcome the limitations of techniques and enable efficient recycling. For example, polyethylene terephthalate (PET) and polyethylene terephthalate glycol (PET-G) are both polyester-based plastics used in various applications, but they exhibit differences in their physical properties [
12]. Particularly, PET has a higher melting point of approximately 245–255 °C, while PET-G has a lower melting point of around 70–80 °C. Consequently, when PET and PET-G are mixed for recycling, it leads to a significant reduction in recycling purity. Recognizing challenges, the California Legislature has passed a bill to revise the definition of PET (polyethylene terephthalate) by excluding PET-G, a glycol-modified version, to reduce contamination in recycling [
13]. Moreover, although accurate information on PET-G in waste plastics is currently unavailable, it is anticipated that the global market for PET-G will experience steady growth, increasing from USD 2748 million in 2023 to USD 3819 million in 2033, with a compound annual growth rate (CAGR) of 3.3% [
14].
Considering their distinct physical properties, PET and PET-G are commonly used in different forms. For instance, PET is widely used in beverage containers, while PET-G is commonly applied in electronic product packaging. Consequently, recycling facilities predominantly receive PET in the form of beverage containers and PET-G in the shape of rectangular packaging materials.
Machine learning plays an important role in decision-making applications [
15]. Also, the use of machine learning algorithms in waste-sorting processing facilities highlights its critical role in managing recyclable materials with robotic technology. These robots demand advanced visual and manipulation capabilities to effectively process diverse recyclable materials within complex industrial environments. Conventional automated systems have historically employed machine/computer vision to extract materials like metal, paper, glass, and plastic from waste streams. Robotic technology [
16,
17,
18], positioned as a more efficient and autonomous alternative, can support or replace current installations. In the context of machine vision, the analysis of multi-object images involves processes such as object identification (bounding box specification), localization (masking), and material type classification. This distinctive approach is crafted to precisely identify, locate, and categorize potentially overlapping recyclable materials within the same image, making it particularly suitable for industrial applications.
Object detection [
19,
20,
21,
22,
23,
24,
25,
26,
27] in deep learning involves both classifying objects into categories (classification) and determining their positions with bounding boxes (localization). This field can be broadly categorized into two main approaches: 1-stage detectors and 2-stage detectors. In 1-stage detectors like YOLO [
19,
20,
21,
22] and SSD [
23,
24], both the localization and classification tasks are performed concurrently, whereas in 2-stage detectors [
25,
26,
27], these tasks are carried out sequentially.
The YOLO model [
19,
20,
21,
22], being a representative 1-stage detector, has several advantages. Initially, it efficiently processes the entire image at once, eliminating the requirement for separate segmentation and analysis, as used in previous R-CNN-based methods. Secondly, YOLO employs a unified model that amalgamates region proposal, feature extraction, classification, and bounding box regression into one coherent framework, resulting in enhanced speed and facilitating real-time object detection. Thirdly, by operating on the entire image, YOLO effectively captures contextual information about objects and their surroundings, leading to reduced background errors. Lastly, the YOLO model demonstrates remarkable detection accuracy even when dealing with previously unseen images during the training phase, making it well-suited for swift image detection. In this study, the focus lies on utilizing the YOLO detector with a conveyor belt speed of 2m/s to classify plastics, specifically PET and PET-G, in the context of plastic sorting with different shapes.
The primary aim of this paper is to explore the recycling of substances with similar compositions but different shapes, which pose challenges for classification using conventional NIRS sorting systems based on chemical composition. To address these challenges, our proposed method incorporates image sensors and object detection deep learning algorithms to enable classification based on the shape and form of the plastics. In particular, with a focus on practical implementation within an industrial setting, a system has been developed through optical design considerations that take into account factors such as sorting speed and conveyor belt characteristics, which are prevalent in the field of plastic waste classification. The anticipated benefits of the proposed method include improved sorting accuracy and purity, reduced misclassification rates, and enhanced recycling efficiency, contributing to a more sustainable and effective plastic waste management system.
3. Proposed Plastic Waste Classification Method
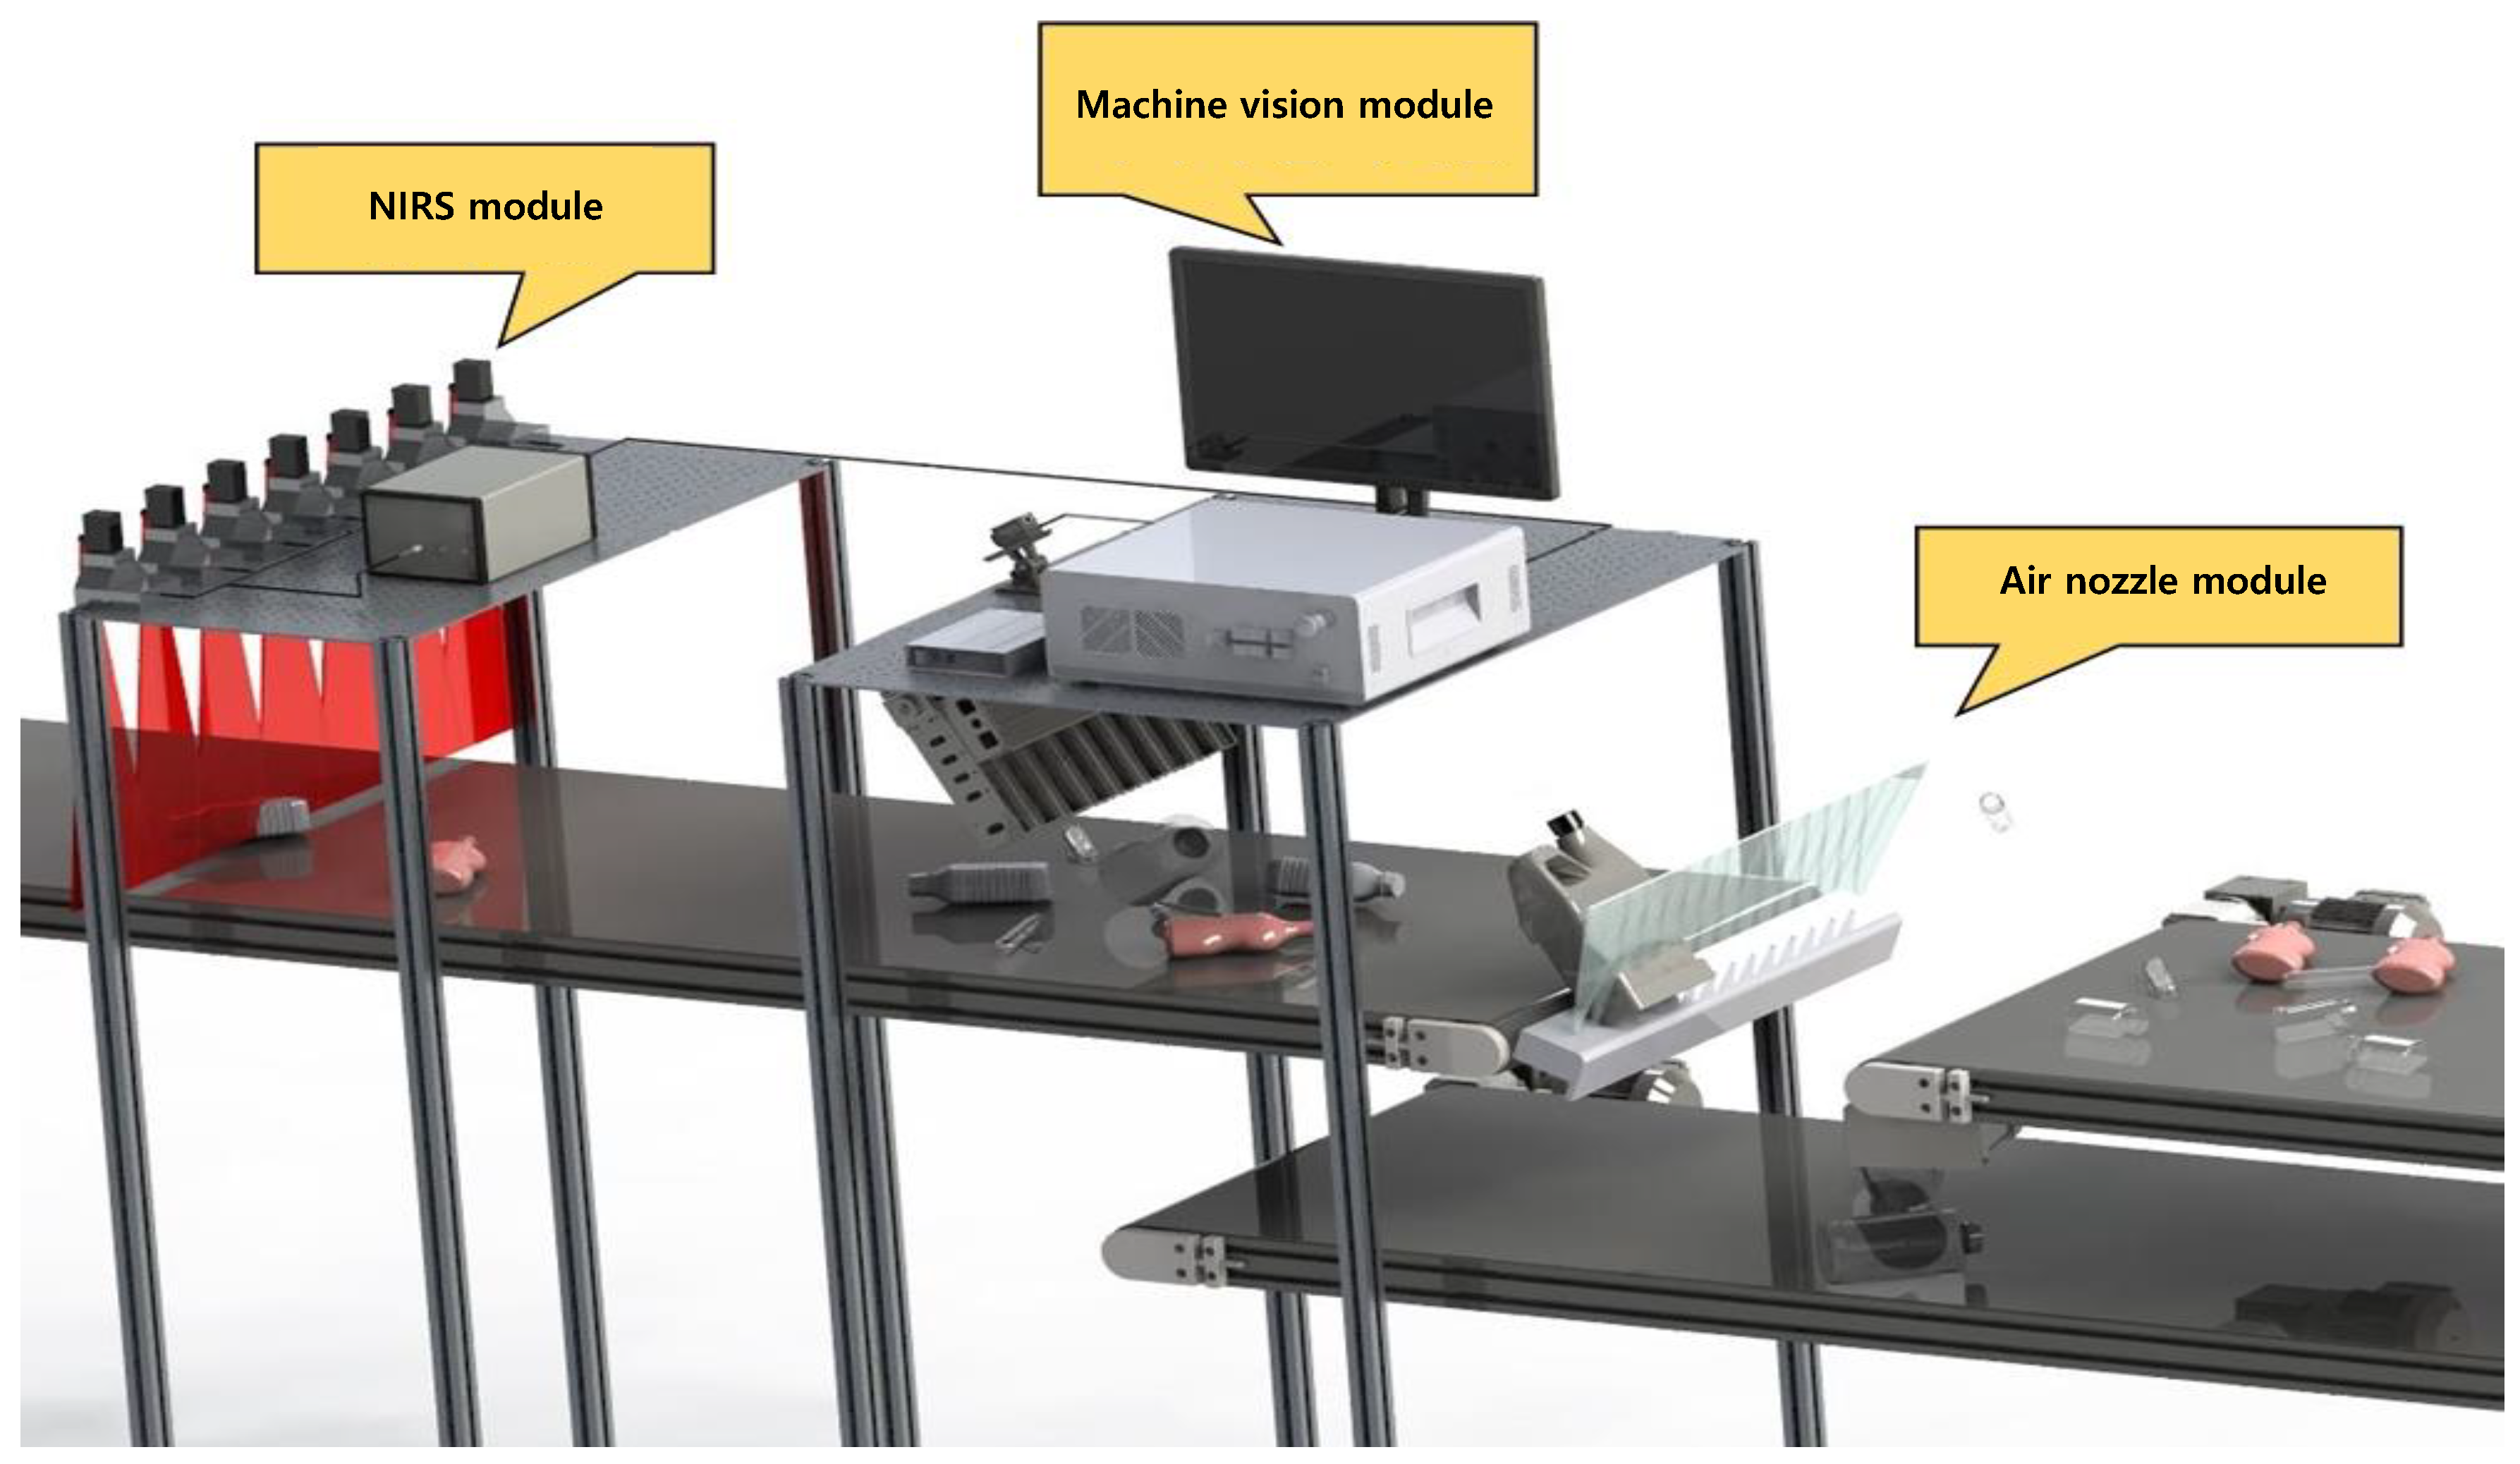
Figure 2 shows a proposed plastic waste classification system. It integrates the machine/computer vision (optical) module, deep learning-based image analysis module, and air nozzle module system. In this section, we describe the proposed methodology and the integrated system. In this research, we have integrated a vision-based classification system into an existing NIR-based classification system. Given the abundance of prior research focused on deep learning-based classification of waste plastics using NIR technology [
4,
8,
9], the incorporation of a machine vision-based system into the NIRS system promises a valuable avenue for comprehensive elemental and morphological analysis.
3.1. Optical System Design
The optical system design (
Figure 3) involves the selection of a depth camera and the construction of a plastic waste classification system. The depth camera (D455, Intel, Santa Clara, CA, USA) was selected based on criteria such as depth resolution, shutter type, pixel size, and frame rate. The D455 depth camera features a pixel size of 3 μm × 3 μm and is capable of measuring objects even at a distance of approximately 20 m. With a frame rate of 90 fps, it is well-suited for capturing images of plastics on a high-speed conveyor belt.
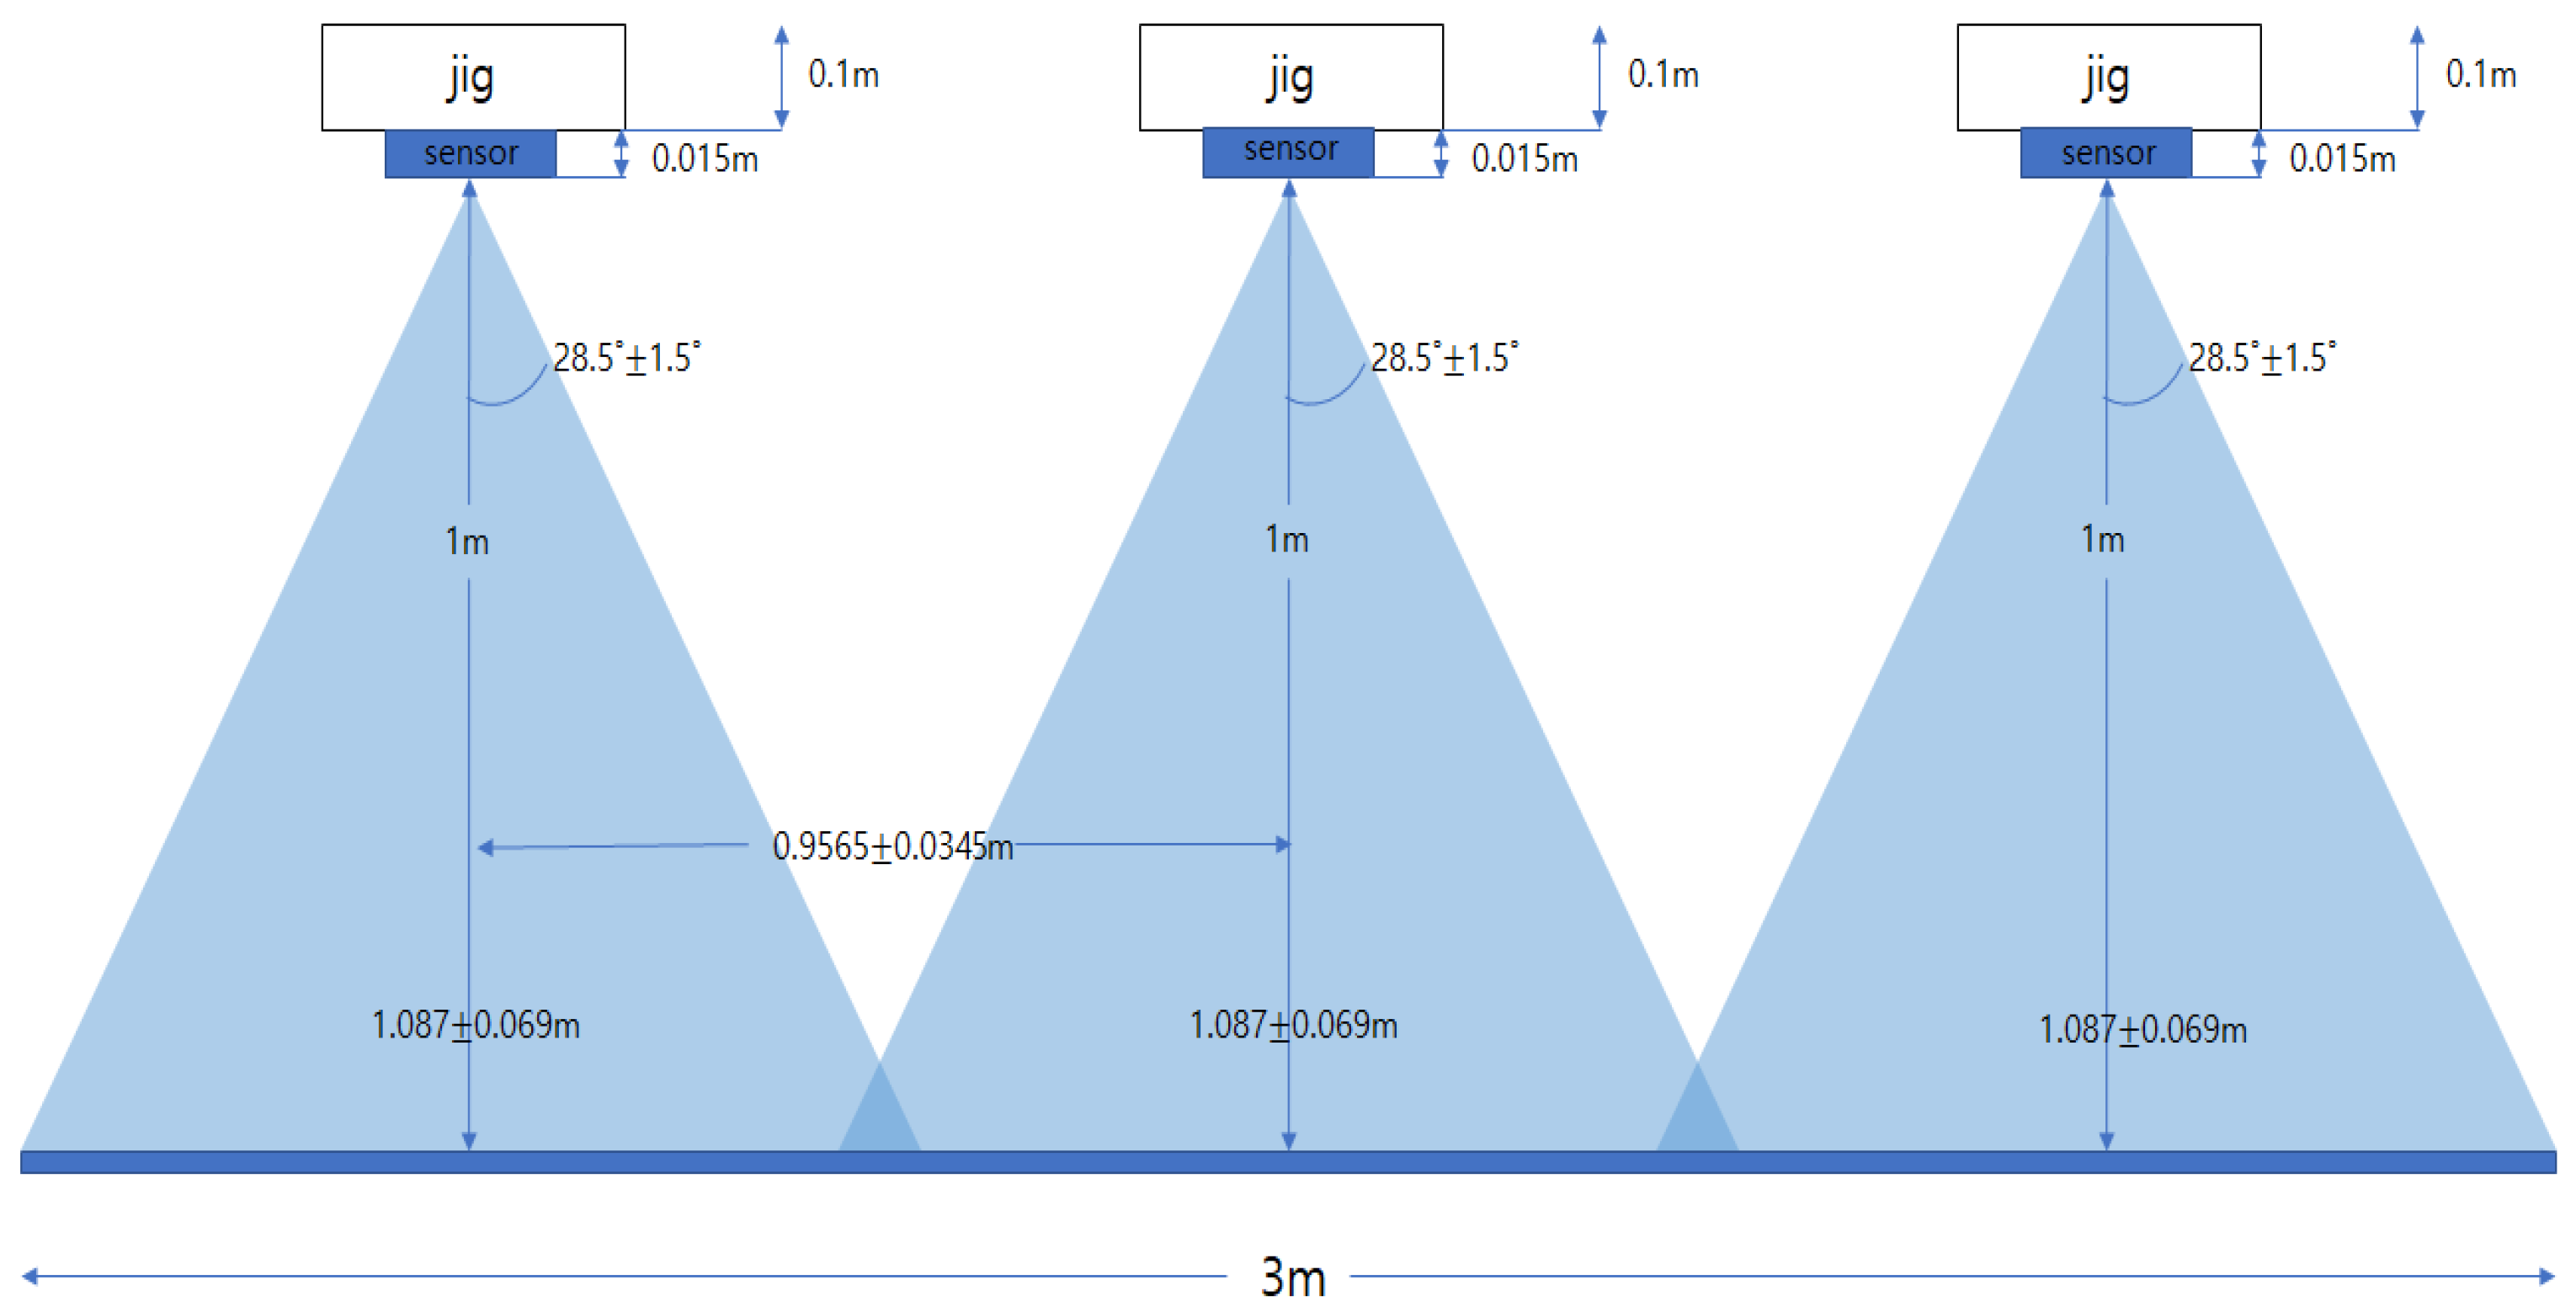
An optical system for morphology-based plastic waste classification was devised by integrating three machine/computer vision cameras into a multi-camera module. The system is designed to ensure that each of the three image sensors can capture data from a 1 m distance. To mitigate the effects of real-world factors such as dust and vibrations, the system was positioned at a height of 1 m above the conveyor belt. Furthermore, an optical setup capable of accommodating the practical sorting environment was constructed, enabling coverage of the 3-meter width of the conveyor belt. This setup allows for comprehensive coverage and accurate measurement of the plastics on the conveyor belt.
To classify the plastic waste, air nozzles are installed at the end of the conveyor belt. These air nozzles play a crucial role in the classification process by using pneumatic control. They are strategically placed to correspond with specific regions or samples on the conveyor belt. The machine/computer vision data are divided and matched to the number and position of the air nozzles, enabling communication and control through algorithms. This ensures that the appropriate air nozzle is activated based on the classification results.
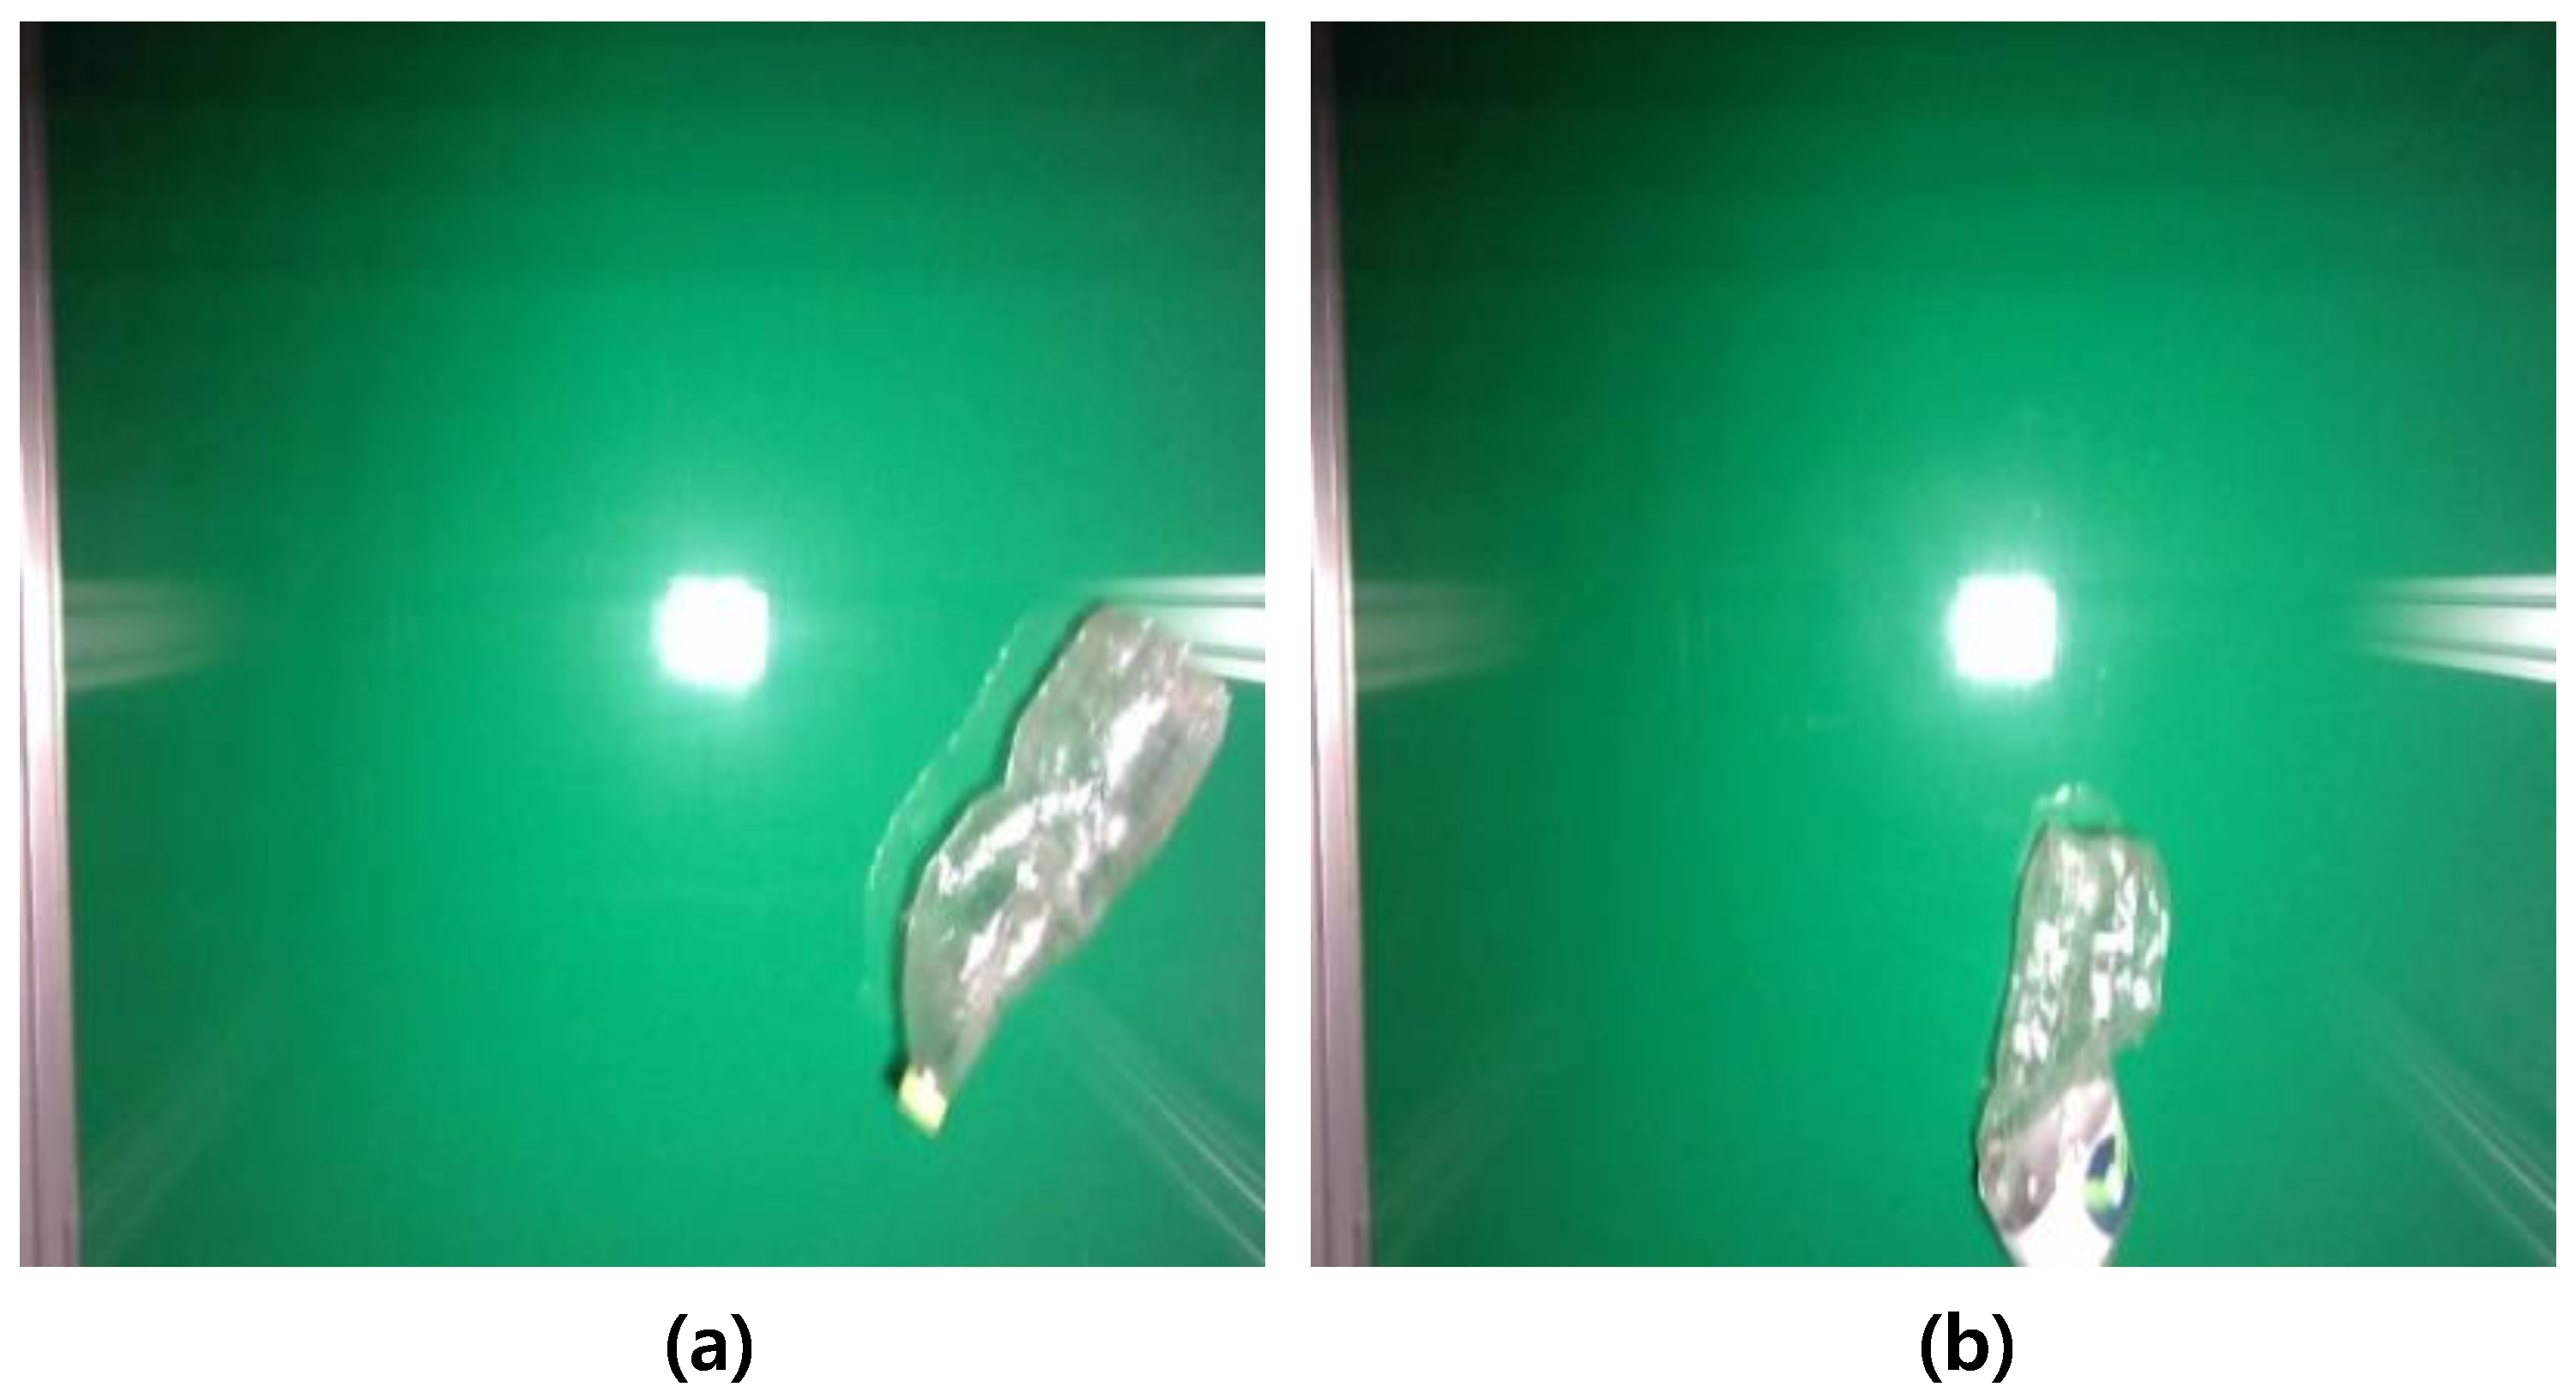
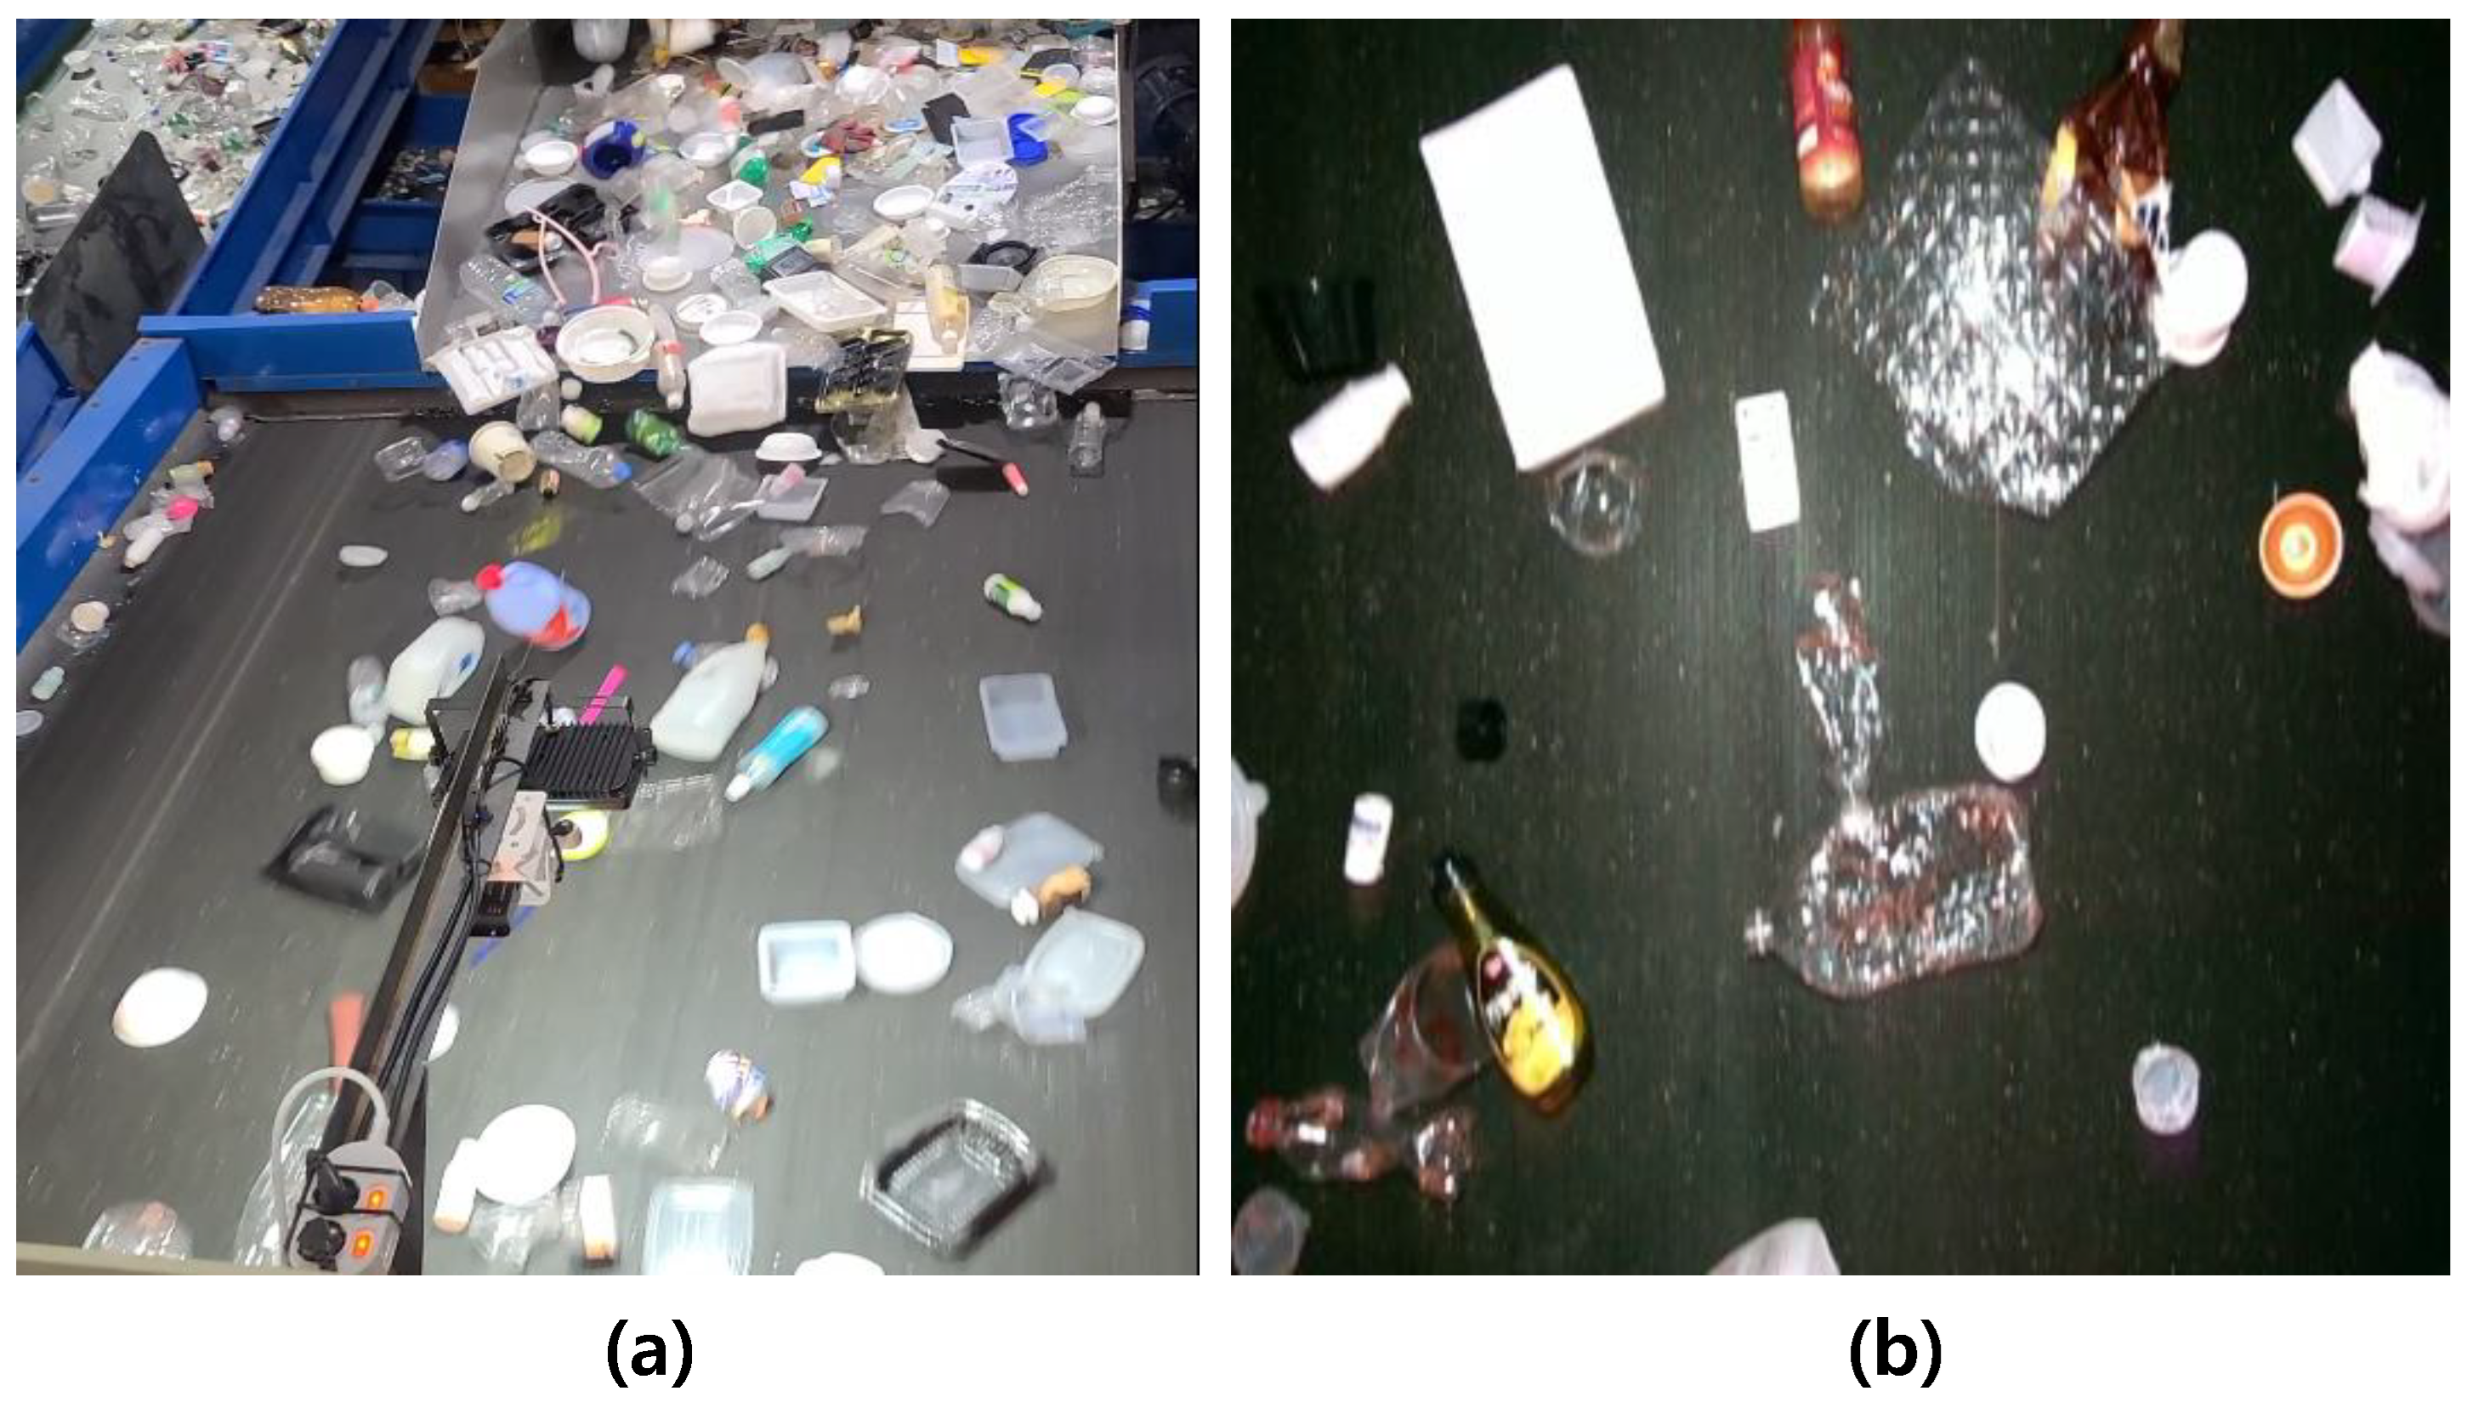
Based on the selection of key modules and the design of the optical system, the system was built to acquire data in real-world scenarios. The lighting conditions were determined through tests to ensure the measurement of objects on the fast-moving conveyor belt, and the exposure function of the RGB camera was utilized for exposure control. As you can see in
Figure 4, the sharpness of the image can be adjusted by controlling the exposure time. In
Figure 4a of the PET bottle, the image was obtained with an exposure time of 10 ms, while
Figure 4b was obtained with an exposure time of 5 ms. It can be observed that the image with a 5 ms exposure time is sharper. Additionally, as the exposure time decreases, the overall brightness of the image changes. Therefore, the brightness was adjusted by controlling the intensity of the lighting and applied to the classification system.
3.2. Proposed Waste Classification System with Development of Deep Learning Classification Algorithm Based on Field Data
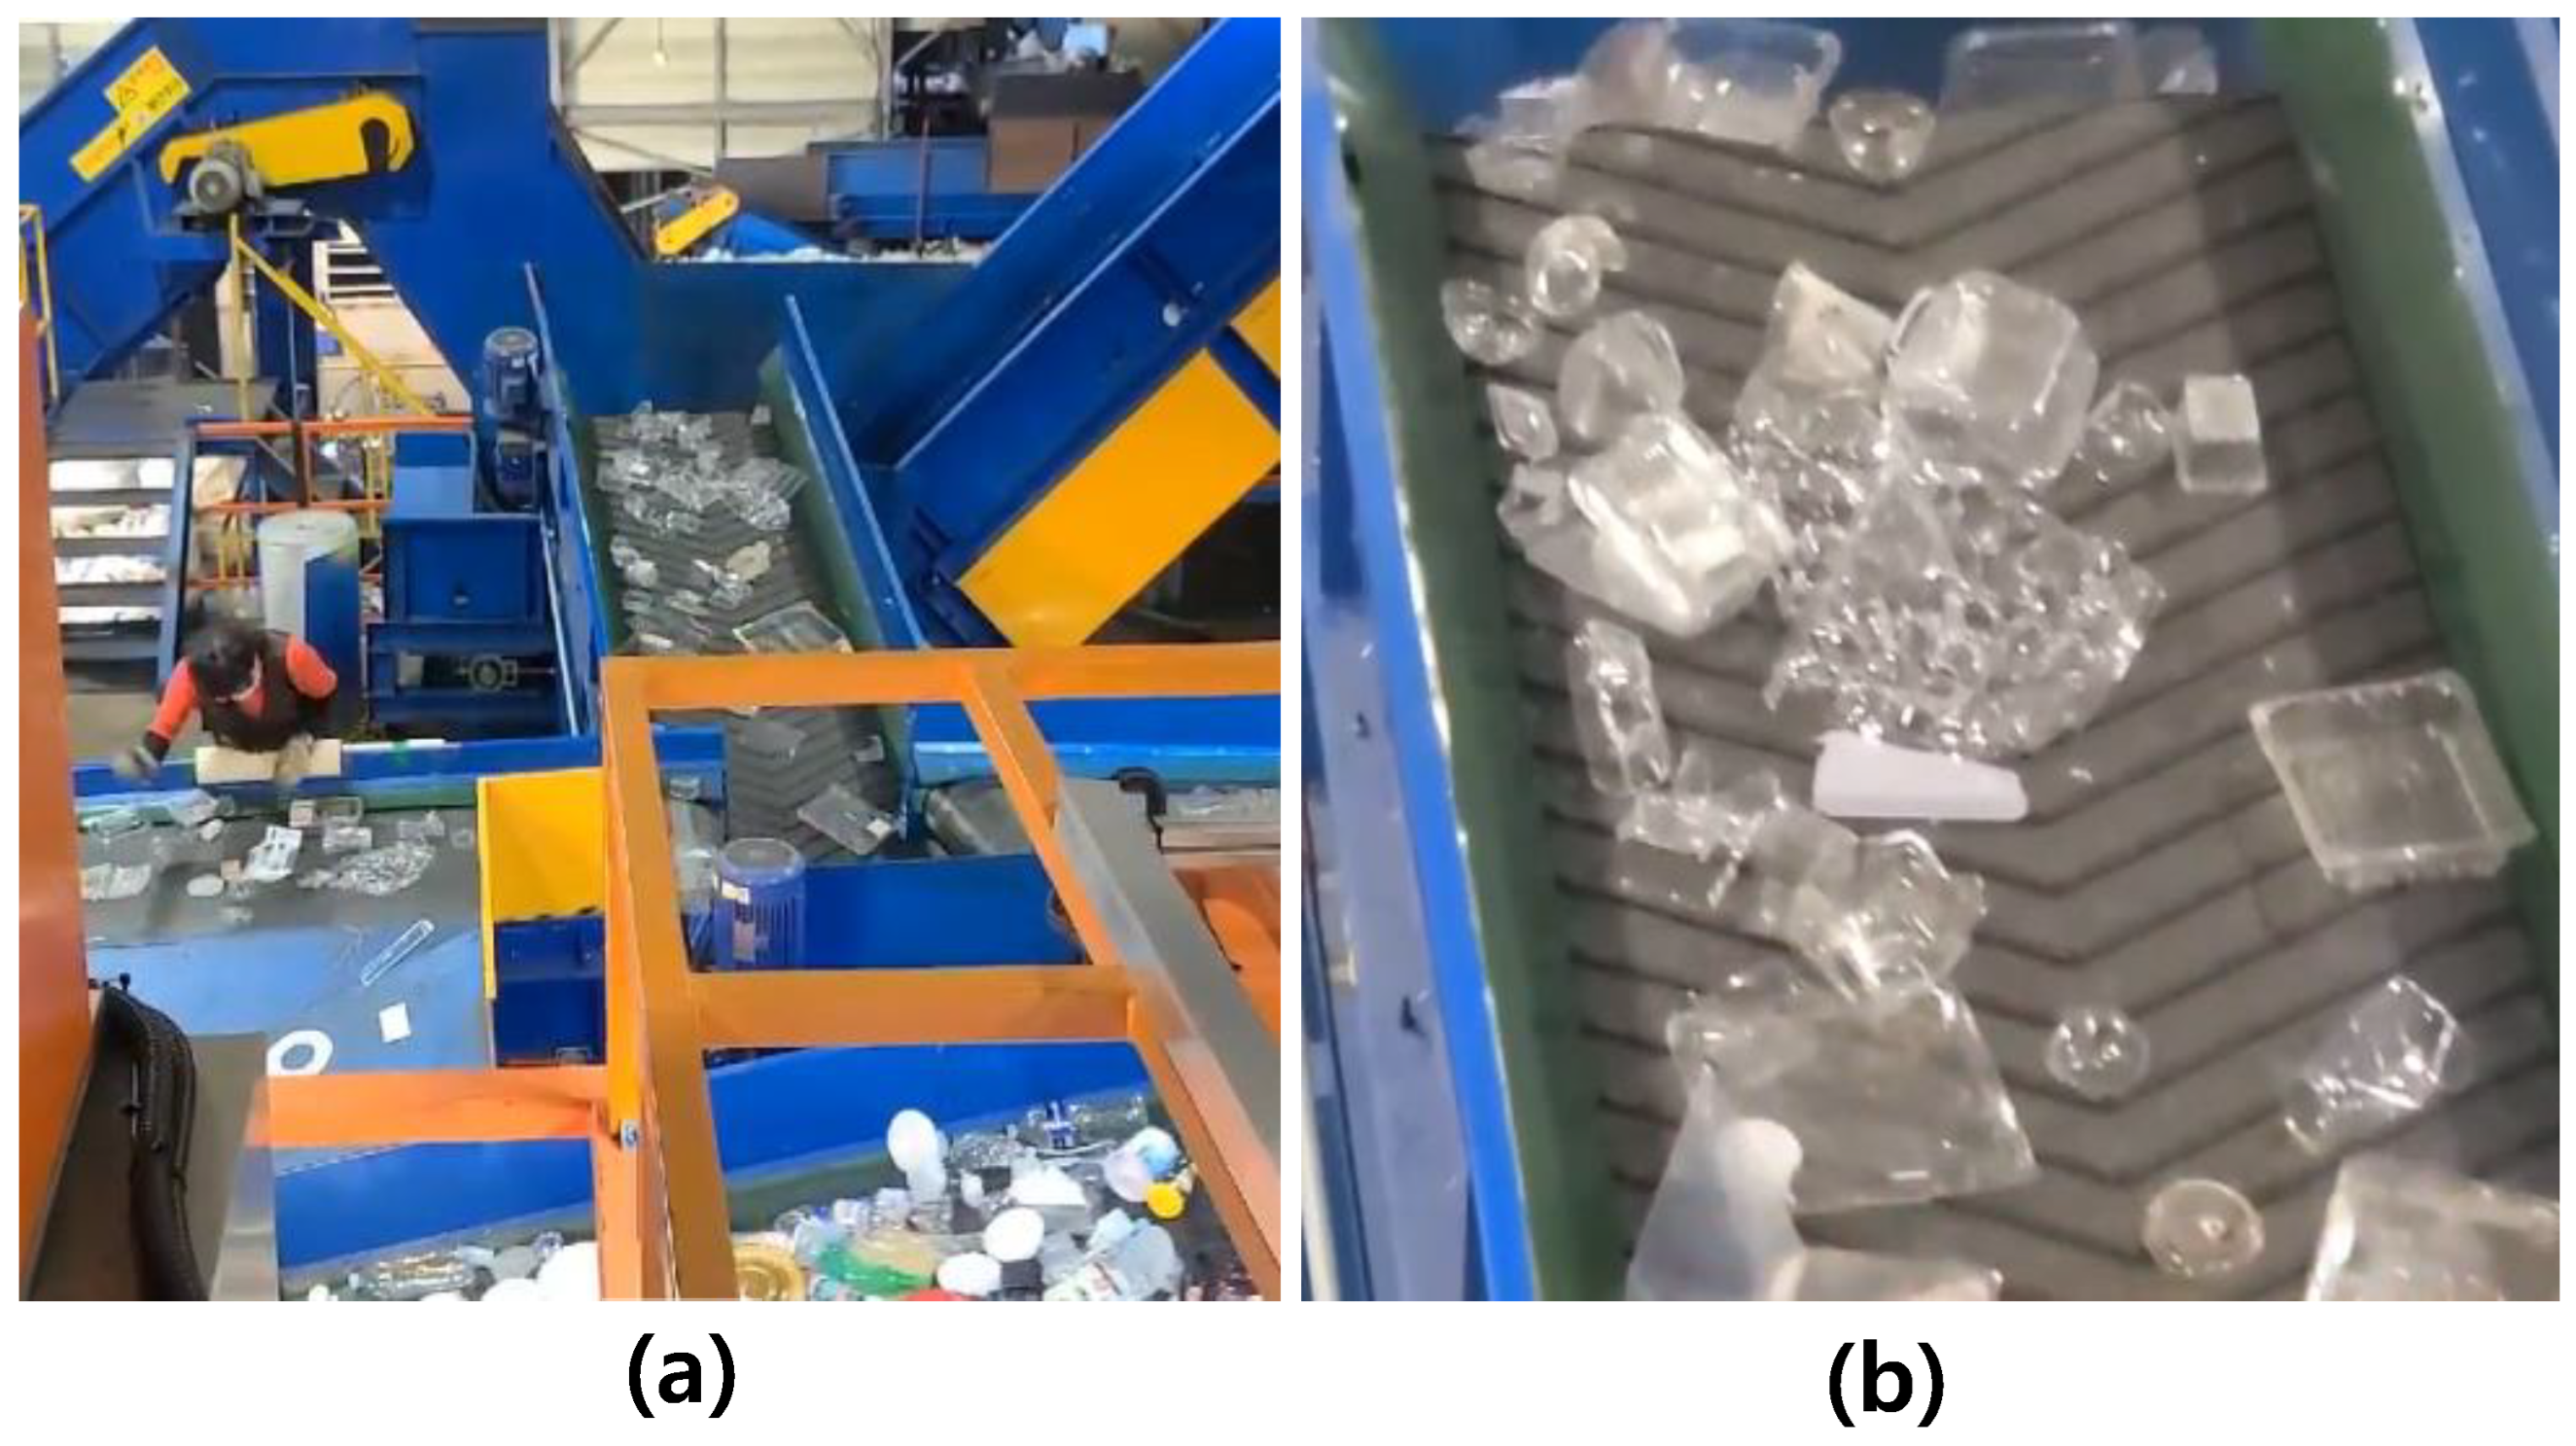
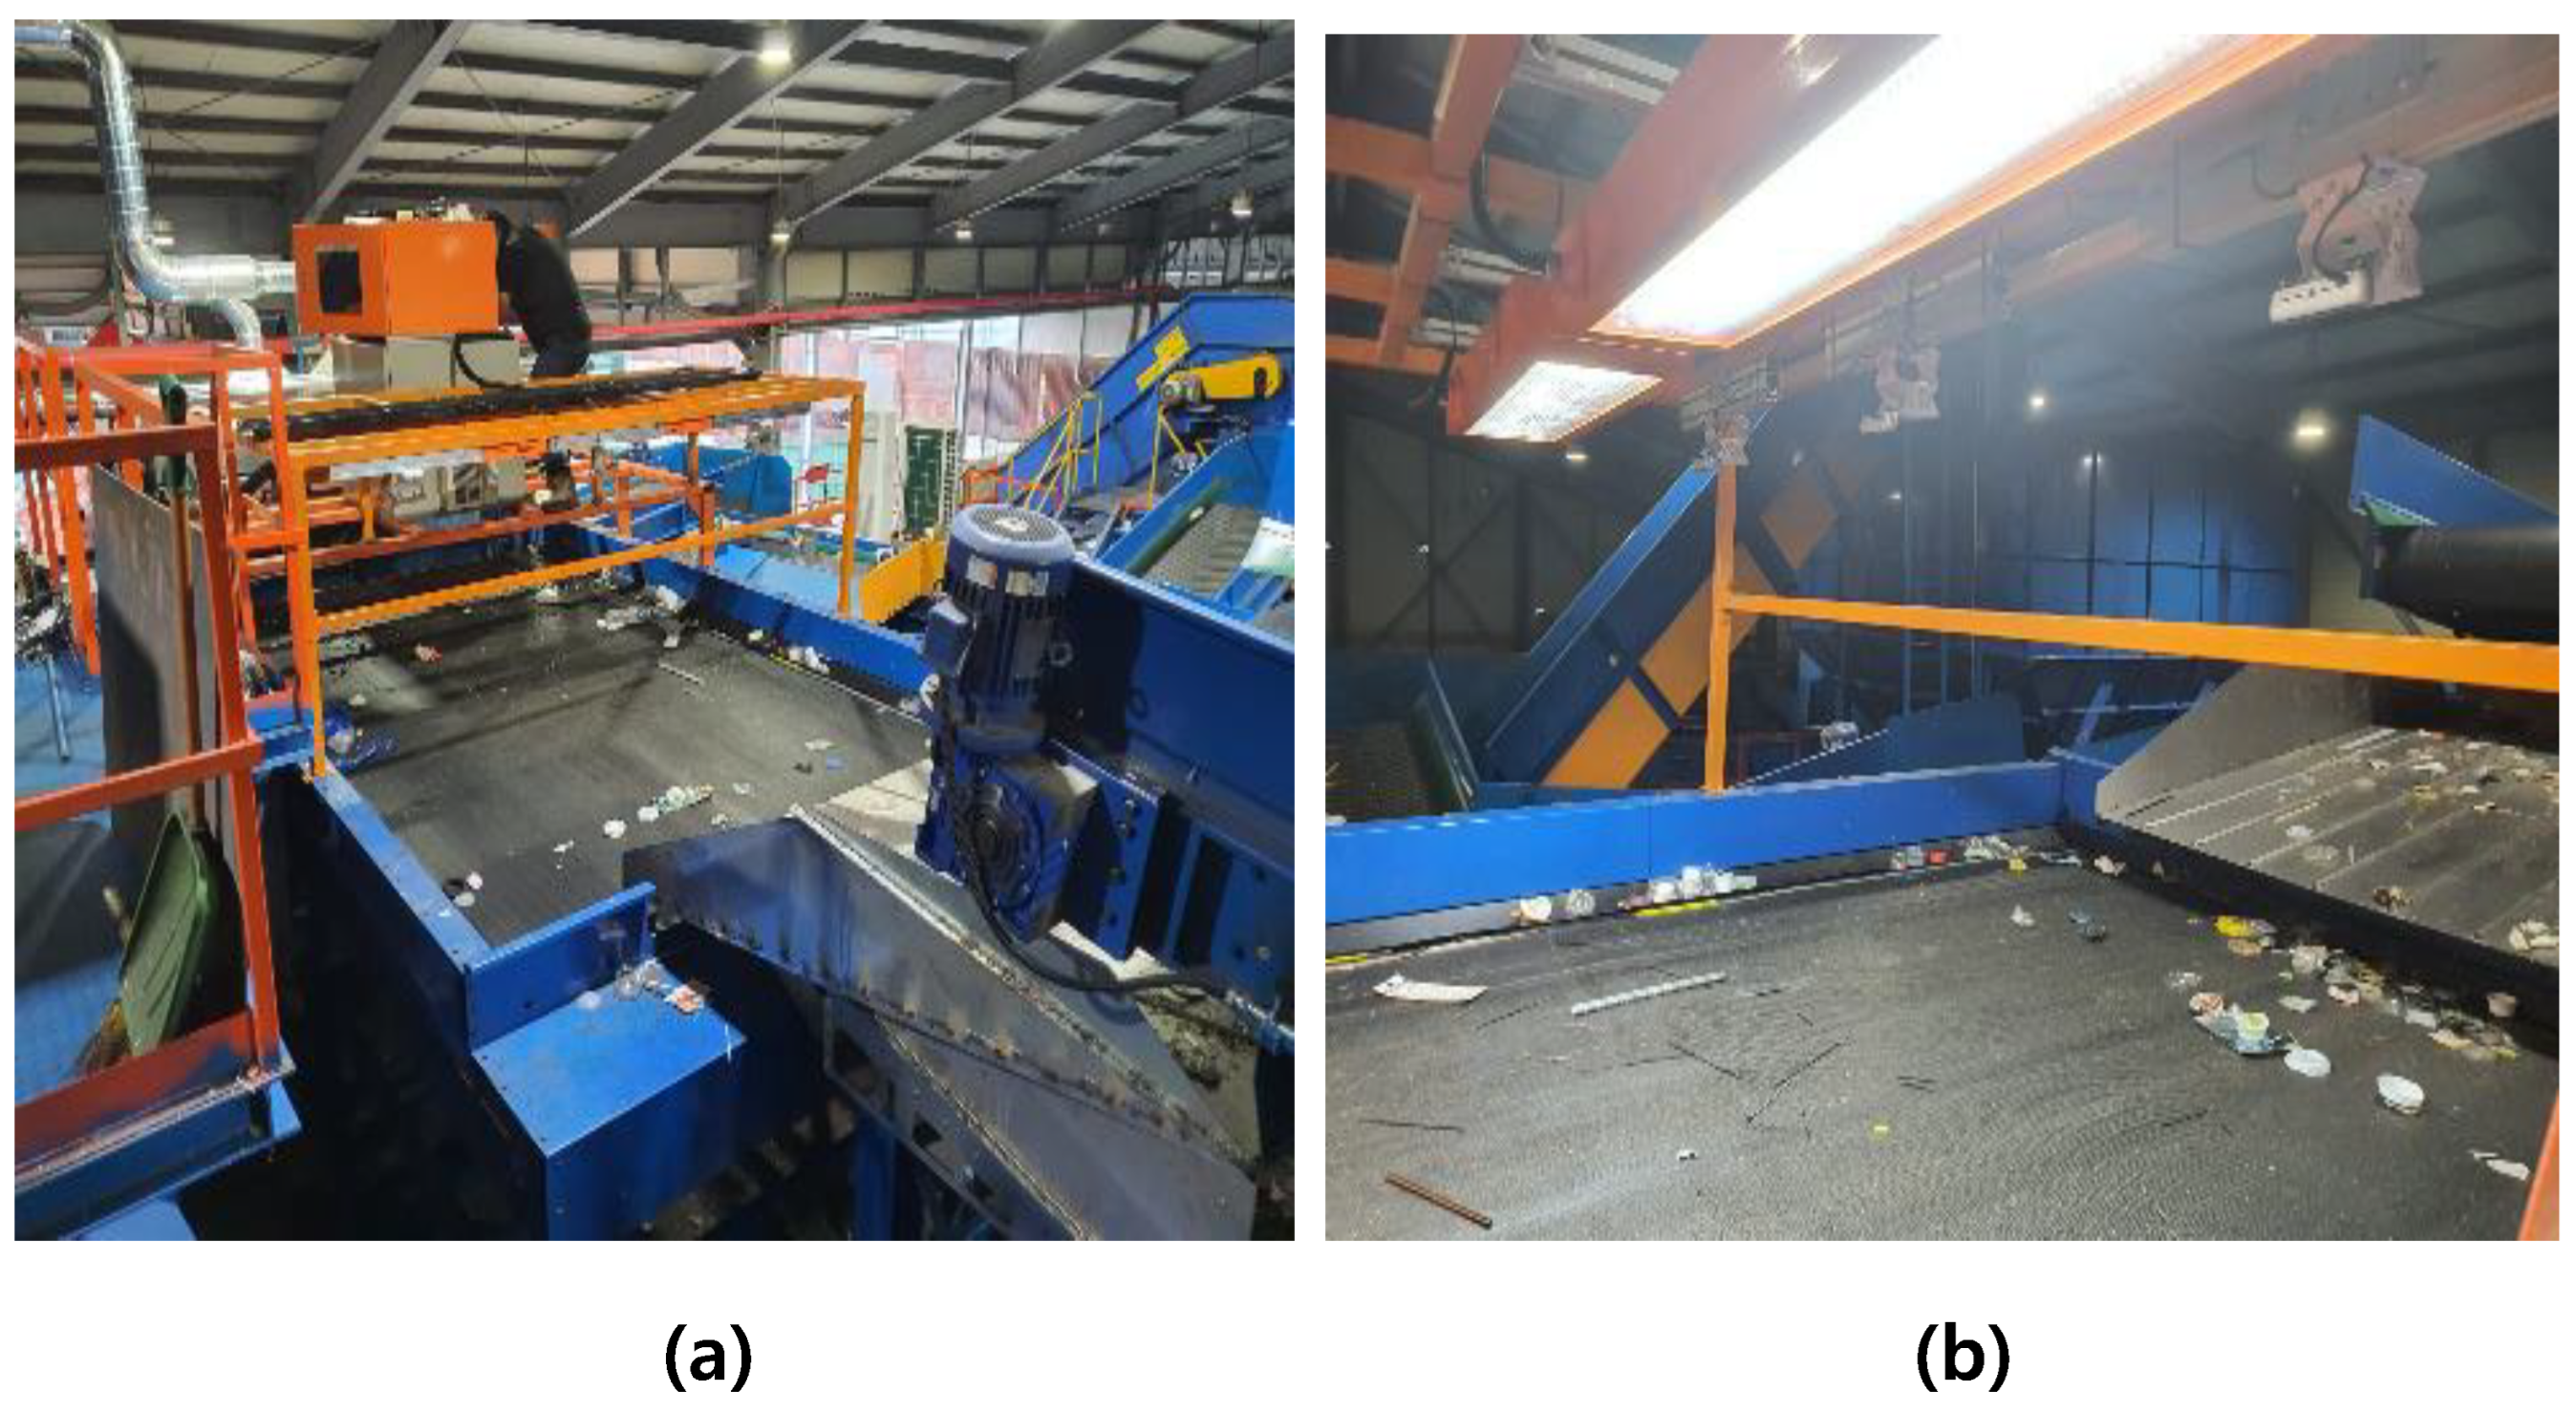
The proposed waste classification system aims to develop a deep learning classification algorithm based on field data. Real-world plastic waste classification data is acquired from the conveyor belt (
Figure 5a), which moves at a speed of 2 m per s. These data are essential for training and developing an accurate deep learning algorithm specifically tailored for the classification of PET and PET-G plastics in
Figure 5b.
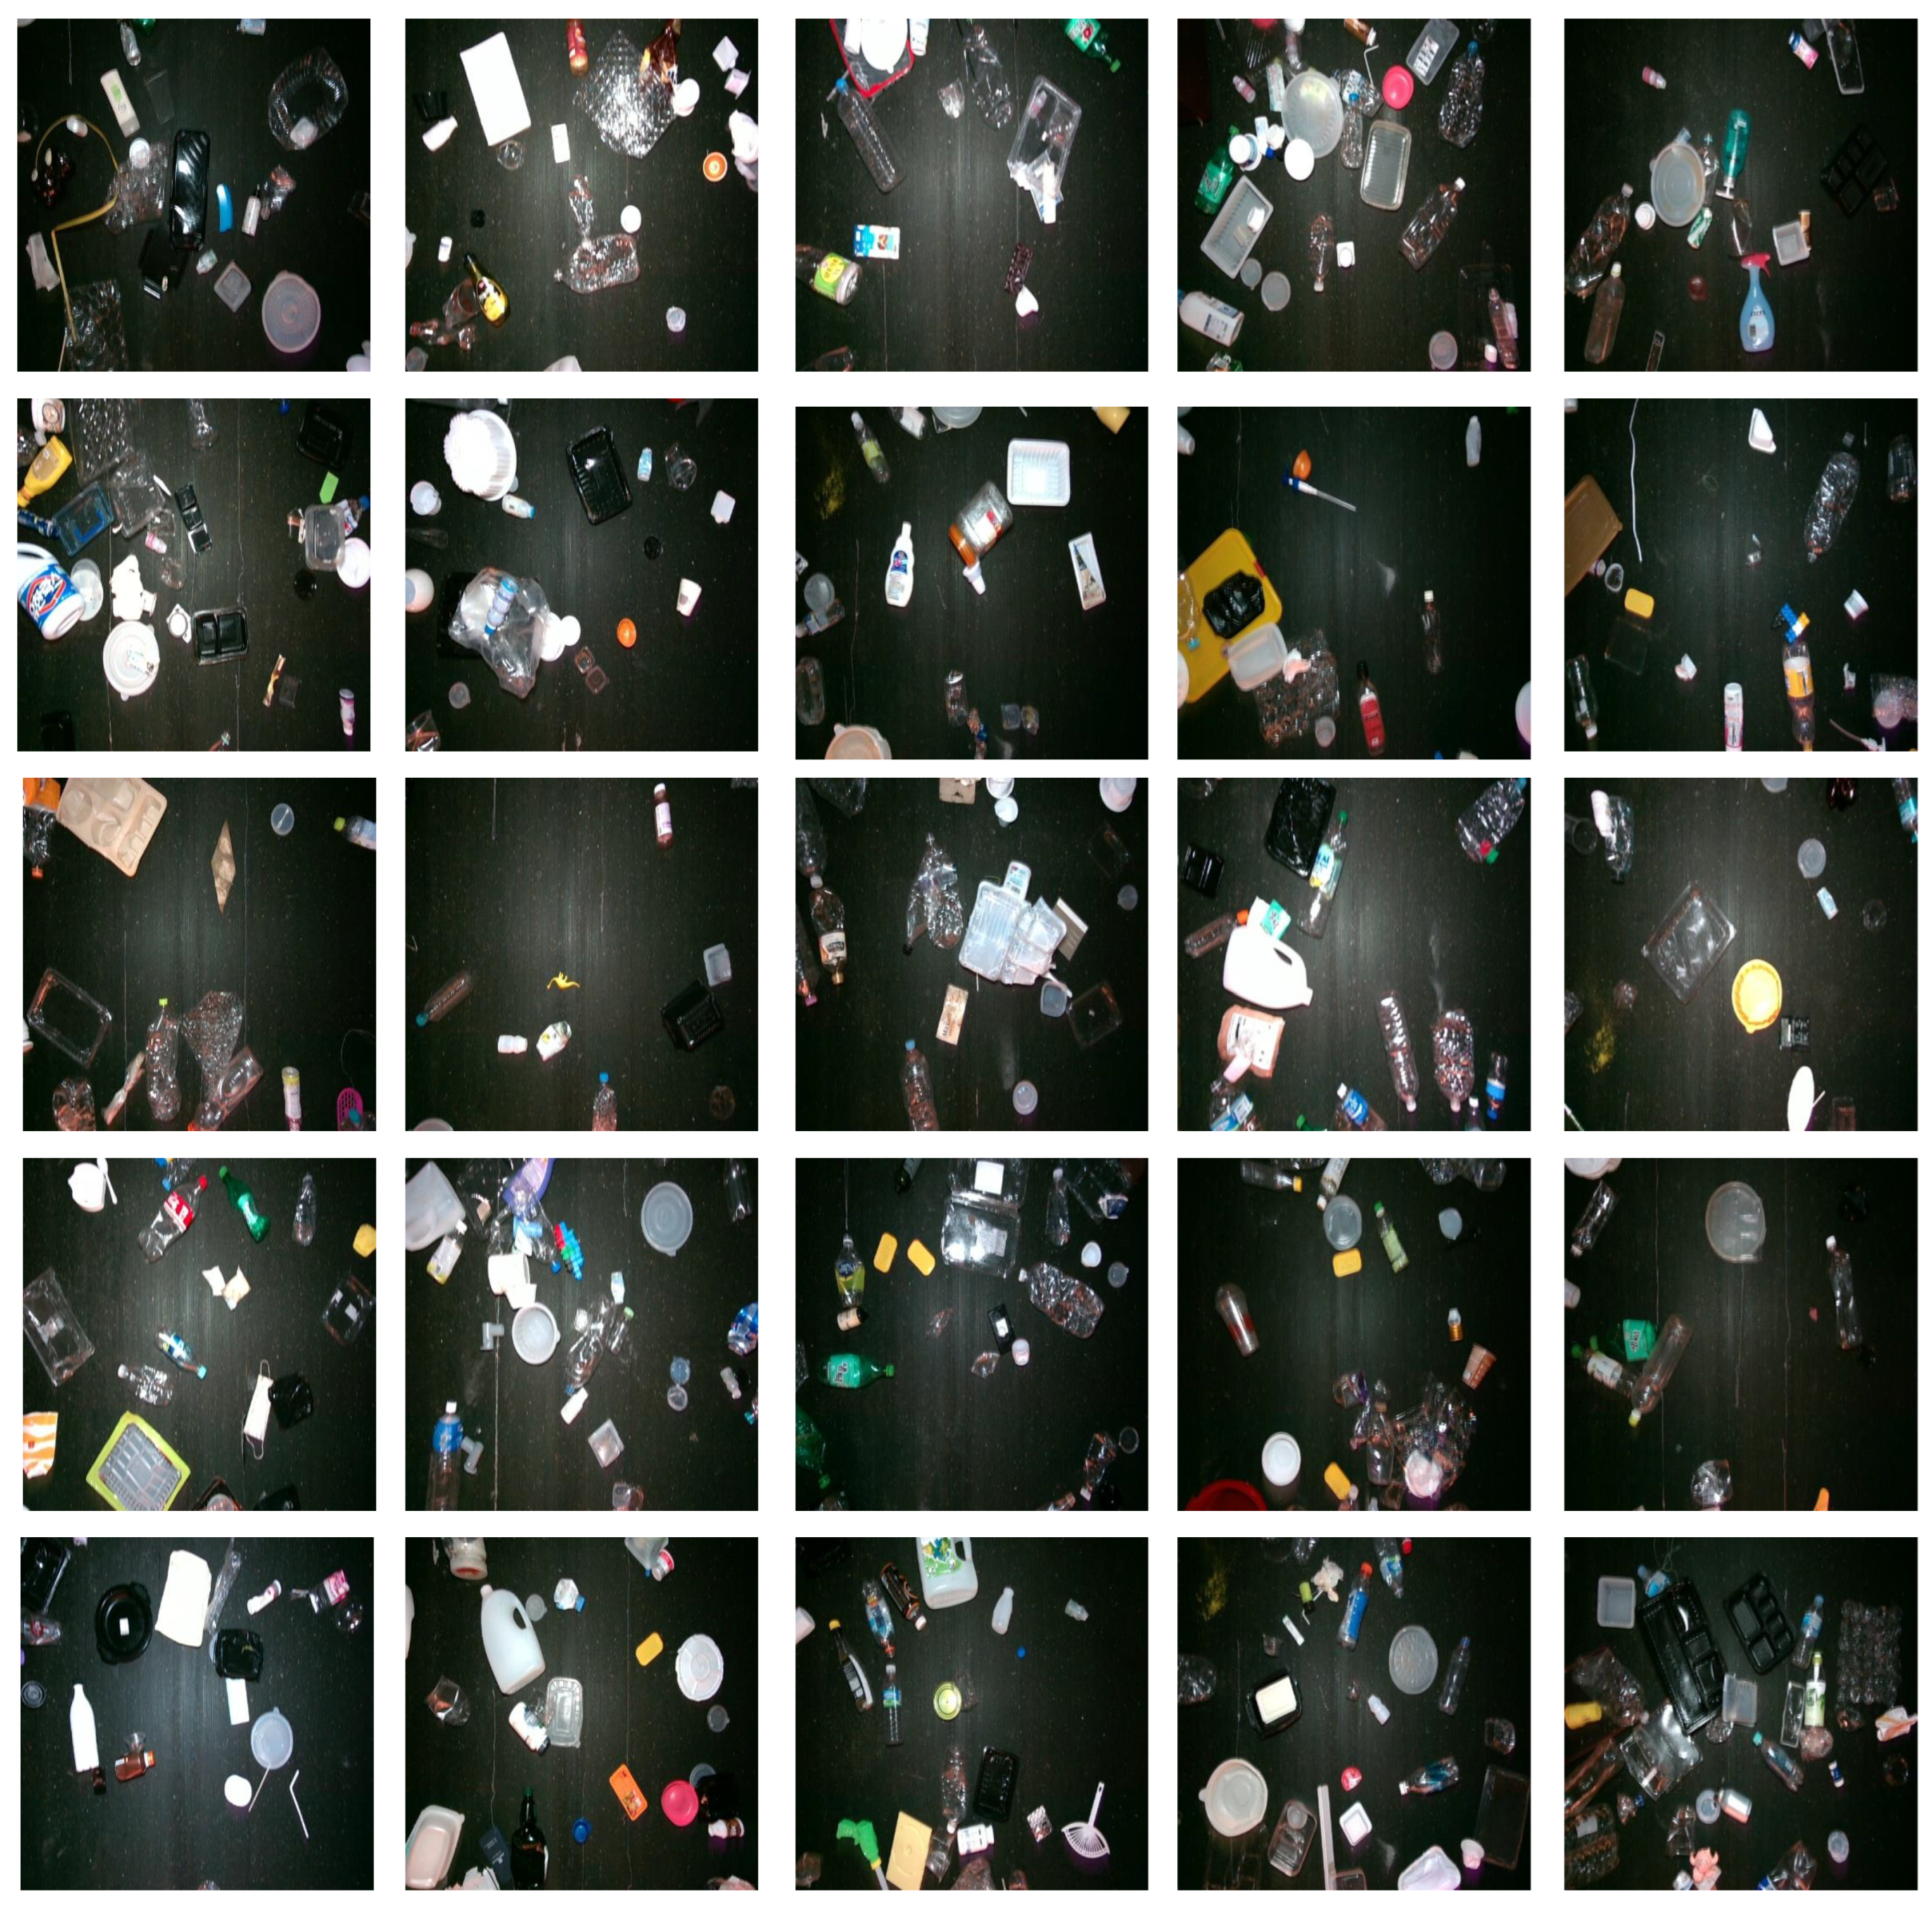
The deep learning algorithm is trained on the augmented dataset (
Figure 6), consisting of a wide range of variations in plastic waste samples. The algorithm learns to recognize and classify different types of plastics based on their visual features, patterns, and characteristics. The training process involves optimizing the network’s parameters, adjusting the model architecture, and fine-tuning the algorithm to achieve high accuracy and reliable classification results.
The proposed waste classification system combines the developed deep learning algorithm with the optical system to create an integrated solution. The real-time data captured by the machine/computer vision cameras are fed into the deep learning algorithm, which performs inference and classifies the plastic waste in real-time. The data are communicated to control the nozzles through communication with the air nozzle controller, to control the air nozzles, and to activate the relevant ones for pneumatic sorting of the classified samples.
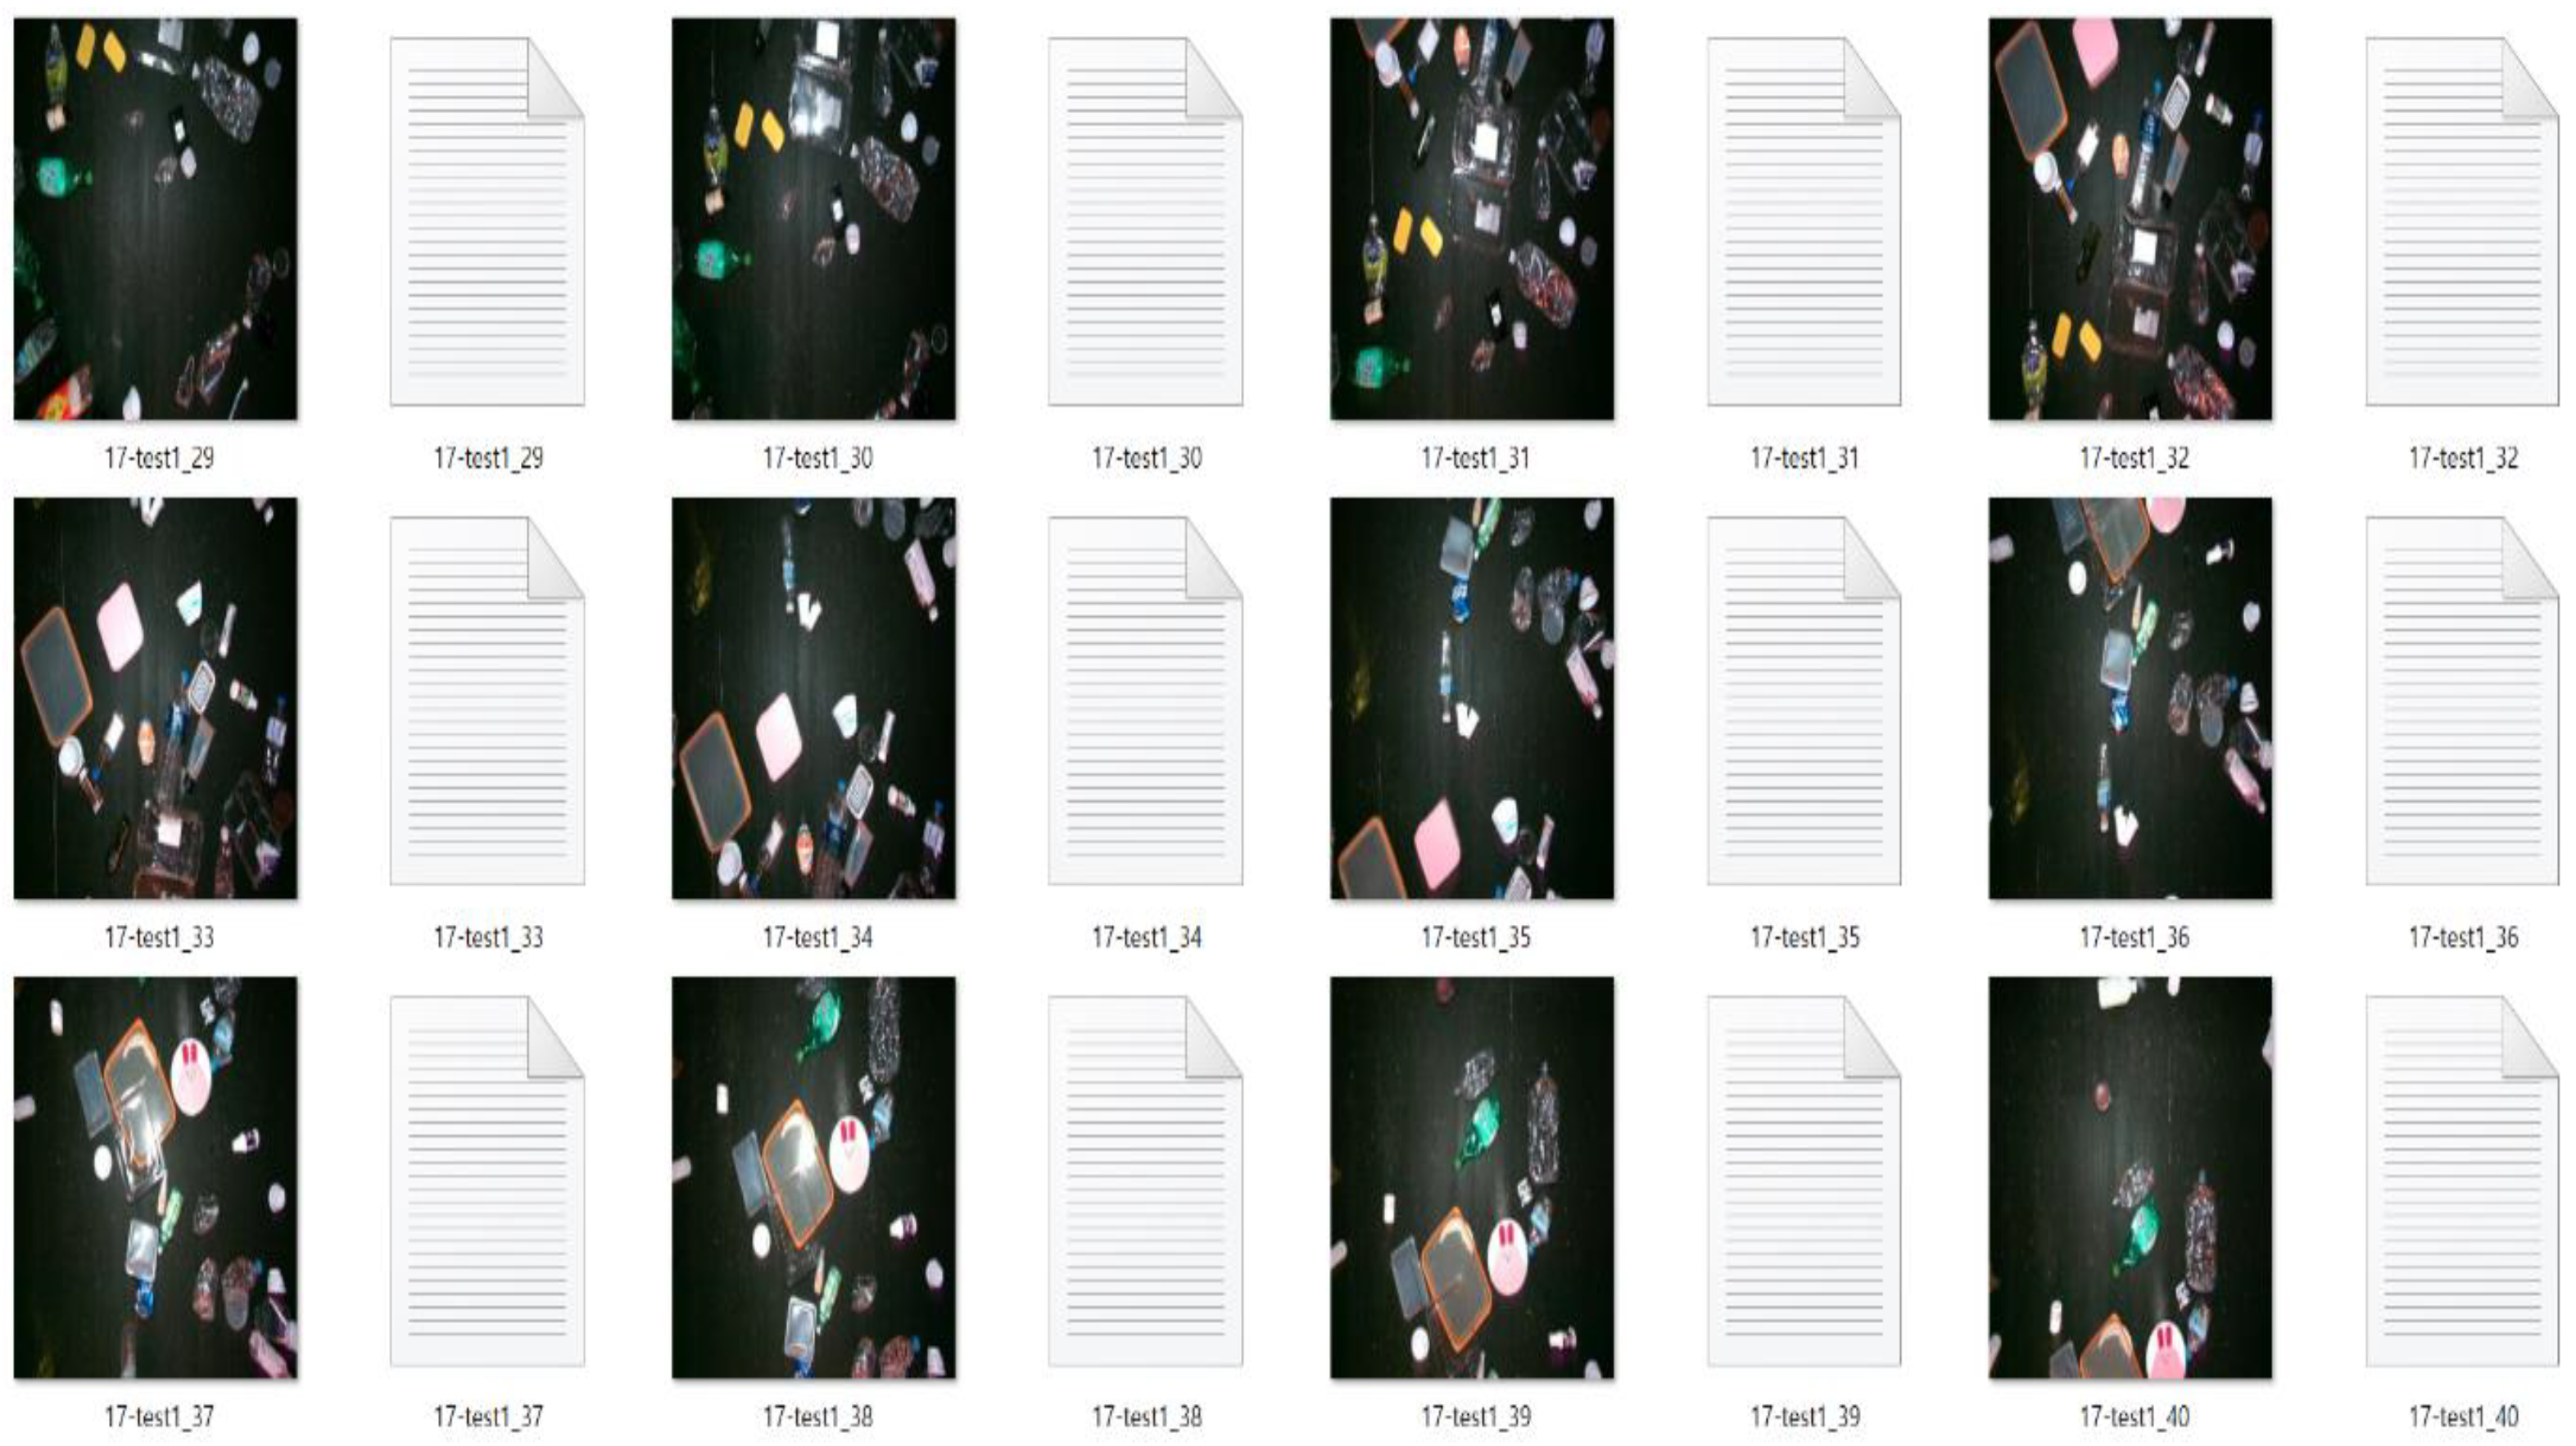
Data labeling (
Figure 7) and augmentation techniques are employed to address potential issues of insufficient data or overfitting during the deep learning process. Despite acquiring a substantial amount of data from the field, additional data augmentation is performed to further enhance the learning process and improve the classification accuracy. The captured images were augmented by rotating, zooming, and other techniques, resulting in a dataset that was 25 times larger than the original (increased from 2000 to 50,000 data samples). By applying these transformations, the dataset is significantly expanded, resulting in a more robust and diverse training set.
3.3. YOLO-Based Object Detection
The utilization of the YOLO algorithm for object detection plays a critical role in the real-time image capture and classification process. YOLO-v8 is integrated into the system to enable fast and accurate detection of plastic waste objects.
The depth cameras capture images of the conveyor belt, and these images are fed into the YOLO-v8 algorithm for analysis. YOLO-v8 employs a single neural network architecture that simultaneously performs both object localization and classification. This means that instead of examining the image multiple times, as conducted by other algorithms, the YOLO model divides the image into a grid and predicts the bounding boxes and class probabilities directly.
The YOLO-v8 algorithm processes the images in real-time, swiftly detecting the presence of plastic waste objects. It generates bounding box coordinates, which indicate the precise location of each detected object within the image. Additionally, the algorithm assigns class labels to the detected objects, indicating the type of plastic waste they belong to (e.g., PET or PET-G).
The inference process of the YOLO-v8 algorithm is highly optimized, enabling efficient execution and real-time performance. This capability is of utmost importance in waste-sorting applications where quick decision making is necessary to ensure the timely and accurate classification of plastic waste.
Upon obtaining the inference results from the YOLO-v8 algorithm, the system proceeds to communicate these results to the air nozzles positioned at the end of the conveyor belt. This communication is facilitated through the Modbus TCP communication interface, ensuring seamless data transfer.
3.4. Interface of the Field Classification Module
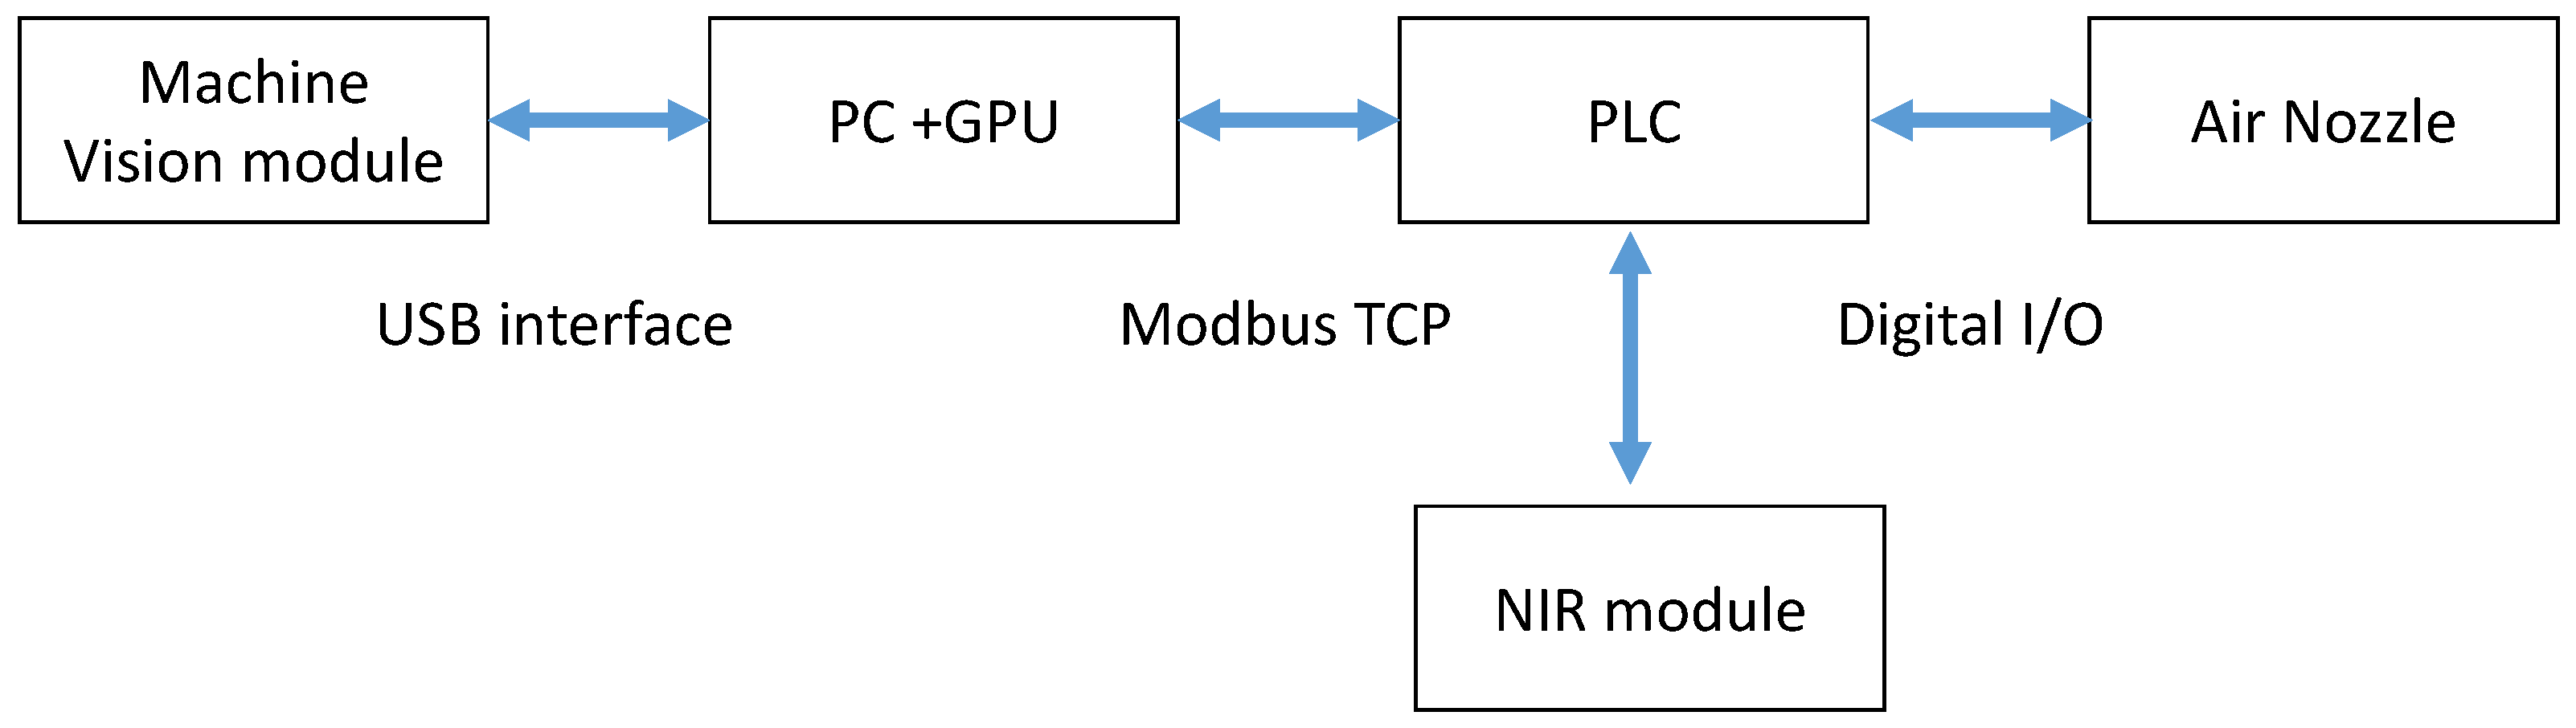
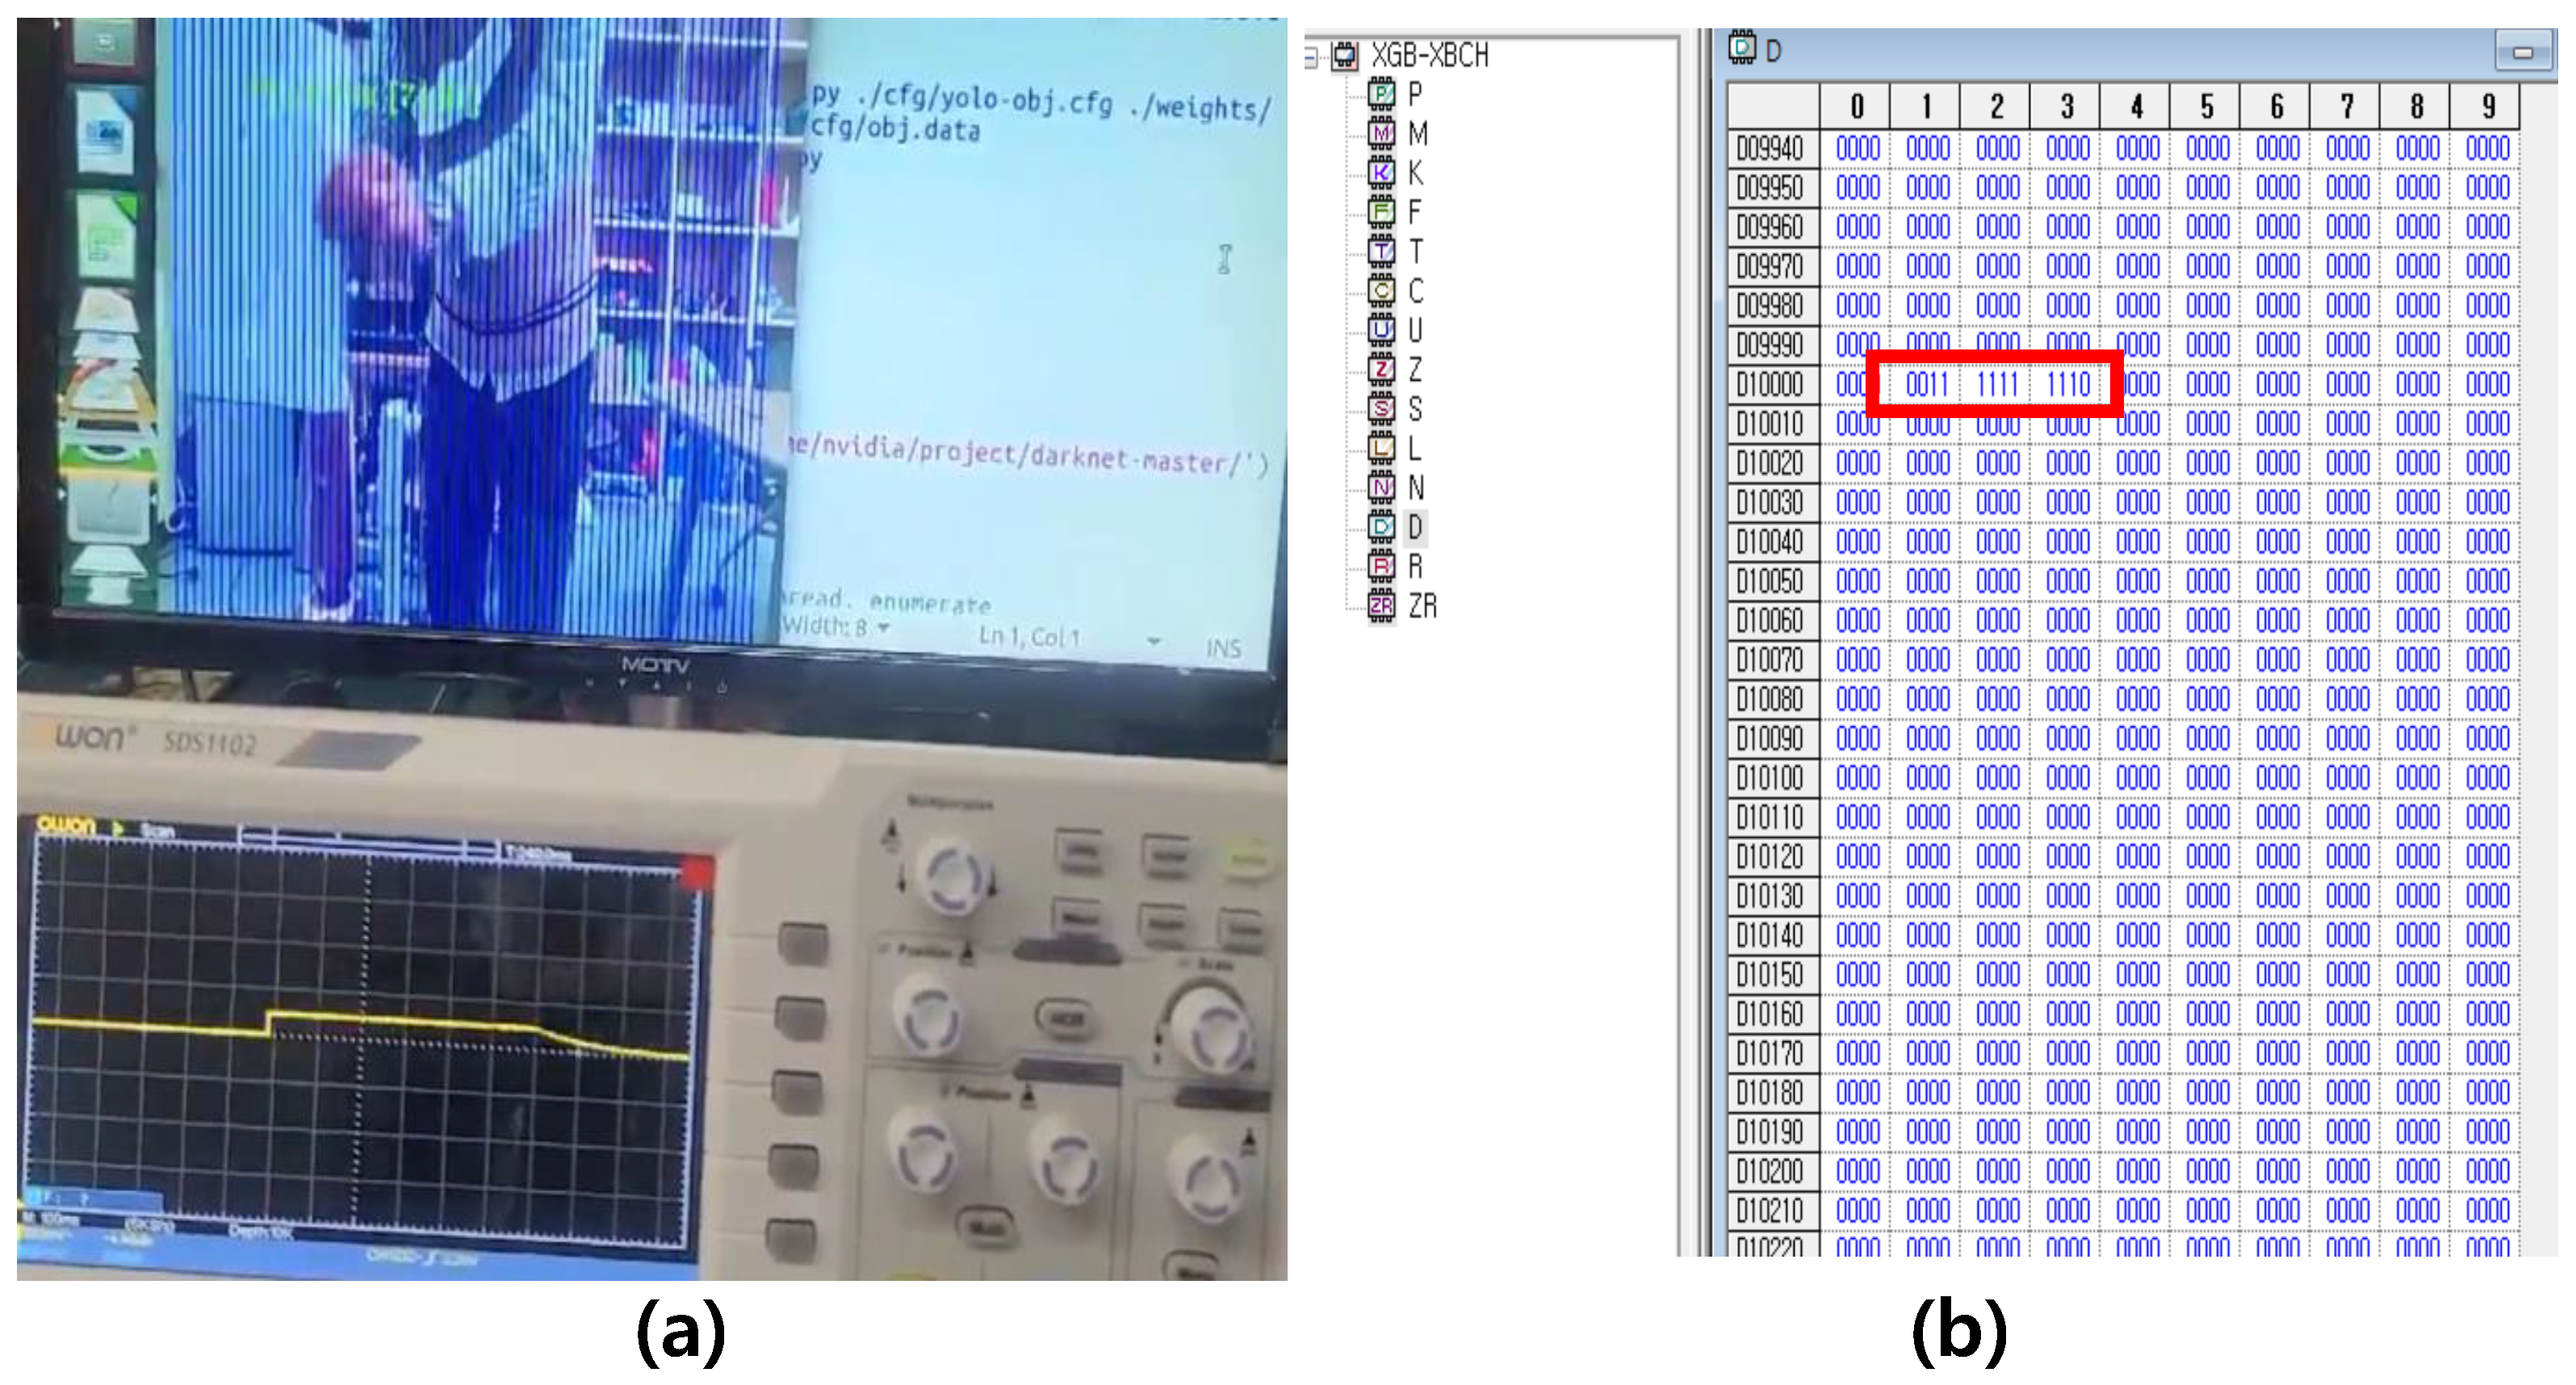
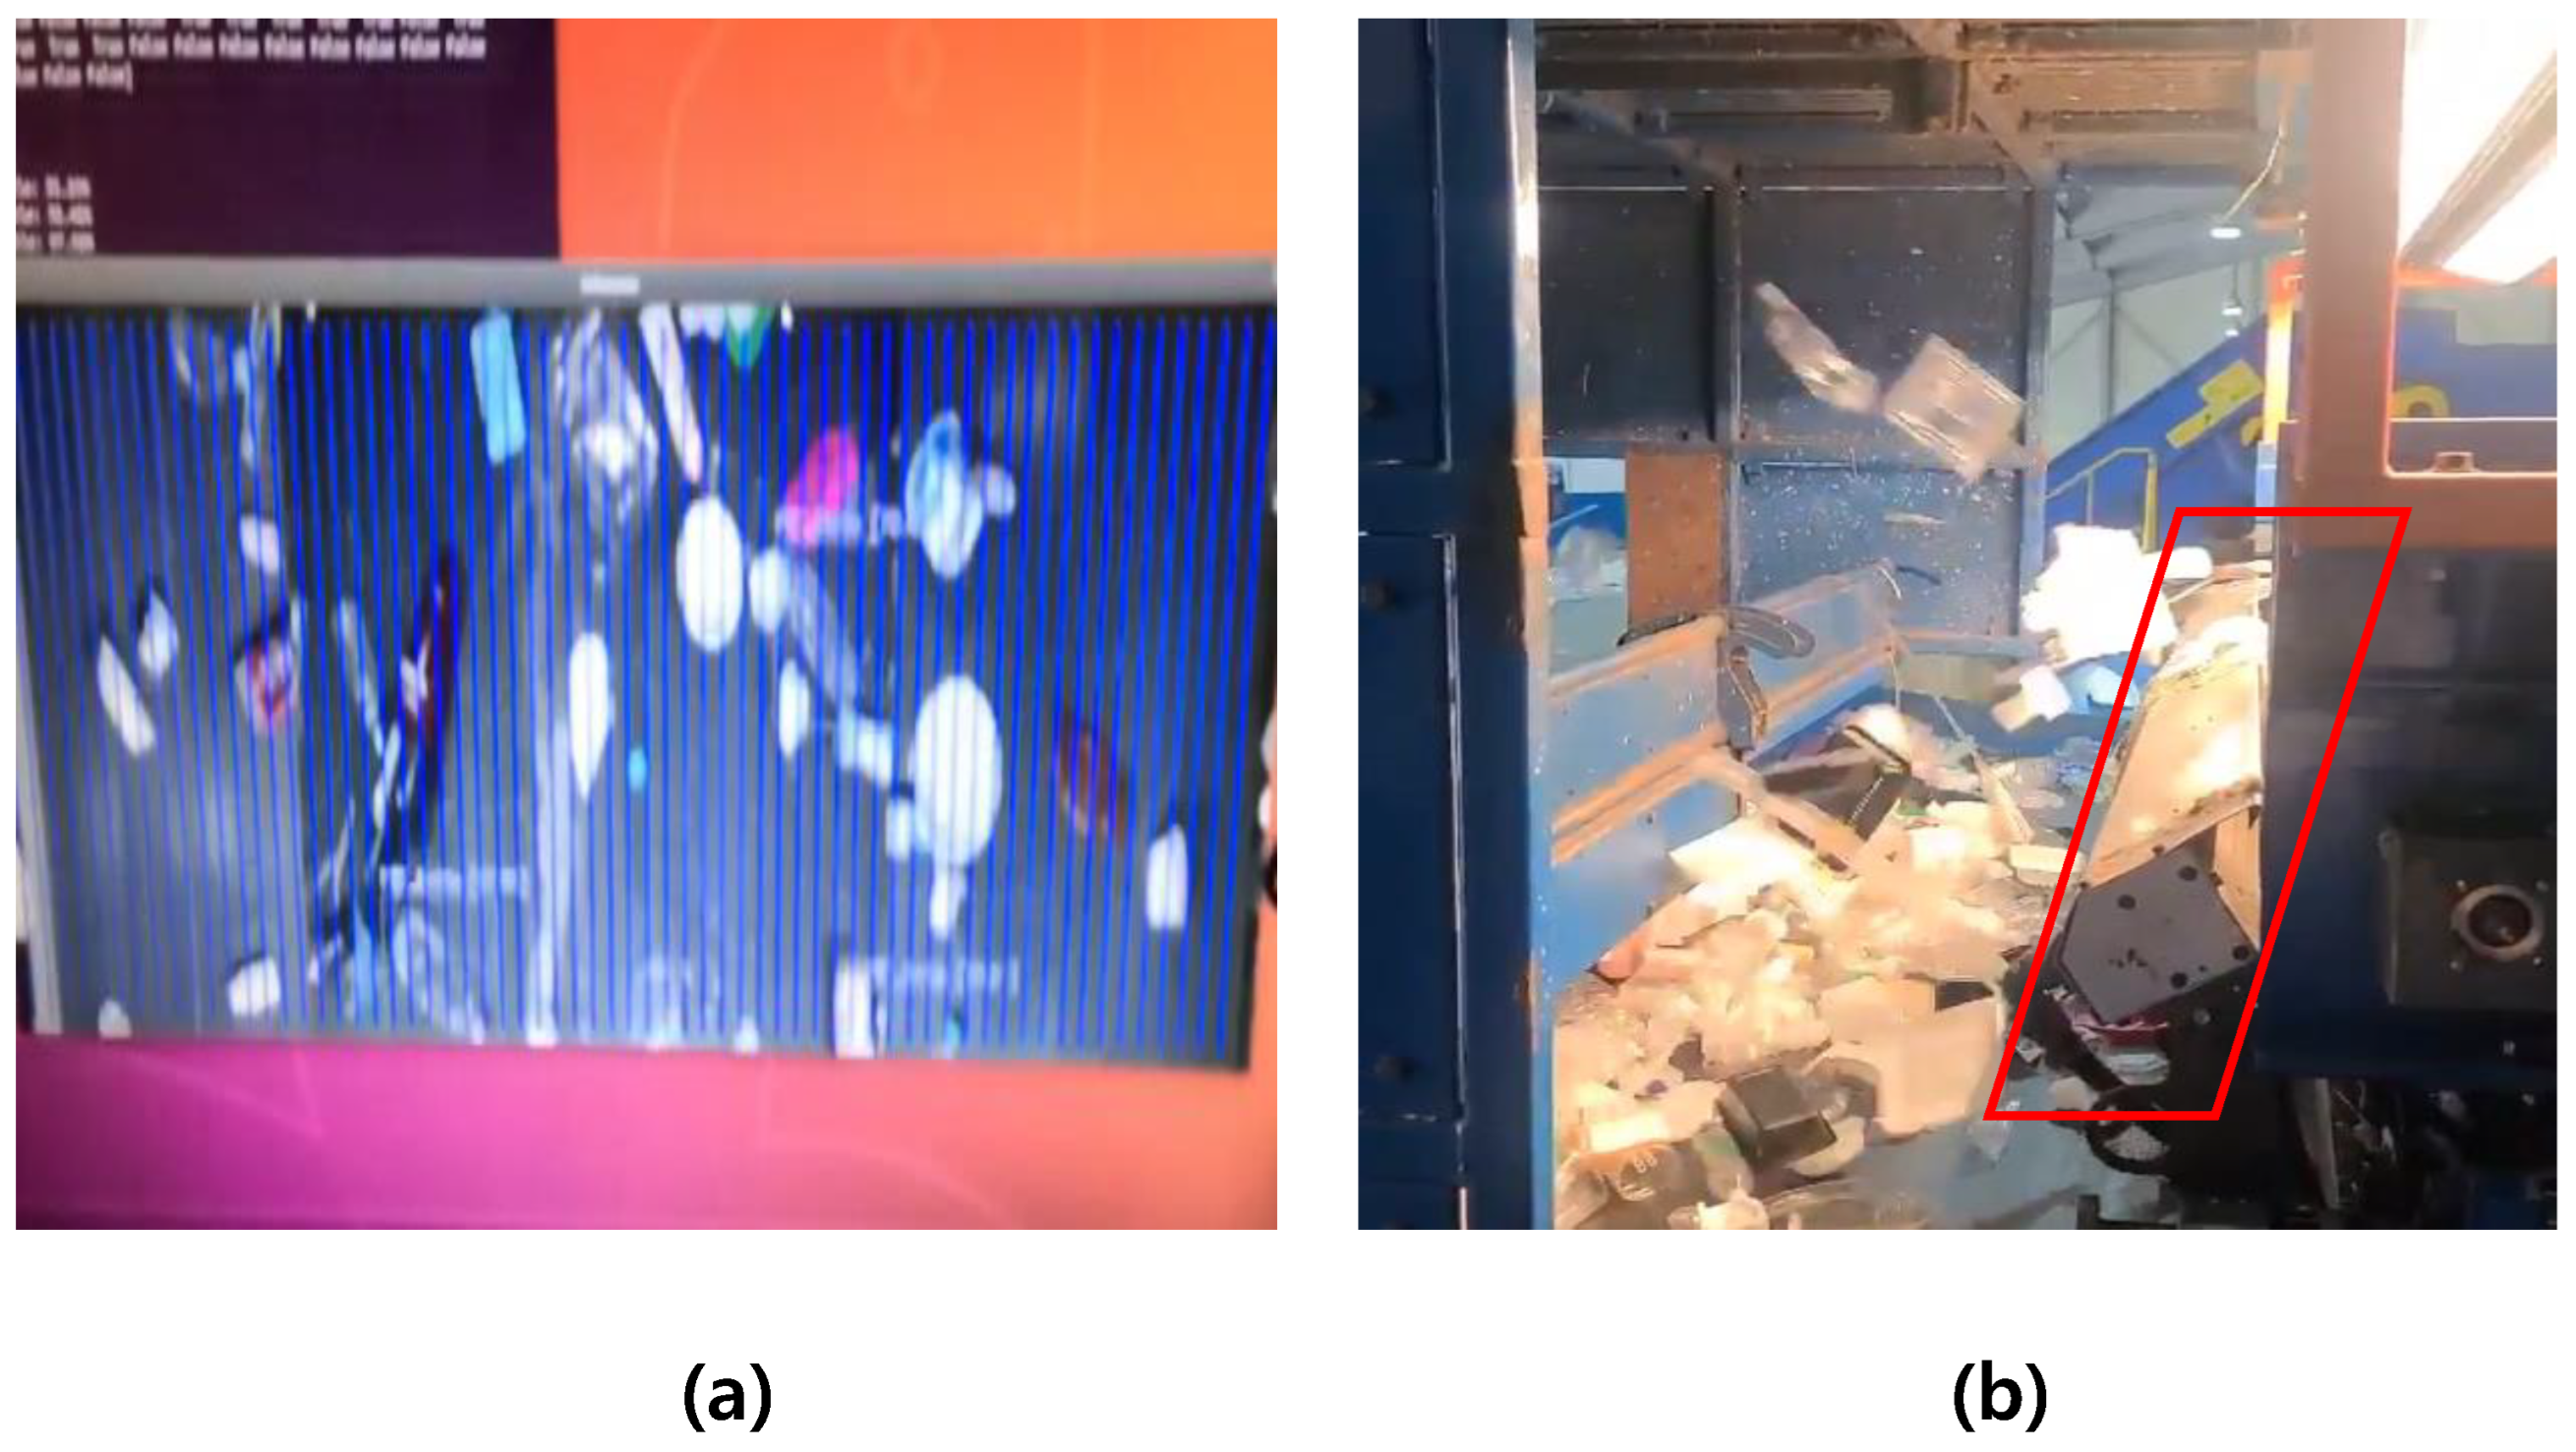
As depicted in
Figure 8, the Realsense camera module streams images to a PC via the USB3 interface, where deep learning inference is performed. The resulting inferences from the streamed images are transmitted as word data to the Holding Registers of Modbus TCP. In the case of PET, a value of 1 is sent. The transmitted results are linked to the PLC’s Digital Out module to generate a signal that activates the air nozzle. When a PET image is detected, as illustrated in
Figure 9a, a digital signal shifts from 0 to 1, analogous to a yellow signal on an oscilloscope. The corresponding change in the Holding Registers’ value can be observed in the red-boxed value in
Figure 9b.
When the data are acquired in real-time from the camera via the USB3 interface to the edge PC, the inference process starts using the internal YOLO-v8 algorithm. The inferred results (
Figure 9a) are then communicated to the air nozzles located at the end of the conveyor belt through the Modbus TCP (
Figure 9b) communication interface.
Based on the object detection inference results, which include the bounding box coordinates and class labels, the system determines the specific regions or samples on the conveyor belt that require classification and sorting. To achieve this, the system sends an “O” signal to the pneumatic valves connected to the corresponding air nozzle controller.
For PET and PET-G classification, the air nozzles are divided into 64 regions, and, based on the inference results, the corresponding regions are activated by sending an “O” signal to the pneumatic valves. Only the samples in the activated regions are classified through pneumatic control.
The activation of the appropriate air nozzles directs focused bursts of air toward the classified plastic waste samples, effectively sorting them pneumatically. This precise and automated process ensures that each plastic waste object is correctly categorized and directed to its designated location for further processing or recycling.
While compositional analysis provides valuable insights into the material composition of plastic waste, it may not be adequate for distinguishing plastics with similar compositions but different shapes. To overcome this challenge, a shape-based classification algorithm is developed and integrated into the system.
The shape-based classification algorithm focuses on the visual characteristics, geometric features, contours, and textures of the plastic waste samples. By extracting relevant shape descriptors such as aspect ratios, circularity, convexity, and texture patterns, the algorithm can differentiate between different types of plastics based on their distinct shapes.
The algorithm leverages the visual information captured by the image sensors to perform shape-based analysis. It analyzes the unique visual properties of each plastic waste sample and compares them against predefined patterns and shape templates to determine the appropriate classification.
By incorporating shape information alongside the compositional analysis, the shape-based classification algorithm enhances the accuracy and reliability of the plastic waste classification system. The integration of both algorithms allows for a more comprehensive analysis of plastic waste, enabling precise classification, even in cases where compositional similarities exist.
The combined approach of compositional analysis and shape-based classification significantly improves the system’s ability to correctly identify and categorize plastic waste. It takes advantage of the strengths of each analysis method, mitigating the limitations of individual approaches and enhancing the overall effectiveness of the waste classification system.
5. Discussion
5.1. Interpretation and Comparison of Experimental Results
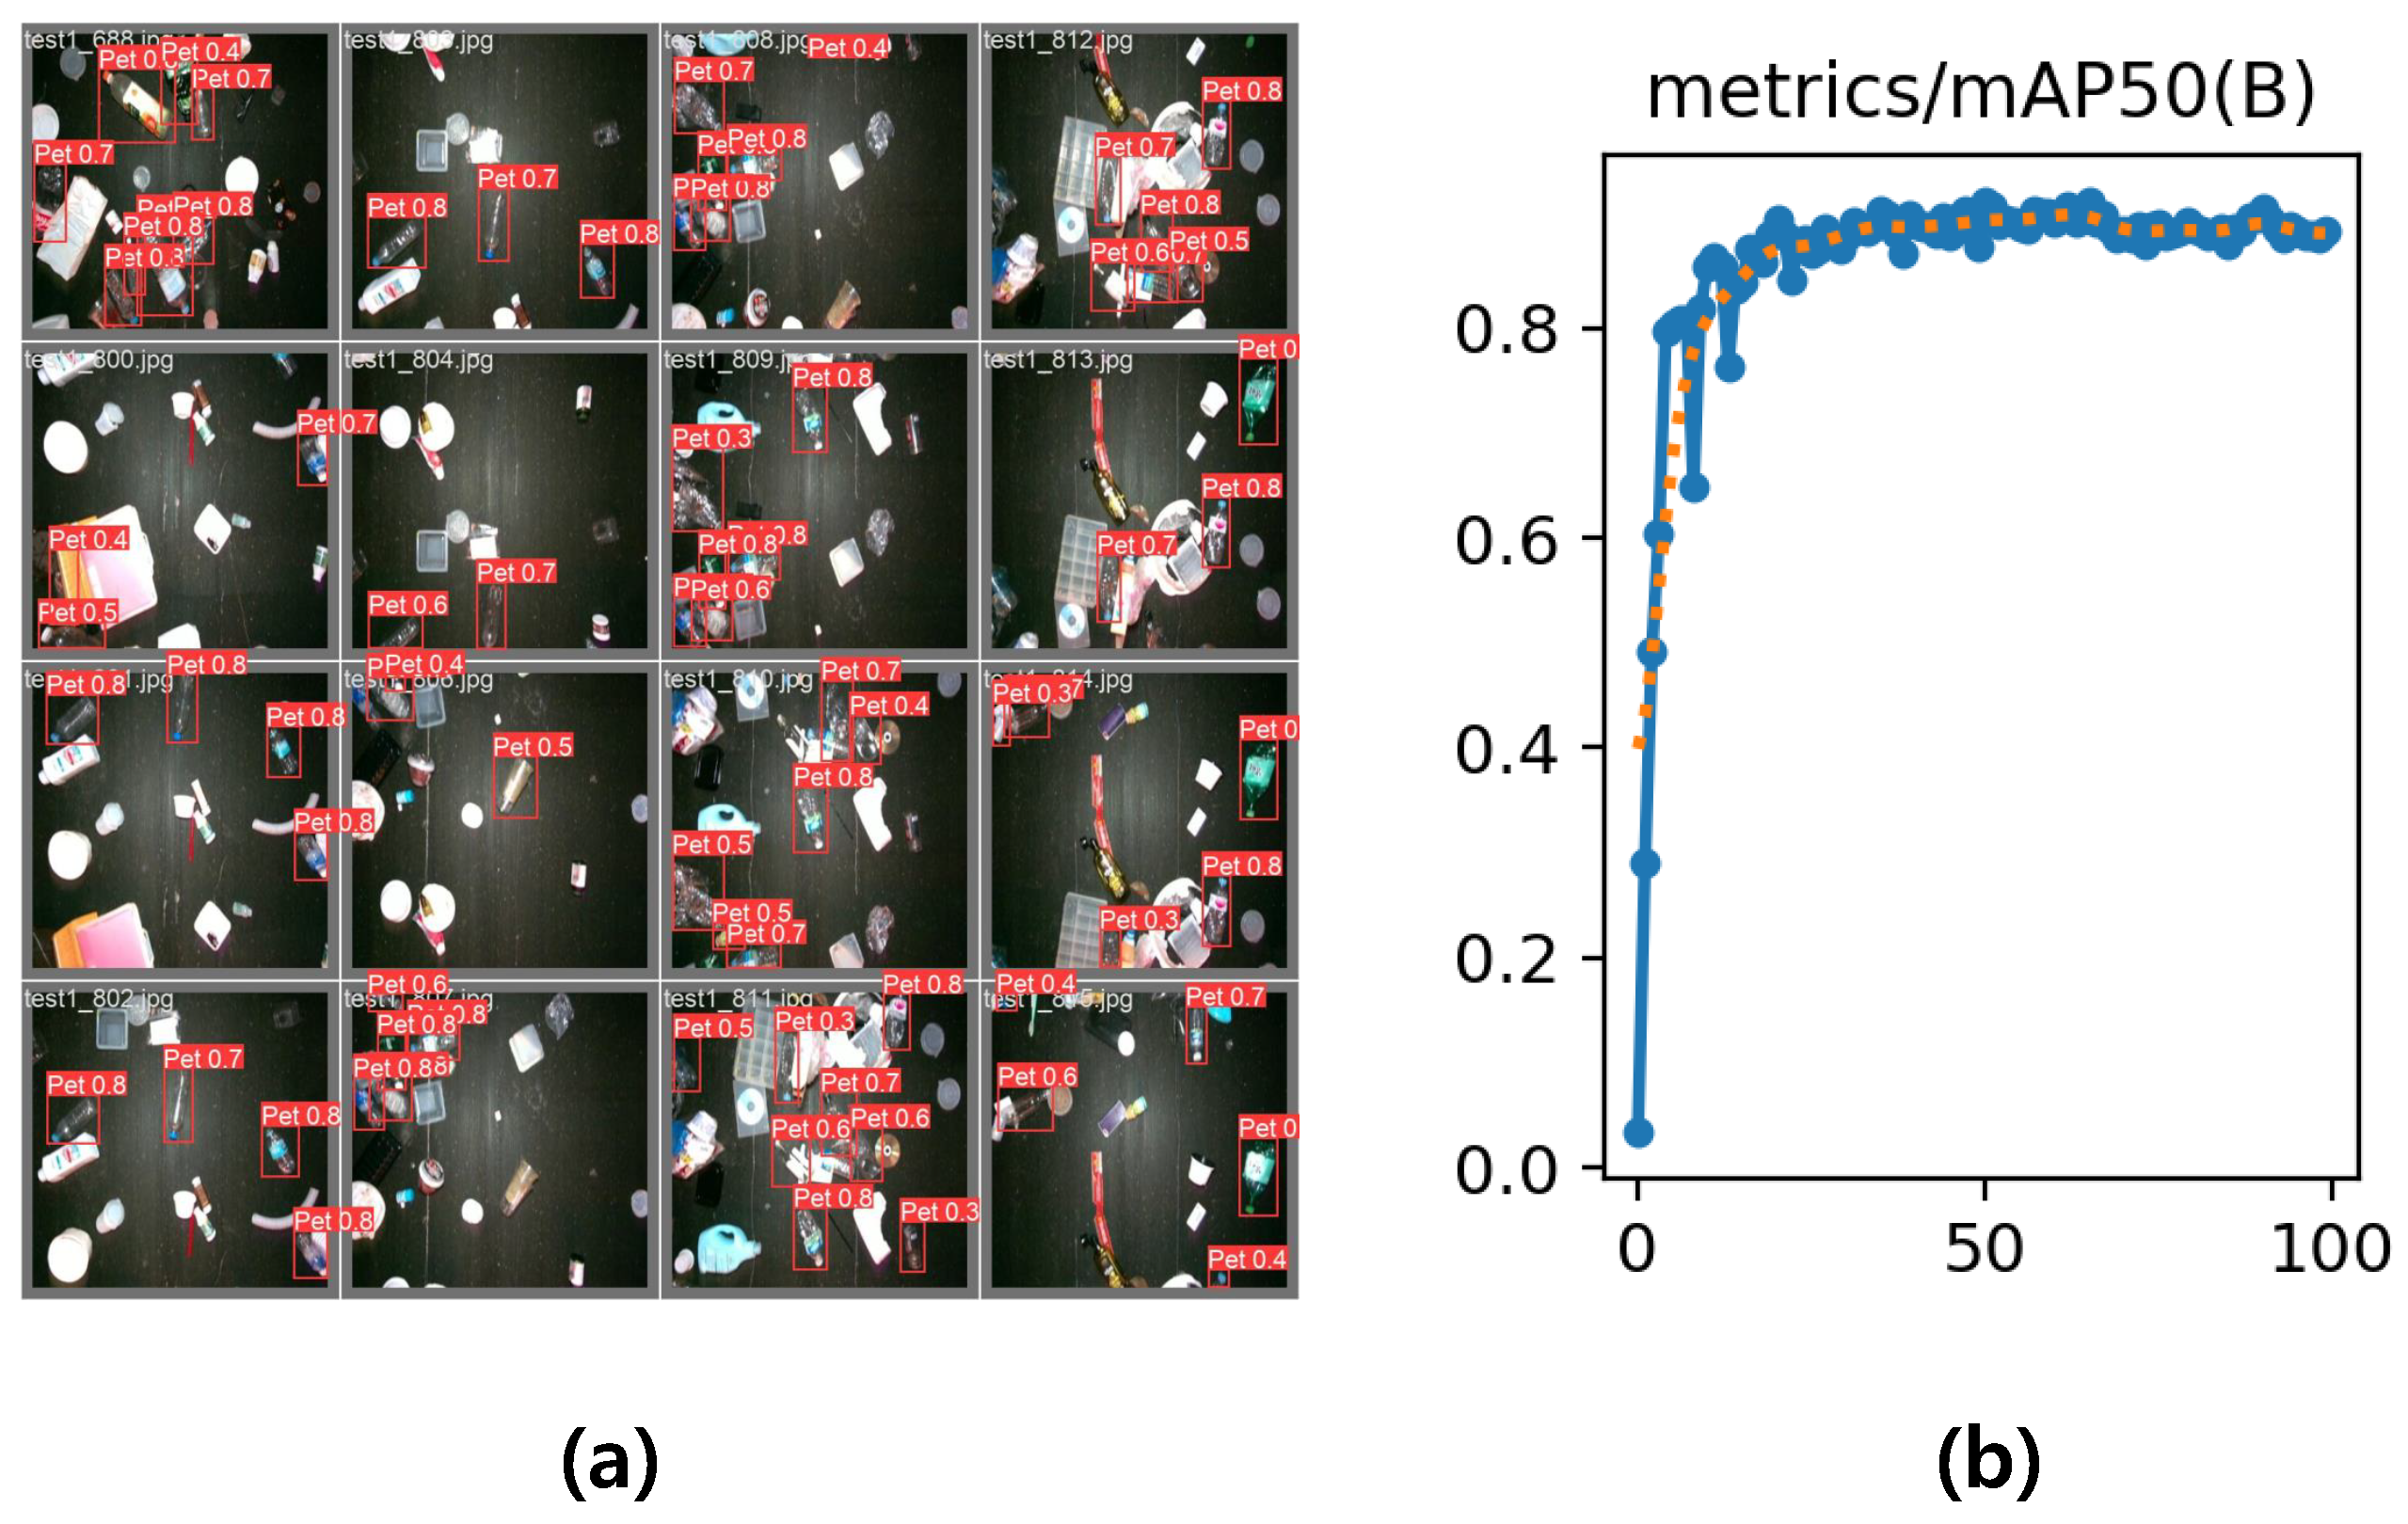
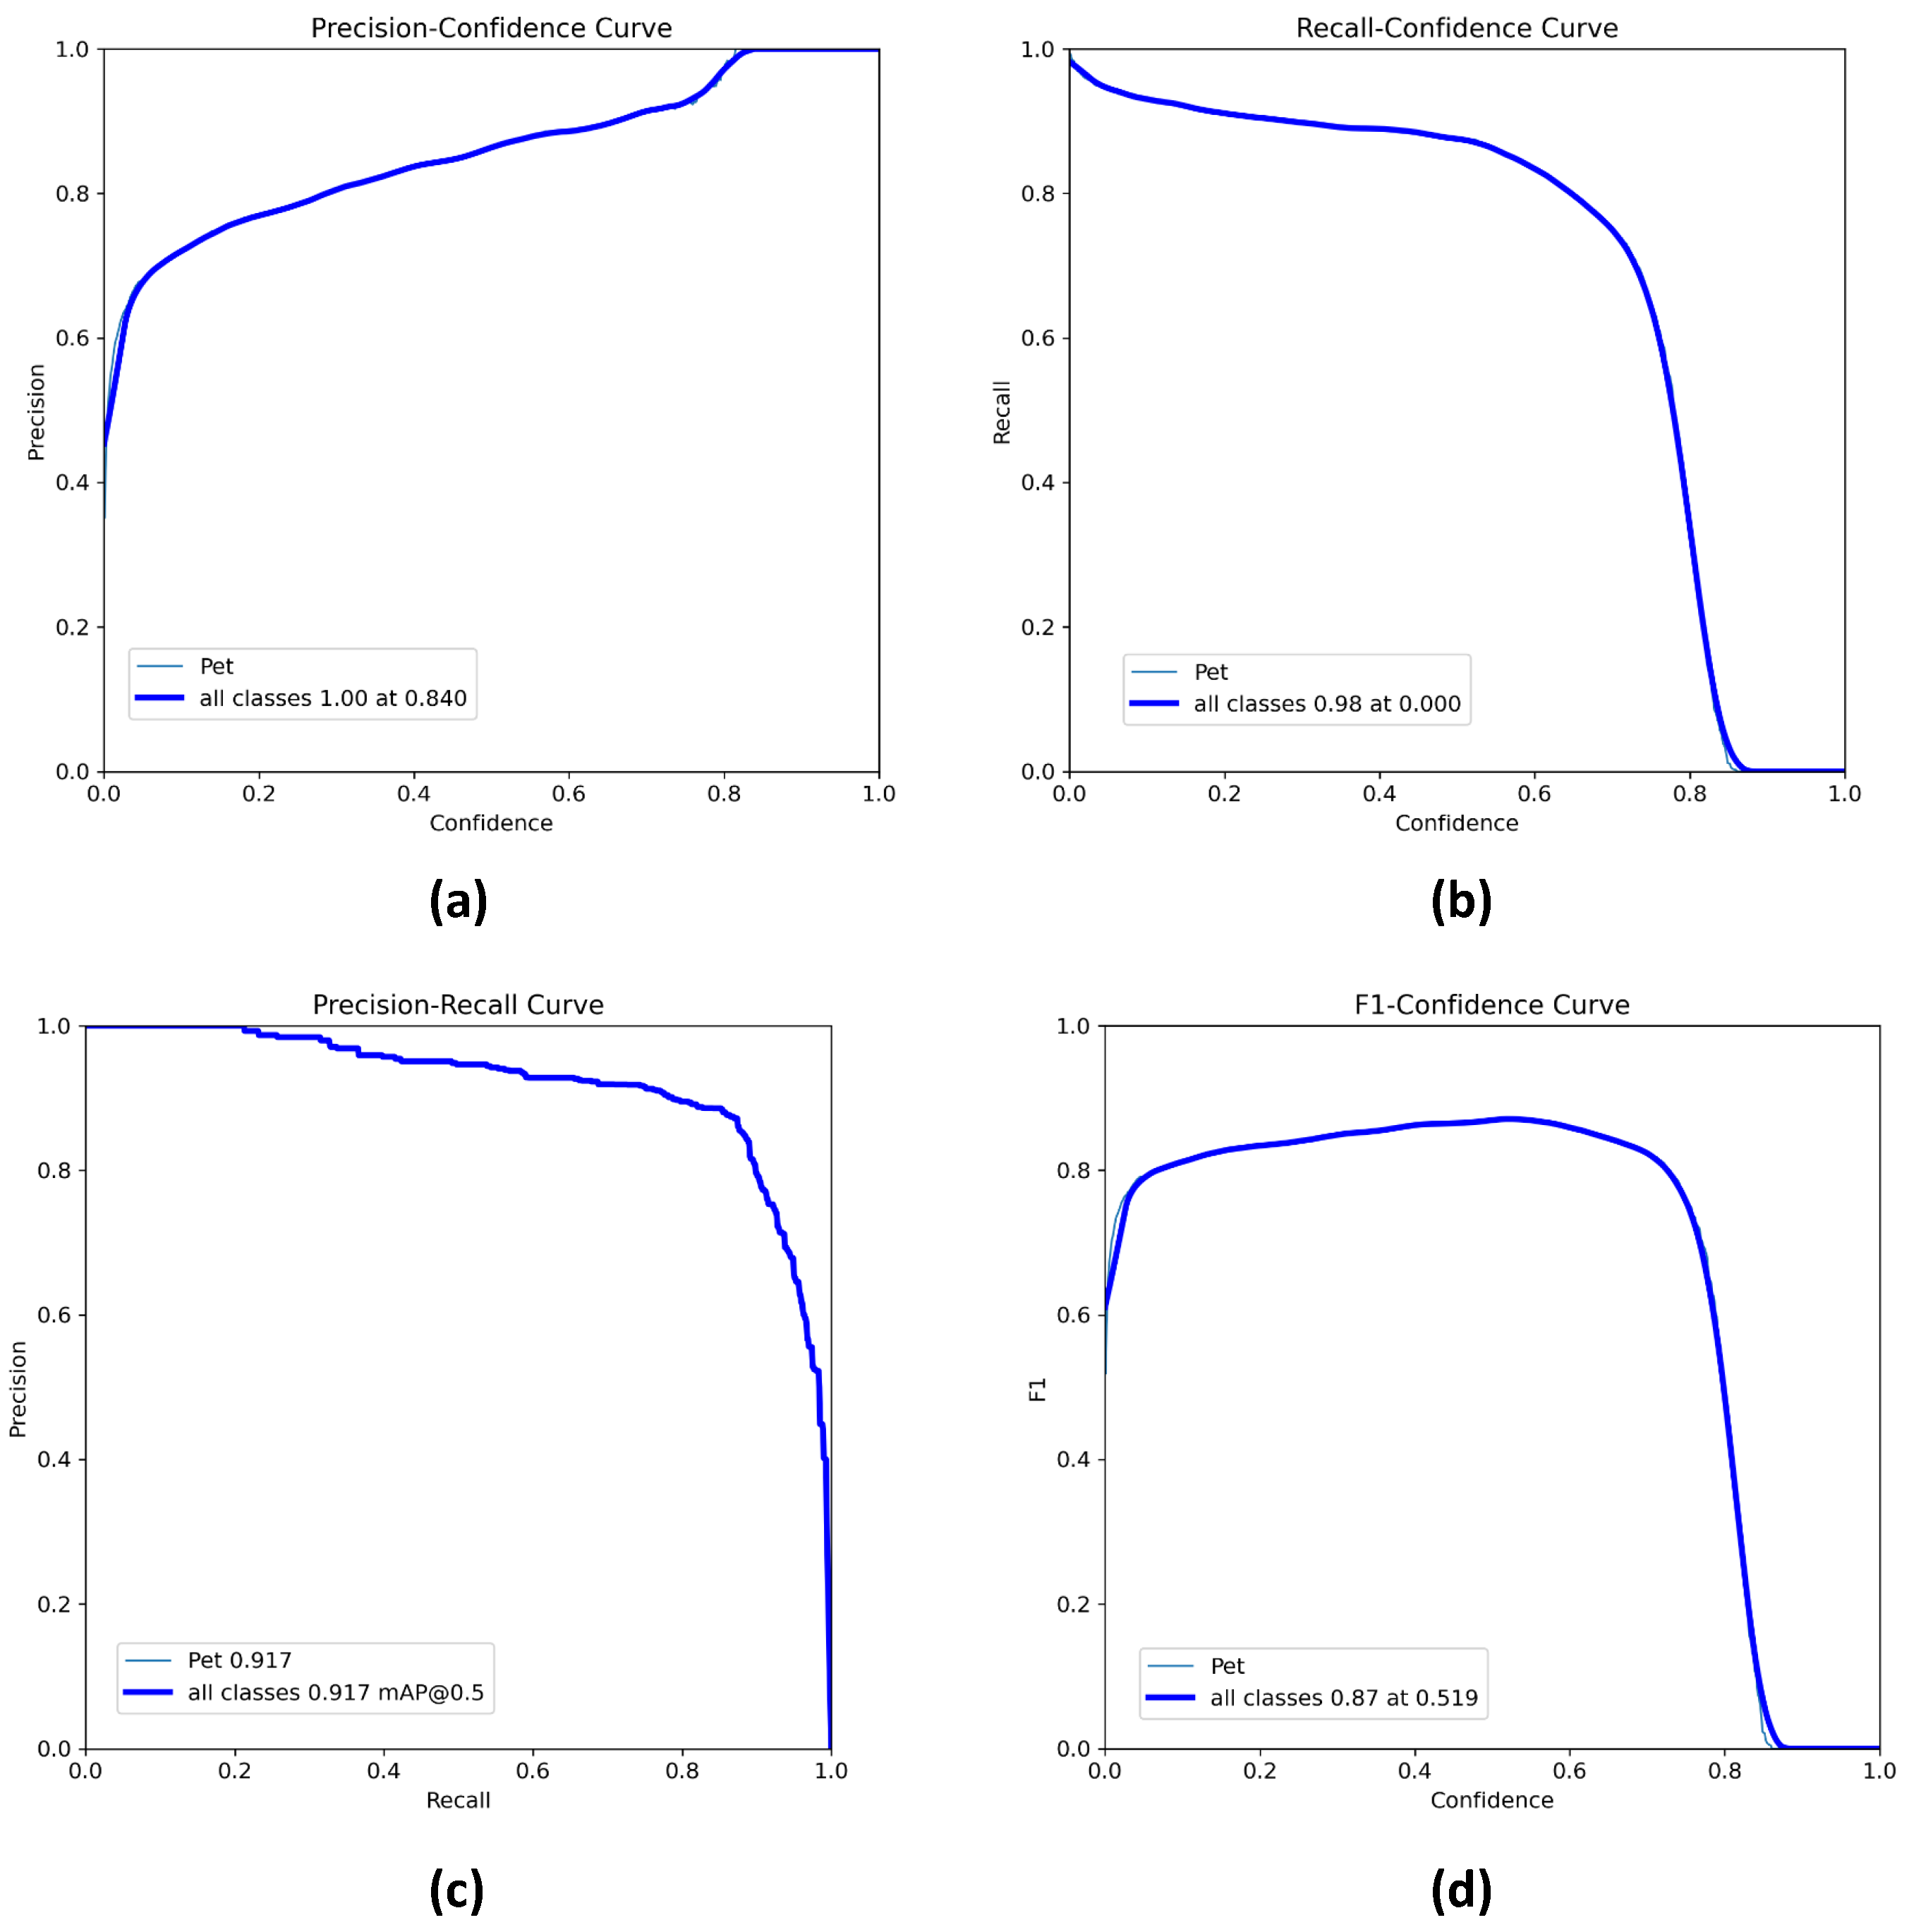
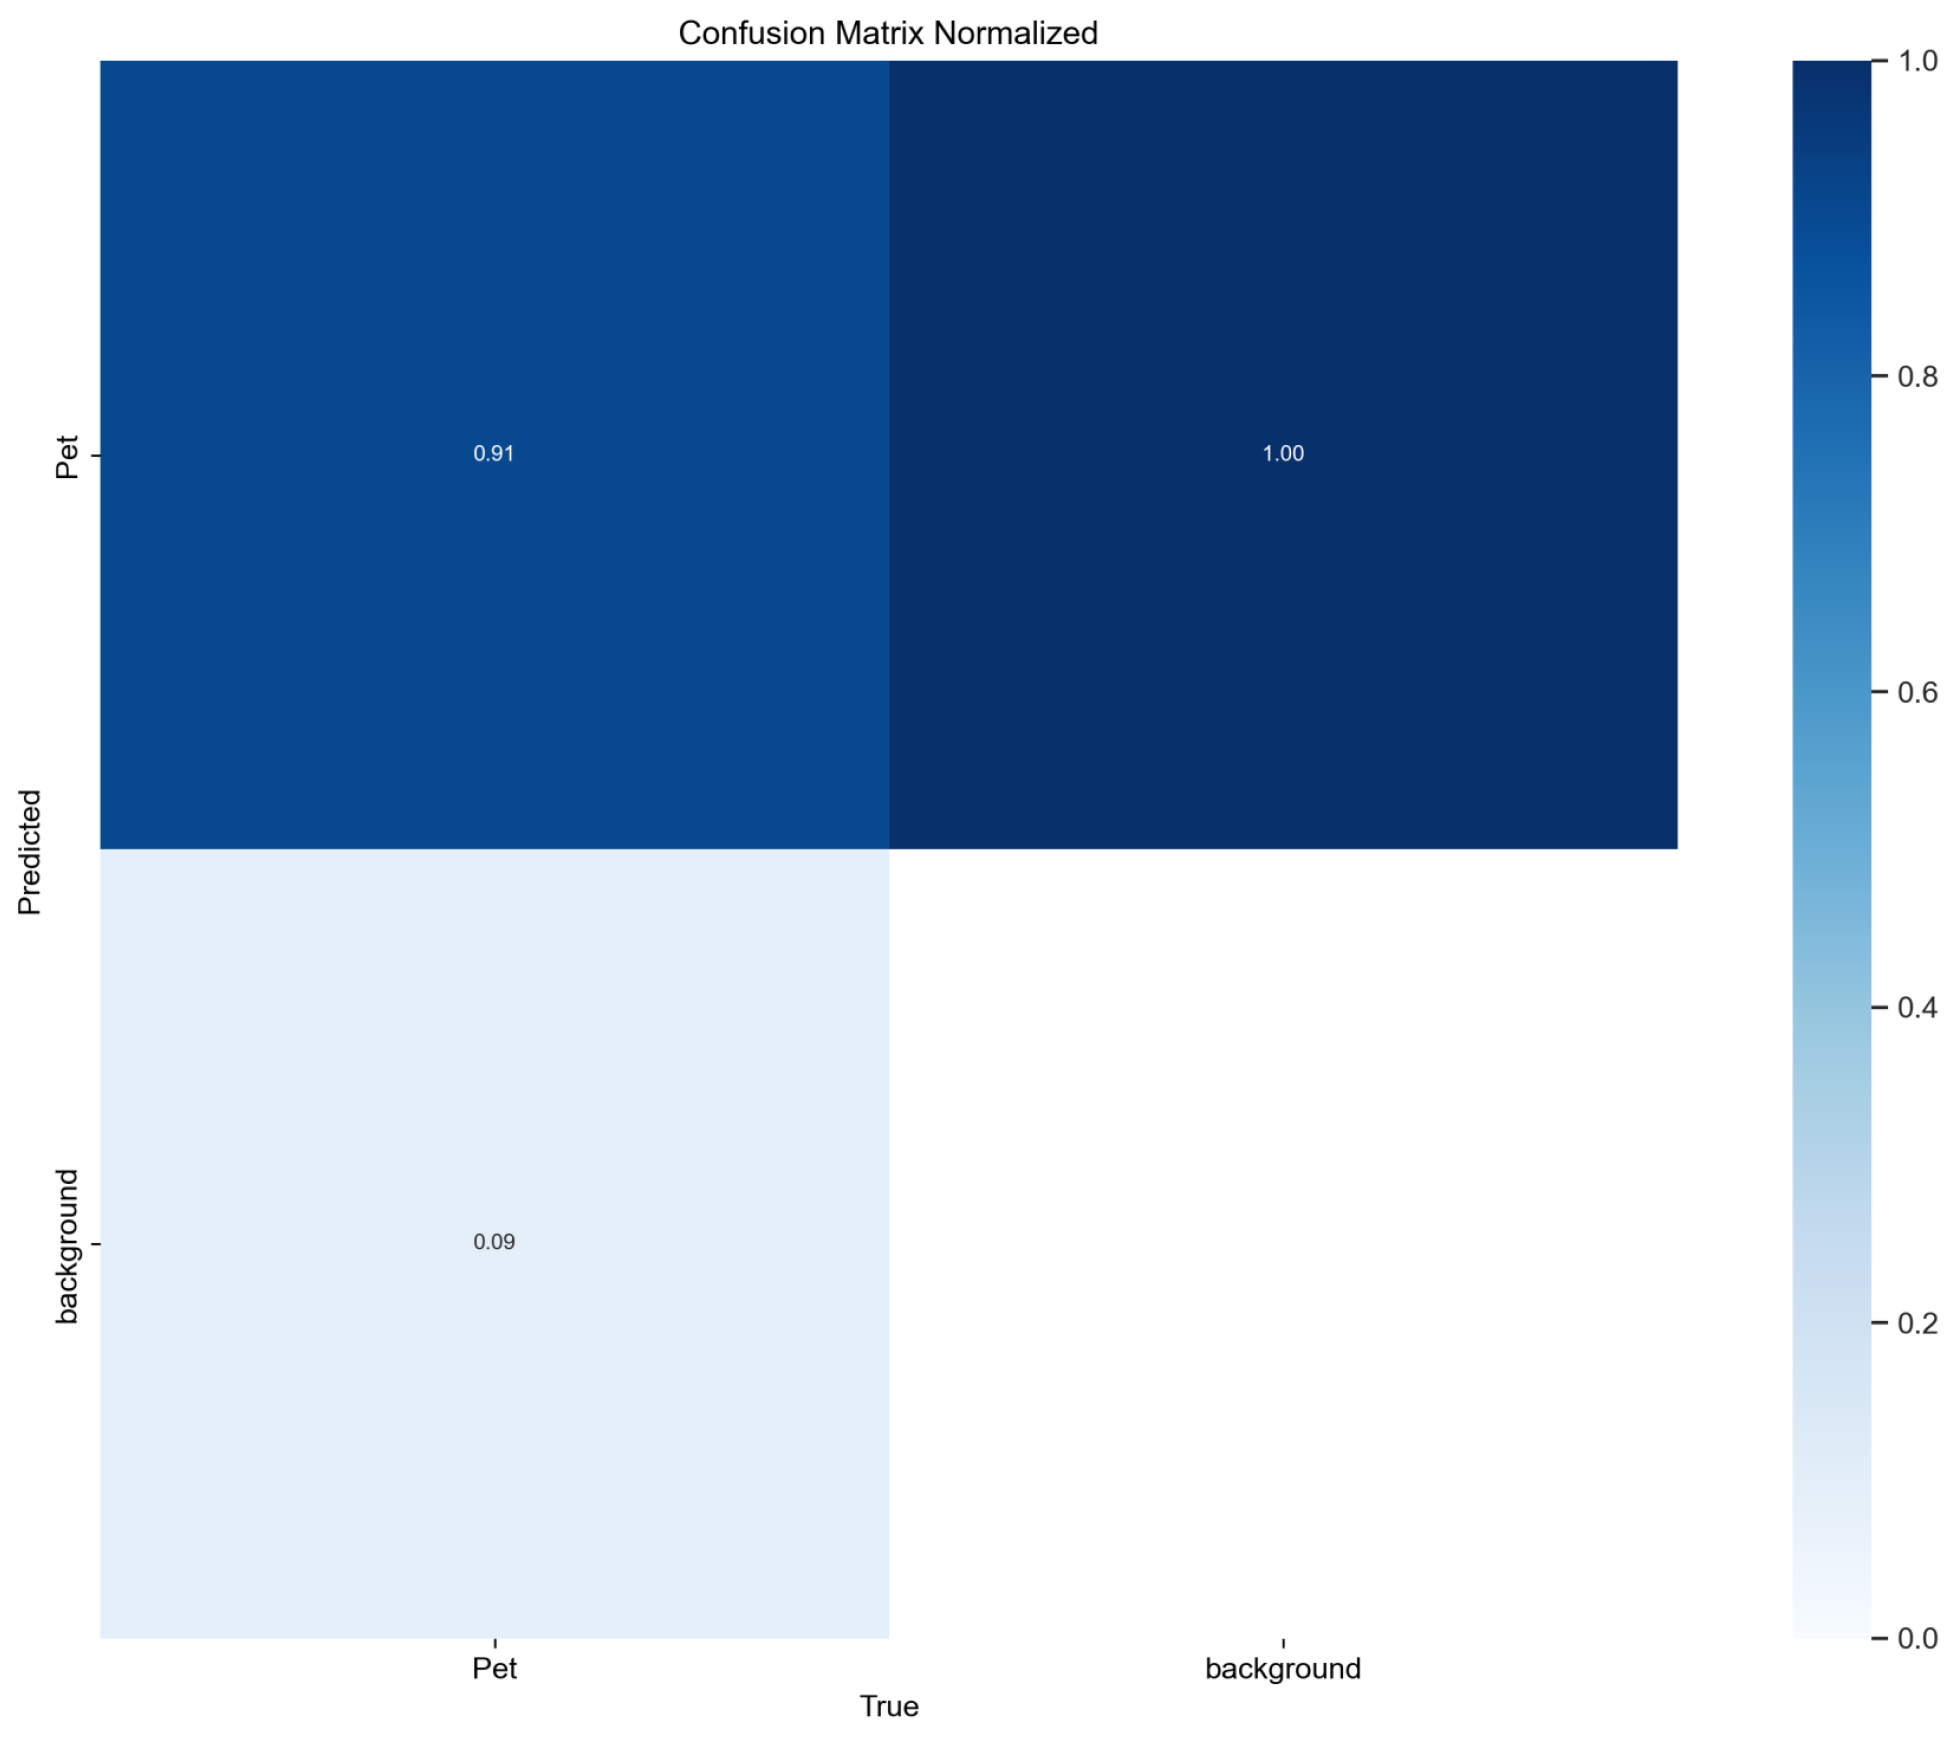
The interpretation and comparison of the experimental results shed light on the effectiveness of the proposed plastic waste classification system. The achieved classification accuracy of 91.7 mAP for PET and PET-G samples moving at a speed of 2 m per s demonstrates the system’s high precision in distinguishing between different types of plastics. This accuracy is crucial in ensuring proper sorting and recycling of plastic waste materials.
Comparing the achieved accuracy with existing manual sorting processes reveals the superiority of the developed system. Manual sorting processes often suffer from human error and subjective judgment, leading to lower accuracy rates. The automated nature of the proposed system eliminates these drawbacks, providing consistent and reliable classification results.
Moreover, the real-time performance of the learning algorithm enables prompt decision making in waste-sorting operations. The system keeps pace with the conveyor belt’s speed, ensuring that samples are classified on time. This efficiency is essential for maintaining the productivity of waste management facilities and optimizing the recycling process.
5.2. Advantages and Limitations of the Proposed Method
The proposed plastic waste classification method offers several advantages over traditional sorting approaches. Firstly, it eliminates the reliance on manual labor, reducing human error and increasing sorting accuracy. The automated nature of the system ensures consistent results, regardless of the operator’s expertise or subjective judgment.
Furthermore, the integration of depth cameras and the YOLO-based object detection algorithm enables real-time classification. This real-time capability enhances the efficiency of waste-sorting operations, minimizing delays and bottlenecks in the recycling process.
Additionally, the combination of compositional analysis and shape-based classification addresses the challenges posed by plastics with similar compositions but different shapes. By incorporating both compositional and shape information, the system improves classification accuracy, reducing misclassifications and enhancing overall sorting effectiveness.
However, the proposed method also has certain limitations. The reliance on depth cameras may introduce challenges in certain scenarios, such as low lighting conditions or occlusions. Ensuring proper lighting and minimizing occlusions can help mitigate these limitations and maintain accurate classification results.
Furthermore, the system’s performance may be affected by variations in plastic waste samples, such as different colors, textures, or surface conditions. Ensuring a diverse and representative training dataset can help improve the system’s ability to handle such variations and enhance classification accuracy.
5.3. Further Improvements and Research Directions
To further enhance the plastic waste classification system, several improvements and research directions can be explored. Firstly, expanding the range of detectable plastics beyond PET and PET-G can increase the system’s applicability in diverse waste management scenarios. Training the algorithm on additional plastic types and incorporating them into the system can improve its versatility and effectiveness.
Moreover, incorporating advanced machine learning techniques, such as deep neural networks or reinforcement learning, may further enhance the system’s classification accuracy and robustness. These techniques can capture more complex features and patterns, enabling the system to handle challenging scenarios and improve overall performance.
Additionally, integrating sensor fusion techniques, such as combining depth cameras with other types of sensors (e.g., spectroscopic sensors), can provide complementary information about plastic waste materials. This fusion of data from multiple sensors can improve classification accuracy by capturing additional material properties and characteristics.
The proposed method involves providing signals to the controller of the pneumatic nozzle in the area where inference is performed. While communication has been implemented, actual testing of the accuracy when classifying PET and PET-G by connecting to the pneumatic sensor is required. An important consideration here is the synchronization issue between the object detection inference results and the pneumatic valve, which is influenced by the conveyor speed. The delay in opening the pneumatic nozzle will vary depending on the conveyor speed. For example, on-site inference results can be calibrated to spray the pneumatic nozzle 100 ms after 1 m/s of conveyor speed, but when the conveyor speed changes to 2 m/s or 3 m/s, the delay time needs to be recalibrated on-site, and the results need to be organized for easy application on-site. Due to these differences, the accuracy of PET and PET-G classification may vary, necessitating future work to find a function for delay time based on conveyor speed to obtain reliable results.
The current system is in the proof-of-concept stage and is being validated at a recycling site, with the challenge of achieving significant accuracy improvements in plastic waste sorting over an extended period. This paper presents an innovative method that combines image sensors and deep learning (YOLO model) to classify plastics by shape and form, aiming to improve sorting accuracy, reduce misclassification, and enhance recycling efficiency, addressing environmental concerns related to plastic waste mismanagement. The current system is in the proof-of-concept stage and is being validated at a recycling site. Achieving significant improvements in accuracy within a short period is challenging and requires extended validation over an extended period. Furthermore, continuous evaluation and optimization of the system’s performance through field trials and feedback from waste management facilities are essential. Collaborating with industry partners and incorporating their expertise can help identify real-world challenges and refine the system accordingly.
The development of machine vision technology promises to significantly accelerate the automation of plastic classification, which still heavily relies on complex systems or manual labor in many aspects. In addition to PET and PET-G, PET and PVC, despite their similar chemical compositions, must also undergo classification. Currently, differences in chlorine content are determined through methods involving equipment such as X-rays or manual sorting. However, it is anticipated that machine vision, with its capability to distinguish the distinct shapes of PET and PVC, will enable a more straightforward classification process. Furthermore, it can be readily applied not only in the field of waste plastic classification but also in quality control technologies where precision machining is required [
28], as well as in the area of E-waste (electronic waste) [
29].
In conclusion, the proposed plastic waste classification system demonstrates high accuracy and real-time performance, offering advantages over traditional manual sorting approaches. While certain limitations exist, ongoing research and improvements can overcome these limitations and enhance the system’s capabilities. The integration of advanced machine learning techniques, sensor fusion, and collaboration with industry stakeholders will contribute to the continuous development and effectiveness of the system in promoting sustainable waste management practices.
6. Conclusions
In conclusion, the proposed plastic waste classification system combines machine/computer vision technology, deep learning algorithms, and pneumatic control to achieve accurate and real-time waste sorting. By integrating depth cameras and the YOLO-based object detection algorithm, the system can identify and classify different types of plastics with high precision on a fast-moving conveyor belt. The inclusion of a shape-based classification algorithm further enhances accuracy by considering visual characteristics and textures. This system offers significant advantages over manual sorting, ensuring consistent and reliable results while eliminating human error. However, improvements are needed to address challenges such as low lighting and variations in plastic samples, requiring appropriate lighting setups and diverse training datasets.
The potential applications of this system extend beyond plastic waste classification. The image-based classification approach can be applied to other industries and waste management fields where object recognition and sorting are necessary. Further research should focus on refining the system through the integration of advanced machine learning techniques and sensor fusion. Collaboration with industry stakeholders and continuous field trials will provide valuable feedback to enhance system performance and tackle real-world challenges. By revolutionizing waste management practices and promoting sustainability, this research contributes to efficient recycling, resource conservation, and environmental preservation. Expanding the system’s capabilities to handle diverse waste materials and fostering collaboration across sectors and international waste management fields will unlock new opportunities and pave the way toward a cleaner and more sustainable future.


