Article

Precise Cadastral Survey of Rural Buildings Based on Wall Segment Topology Analysis from Dense Point Clouds

1
The Key Laboratory of Urban Land Resources Monitoring and Simulation, Ministry of Natural Resources, Shenzhen 518034, China
2
The Faculty of Geosciences and Environmental Engineering, Southwest Jiaotong University, Chengdu 611756, China
*
Author to whom correspondence should be addressed.
Appl. Sci. 2023, 13(18), 10197; https://doi.org/10.3390/app131810197
Submission received: 5 August 2023 / Revised: 31 August 2023 / Accepted: 8 September 2023 / Published: 11 September 2023
(This article belongs to the Special Issue Advances in 3D Sensing Techniques and Its Applications)

Abstract

:
The renewal and updating of the cadastre of real estate is a long and tedious task for land administration, especially for rural buildings that lack unified design and planning. In order to retain the required accuracy of all points in the register, huge extensive manual editing is often required. In this work, a precise cadastral survey approach is proposed using Unmanned Aerial Vehicle (UAV) imagery-based stereo point clouds. To ensure the accuracy and uniqueness of building outer walls, the non-maximum suppression of wall points that can separate noise and avoid repeated extraction is proposed. Meanwhile, the multiple cue weighted RANSAC, considering both point-to-line distance and normal consistency, is proposed to reduce the influence of building attachments and avoid spurious edges. For a better description of wall topology, the wall line segment topology graph (WLTG), which can guide the connection of adjacent lines and support the searching of closed boundaries through the minimum graph loop analysis, is also built. Experimental results show that the proposed method can effectively detect the building vector contours with high precision and correct topology, and the detection completeness and correctness of the edge corners can reach 84.9% and 93.2% when the mean square error is below 10 cm.

1. Introduction

The cadastral survey is a long and tedious task that comprises both legal and technical aspects [1,2]. The aim is to accurately measure the location, size, and boundary of various land types, and satisfy the needs of the land management or other national economy departments. Especially for rural buildings, keeping the cadastral databases precise and up-to-date is the basic guarantee to ensure the users’ land rights and interests, and reduce the disputes when dealing with illegal construction or house-pulling and paying by government. This requires transparency and searchable information in the whole workflow, from data collection to processing, storage, and publication. In recent years, considering that rural buildings often lack unified design and planning, UAV stereo imagery-based approaches are widely used to record and survey cadastral dates [3,4]. However, due to the complexity of the rural building environments and the high accuracy requirements, huge extensive manual editing is often required, which is both expensive and time-consuming [5]. Even when only considering the 2D vector diagrams for the buildings and courtyard space, current automatic approaches still confront huge challenges [6].
Traditional image-based approaches first extract the building pixels via high-resolution image classification or segmentation, and then track the building outline instances [7,8]. The key is to fully exploit the salient features like geometric, spectral, or textural, and combine them with the a priori regularized constraints. However, due to the complexity of building types and the interference of various background elements, these methods usually require targeted parameter settings when dealing with different datasets, which is difficult to adjust and difficult to meet the needs of practical applications. Most of the mainstream image segmentation methods can be used for the extraction of buildings, such as region growing by seed points, or using various classification and clustering methods including Mean-shift and K-means [9]. Their main difficulty lies in the limited detection accuracy when dealing with scenes having complex background environments, which are prone to mis-detection and omission [10], especially when the direct transition among roads, elevated areas, and buildings are not obvious.
With the continuous development of deep convolutional neural networks, a large number of learning-based methods have also been proposed in recent years. Classical networks turn to adopt an encoder–decoder structure, i.e., the SegNet [11] and UNet [12]. The encoder part continuously performs the convolutional and pooling operations to extract image features, and the decoder part up-samples the image to the original size. The limitations are the loss of spatial details during feature extraction images, the boundary quality, and the accuracy of the final segmentation result. To enhance the adaptation of segmentation algorithms to building scales, the coarse-to-fine boundary refinement network (CBR-Net) [13,14] and the multi-path hybrid attention network (MHA-Net) [15] are also proposed. Moreover, there are some contour description networks that directly extract the polygon boundaries, including the Curve-GCN [16], Polymapper [17], and Polyworld [18]. A significant limitation of these methods is that, according to the regulation of building estate measurement and register, the building range should be measured based on the space enclosed by the outer walls, but not that of the rooftop. The same situation is also confronted by the methods using point clouds from the building rooftop, i.e., [19,20]. Since rural buildings often have significant protruding roof eaves, unenclosed balconies, and concave doorways, the precision of the results detected from the building’s roof remain problematic [21]. What is more, the detection results often lack building topology, which means the adjacent or connected roofs are often not separated, requiring extensive editing to achieve the basic requirements.
Since a precise cadastral survey requires direct observation of the building’s outer wall and a clear description of the special specifications such as the independent column, single column porch, and carport, oblique or ground view, dense oblique point clouds are becoming gradually more popular in the field of the cadastral survey, in recent years [22,23,24]. These point clouds can provide all-round and multi-angle observation of the target building outer walls and special specifications, while bringing huge challenges to current automatic approaches:
(1)
The precise and complete fitting of the wall surface remains problematic [5,25]. Because of the limited viewpoints and occlusion, the wall segments are often incomplete, especially in dense built-up areas. Additionally, due to the existence of windows and other building attachments, as well as the interruptions of shadow and vegetation, the wall points by stereo matching may not be strict vertical planes, leading to spurious or incomplete results.
(2)
Error-proneness of wall segment topology [26]. The intersection of adjacent walls and the searching of closed wall polygons require a clear description of wall–wall topology. Imperfect wall extraction results will result in incorrect connections, which require further interaction for industrial solutions. Furthermore, the regularization of the boundaries also requires a global description of wall topology.
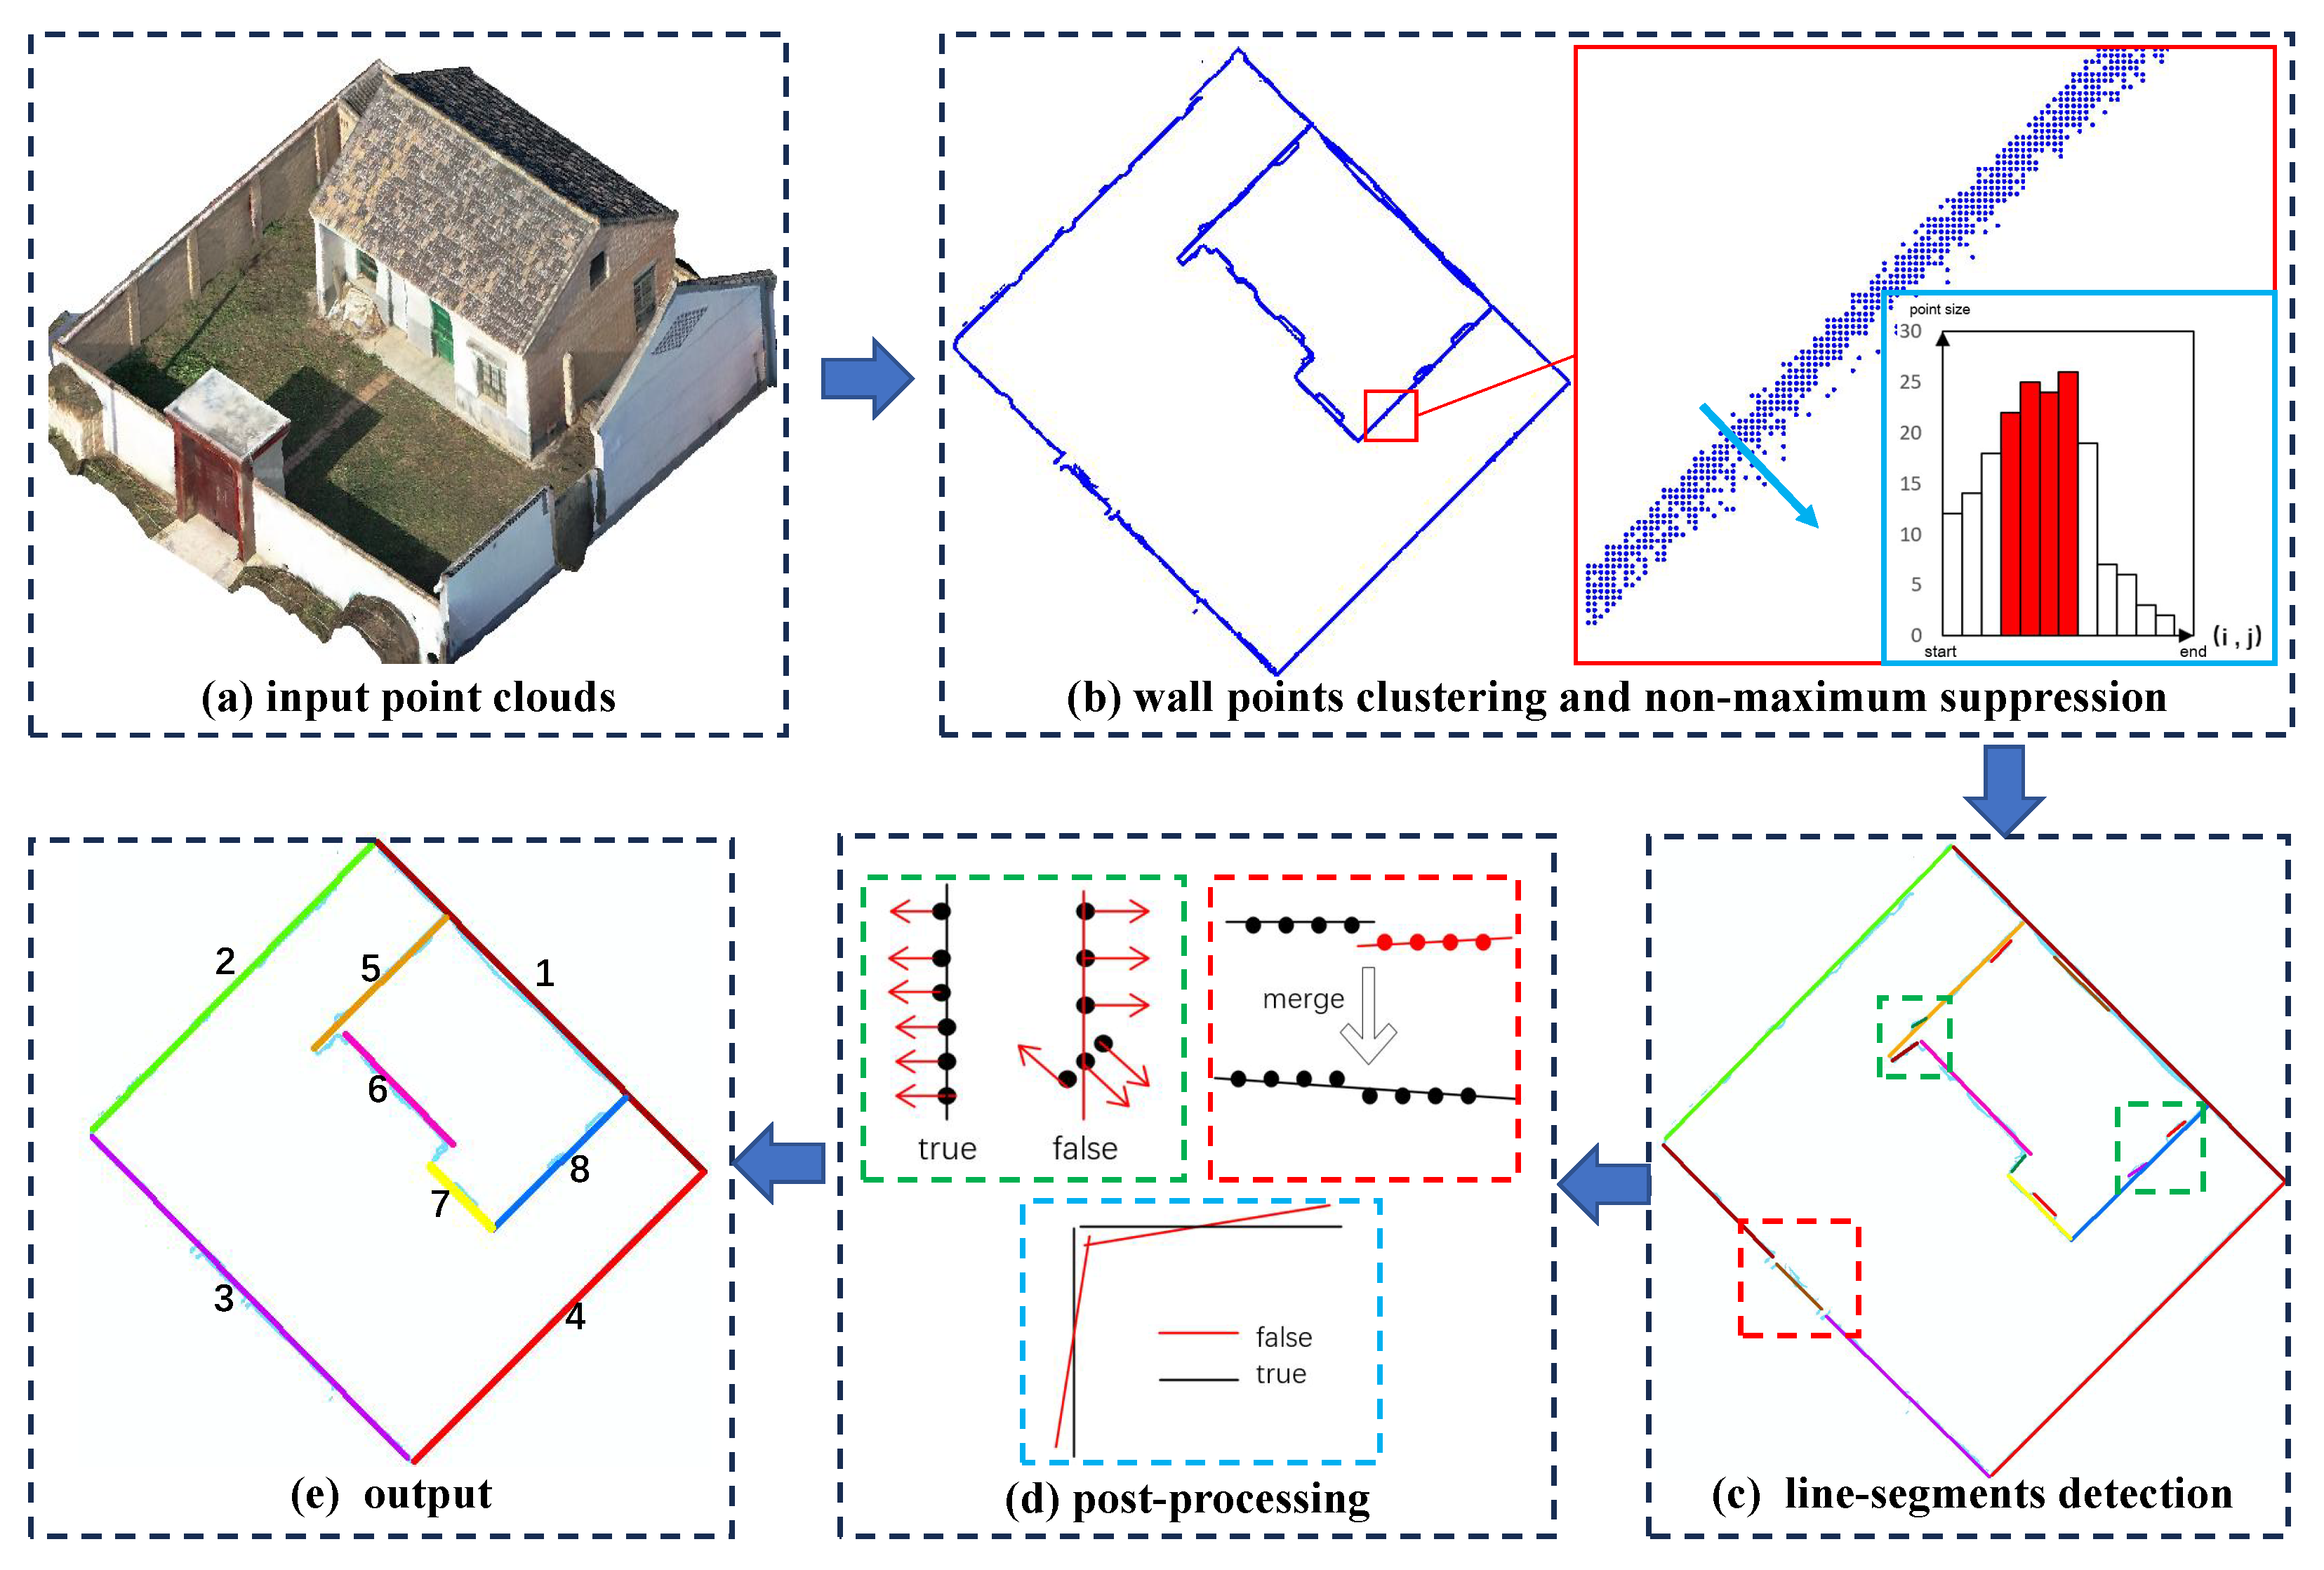
In this work, a robust cadastral survey approach is proposed based on dense point clouds. Two attempts are applied to ensure the accuracy and uniqueness of the wall locations: the non-maximum suppression of the projection points on the walls to avoid duplicate extraction results; and, meanwhile, multiple cue weighted RANSAC, considering both point-to-line distance and normal consistency, to reduce the influence of noise and building attachments. As for the wall topology construction, a graph structure is built to store and analyze the connection relationship and parallel/vertical constraints among adjacent wall segments. Minimal closure analysis is used upon the graph structure and, meanwhile, the overall domain direction estimation and boundary optimization adjustment ensure the overall regularization. Finally, the point cloud distribution within the closed polygon can effectively distinguish structures such as houses and attached courtyard walls to obtain the semantic vector scene.
In summary, the contribution of the proposed methods is twofold: (1) the non-maximum suppression of the projection points and multiple cue weighted RANSAC to ensure the accuracy and uniqueness of the wall locations, and (2) the analysis of the wall line segment topology graph for the connecting and adjustment of the wall segment. The remainder of the paper is structured as follows: Section 2 presents the proposed methods in detail, followed by the assessment and discussion in Section 3. Section 4 concludes this paper.

2. Methods

As shown in Figure 1, our method starts with the dense point clouds from multiple-view UAV imagery and works directly towards the location of wall segments and the construction of wall topology. In Section 2.1, the detection of wall segments is realized by fitting the 2D line features from wall points after projecting them to the horizontal surface. Local non-maximum suppression and global adjustments are adopted to ensure the orientation and location of the wall lines. As for the construction of wall topology, a graph structure is built to store and analyze the relationship among adjacent wall lines, as described in Section 2.2. With the graph structures, adjacent wall lines are intersected and closed rooms are separated. Finally, the building semantics are assigned for the household models.

2.1. Detection of Wall Segments

In this work, the two-dimensional contours of buildings are detected based on the point clouds of the wall surface. Thus, we first cluster the wall points and project them to the 2D horizontal surface, followed by the fitting and adjustment procedures for the wall segments. The workflow of wall segment detection and adjustments is provided in Figure 2.

2.1.1. Wall Points Clustering

An initial set of wall points are detected based on the idea that the normal direction of wall points tends to be horizontal. Suppose n P ( n x , n y , n z ) are the unit normal vectors of point P and n x 2 + n y 2 + n z 2 = 1 , the first condition for the wall points is n z < arcsin ( T h n v ) , where T h n v is set as 5 in the tests. The Density-Based Spatial Clustering (DBSCAN) algorithm [27] is adopted to remove the small noise components. Once the points are separated, we project them to the 2D horizontal surface by simply omitting the z values of the points’ coordinates, and the point normal vectors are also projected and normalized in the same way.

2.1.2. Non-Maximum Suppression

The idea of non-maximum suppression is similar to the famous Canny edge detector in the field of image processing [28]. We suppose the point density of the target wall has the local maximum value after projecting to the 2D horizontal surface, and the points along the normal direction need to be suppressed. The aim of such processing is to decrease the influence of windows or other building attachments and avoid spurious or repeatedly detected results. Since non-maximum suppression is often adopted in local areas and requires the estimation of an extremum point and suppression orientation, a raster-based approach is proposed and the main steps are described below:
(1)
Rasterization
The main task of this section is to divide the wall points into predefined grids and form a density image, in which the image grays represent the number of points within the grid. The image boundary is determined based on the minimal and maximal X/Y coordinate values, and the grid size is set as twice the average point density. For each pixel p in the density image, three elements are estimated, marked as p ( p o s , n v , w e i g h t ) , where p o s is the gravity center of all of the projected 2D points within the grid, n v is the median value of these points’ direction angles ( π /2 to π /2) based on the point normal vectors, and w e i g h t is simply the point number.
(2)
Non-Maximum Suppression
In the classic Canny algorithm, the suppression approach is realized based on the idea that the best edge pixels have the maximum gray gradient compared to their neighbors. Thus, the method deletes those non-maximum pixels and ensures that the width of the edges is just one pixel. In our work, the wall points have the maximum point density compared to their neighbors, and we can use a similar operation to remove points from windows and other wall attachments. The main issue here is to decide the suppression orientation and range. For the building wall, it is obvious that the orientation should be consistent with the wall’s normal vectors. Under such consideration, the n v described in the above section is used, and we search for a region of 10 pixels. Moreover, we did not remove all of the non-maximum grids, but maintained those pixels that have a density greater than eighty percent of the maximum value.

2.1.3. Multiple Cue Weighted RANSAC

This section extracts 2D line segments for the building walls using the weighted RANSAC algorithm [29]. The principle of the method on point clouds can be found in our earlier research [30]. We did not directly use the project points as the basic voting term but used the grid pixels instead, which can greatly increase the efficiency while not significantly influencing the precision. For each grid pixel p ( p o s , n v , w e i g h t ) , three elements are considered when deciding its contribution to the 2D RANSAC hypothetical models:
w ( d , θ , K ) = K exp ( d 2 σ d 2 θ 2 σ θ 2 )
where d is the 2D distance between p o s and the hypothetical line, θ is the intersection angle between n v and the line normal, and K is the weight value (grid points number). The σ d and σ θ are the priori medium errors of raw point clouds, which are fixed values. According to the work of [31], they can be set as:
σ d = T h d i s 1.96
σ θ = T h n v 1.96
where T h d i s and T h n v are the thresholds to decide the line inliers, and after a certain number of iterations, the linear model with the largest sum of the weights of the interior points is selected as the optimal line model L ^ :
L ^ = arg max L p i U w i d , θ , K
where U is the set of selected grid pixels, which are the same for all scored parameters.

2.1.4. Post-Processing

The main task of the post-processing step is to refine the segmentation results, including the removal of spurious lines, connecting adjacent collinear ones, and the overall adjustment of the line to building domain orientation. The orientation can be estimated by the median value of all lines’ direction angles, similar to the estimation of grid orientation in Section 2.1.2. We then consider the consistency between each line and the estimated orientation and adjust them to the target direction if the angle difference is lower than T h n v . After the adjustment, adjacent parallel lines with a distance lower than T h d i s are combined. Moreover, spurious lines that have anomalous orientation and low point density are removed directly.

2.2. Graph-Based Wall Topology Analysis

For cadastral surveys, complete closed boundaries of buildings or courtyards are needed to meet the requirements for area and ownership measurement, so it is necessary to construct the topological relations between the line segments, then intersect line segments, and finally obtain vectorized polygons. Meanwhile, we need to distinguish the house from the general courtyard wall. In this work, a graph structure is adopted for the wall topology and closed-loop analysis, and the workflow is described in Figure 3.

2.2.1. Line Segment Topology Graph

The graph structure is a widely used way to represent the target objects and their mutual adjacency relationships. In the field of LOD-2 building reconstruction, the roof topology graph (RTG) is often adopted to represent the plane–plane topology [32]. Analysis of the graph structure can help distinguish roof features and primitive types by searching for loops or typical sub-graphs inside [33,34]. In this work, similar to the RTG, a wall line segment topology graph (WLTG) is constructed, with the obtained wall line segments as graph vertices and the adjacency relationships between the line segments as graph edges. The existence of graph edges can be decided based on the point–point connection between the inliers of line segments. As shown in Figure 3b, the Triangulation Network (TIN) is built based on the CGAL library, and we search the TIN edges that connect points from different line segments. Since only the wall points are considered in the TIN structure, the TIN edges that are longer than a given threshold T h l e n (0.5 m in the test) are omitted to avoid the TIN edges that pass through the whole house. We connect the line segments that meet the requirements of TIN connections in the graph structure as an initial WLTG. Edge labels can also be added to the graph edges, similar to the work in [32], which indicates further information about the connection when trying to connect adjacent lines or conduct the topology analysis.

2.2.2. Graph-Based Wall Connecting and Correction

The main task of this section is to determine the location of intersected corner points and connect the adjacent wall line segments to the closed polygonal house boundary under the guidance of a WLTG. The problem is that, similar to the RTG-based methods, topology errors are inevitable in a WLTG. Short line segments may be lost, and spurious connections will appear when two non-intersecting walls are too close. Moreover, as shown in Figure 3e, sometimes the intersected points may not be the endpoint of the line segments, but in the middle part. Therefore, additional processing is required to distinguish the connecting type and correct the errors. We further categorize the initial connections between walls into four types, and the definition and corresponding operation are described below:
(a)
Spurious edge, where the average point density is below the pre-given threshold T h n u m . We simply delete the corresponding graph edge.
(b)
L type edge, where if two line segments are vertical and both need to be extended to the corner point or the length of exceeding part does not exceed a T h l e n . The two line segments are directly intersected at the corner.
(c)
T type edge, where two line segments are vertical but do not form an L type edge. The bottom edge is extended to the intersected corner, while the top one is decomposed at the corner point and similar operations are adopted on the WLTG.
(d)
Z type edge, where two line segments are parallel. We add the missed short vertical edges, and, meanwhile, added one graph vertex and two graph edges to the WLTG.
The average point density in (a) is defined as below:
d e n s i t y = N u m p t s 2 × l e n × T h d i s
where N u m p t s is the number of line inlier points, l e n is the length of the line segments, and T h d i s is the distance threshold in RANSAC-based line detection.

2.2.3. Graph-Based Closed-Loop Analysis

Just like the minimum closed-loop in the RTG that often indicates the roof corners, the closed-loops in the WLTG will represent closed building boundary courtyard walls. As shown in Figure 3c, the closed loop 1 , 2 , 3 , 4 formed by the vertices represents the boundary of the compound, and the closed loop formed by the vertices 1 , 5 , 6 , 7 , 8 represents the boundary of the house. The calculation of the minimum closed loop is rather simple: repeatedly delete a graph edge and then use the Dijkstra algorithm to find the shortest path between the two endpoint points of the edge. The closed loops are then extracted by connecting the path with edge endpoints.
For the task of the cadastral survey, further distinguishing of the courtyard walls from the buildings is required. Additionally, according to the latest regulation of building estate measurement and register, unenclosed balconies and concave doorways are calculated by half-areas, thus needing specially extracted. We distinguish them based on the point clouds of the building roof. Rough segmentation results for the building roof can be generated by the height above DEM (set as 2 m) and the point cloud roughness estimated by the tensor voting algorithm [35], since building roofs are considered to be much higher than the ground and have a significant plate tensor. Since the building polygon will be filled up by the roof points, the percentage of grids having roof points within the boundary are taken as the standard to distinguish courtyard walls from the buildings, and a simple 80 % threshold is enough for most cases. And, those areas having roof points while existing outside the boundary will be further checked according to regulation standards. The areas and types of boundaries can then be calculated and marked for further usage in the cadastral survey.

3. Experiments and Evaluation

This section evaluates the proposed methods experimentally. An introduction to the datasets, parameters, and evaluation metrics is first provided in Section 3.1, followed by the overall results in Section 3.2. Local details and analysis on the precision and efficiency are provided in Section 3.3.

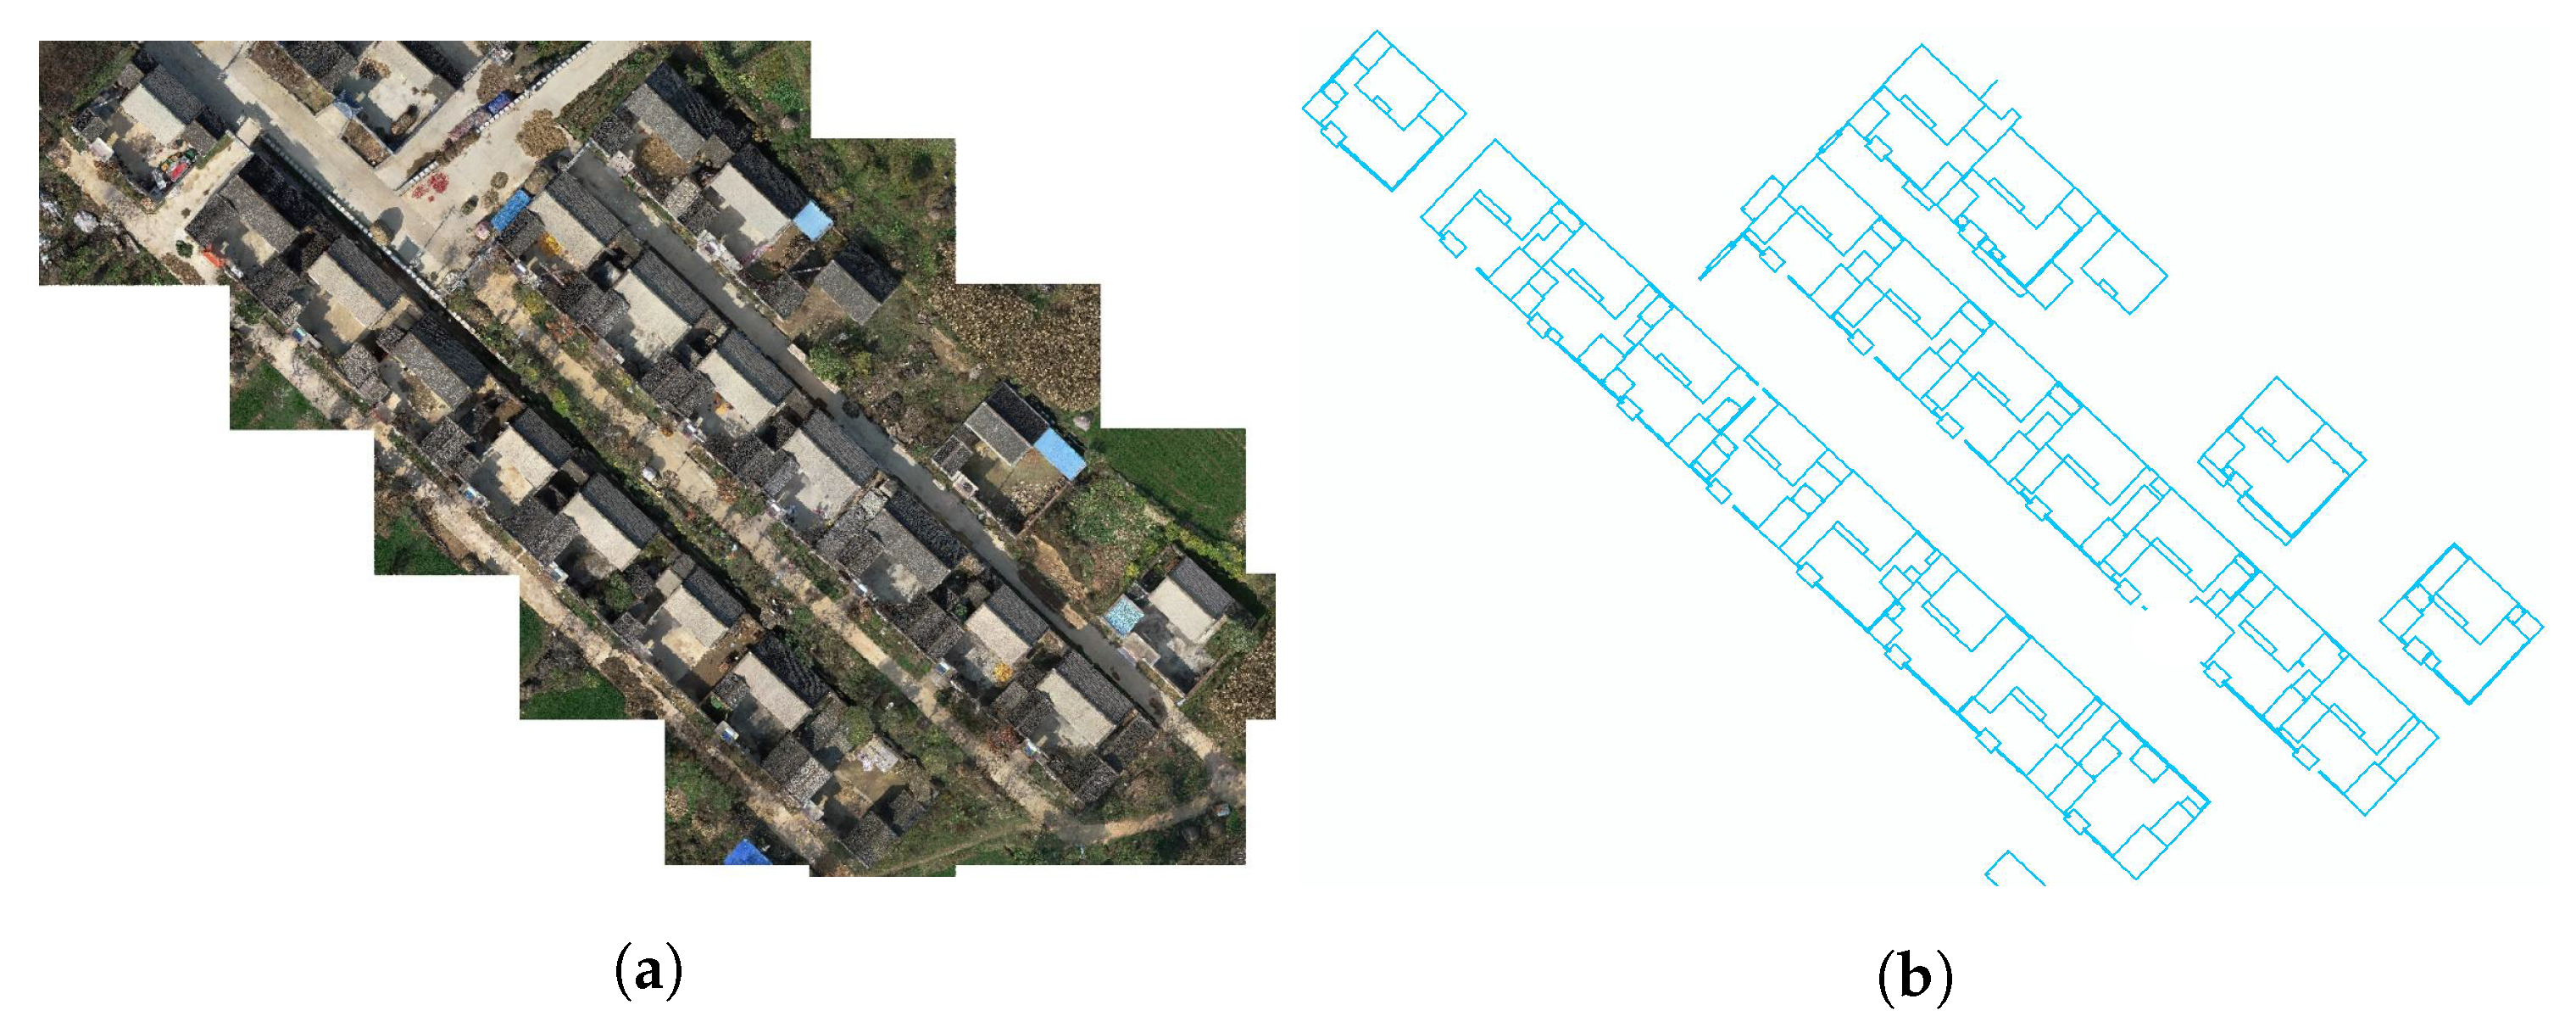
3.1. Dataset, Parameters and Metrics

In this work, the point cloud obtained by tilt photography in an area of Xi’An is selected as the experimental data, as shown in Figure 4a. The spatial resolution of the original tilt aerial camera film is about 1.5 cm, and the density of the generated point cloud is randomly re-sampled to about 400/m 2 , and an average point distance of 5 cm. The area of the test region is about 17,500 m 2 , and manual vector maps are produced as reference data, as shown in Figure 4b. The properties of the dataset and statistical information of the reference can be found in Table 1. The parameters used in the proposed approaches are described in Table 2. The grid size and projection density should be adaptive with the average point distance. The thresholds T h d i s and T h n v reflect the precision and smooth of the point clouds. The rest of the parameters are used to separate the bounding boundary from the courtyard.
The evaluation metrics include three parts: the precision of the wall corner location via the Roof Mean Square Errors, as well as the completeness (comp), correctness (Corr), and quality (Qua) indexes regarding the wall corners, lines, and polygons [36]. All of the considered elements are described below:
R M S E = n U d i s ( p t r e f , p t r e s ) 2 n C o m p = T P T P + F N C o r r = T P T P + F P Q u a = T P T P + F N + F P
where U is the set of wall corners, and d i s ( p t r e f , p t r e s ) is the 2D Euclidean distance between the reference corner points and the detected results. T P (True Positive) is the number of objects which exist in both the reference and results, F P (False Positive) is the number of objects not found in the reference, and F N (False Positive) is the number of objects not found in the results.

3.2. Overall Results

An overall view of the regularized wall boundaries detected from dense points is shown in Figure 5. The areas include individual courtyards like (a) to (c), and connected courtyards like (d) to (f). It can be seen that the building outline obtained by the proposed algorithm is very complete, and it can effectively avoid the interference of eaves and corridors on the accuracy of building boundaries. Additionally, both building outline and courtyards are included. The qualitative results are also provided in Table 3. It can be seen that the average RMSE of the proposed method can be about 8.4 cm and the correctness index of corners, edges, and polygons are above 92%.

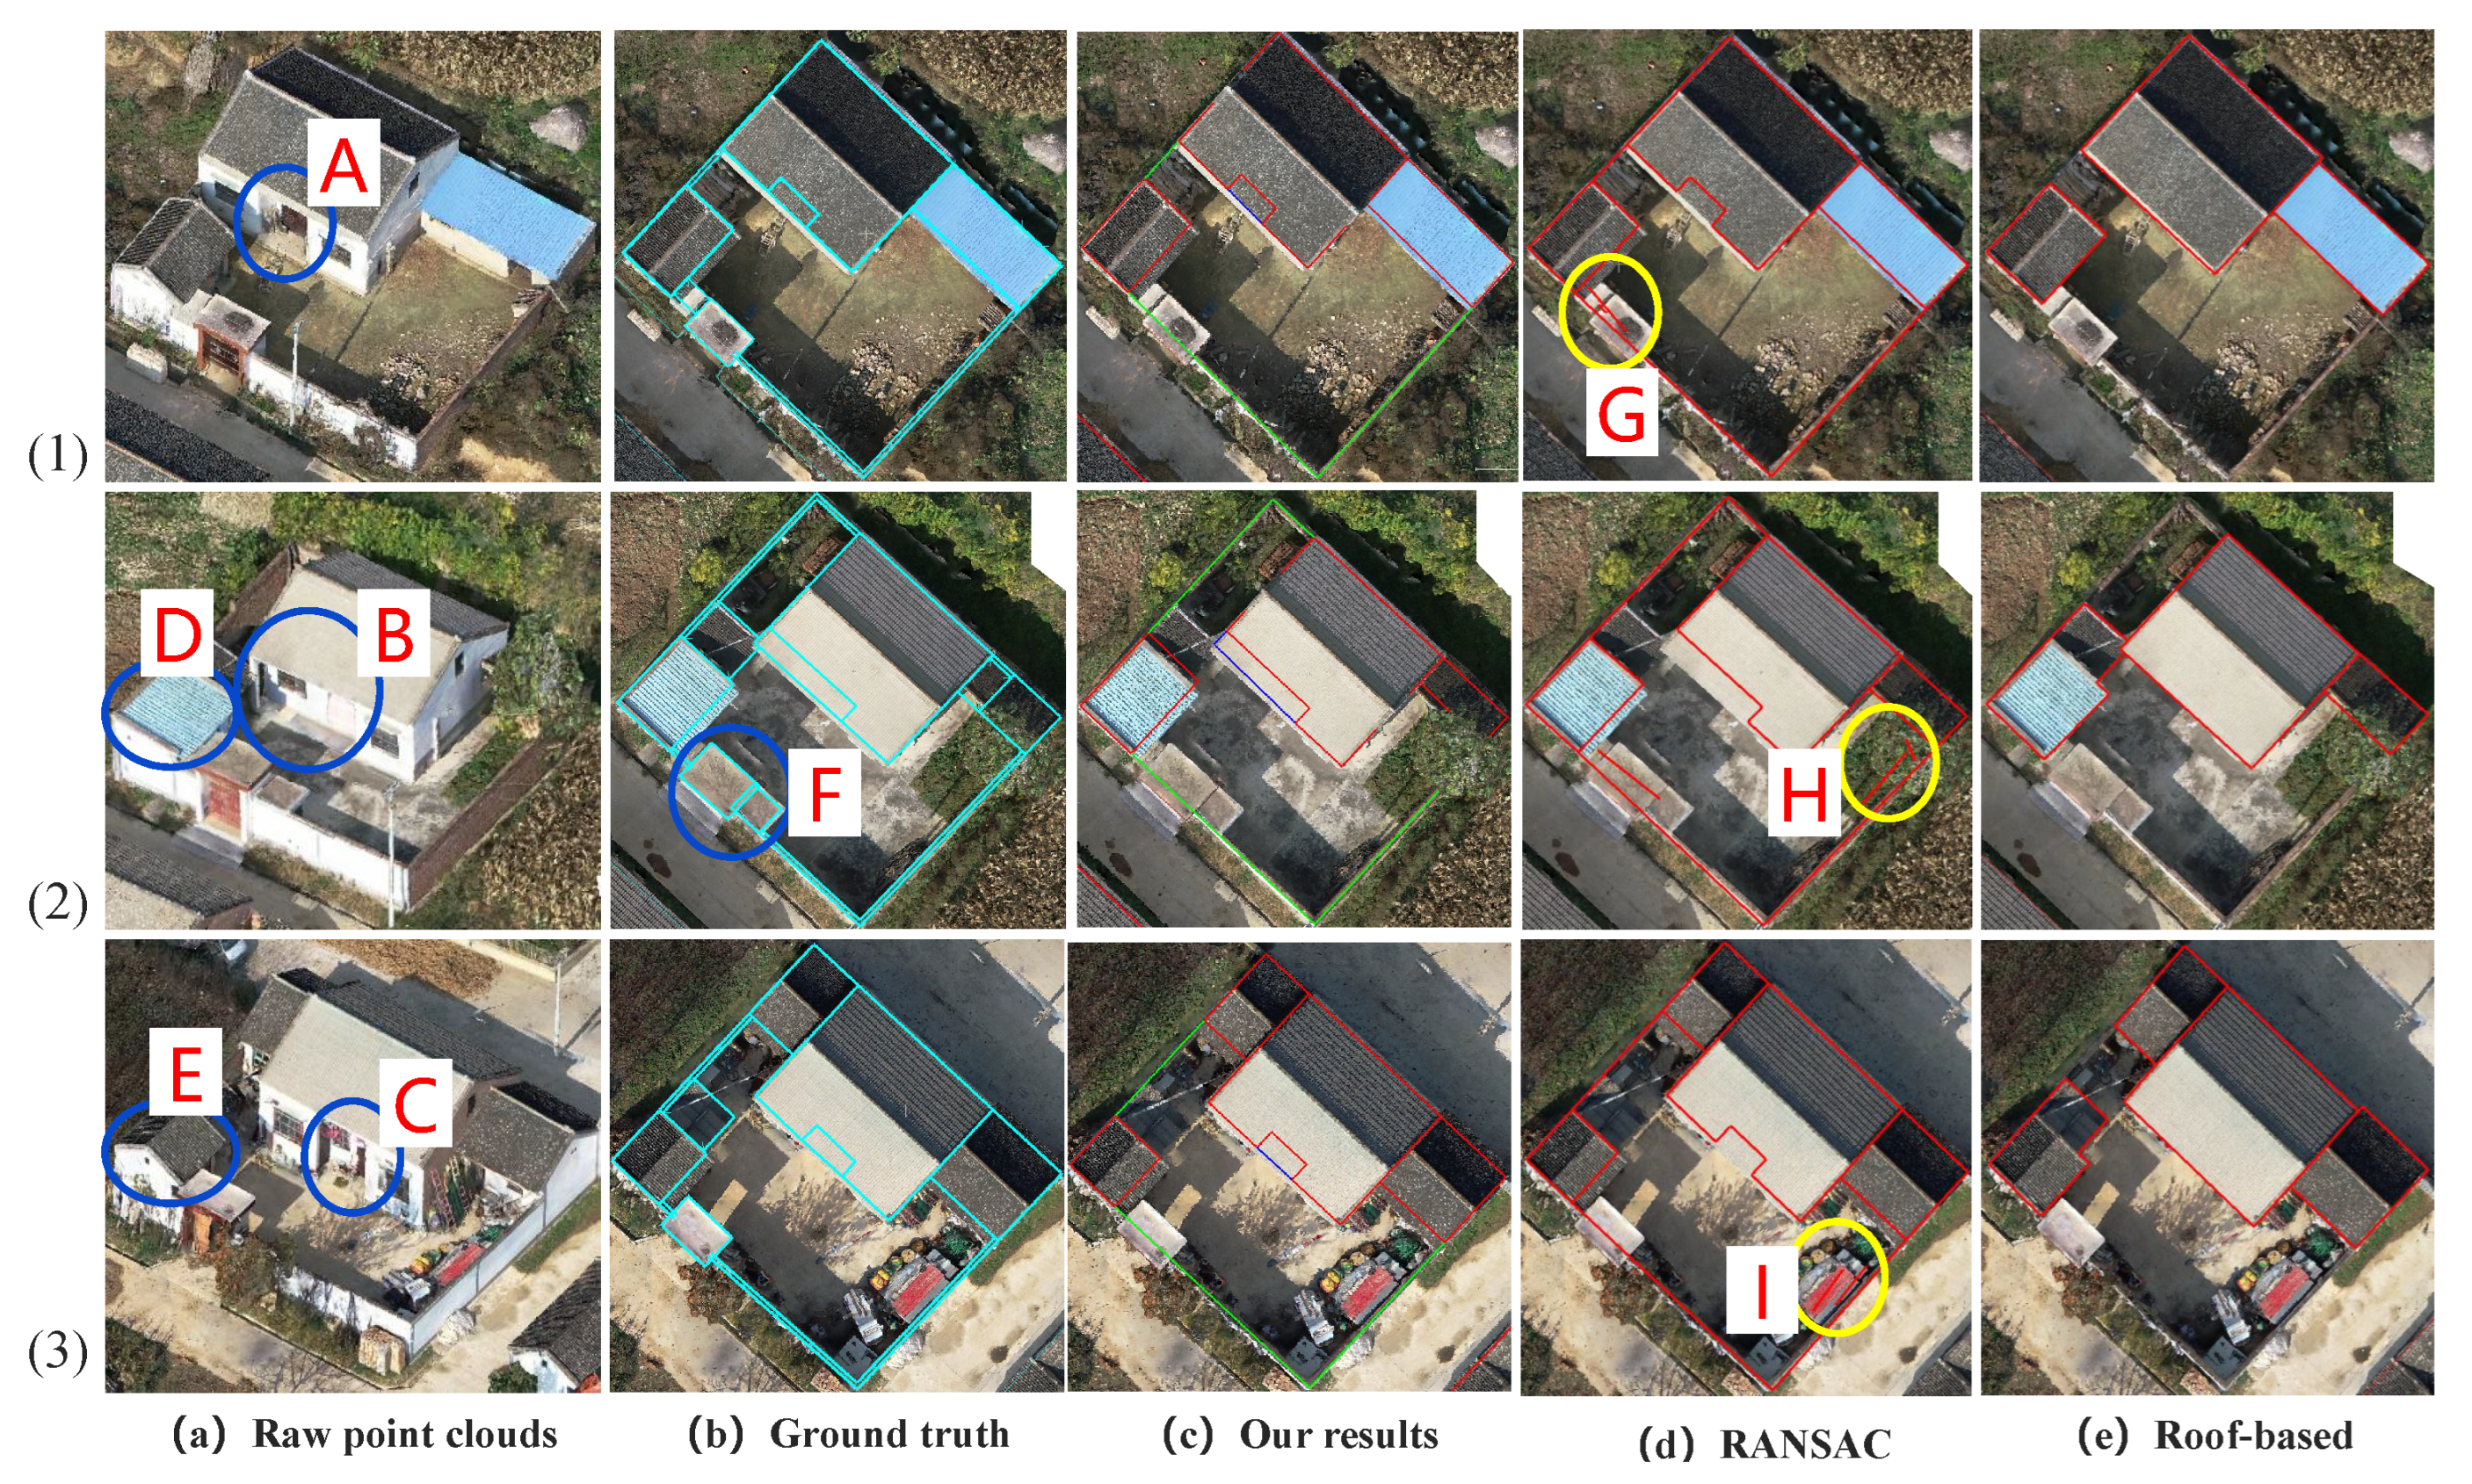
3.3. Compare and Local Details

In this section, the proposed methods are compared with classical RANSAC and the polygon boundaries outlined directly from the rooftop point clouds. The qualitative results are provided in Figure 6. For boundaries directly from the building roof, since housing structures such as eaves and doorways are prevalent in rural buildings, the precision of wall corners is very low; mostly larger than 0.2 m. Meanwhile, the recessed objects are no longer considered, resulting in low edge completeness and quality indexes. That is the reason that results from single top-view images are no longer used in recent applications. We also compare our methods with traditional RANSAC. It can be seen that our results are closer to the manual outputs, with much lower RMSE and higher corner and edge indexes. This is due to the fact that spurious or multiple edges are avoided and the edge locations are more precise. This verifies the effectiveness of our weighted RANSAC and non-maximum suppression.
The local details are compared in Figure 7, where the classical RANSAC and roof-based approaches are compared. It can be seen that our results are more consistent with the manual ground truth than the compared methods. Most building boundaries are closed, and the eaves and doorways are well distinguished and extracted. For locations A, B, and C, both compared methods have difficulties to obtain the complete and precise results. Our method can balance the advantages of both wall and roof information well, thus producing outputs close to the ground truth. For D and E in Figure 7, we notice a large roof eave, and it can be seen that roof-based methods will produce a large spurious region, leading to poor wall corner precision. As for G, H, and I, many spurious line segments will be extracted, leading to error line segment topology relationships. In conclusion, our methods generate better corner precision and edge completeness, and, meanwhile, can distinguish different boundary types well.

3.4. Limitation and Discussion

In this work, dense oblique point clouds are used to acquire a direct observation of the building’s outer wall. This ensures the precision of extracted boundaries that are consistent with normative requirements. However, due to the limited viewing angles, occlusion, and noise, the wall points in the raw point clouds may be incomplete. Moreover, the definition of the cadastral survey, in theory, includes not only the extraction of building and courtyard boundaries but also the separation of substructures like independent columns and single-column porches. Half-areas of those substructures will be also calculated in the final statistical results, which are difficult to separate due to the limited size and various types. We only have some trails on the porches that are consistent with the rooftop, and many more types need to be considered. As a result, some further interactions and additions are still required in real applications. In Figure 8, some examples of the limitations are given and we summarize the situations in the following aspects:
(1)
The non-closed walls caused by shared or occluded walls. As shown in location 2 of Figure 8, since our method detects the vector boundaries mainly based on the wall points and building roof from UAV-based point clouds, it will fail when buildings are adjacent or even connected, where no wall points are available. In such situations, the boundaries will be merged, which may require further manual additions in real applications to separate them.
(2)
For the gates and ancillary structures of the compound wall, i.e., in location 3 of Figure 8, since only one wall plane passes through the boundaries and polygons are detracted, our methods simply produce linear detection results, and the small polygons and the wall width are not considered. Further operations are still needed to meet the industry requirements of the cadastral survey.
(3)
Due to the influence of noise, the occlusion of vegetation, and various other factors, spurious edges may still appear and require further checking. In location 1 of Figure 8, it can be seen that a large amount of debris is usually piled up along the yard walls of rural houses; this may cause occlusion or spurious edges and require further checks in the process of actual production application.

4. Conclusions

To address the high cost, slow update, and low accuracy of the extraction results by automated methods in the current cadastral survey, this paper proposes a fast acquisition method of 2D vector contours of buildings and counteryards based on UAV imagery-based point cloud data. The multiple cue RANSAC algorithm with non-maximal suppressing is proposed to fit the non-maximum suppressed wall points to obtain a high-accuracy building boundary, and the wall line segment topology graph is constructed to describe and identify the topology relationship among the wall lines, eventually producing closed boundaries. It is proved that this method can effectively detect the 2D vector contours of buildings with high accuracy and correct topology. For the area with good point cloud quality, the detection correctness and completeness for building corner points can reach 93.2% and 84.9%, with a median error of about 10 cm. Independent house and compound contours can be identified by topological map minimum ring detection, which helps the cadastral survey to count the floor area and compound area, respectively. The proposed methods have shown their potential for efficiency and precision in the real cadastral survey applications in the Xi’an province, China. Precise boundary polygons with simple semantic descriptions are provided and can greatly decrease the necessary interactions in production applications.
Further work will focus on improving boundary integrity and robustness to occlusions or false edges. First, building examples can be generated from roofs to better guide the separation of neighboring buildings. Second, these methods have the potential to be extended to other building types beyond rural buildings. Third, it can also be used for other scenarios related to linear features, including interior rooms.

Author Contributions

Conceptualization, B.X. and M.C.; Data curation, B.X., Z.H.; Formal analysis, Z.H.; Funding acquisition, B.X.; Investigation, B.X. and Z.H.; Methodology, B.X. and Z.H.; Project administration, M.C.; Resources, B.X.; Software, Z.H.; Supervision, B.X. and M.C.; Validation, B.X. and M.C.; Visualization, Z.H.; Writing—original draft, B.X.; Writing—review and editing, M.C. All authors have read and agreed to the published version of the manuscript.

Funding

This work was partly supported by the Open Fund of Key Laboratory of Urban Land Resources Monitoring and Simulation, Ministry of Natural Resources Project (No:KF2021-06-015), the National Natural Science Foundation of China (Projects No: 41971411), as well as the Open Fund of the National Engineering Research Center for Digital Construction and Evaluation Technology of Urban Rail Transit (No:2023HY01).

Institutional Review Board Statement

Not applicable.

Informed Consent Statement

Not applicable.

Data Availability Statement

The used data and initial ground truth are available at the link below(accessed on 1 Sep 2023): https://drive.google.com/file/d/10852eH8XzfmmxsrZZ4oFD8QIKatQjDEk/view?usp=drive_link.

Conflicts of Interest

The authors declare no conflict of interest.

Abbreviations

The following abbreviations are used in this manuscript:
UAVUnmanned Aerial Vehicle
RANSACRANdom SAmple Consensus
RTGRoof Topology Graph
WLTGwall line segment topology Graph
DBSCANDensity-Based Spatial Clustering

References

  1. Crommelinck, S.; Bennett, R.; Gerke, M.; Nex, F.; Yang, M.Y.; Vosselman, G. Review of automatic feature extraction from high-resolution optical sensor data for UAV-based cadastral mapping. Remote Sens. 2016, 8, 689. [Google Scholar] [CrossRef]
  2. Manyoky, M.; Theiler, P.; Steudler, D.; Eisenbeiss, H. Unmanned aerial vehicle in cadastral applications. Int. Arch. Photogramm. Remote Sens. Spat. Inf. Sci. 2012, 38, 57–62. [Google Scholar] [CrossRef]
  3. Fetai, B.; Oštir, K.; Kosmatin Fras, M.; Lisec, A. Extraction of visible boundaries for cadastral mapping based on UAV imagery. Remote Sens. 2019, 11, 1510. [Google Scholar] [CrossRef]
  4. Chio, S.H.; Chiang, C.C. Feasibility study using UAV aerial photogrammetry for a boundary verification survey of a digitalized cadastral area in an urban city of Taiwan. Remote Sens. 2020, 12, 1682. [Google Scholar] [CrossRef]
  5. Crommelinck, S.; Höfle, B.; Koeva, M.; Yang, M.Y.; Vosselman, G. Interactive cadastral boundary delineation from UAV data. Isprs Ann. Photogramm. Remote Sens. Spat. Inf. Sci. 2018, 4, 81–88. [Google Scholar] [CrossRef]
  6. Karataş, K.; Altınışık, N.S. Assessing the utilization of UAV technology for cadastre update applications in Turkey based on cost-benefit analysis. Surv. Rev. 2023, 1–13. [Google Scholar] [CrossRef]
  7. Wassie, Y.; Koeva, M.; Bennett, R.; Lemmen, C. A procedure for semi-automated cadastral boundary feature extraction from high-resolution satellite imagery. J. Spat. Sci. 2018, 63, 75–92. [Google Scholar] [CrossRef]
  8. Xia, X.; Persello, C.; Koeva, M. Deep fully convolutional networks for cadastral boundary detection from UAV images. Remote Sens. 2019, 11, 1725. [Google Scholar] [CrossRef]
  9. Li, J.; Huang, X.; Tu, L.; Zhang, T.; Wang, L. A review of building detection from very high resolution optical remote sensing images. Gisci. Remote Sens. 2022, 59, 1199–1225. [Google Scholar] [CrossRef]
  10. Leotta, M.J.; Long, C.; Jacquet, B.; Zins, M.; Lipsa, D.; Shan, J.; Xu, B.; Li, Z.; Zhang, X.; Chang, S.; et al. Urban Semantic 3D Reconstruction From Multiview Satellite Imagery. In Proceedings of the 2019 IEEE/CVF Conference on Computer Vision and Pattern Recognition Workshops (CVPRW), Long Beach, CA, USA, 16–17 June 2019; pp. 1451–1460. [Google Scholar]
  11. Badrinarayanan, V.; Kendall, A.; Cipolla, R. Segnet: A deep convolutional encoder-decoder architecture for image segmentation. IEEE Trans. Pattern Anal. Mach. Intell. 2017, 39, 2481–2495. [Google Scholar] [CrossRef]
  12. Pasquali, G.; Iannelli, G.C.; Dell’Acqua, F. Building footprint extraction from multispectral, spaceborne earth observation datasets using a structurally optimized U-Net convolutional neural network. Remote Sens. 2019, 11, 2803. [Google Scholar] [CrossRef]
  13. Wang, X.; Ma, B.; Qing, Z.; Sang, Y.; Gao, C.; Zhang, S.; Sang, N. Cbr-net: Cascade boundary refinement network for action detection: Submission to activitynet challenge 2020 (task 1). arXiv 2020, arXiv:2006.07526. [Google Scholar]
  14. Guo, H.; Du, B.; Zhang, L.; Su, X. A coarse-to-fine boundary refinement network for building footprint extraction from remote sensing imagery. Isprs J. Photogramm. Remote Sens. 2022, 183, 240–252. [Google Scholar] [CrossRef]
  15. Cai, J.; Chen, Y. MHA-Net: Multipath Hybrid Attention Network for building footprint extraction from high-resolution remote sensing imagery. IEEE J. Sel. Top. Appl. Earth Obs. Remote Sens. 2021, 14, 5807–5817. [Google Scholar] [CrossRef]
  16. Ling, H.; Gao, J.; Kar, A.; Chen, W.; Fidler, S. Fast interactive object annotation with curve-gcn. In Proceedings of the IEEE/CVF Conference on Computer Vision and Pattern Recognition, Long Beach, CA, USA, 15–20 June 2019; pp. 5257–5266. [Google Scholar]
  17. Li, Z.; Wegner, J.D.; Lucchi, A. Topological map extraction from overhead images. In Proceedings of the IEEE/CVF International Conference on Computer Vision, Seoul, Republic of Korea, 27 October–2 November 2019; pp. 1715–1724. [Google Scholar]
  18. Zorzi, S.; Bazrafkan, S.; Habenschuss, S.; Fraundorfer, F. Polyworld: Polygonal building extraction with graph neural networks in satellite images. In Proceedings of the IEEE/CVF Conference on Computer Vision and Pattern Recognition, New Orleans, LA, USA, 18–24 June 2022; pp. 1848–1857. [Google Scholar]
  19. Sampath, A.; Shan, J. Building boundary tracing and regularization from airborne LiDAR point clouds. Photogramm. Eng. Remote Sens. 2007, 73, 805–812. [Google Scholar] [CrossRef]
  20. Sun, Y.; Zhang, X.; Zhao, X.; Xin, Q. Extracting building boundaries from high resolution optical images and LiDAR data by integrating the convolutional neural network and the active contour model. Remote Sens. 2018, 10, 1459. [Google Scholar] [CrossRef]
  21. Yan, Y.; Yao, X.; Qiu, Y. Research on cadastral survey method based on 3D reality model and laser point cloud data. In Proceedings of the International Conference on Precision Instruments and Optical Engineering (PIOE 2022), Guangzhou, China, 23–25 September 2022; Volume 12585, pp. 150–155. [Google Scholar]
  22. Šafář, V.; Potůčková, M.; Karas, J.; Tlustý, J.; Štefanová, E.; Jančovič, M.; Cígler Žofková, D. The Use of UAV in Cadastral Mapping of the Czech Republic. Isprs Int. J. -Geo-Inf. 2021, 10, 380. [Google Scholar] [CrossRef]
  23. Xia, S.; Wang, R. Façade separation in ground-based LiDAR point clouds based on edges and windows. IEEE J. Sel. Top. Appl. Earth Obs. Remote Sens. 2019, 12, 1041–1052. [Google Scholar] [CrossRef]
  24. Widyaningrum, E.; Gorte, B.; Lindenbergh, R. Automatic building outline extraction from ALS point clouds by ordered points aided hough transform. Remote Sens. 2019, 11, 1727. [Google Scholar] [CrossRef]
  25. dos Santos, R.C.; Galo, M.; Habib, A.F. Regularization of building roof boundaries from airborne LiDAR data using an iterative CD-spline. Remote Sens. 2020, 12, 1904. [Google Scholar] [CrossRef]
  26. Sohn, G.; Huang, X.; Tao, V. Using a Binary Space Partitioning Tree for Reconstruction Polyhedral Building Models from Airbome Lidar Data. Photogramm. Eng. Remote Sens. 2008, 74, 1425–1440. [Google Scholar] [CrossRef]
  27. Schubert, E.; Sander, J.; Ester, M.; Kriegel, H.P.; Xu, X. DBSCAN revisited, revisited: Why and how you should (still) use DBSCAN. Acm Trans. Database Syst. (Tods) 2017, 42, 1–21. [Google Scholar] [CrossRef]
  28. Canny, J. A computational approach to edge detection. IEEE Trans. Pattern Anal. Mach. Intell. 1986, PAMI-8, 679–698. [Google Scholar] [CrossRef]
  29. Fischler, M.A.; Bolles, R.C. Random sample consensus: A paradigm for model fitting with applications to image analysis and automated cartography. Commun. Acm 1981, 24, 381–395. [Google Scholar] [CrossRef]
  30. Xu, B.; Jiang, W.; Shan, J.; Zhang, J.; Li, L. Investigation on the Weighted RANSAC Approaches for Building Roof Plane Segmentation from LiDAR Point Clouds. Remote Sens. 2016, 8, 5. [Google Scholar] [CrossRef]
  31. Torr, P.H.; Zisserman, A. MLESAC: A new robust estimator with application to estimating image geometry. Comput. Vis. Image Underst. 2000, 78, 138–156. [Google Scholar] [CrossRef]
  32. Elberink, S.O.; Vosselman, G. Building reconstruction by target based graph matching on incomplete laser data: Analysis and limitations. Sensors 2009, 9, 6101–6118. [Google Scholar] [CrossRef]
  33. Xiong, B.; Elberink, S.O.; Vosselman, G. A graph edit dictionary for correcting errors in roof topology graphs reconstructed from point clouds. Isprs J. Photogramm. Remote Sens. 2014, 93, 227–242. [Google Scholar] [CrossRef]
  34. Perera, G.S.N.; Maas, H.G. Cycle graph analysis for 3D roof structure modelling: Concepts and performance. Isprs J. Photogramm. Remote Sens. 2014, 93, 213–226. [Google Scholar] [CrossRef]
  35. You, R.J.; Lin, B.C. Building Feature Extraction from Airborne Lidar Data Based on Tensor Voting Algorithm. Photogramm. Eng. Remote Sens. 2011, 77, 1221–1231. [Google Scholar] [CrossRef]
  36. Awrangjeb, M.; Fraser, C.S. An Automatic and Threshold-Free Performance Evaluation System for Building Extraction Techniques From Airborne LIDAR Data. IEEE J. Sel. Top. Appl. Earth Obs. Remote Sens. 2014, 7, 4184–4198. [Google Scholar] [CrossRef]
Figure 1. The overall workflow of proposed approach.
Applsci 13 10197 g001
Figure 2. The workflow of wall segment detection and adjustments. (a) the input point clouds of rural buildings, (b) the projected wall points after density-based clustering and the enlarged region to be processed via non-maximum suppression, (c) the line segments detected by the multiple cues RANSAC algorithm, (d) the global adjustments of edge lines in post processing and (e) the output edge lines.
Applsci 13 10197 g002
Figure 3. The workflow of graph-based wall topology analysis. (a) the input line segments, (b) the extraction of wall-wall topology via TIN-based adjacency, (c) the initial wall line topology graph generated by local analysis among adjacent walls, (d) the connection of line segments based on the topology relationship, (e) the modified wall line topology graph after the analysis of wall topology and (f) the final results for edge boundaries.
Applsci 13 10197 g003
Figure 4. Overall view of the input point cloud and reference vector map. (a) Input color point clouds. (b) Manual reference vector map.
Applsci 13 10197 g004
Figure 5. Overall view of the regularized boundaries detected from dense points. Red lines: boundary edges from wall points, and blue lines: extracted doorway boundaries.
Applsci 13 10197 g005
Figure 6. Comparison of the proposed methods with traditional RANSAC and the polygon boundaries outlined directly from the roof top point clouds. (a,b) are the RMSE and quality index for wall corners defined in Equation (6), (c,d) are the quality indexes for edges and polygons.
Applsci 13 10197 g006aApplsci 13 10197 g006b
Figure 7. Comparison of local details. From left to right are input point clouds, ground truth, our results, and results of classical RANSAC and direct output from roof point clouds. For areas A, B, and C, incomplete results will be caused by porches for compared methods; for D and E, roof-based approaches are more likely to produce enlarged boundaries; for G, H, and I, spurious lines are extracted for traditional RANSAC-based methods.
Applsci 13 10197 g007
Figure 8. Limitation of the proposed methods. The left area is selected from area f and the right area is from area a. Location 1: the wall is occluded by the debris; location 2: buildings are connected and no wall exists; and location 3: only one wall plane passes through the boundaries and polygons are detracted.
Applsci 13 10197 g008
Table 1. The properties of the dataset and reference.
LocationPoint DensityArea SizeGround Truth
CornersEdgesPolygons
Xi’An400 pts/m 2 17,500 m 2 37135063
Table 2. The parameters used in the experiments.
Grid SizeDensityRANSACRoof Extraction
Th _ dis Th _ nv DEM HeiPlanarityPerc
Para0.1 m500.2 m10 2 m0.980%
Grid Size: used in the rasterization procedure in Section 2.1.2, Density is described in Section 2.2.2 to extract spurious walls. T h _ d i s and T h _ n v are the two thresholds to decide line inliers in the RANSAC algorithm. The rest of the parameters are used to separate the building boundaries from the courtyard walls in Section 2.2.3.
Table 3. Overall qualitative results of the proposed method. a to f are the selected areas given in Figure 5.
AreaCornersEdgesPolygons
RMSECoorCompQuaCoorCompQuaCoorCompQua
a0.066100.090.090.089.581.074.0100100100
b0.06590.085.778.290.085.778.2100100100
c0.08595.082.679.294.781.878.2100100100
d0.06993.989.684.793.287.282.010088.988.9
e0.09391.784.078.190.484.477.590.075.069.2
f0.08694.183.579.393.586.381.488.980.072.7
average0.08493.284.979.992.085.179.292.982.577.6
Disclaimer/Publisher’s Note: The statements, opinions and data contained in all publications are solely those of the individual author(s) and contributor(s) and not of MDPI and/or the editor(s). MDPI and/or the editor(s) disclaim responsibility for any injury to people or property resulting from any ideas, methods, instructions or products referred to in the content.

