Abstract
Cancer is a disease characterised by changes in combinations of genes within affected tumour cells. The deep understanding of genetic activity afforded to cancer specialists through complex genomics data analytics has advanced the clinical management of cancer by using deep machine learning algorithms and visualisation. However, most of the existing works do not integrate intelligent decision-making aids that can guide users in the analysis and exploration processes. This paper contributes a novel strategy that applies game theory within a VR-enabled immersive visualisation system designed as the decision support engine to mimic real-world interactions between stakeholders within complex relationships, in this case cancer clinicians. Our focus is to apply game theory to assist doctors in the decision-making process regarding the treatment options for rare-cancer patients. Nash Equilibrium and Social Optimality strategy profiles were used to facilitate complex analysis within the visualisation by inspecting which combination of genes and dimensionality reduction methods yields the best survival rate and by investigating the treatment protocol to form new hypotheses. Using a case simulation, we demonstrate the effectiveness of game theory in guiding the analyst with a patient cohort data interrogation system as compared to an analyst without a decision support system. Particularly, the strategy profile (t-SNE method and DNMT3B_ZBTB46_LAPTM4B gene) gains the highest payoff for the two doctors.
1. Introduction
In the postgenomic era, technological advances in data collection, such as DNA sequencing to build an individual genetic profiles, have generated a vast amount of data. Visual and data analytics are critical functions that build new insights, enable knowledge discovery, and support diagnoses or personalised treatment planning for genetically driven diseases like cancer [1,2]. However, the complexity of the human genome with thousands of relevant genes exceeds the ability of humans, e.g., clinicians, who make clinical decisions based on limited available facts [3]. The complexity of the human genome makes a patient unique, and it opens new opportunities for data analysts in identifying and understanding the unique factors underlying a patient’s disease.
Computational and statistical analytic methods alone may not solve complex data problems effectively, and their results could be rejected by medical domain experts due to lack of trust and low interpretability [4,5]. Interactive visualisation can explain and verify and allow users to explore and see computed and original data in interpretable ways informing pattern recognition, insight, and relationship discovery to amplify cognition and enable visual analytics [6]. The ability to handle complex data sets of visualisations has gained popularity in big data analytics and has been used as a precursor to data science algorithms for data exploration [7,8]. Specifically, visualisation can facilitate early-stage data discovery in cases where the data problems are ill-defined or unsuitable for algorithmic analysis. A classic example is that the correlation coefficients of different data sets have the same value, but visual analytics would have detected their vast differences [9].
In recent years, immersive technologies have also been utilised to further the visual analytics capabilities of multisensory immersive analytics. Immersive analytics utilises new displays and interaction technologies to provide multisensory interfaces where users can immerse themselves inside the data. Visualisation in the immersive environment, also called immersive visualisation, allows the user to gain greater insight into complex data by applying multisensory input, applying physicalisation of data, and using the natural interface [10]. Some of the examples of work in the application of immersive visualisation for genomic data are MinOmis [11], StarMap [12], BioVR [13], SinglecellVR [14], and recently VROOM [15]. Unfortunately, existing immersive analytics systems do not integrate intelligent decision-making aids that can guide users in the analysis and exploration processes. In such analytical environments, there could be many ways that analysts can look at the data based on different scenarios, hypotheses, and parameters; hence, a theoretical-based guiding system would be essential.
Game theory, also known as the “theory of social situation”, studies strategies for negotiation and coordination among self-interested agents to maximise their returns in the forms of utility value [16,17,18,19,20]. Game theory, closely related to Decision Theory, has its root in von Neumann and Morgenstern’s mathematical framework [16,21]. Game theory assumes that in most multiagent systems, all the involved agents’ choices determine the overall results. To achieve that, agents will act strategically by anticipating what other agents will do and must assume that their actions will yield a result that favours them. Game theory led to development of notions such as Nash Equilibrium, Pareto optimal, and Social Optimality to analyse such systems [17,21,22,23]. Game theory has been widely applied in economics, social science, psychology, and medical decision-making [19,21,24]. Unfortunately, game theory has not been applied to assist decision-making in immersive environments, especially for supporting medical professionals with analytics.
This article bridges this gap by applying game theory as a decision support engine within an immersive visualisation based on VROOM [15] to enable effective support for decision-making by clinicians treating complex diseases like cancer. Visualisation of these data using VROOM provides an overview of the patient cohorts in an immersive environment, and visual analysis tools to aid the data exploration. In this study, we demonstrate how we can extend the functionality of VROOM further through a novel method employing game theory as the decision support engine. It is considered that this simulation will mimic a real-world situation where multiple medical professionals have differing opinions, and that game theory can help guide them while maximising their payoff. This will facilitate decision-making processes that guide which treatment options are preferred for a particular patient based on genomics and biomedical information.
The paper also contributes a hypothetical scenario where two doctors have different opinions on the essential gene combinations driving a patient tumour, the optimal dimensionality reduction algorithm, and how many genes should be included when considering the clinical needs of the patient. It is important to note that all cancer patients are unique and respond differently to treatments. What may have worked for one patient may not work for another. Our game theory model helps identify neighbouring patients who have had the highest survival rate. This information allows clinicians to examine which gene set was used, and if those genes are relevant, they can form a hypothesis and conduct further investigation. We demonstrate the effectiveness of our proposed method with the patient cohort data interrogation compared to one without a decision support system.
The rest of the paper is organised as follows. Section 2 reviews the related work for game theory in medical and genetic bioinformatics. Section 3 presents game theory and the concepts of Nash Equilibrium and Social Optimality. Section 4 describes how a case study applies game theory to immersive visualisation. Section 5 concludes the discussion and explores future work.
2. Related Works
Game theory has been applied in various fields, such as management, social science, economics, political science, and management science [24]. It started to gain popularity in medical decision-making, doctor–patient interactions, organ transplant management, resource planning, and training [19,21,24,25,26]. This paper will explore the use of game theory as a decision support system to guide medical analysts and doctors in analysing their patients’ genomic and biomedical data.
Zhu, Jiang, Ye, Sun, Gragnoli, and Wu [27] developed a framework based on evolutionary game theory that combines group phenotypic composition with ecological interactions. Their framework specifically maps quantitative trait loci (QTLs) for population demographics and evolution. Archetti [28] employed evolutionary game theory to study the collective interaction between cancer cells, analysing the dynamics of these cells’ growth factors and treatment effectiveness in reducing the cell population. Their findings revealed that anti-angiogenic drugs and RNG interference have only short-term effects, suggesting the preference for evolutionarily stable treatment strategies. Relatedly, Khadem, Kebriaei, and Veisi [29] utilised evolutionary game theory to investigate the proposed therapeutic methods’ effectiveness, involving changes in the interaction parameters between healthy and cancerous cells.
Game theory has shown successful application in medical resource management and training, yielding favourable outcomes. McFadden and Tsai [19] applied game theory in complex operating room system management, resulting in positive effects on the environment and benefiting all stakeholders. Blake and Carroll [21] proposed using game theory in medical training and practice to encourage better recognition of competing priorities and adjustment of approaches when one’s preferred outcome is unlikely. Mendonça and Catalão-Lopes [24] developed a game theory model for liver transplantation consultation in alcoholic liver disease patients, employing Nash Equilibrium to yield desired doctor behaviour and improved patient cooperation rate. These studies demonstrate the success stories of the integration of the game theoretical framework into decision-making processes. We incorporate the game theory model into our toolset as a driver for improving decision-making processes. Game theory application has been proven successful, as mentioned earlier; hence, we utilise its capability for improving the decision-making and analytical processes in immersive visualisation with complex scenarios and possibilities.
3. Proposed Method
3.1. Game Theory
Game theory offers mathematical techniques for analysing the dynamics of conflict and cooperation among rational, intelligent decision-making agents [30]. It studies the strategies of interaction among self-interested agents who strive to maximise their gains, specifically strategies of competition, cooperation, negotiation, and coordination [22,31,32]. These agents will strategically consider the actions of others and make choices based on those anticipations to maximise their payoff.
Central to game theory is the assumption that all involved agents act rationally and prioritise their self-interest. It provides analytical methods to model and analyse system behaviour, such as Nash Equilibrium, Social Optimality, and Pareto optimality [22,32].
For any non-cooperative game model, each game encompasses, at minimum, a trio of fundamental components. Firstly, there exists a set of agents, colloquially known as players, who participate in the game. Secondly, each agent is endowed with a set of feasible actions that each agent can take. Lastly, there is a set of utility functions assigned to the agents. These utility functions play a critical role in mapping an action profile to real-valued numbers, serving as a quantifiable representation of the individual agent’s payoff within the game.
Formally, a game is defined as a tuple, where
- is a finite set of agents.
- For each agent , is a set of possible actions (strategies). The set of all joint actions, called strategy profiles, is denoted by . Each vector is called an action profile.
- For each agent , : is a utility function that maps an action profile to a real number, indicating the player’s payoff for each possible joint action.
In game theory, a game can usually be represented in a normal form as an n-dimensional matrix [32,33]. We use such a matrix in our application of game theory.
Each agent is driven to maximise their payoff in a game without knowing other agents’ actions. However, due to shared resources and the interdependent nature of the game, an agent’s payoff is influenced by both their strategy and those employed by their opponents. In the context of a multiagent system, mixed strategies is defined as follows.
Let be a normal-form game, and for any given non-empty set X, let be a probability distribution over . Then a mixed strategy of player is an element of
Consequently, the set of mixed-strategies profiles is the Cartesian product of the individual mixed-strategy sets [32].
The expected utility for agent of a mixed-strategy profile can be calculated as
The Nash Equilibrium concept is widely recognised as one of the key principles in game theory. A Nash Equilibrium refers to an action profile where, if any agent were to deviate from their chosen action, they would not achieve a better payoff. As a result, no agents have the incentive or motivation to deviate from such a Nash Equilibrium.
Formally, Nash Equilibrium is defined as follows [32]: A strategy profile is a Nash Equilibrium if, for all agents , and for all strategy
where is a strategy profile that is the same as except player ’s strategy is replaced by .
A pure strategy is a special case of a mixed strategy where the agent only selects one action [32]. Pure strategy is what is used in this paper.
Another important concept in game theory is Social Optimality [34]. A strategy called Social Optimum if it has maximised the sum of all players’ payoffs, i.e., for all strategies
Games are usually represented in a normal form via an n-dimensional matrix (Leyton-Brown 2008). In the walkthrough of our application, such a matrix would be used.
3.2. Decision Support in Immersive Environment: VROOM
We apply game theory as the decision support system in our immersive visualisation VROOM [15]. The visualisation allows the analyst to interrogate patient cohorts in an immersive environment based on their genomic similarity and treatment data to hypothesise treatment options. Non-linear and linear dimensionality reduction methods, such as t-distributed Stochastic Neighbour Embedding (t-SNE) [35,36], Uniform Manifold Approximation and Projection (UMAP) [37,38,39], Non-negative Matrix Factorisation (NMF) [40], Principal Component Analysis (PCA) [41], and computation analytics algorithms such as autoencoder [42] were also used to transfer the complex genomics data to a 3D immersive space, where patients with similar genomic properties are located closely together [15]. Dimensionality reduction process transfers the data from a high-dimensional space into a low-dimensional space while they retain some meaningful properties of the original data. This process is crucial for genomics data analytics where the data can have tens of thousands of dimensions in a patient’s genetic information [43].
For medical domain users, the complex data analysis and exploration process could be overwhelming; hence, there is a need for a decision support system to assist the analyst. In our VROOM system, the analysts can look at four different data sets with two types of risk assessment. On top of that, six types of dimensionality reduction algorithms are used. These combinations can easily overwhelm the user when deciding where to start. Our objective is to apply game theory to provide a good starting point. In this section, we discuss the mathematical part of game theory application.
This paper investigates how two clinicians with different opinions can be modelled into the visualisation system as a decision support system. The model helps to drive which patients, when compared, should be selected in the similarity space to look for the gene combination that yields the list of neighbours with the highest survival rate. For non-technical users, e.g., clinicians, the visual analysis process could be overwhelming; hence, a decision support system to assist them is useful. For example, the clinicians can decide on a treatment method by using the game theory model to identify the best treatment success rate with the highest survival rate of the selected patient and the patient’s neighbours. Our model assumes that the decision-making process for our “two doctors” scenario is a strategic game. The two main game theory concepts used here are Nash Equilibrium and Social Optimality. The concept can be generalised to more than two clinicians. For discussion, we will use two clinicians in our case study.
3.3. Data Sets
For this study we limited ourselves to studying data derived from patient cohorts diagnosed with acute myeloid leukaemia (AML). The data used in this study were from publicly available cancer genomic data sets, including The Cancer Genome Atlas (TCGA) Research Network (https://www.cancer.gov/tcga assessed on 31 May 2021), HOVON (http://www.hovon.nl/ assessed on 31 May 2021), National Cancer Institute Office of Cancer Genomic—‘TARGET’ data set (https://ocg.cancer.gov/programs/target/data-matrix assessed on 31 May 2021), and Tyner et al. (2018) consolidated data set (https://www.cbioportal.org/study/summary?id=aml_ohsu_2018 assessed on 31 May 2021).
The data included bulk ribonucleic acid (RNA) sequencing data, patient metadata, and clinical history. The owners did not restrict the use of their data and had obtained ethics approval for their clinical trials. The data sets also contained the patients’ genomic profiles, which had undergone a feature selection process using the LSC17 gene score [44]. The LSC17 gene score was used to rapidly identify AML patients who had not responded well to the standard AML therapy due to initial therapy resistance. The gene score could be part of newer novel strategies. Table 1 shows two samples of data from the data set.

Table 1.
Patient gene data with their gene expression value. The data partially show the LSC17 gene list. The first column is the patient id, and the numerical value is the actual gene expression value of the listed gene. The table’s header is the name of the genes selected for the study.
In this work, we further reduced the LSC17 genes, inspired by Ng, Mitchell [44], Elsayed, Wu, Cao, Raimondi, Downing, Ribeiro, Gruber, Rubnitz, Pounds, and Lamba [45]’s work on clustering their patients’ data, to LSC3. According Ng and Mitchell [44], LSC17 score analysis can be used to predict AML patient medical conditions. LSC17 has a list of 17 genes identified to be significant in Ng and Mitchell’s [44] analysis and predictive model. The full list of the genes identified by LSC17 is DNMT3B, ZBTB46, NYNRIN, ARHGAP22, LAPTM4B, MMRN1, DPYSL3, KIAA0125, CDK6, CPXM1, SOCS2, SMIM24, EMP1, NGFRAP1, CD34, AKR1C3, and GPR56. The paediatric LSC3 (pLSC3) score model (LSC3), on the other hand, is derived from DNMT3B-CD34-GPR56 As a Prognostic Tool to Predict AML Patient Outcome [45]. The LSC3 lists a subset of the genes identified in LSC17.
The LSC17 score analysis can be used to predict the medical condition of AML patients [44]. Their study involved diverse AML subtypes (n = 908) from five independent cohorts. The LSC17 score allows the clinician to rapidly identify AML patients who do not respond to standard therapy due to initial therapy resistance and should be part of trials evaluating novel upfront or post-remission strategies. All the combinations of three genes from LSC17 were used for our case. Other well-known biomarkers, such as CD34, were also used in the experiments.
4. Results and Discussion
4.1. Game Theory Application
Game theory was applied in such a situation to calculate which strategies will yield the Nash Equilibrium and/or Social Optimum if Nash Equilibrium cannot be achieved. The utility value is the rate of the survival of the patient’s nearest neighbours (ten neighbours in our study) calculated for that particular dimensionality reduction algorithm and gene combinations selected by the two doctors and the number of dimensions to consider while making the dimensionality reduction, in the form of a payoff matrix as shown in Table 2.
Table 2.
The payoff matrix is used to analyse patient survivability using different gene combinations and dimensionality reduction algorithms with differing dimensions. The utility value is calculated using the resulting ten neighbours based on their survival results. The above is a snapshot and reduced version of the large table in the visualisation. This is run for every patient. The data shown here are the actual results for patient “aml_ohsu_2018_16-01272”. The Nash Equilibrium strategy profiles are highlighted with an underline.
Table 2 shows the subset of the set of actions that can be taken by Doctor A and Doctor B. For Doctor A, the set is {t-SNE, PCA, NMF, UMAP} while for Doctor B, the set is {LSC17, DNMT3B_ZBTB46_NYNRIN, CD34, DNMT3B_ZBTB46_LAPTM4B, DNMT3B_ZBTB46_MMRN1}. If Doctor A chooses action UMAP and Doctor B’s choice of action is CD34, then the payoff for Doctor A and Doctor B is 0.4 and 0.4, respectively, or (0.4, 0.4). The numbers shown in the table are the actual survival rates of the ten patients for the patient of interest. For example, 0.6 indicates that 60% of the neighbours of the patient of interest have recovered from AML.
To find the Nash Equilibrium, one must look for the best response function for each player and then find a profile a* of actions for which all the players have the best-response function [22]. In Table 2, the values with underscores are the best response for each doctor. Those cells in Table 2 with both payoffs underlined are the Nash Equilibrium strategy profiles.
The concept of Nash Equilibrium is based on the premise that agents are strictly competitive and strive to optimise their payouts [34]. It should be noted that this strategy does not always yield favourable outcomes for the group [34]. To address this concern, Social Optimality can be employed to maximise the total payoff for the entire group. By considering the broader welfare and overall benefits, Social Optimality provides a framework to enhance the collective outcome of the game.
Table 3 illustrates the Social Optimality application in our case. The only strategy profile that fulfils the Social Optimality condition is the strategy profile (t-SNE, DNMT3B_ZBTB46_LAPTM4B) as it has the highest payoff for the whole group at 1.1, highlighted in red. In this case, (t-SNE, DNMT3B_ZBTB46_LAPTM4B) is the best choice for the two doctors. The numerical value in Table 3 is the total payoff available to Doctor A and Doctor B if they choose that strategy profile.
Table 3.
The Social Optimality payoff matrix. In this case, the numerical values in the tables are the total payoff for Doctor A and Doctor B. The highlighted red cell has the highest value; hence, it is the Social Optimality selection.
4.2. Use Case Study
This section illustrates how game theory helped the analyst find possible linkages between patients’ genomic similarities, treatment profiles, and survivability. We discuss the feature of VROOM and how game theory can help to improve efficiency and provide more options in interrogating the data. VROOM’s full functionalities and objectives are published in the paper by Lau and Qu [15]. This paper only discusses the immersive visualisation features relevant to game theory applications. Comparisons are made between the two to showcase how game theory can help make discoveries.
The “OHSC Three Risk” data set and the dimensionality reduction algorithm are chosen for the discussion. The visualisation shows the entire TARGET data set patient cohort in an immersive 3D environment, as shown in Figure 1. The patients are roughly clustered in the three segments to indicate the patient risk level. The red, yellow, and cyan colours indicate high, medium, and low risk, respectively. Same-risk patients are located closely together thanks to the computational analytics, as shown in groups a, b, and c in the figures. In Figure 1, the selected patient is represented by the larger sphere with a blue halo around it. Notice that the white lines connecting the POI are its neighbours determined by the game theory engine.
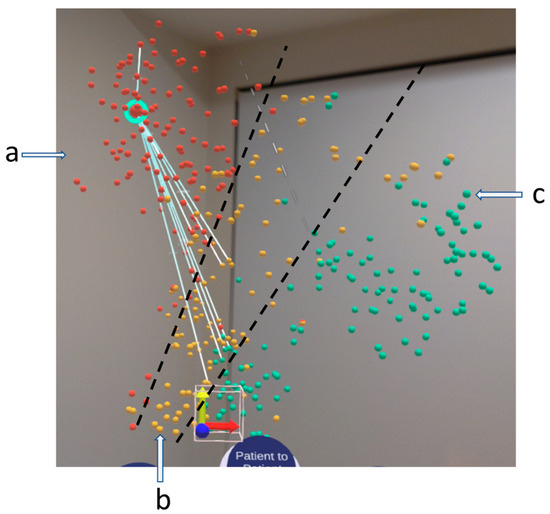
Figure 1.
VROOM, our immersive visualisation in an AR headset. It shows a 3D similarity space of patient cohorts. In this case, the OHSC three-risk data set is used. The red, yellow, and cyan indicate the patient risk factors, high, medium, and low risk, respectively, labelled by a, b, c. The white line connecting the selected patient, which has a blue hue, to the rest of its neighbours is determined by game theory using the method discussed in Section 3. The black line indicates the separation of the clusters.
Figure 2 shows the immersive visualisation running in a VR environment. Its functionality is similar to the one shown in Figure 1. The significant difference is that the neighbours in this figure are based on their Euclidean distances from the selected patient, POI. Before we discuss the difference it made, we shall share the relevant VROOM capabilities for the user to analyse the data.
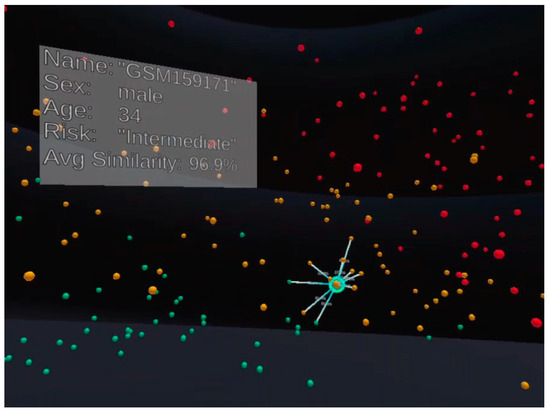
Figure 2.
VROOM has been implemented in both AR and VR; in this figure, the visualisation is run in VR. Everything is similar to Figure 1, except the neighbours for the selected patient here are determined by their distance from the patient using Euclidean distance in the 3D Cartesian coordinate space.
From overview visualisation as shown in Figure 1 or Figure 2, the analyst can select a patient of interest (hereafter referred to as POI) to conduct detailed studies. As shown in Figure 3a, the analyst selects the patient using the select command by gazing and air-clicking on the patient. The analysts can grab the sphere representing the patient and put it onto the virtual tablet shown in Figure 3b. The virtual tablet shows the metadata of the patient, such as age, gender, and ethnicity. It also provides statistical information such as boxplots and bar charts. The boxplot (Figure 3c) shows the patient gene value compared to the sample population of the currently displayed data, which is helpful to indicate if the POI gene value is an outlier or within the interquartile range (IQR). At the same time, the bar chart displays the value of each of the 17 genes. These tools provide an overview and detailed visual analytics capabilities to the analyst. As this feature only deals with the POI, there are no differences between the two systems.
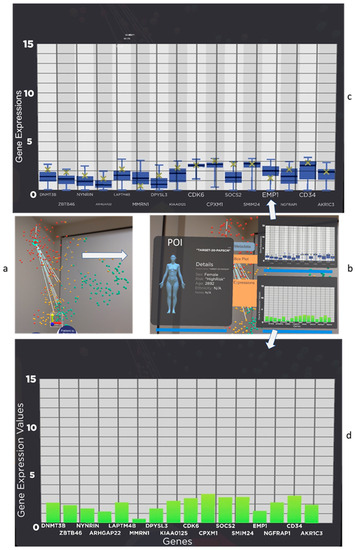
Figure 3.
Users can conduct detail analysis on the patient they are interested in investigating, hereafter referred to as POI. In this figure, patient “TARGET-20-PAPSCM” is selected from (a) and pulled into (b) the patient of interest panel. The panel shows the patient information, such as age, gender, and ethnicity. (c) The tablet has functionality such as a boxplot of the patient gene data vs. the whole population. The patient gene expression value is clearly marked as an “x” (yellow) in the boxplot an, (d) gene expression value in a bar chart.
The analyst can also conduct a patient-to-group comparison. The visual analytics tools implemented here are a boxplot, heatmap, and patient history table (see Figure 3). The boxplot is calculated based on the POI and the group of patients selected for the query, which differs from the earlier implementation. A heatmap is a very common tool in genomic data analysis, which is used to visualise gene expression data to unravel hidden patterns [1]. The patient history table contains the gender, age, risk, similarity, vital status, and current regimen. The original design for the system, as shown in Figure 2, is meant to show the nearest neighbour and allow the user to choose whom to compare to the POI. It allows flexibility for the analyst to decide who and what to compare, and it is helpful for an experienced analyst. However, due to the amount of data, the risk factors, and the dimensionality reduction algorithm used, we introduced the game theory-driven system to drive the analyst.
Our game theory model utility value, which is discussed in detail in Section 3, is the survival rate of the ten nearest neighbours for the POI; hence, in using that, the system provides the best combination for the analyst to look at the gene expression of those patients suggested for comparison and their medical history. If there is no suggestion, the analyst will decide which patients to use for comparison.
We do a walkthrough to show how our game-theory engine assisted the analytics process. First, the patient we are interested in is “aml_ohsu_2018_16-01254” in the OHSC data set (Figure 4). This patient is a female with low-risk factors and is alive (when the data are captured), and her current regimen is HiDaC.
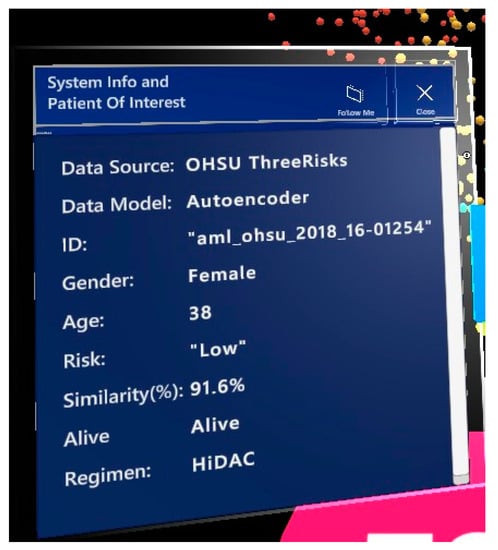
Figure 4.
Our patient of interest is shown in the AR environment.
The game theory system gave the following suggestion using the method discussed in Section 3, as shown in Figure 5. The first few Nash Equilibrium and Social Optimum results were displayed for the user. If the user makes no changes, the first item will be the default. In this case, Nash Equilibrium, and also the Social Optimum item, is DNMT3B, DPYSL3, and CD34 genes and the NMF dimensionality reduction algorithm.
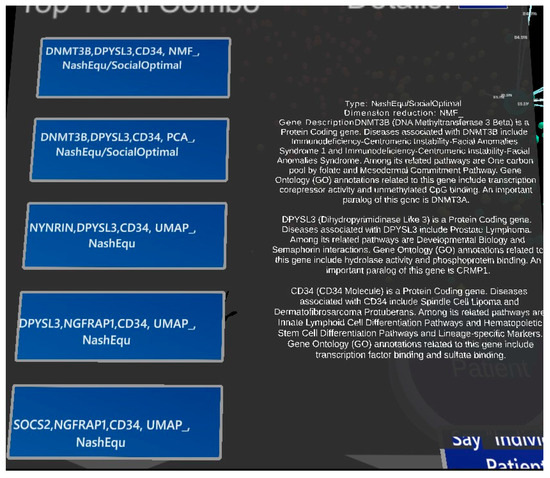
Figure 5.
The result of the game theory calculation applied to the data. Here DNMT38, DPYSL3, and CD34 genes were chosen with NMF. The details of the gene description are given on the right side of the panel.
As the utility of our game theory model was the survival rate of the patient’s ten neighbours, the combination suggested by our model should have the highest treatment success rate number. The analyst can look at the heatmap to discover any differences in gene expression value for their POI compared to the rest of the patients suggested by the system, as shown in Figure 6. Our POI is the first patient listed in the figure. A visual comparison would reveal that the heatmap for our POI is relatively similar to the rest of the group.
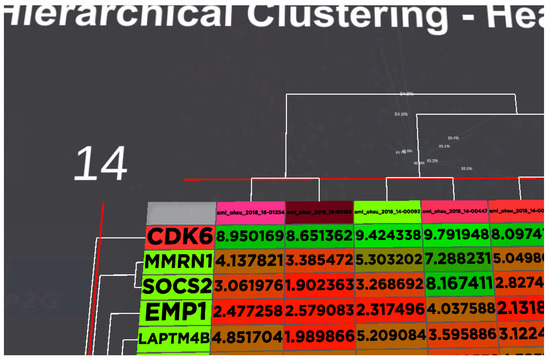
Figure 6.
Heatmap for the gene expression of all the patients suggested by our system and the POI. The analyst can visually detect the significant differences between the patients. Our POI is the 1st column for the list of patients. Colours are used to indicate the level of expression for the gene from red to green.
The last panel that our tool provides is the patient history table (Figure 7). This panel is especially useful if the data set contains the patient current regimen/treatment. As the patients have a similar genetic profile and have recovered from AML, that would give a good starting point for the clinician/analyst to form a hypothesis and investigate further if those regimens received by the patients used for comparison would benefit our POI. Based on the analytical scenario, we could maximise the decision regarding survival rates for the patient using visualisation and game theory.
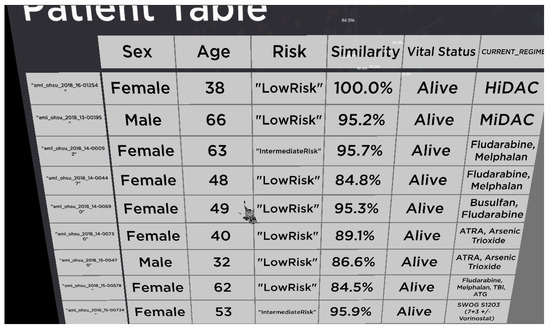
Figure 7.
Patient medical history table. This table contains sex, age, risk factors, how similar the patient is in term of LSC17 gene, their vital status, and current treatment.
5. Conclusions
Our immersive visualisation design enables interaction between oncologists, lab scientists, and clinicians to collaborate and review patient prognosis based on empirical data. However, without AI technologies, it could be overwhelming for analysts to initiate the analysis process. In this work, we show that using game theory helps the users to have a good starting point based on game theory applications. We compared how it helped to provide more options for the analysts to look at the data and derive new hypotheses for further discovery.
Future work will include detailed discussions with the users to derive more integrated and real-world decision-making situations for the visualisation. Future validation of the results from the game theory application and a more comprehensive evaluation and statistical analysis of the quantitative results will also be carried out in the future.
Author Contributions
Q.V.N., D.C., S.S., C.W.L. and D.Z. designed the game theory application in VROOM; C.W.L. and D.Z. contributed the automated analysis tools, analysis process, and methods. D.Z. contributed game theory domain knowledge; D.C. contributed domain knowledge for the analysis process. The first draft of the manuscript was written by C.W.L., and all authors commented on versions of the manuscript. All authors have read and agreed to the published version of the manuscript.
Funding
This research was funded by the SONY Foundation Grant and Tour de Cure. This was also partially supported by Oracle with the PhD scholarship.
Institutional Review Board Statement
Not applicable.
Informed Consent Statement
Not applicable.
Data Availability Statement
All the data used in this paper is in public domain as stated in the main text.
Conflicts of Interest
The authors declare no conflict of interest.
References
- Qu, Z.; Lau, C.W.; Nguyen, Q.V.; Zhou, Y.; Catchpoole, D.R. Visual Analytics of Genomic and Cancer Data: A Systematic Review. Cancer Inform. 2019, 18, 1176935119835546. [Google Scholar] [CrossRef] [PubMed]
- Nguyen, Q.V.; Khalifa, N.H.; Alzamora, P.; Gleeson, A.; Catchpoole, D.; Kennedy, P.J.; Simoff, S. Visual Analytics of Complex Genomics Data to Guide Effective Treatment Decisions. J. Imaging 2016, 2, 29. [Google Scholar] [CrossRef]
- Catchpoole, D.; Kennedy, P.; Skillicorn, D.; Simoff, S. The Curse of Dimensionality: A Blessing to Personalized Medicine. J. Clin. Oncol. 2010, 28, e723–e724. [Google Scholar] [CrossRef] [PubMed]
- ElShawi, R.; Sherif, Y.; Al-Mallah, M.; Sakr, S. Interpretability in healthcare: A comparative study of local machine learning interpretability techniques. Comput. Intell. 2021, 37, 1633–1650. [Google Scholar] [CrossRef]
- Vilone, G.; Longo, L. Explainable Artificial Intelligence: A Systematic Review. arXiv 2020, arXiv:2006.00093. [Google Scholar]
- Card, S.K.; Mackinlay, J.D.; Shneiderman, B. Readings in Information Visualization: Using Vision to Think; Morgan Kaufmann: Burlington, MA, USA, 1999. [Google Scholar]
- Chaoli, W.; Han-Wei, S. Information Theory in Scientific Visualization. Entropy 2011, 13, 254–273. [Google Scholar] [CrossRef]
- Fox, P.; Hendler, J. Changing the Equation on Scientific Data Visualization. Science 2011, 331, 705–708. [Google Scholar] [CrossRef]
- Moloney, J.; Spehar, B.; Globa, A.; Wang, R. The affordance of virtual reality to enable the sensory representation of multi-dimensional data for immersive analytics: From experience to insight. J. Big Data 2018, 5, 53. [Google Scholar] [CrossRef]
- Stuerzlinger, W.; Dwyer, T.; Drucker, S.; Görg, C.; North, C.; Scheuermann, G. Immersive Human-Centered Computational Analytics. In Immersive Analytics; Springer International Publishing: Cham, Switzerland, 2018; pp. 139–163. [Google Scholar] [CrossRef]
- Maes, A.; Martinez, X.; Druart, K.; Laurent, B.; Guégan, S.; Marchand, C.H.; Lemaire, S.D.; Baaden, M. MinOmics, an Integrative and Immersive Tool for Multi-Omics Analysis. J. Integr. Bioinform. 2018, 15, 20180006. [Google Scholar] [CrossRef]
- Yang, A.; Yao, Y.; Li, J.; Ho, J.W. starmap: Immersive visualisation of single cell data using smartphone-enabled virtual reality. bioRxiv 2018. [Google Scholar] [CrossRef]
- Zhang, J.F.; Paciorkowski, A.R.; Craig, P.A.; Cui, F. BioVR: A platform for virtual reality assisted biological data integration and visualization. BMC Bioinform. 2019, 20, 78. [Google Scholar] [CrossRef]
- Stein, D.F.; Chen, H.; Vinyard, M.E.; Qin, Q.; Combs, R.D.; Zhang, Q.; Pinello, L. singlecellVR: Interactive Visualization of Single-Cell Data in Virtual Reality. Front. Genet. 2021, 12, 764170. [Google Scholar] [CrossRef] [PubMed]
- Lau, C.W.; Qu, Z.; Draper, D.; Quan, R.; Braytee, A.; Bluff, A.; Zhang, D.; Johnston, A.; Kennedy, P.J.; Simoff, S.; et al. Virtual reality for the observation of oncology models (VROOM): Immersive analytics for oncology patient cohorts. Sci. Rep. 2022, 12, 11337. [Google Scholar] [CrossRef] [PubMed]
- Parsons, S.; Wooldridge, M. Game Theory and Decision Theory in Multi-Agent Systems. Auton. Agents Multi-Agent. Syst. 2002, 5, 243–254. [Google Scholar] [CrossRef]
- Gmytrasiewicz, P.; Parsons, S. Editorial: Decision theory and game theory in agent design. Decis. Support. Syst. 2005, 39, 151–152. [Google Scholar] [CrossRef]
- Raoof, O. Theory of Games: An Introduction; IntechOpen: London, UK, 2010. [Google Scholar]
- McFadden, D.; Tsai, M.; Kadry, B.; Souba, W.W. Game theory: Applications for surgeons and the operating room environment. Surgery 2012, 152, 915–922. [Google Scholar] [CrossRef]
- Yamamoto, M. Considering people’s hospitality toward others in urban and rural areas: An application of game theory. J. Glob. Tour. Res. 2017, 2, 39–44. [Google Scholar] [CrossRef]
- Blake, A.; Carroll, B.T. Game theory and strategy in medical training. Med. Educ. 2016, 50, 1094–1106. [Google Scholar] [CrossRef]
- Osborne, M.J.; Rubinstein, A. A Course in Game Theory; MIT Press: Cambridge, MA, USA, 1994. [Google Scholar]
- Mazalov, V.V. Mathematical Game Theory and Applications; Wiley: Chichester, UK, 2014. [Google Scholar]
- Mendonça, F.V.; Catalão-Lopes, M.; Marinho, R.T.; Figueira, J.R. Improving medical decision-making with a management science game theory approach to liver transplantation. Omega 2020, 94, 102050. [Google Scholar] [CrossRef]
- Cheng-Kuang, W. Using game theory for medical resources scheduling in emergency department. In Proceedings of the 2014 5th International Conference on Game Theory for Networks, Beijing, China, 25–27 November 2014; IEEE: Piscataway, NJ, USA, 2014. [Google Scholar]
- Glycopantis, D.; Stavropoulou, C. An agency relationship under general conditions of uncertainty: A game theory application to the doctor–patient interaction. Econ. Theory Bull. 2017, 6, 15–28. [Google Scholar] [CrossRef]
- Zhu, X.; Jiang, L.; Ye, M.; Sun, L.; Gragnoli, C.; Wu, R. Integrating Evolutionary Game Theory into Mechanistic Genotype–Phenotype Mapping. Trends Genet. 2016, 32, 256–268. [Google Scholar] [CrossRef] [PubMed]
- Archetti, M. Evolutionary game theory of growth factor production: Implications for tumour heterogeneity and resistance to therapies. Br. J. Cancer 2013, 109, 1056–1062. [Google Scholar] [CrossRef] [PubMed]
- Khadem, H.; Kebriaei, H.; Veisi, Z. Inactivation of tumor suppressor genes and cancer therapy: An evolutionary game theory approach. Math. Biosci. 2017, 288, 84–93. [Google Scholar] [CrossRef] [PubMed]
- Von Neumann, J.; Morgenstern, O. Theory of Games and Economic Behavior; Princeton University Press: Princeton, NJ, USA, 2007. [Google Scholar]
- Barron, E.N. Game Theory: An Introduction, 2nd ed.; Wiley Series in Operations Research and Management Science; John Wiley & Sons, Inc.: Hoboken, NJ, USA, 2013. [Google Scholar]
- Shoham, Y.; Leyton-Brown, K. Multiagent Systems Algorithmic, Game-Theoretic, and Logical Foundations; Cambridge University Press: Cambridge, UK, 2009. [Google Scholar]
- Leyton-Brown, K. Essentials of Game Theory: A Concise, Multidisciplinary Introduction; Shoham, Y., Ed.; Morgan & Claypool Publishers: San Rafael, CA, USA, 2008. [Google Scholar]
- Easley, D.; Kleinberg, J. Networks, Crowds, and Markets: Reasoning about a Highly Connected World; Cambridge University Press: New York, NY, USA, 2010. [Google Scholar]
- Maaten, L.v.d.; Hinton, G. Visualizing Data using t-SNE. J. Mach. Learn. Res. 2008, 9, 2579–2605. [Google Scholar]
- Amir, E.-a.D.; Davis, K.L.; Tadmor, M.D.; Simonds, E.F.; Levine, J.H.; Bendall, S.C.; Shenfeld, D.K.; Krishnaswamy, S.; Nolan, G.P.; Pe’er, D. viSNE enables visualization of high dimensional single-cell data and reveals phenotypic heterogeneity of leukemia. Nat. Biotechnol. 2013, 31, 545–552. [Google Scholar] [CrossRef] [PubMed]
- Becht, E.; McInnes, L.; Healy, J.; Dutertre, C.-A.; Kwok, I.W.H.; Ng, L.G.; Ginhoux, F.; Newell, E.W. Dimensionality reduction for visualizing single-cell data using UMAP. Nat. Biotechnol. 2018, 37, 38–44. [Google Scholar] [CrossRef]
- McInnes, L.; Healy, J.; Melville, J. UMAP: Uniform Manifold Approximation and Projection for Dimension Reduction. arXiv 2018, arXiv:1802.03426. [Google Scholar]
- Tegegne, Y.; Qu, Z.; Qian, Y.; Nguyen, Q.V. Parallel Nonlinear Dimensionality Reduction Using GPU Acceleration. Proceedings of Australasian Conference on Data Mining, Brisbane, QLD, Australia, 14–15 December 2021; Springer: Singapore, 2021; pp. 3–15. [Google Scholar]
- Dhillon, I.S.; Sra, S. Generalized nonnegative matrix approximations with Bregman divergences. In Proceedings of the 18th International Conference on Neural Information Processing Systems, Vancouver, BC, Canada, 5 December 2005; MIT Press: Cambridge, MA, USA, 2005; pp. 283–290. [Google Scholar]
- Jolliffe, I.T.; Cadima, J. Principal component analysis: A review and recent developments. Philos. Trans. A Math. Phys. Eng. Sci. 2016, 374, 20150202. [Google Scholar] [CrossRef]
- Kramer, M.A. Nonlinear principal component analysis using autoassociative neural networks. AIChE J. 1991, 37, 233–243. [Google Scholar] [CrossRef]
- Nguyen, Q.V.; Qu, Z.; Lau, C.W.; Tegegne, Y.; Tran, J.; Karetla, G.R.; Kennedy, P.J.; Simoff, S.; Catchpoole, D. Biomedical Data Analytics and Visualization—A Methodological Framework. In Data Driven Science for Clinically Actionable Knowledge in Diseases; Nguyen, Q.V., Kennedy, P.J., Simoff, S., Catchpoole, D., Eds.; CRC Press: Boca Raton, FL, USA, 2023; pp. 174–196. [Google Scholar]
- Ng, S.W.K.; Mitchell, A.; Kennedy, J.A.; Chen, W.C.; McLeod, J.; Ibrahimova, N.; Arruda, A.; Popescu, A.; Gupta, V.; Schimmer, A.D.; et al. A 17-gene stemness score for rapid determination of risk in acute leukaemia. Nature 2016, 540, 433–437. [Google Scholar] [CrossRef]
- Elsayed, A.H.; Wu, H.; Cao, X.; Raimondi, S.C.; Downing, J.R.; Ribeiro, R.; Gruber, T.A.; Rubnitz, J.; Pounds, S.; Lamba, J.K. Pediatric LSC3 (pLSC3) Score Derived from DNMT3B-CD34-GPR56 as a Prognostic Tool to Predict AML Patient Outcome: Results from Two Independent Pediatric AML Cohorts. Blood 2018, 132 (Suppl. 1), 290. [Google Scholar] [CrossRef]
Disclaimer/Publisher’s Note: The statements, opinions and data contained in all publications are solely those of the individual author(s) and contributor(s) and not of MDPI and/or the editor(s). MDPI and/or the editor(s) disclaim responsibility for any injury to people or property resulting from any ideas, methods, instructions or products referred to in the content. |
© 2023 by the authors. Licensee MDPI, Basel, Switzerland. This article is an open access article distributed under the terms and conditions of the Creative Commons Attribution (CC BY) license (https://creativecommons.org/licenses/by/4.0/).