Featured Application
The application of this work is developing an animal model of articular surface repair, which can be used by orthopedic surgeons for the development of new therapeutic strategies for the treatment of osteoarthritis.
Abstract
(1) Background: Currently, there are no pharmacological treatments that can modify the course of osteoarthritis (OA). For this reason, the present work is focused on generating knowledge for the development of new therapeutic alternatives for the treatment of OA. The objective of this work was to develop an articular hybrid implant with mesenchymal stem cells (MSCs) from sheep. The cells were differentiated into cartilage and bone using a bioabsorbable polymer with 3D printing Technology. (2) Methods: MSCs pre-differentiated to chondrocytes and osteoblasts were seeded on the 3D-printed scaffolds using polylactic acid (PLA). These were later implanted for 3 months in the thoracic ribs area and for 6 months inside the femoral head and outside of the joint capsule. After recovery, we analyzed the expressions of specific markers for bone and cartilage in the implants (3) Results: After 3 months, in lateral implants, the expression for bone markers (OPN, RUNX2) was similar to that of the control; at 6 months, we obtained a higher expression of bone markers in the implants with pre-differentiated MCS to osteoblasts outside and inside the joint. For cartilage markers, three months after the placement of the lateral implant, the expressions of Aggrecan and SOX9 COL2A1 were similar to those of the control, but the expression of COL2A1 was less; at 6 months, the three cartilage markers SOX9, Aggrecan, and COL2A1 showed significant expressions in the implant inside joint with pre-differentiated MCS to chondrocytes. (4) Conclusions: In this study, we demonstrated that the presence of pre-differentiated MSCs in the implants was a determinant factor for the expression of bone- and cartilage-specific markers at three and six months. We managed to generate a practical and easy-to-implement articular surface repair model.
1. Introduction
Articular cartilage permits frictionless joint motion [1]. This tissue has a maximum thickness of 4 mm [2] and its functional units are chondrocytes, which comprise approximately 2% of the total tissue. They are composed of 75–80% water, 15% collagen fibers, and 9–10% proteoglycans, which maintains the integrity of the articular cartilage matrix [3,4].
When the articular cartilage is damaged, a complex condition is generated and the whole joint is affected. The activation of matrix proteases plays a pivotal role in this process, leading to the development of osteoarthritis (OA) [5]. Osteoarthritis is the most common joint disease worldwide [5], affecting an estimated 9.6% of men and 18% of women over 60 years old [6].
Currently, there are no pharmacological treatments that can modify the course of OA; it can only be managed by reducing inflammation and pain, surgically correcting deviations from the mechanical axis and/or joint instability, filling in cartilaginous defects, or, in more severe cases, performing a prosthetic joint replacement [7,8]. At the present time, some authors have proposed the use of cadaveric cartilage from young donors as a source of cells for the repair of joint surface lesions [9,10,11]; other cellular sources that have been proposed involve the use of the synovial membrane [12] and Hoffa-fat-derived mesenchymal stem cells with a macroporous scaffold and biological macromolecules for the repair of meniscus cartilage [13], including for subchondral bone regeneration. The osteogenic potential of monosodium urate crystals on mesenchymal stem cells isolated from the synovium is being explored [14]. Undoubtedly, all these lines of research are promising and are still under development, however, until now, there has been no definitive solution to counteract the progression of OA.
Three-dimensional (3D) treatment techniques used for the development of new therapeutic strategies for repairing articular cartilage lesions [15] are currently very diverse, such as the use of bioink-based hydrogel [16], 3D-printed fish gelatin scaffolds [17], Wharton’s jelly bioinks [18], and scaffolds based on Functionalized Poly(glycerol sebacate) [19], among others, with very varied results. On the other hand, we support the use of biocompatible materials such as PLA [20,21] together with MSCs for the generation of cartilage and bone tissue, as they have been proven to be easy to implement and offer reliable results [22,23].
In this way, our multidisciplinary group seeks to obtain new therapeutic strategies for the repair of focal lesions of the joint cartilage using an accessible practical method that is low cost in comparison to the current investigations in development. Therefore, in this study, we aimed to use a sheep model to create an articular hybrid implant from autologous mesenchymal stem cells differentiated towards cartilage, bone, and bioabsorbable polymers using three-dimensional printing technology, in order to determine whether the hybrid implant was capable of maintaining the cell phenotype of cartilage/bone for up to 6 months after being implanted in different conditions in the sheep model.
2. Materials and Methods
We used three female Suffolk sheep that were 2 years old and weighed between 60 and 70 kg. The animals fulfilled the institution guidelines and the study was approved by the ethics committee. All the experiments were performed at research and animal handling facilities, in compliance with the “Guide for the Care and Use of Laboratory Animals” published by the National Institutes of Health (no.85–23, revised 1985).
2.1. Mesenchymal Stem Cell Mobilization
The animals received a daily subcutaneous injection of 300 mcg of granulocyte colony-stimulating factor (G-CSF, Filgrastim; Amgen, Mexico City, Mexico). Then, they were weighed on 3 consecutive days. On day four, a blood unit (BU, 450 mL) was harvested. After centrifugation, the BU was fractionated to obtain a buffy coat; using a gradient of concentration with Ficoll (Amersham, Biosciences AB Björkgatan, Sweden) [24], the mononuclear cell was obtained.
Isolation of Mesenchymal Stem Cells
For the isolation of the MSCs, we separated the non-MSCs population using specific antibodies: anti-CD45 FICT (AbD-Serotec, Hercules, CA, USA), anti-CD14 (Thermofishe, Waltham, MA, USA), anti-CD31 FITC (Thermofisher, Waltham, MA, USA), and anti-CD34 FITC (Thermofisher, Waltham, USA), coupled to an anti-FITC secondary antibody attached to a superparamagnetic bead (Miltenyi, Bergisch Gladbach, Germany). After the labeled cells were captured by the separation column (Miltenyi, Bergisch Gladbach, Germany), the MSCs were harvested and the immunophenotype was established via flow cytometry (Figure 1).
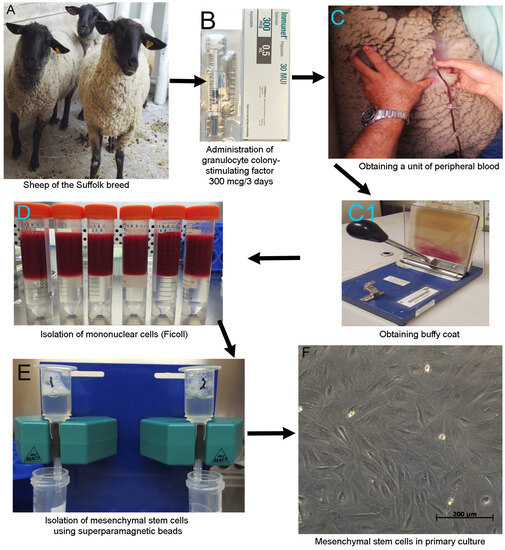
Figure 1.
Processing of the samples. (A) Animal model: three sheep of the Suffolk breed. (B) The animals received a daily G-CSF subcutaneous dose of 300 mcg for three days. (C) We obtained 450 mL of peripheral blood from the jugular vein using a bag for blood sample collection in animal-handling facilities. The sampling was performed by a veterinarian. (C1) Blood unit was separated from the leukocyte fraction “buffy coat”. (D) We used discontinuous density gradient centrifugation to isolate the mononuclear cells (Ficoll). (E) Isolation of mesenchymal stem cells using superparamagnetic beads via negative selection. (F) MSC in primary culture.
2.2. Scaffolding 3D Printing
We used the REGEMAT 3D Bioprinting system (Universidad de Granada, Spain) to manufacture the scaffolds, using a pellet of polylactic acid. Two scaffolding versions were printed: (A) For the lateral implant, these were a cartilage section with a pore of 850 μ, layer thickness of 350 μ, flow rate of 1, a solid perimeter, printing angle of 90°, and without a solid base, and a bone section with a pore of 950 μ, layer thickness of 350 μ, flow rate of 1, a perimeter, a 90° printing angle, with a solid base, 5 mm diameter, and a total length of 20 mm. (B) For the external and inside joint implants, we used the same specifications, but in this case, the diameter was 3.5 mm and the total length of 10 mm was changed (Figure 2). For the construction of the implant, we based this on the work previously reported by Estrada-Villaseñor et al. [25], and for this particular design, we seeded 2 × 10⁶ MSCs pre-differentiated to chondrocytes using the ChondroDiff Media (Miltenyi, Bergisch Gladbach, Germany) in the cartilage section, and 4 × 10⁶ MSCs pre-differentiated to osteoblasts using the OsteoDiff Media (Miltenyi, Bergisch Gladbach, Germany) for the bone section. The scaffolds plus the cells were maintained at 37 °C with 5% CO2 for 4 days prior to implantation.
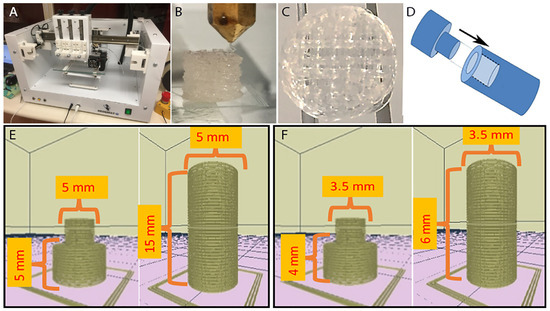
Figure 2.
Scaffolding 3D printing. (A) REGEMAT 3D Bioprinting system (University of Granada, Spain). (B) Side view of the printing process. (C) Scaffolding top view. (D) Outline of the implant assembly. (E) Model for lateral implant. (F) Model for external and inside joint implants.
2.3. Scaffold Implantation
All the surgical procedures were performed under general anesthesia. The lateral implant was placed 1 cm below the skin in the area of the thoracic ribs of the sheep (only the scaffold with cells was implanted). The external and internal joint implants were placed via arthrotomy (for each experimental condition, scaffolds with and without cells were implanted). Every joint was opened until the femoral head was exposed, and in the central part, a 10 mm hole was made with a 3.5 mm diameter drill, leading to the bone center, where the implant was placed. The joint capsule was closed, and the implants identified as the “external joint” were placed on it. The lateral implant remained in the sheep for 3 months, whereas the external and internal joint implants remained for 6 months (Figure 3).
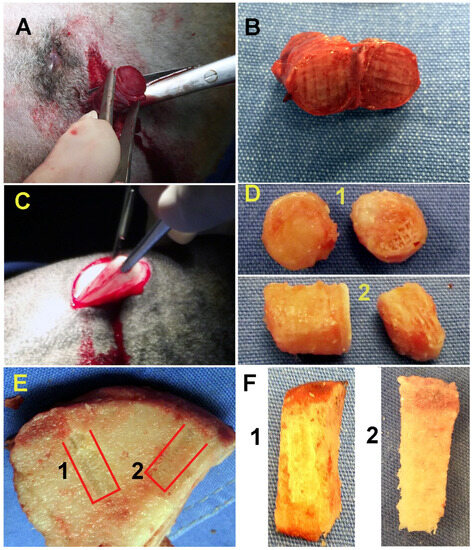
Figure 3.
Removal of implants. (A) Removal of the lateral implant after three months. (B) View of the lateral implant after removal from the thoracic ribs. (C) Removal of the lateral implant placed in the joint capsule for six months. (D) (1) In the image, you can see the two sections of the implant placed in the joint capsule; in this case, the scaffolds without cells. (2) To the left, we present the section of the implant seeded with pre-differentiated MSCs, and to the right, we present the section with the MSCs pre-differentiated to cartilage. (E) Lateral view of the implants within the joint after six months. (F) (1) View of the implant placed as a control without cells. (2) We can see the implant with differentiated MSCS to cartilage (upper) and bone (lower); it can be seen that the two sections of the implant are completely fused.
2.4. Characterization via Immunofluorescence
The implant was cut with a cryostat at −30 °C, providing 5 µm cuts that were placed in glass holders. For the lateral implant, we used cartilage markers: anti-Sox9 (Santa Cruz, CA, USA), anti-AGGRECANO (Thermofisher, Waltham, MA, USA), and anti-COL2A1 (Santa Cruz, CA, USA), and secondary antibodies: anti IgG-PE (Abcam, Cambridge, UK), anti IgG1-PE (Abcam, Cambridge, UK), and anti IgG-PerCP (Santa Cruz, CA, USA), and for the isotype control: IgG1-PE (Santa Cruz, CA, USA), IgG-PE (Santa-Cruz, CA, USA), and IgG-PerCP (Novusbio, Littleton, CO, USA). For the external and inside joint implants for cartilage: anti- AGGRECAN-FITC (Novusbio, Littleton, CO, USA), anti-Sox9 (Santa-Cruz, CA, USA), and anti-COL2A1 (Santa Cruz, CA, USA), the secondary antibody IgG (H+L)-Alexa Fluor 488 (Thermofisher, Waltham, MA, USA), and the isotype control IgG Alexa Fluor 488 (Santa Cruz, CA, USA). For the bone section, we used the primary antibodies: anti-Osteopontin (OPN, Santa-Cruz, CA, USA) and anti-RUNX2 (Santa-Cruz, California, USA), the secondary antibody anti-IgG-FITC (Santa-Cruz, CA, USA), and the isotype control: IgG-FITC (Santa-Cruz, CA, USA). The slides were mounted with DAPI (Vector, Newark, NJ, USA). The images were captured in a Carl Zeiss Axio system image. We used the Image J software, 13.0.6 version developed by Wayne Rasband from National Institutes of Health (NIH, Bethesda, MD, USA), to obtain the percentage of fluorescence.
2.5. Statistical Analysis
The data were processed according to the STATISTICA 10. A T-test for two independent samples, which was applied to establish if there were statistically significant differences between the positive controls and percentages of fluorescence obtained in the experimental conditions.
3. Results
3.1. Harvest of MSCs
After the isolation of the mononuclear cells from the buffy coat, we obtained 5 × 10⁹ ± 3.6 × 10⁶ cells, and as a result, due to the separation with superparamagnetic pearls, we obtained 47 × 106 ± 1.5 × 10⁶ cells that were used for the expansion in a primary culture of MSCs.
The immunophenotypes for the MSC markers in the cells after 3 weeks of cellular expansion in primary culture were: CD14: 0.60 ± 0.20%, CD34: 0.94 ± 0.32%, CD45: 0.26 ± 0.03%, CD73: 94.0 ± 5.46%; CD90: 95.0 ± 5.51%; and CD105: 96.0 ± 5.0%.
3.2. Analysis of Protein Expression
3.2.1. Bone Markers
When analyzing the lateral implants (scaffolding plus pre-differenced MSCs) at 3 months, we did not observe statistically significant differences between the expression of positive controls in comparison to the implants for OPN (p = 0.71) and RUNX2 (p = 0.91). Moreover, at 6 months, only for the marker OPN (p = 0.73) in the implants’ inside joint without pre-differentiated MSCs did we find no statistically significant differences in relation to the positive control. On the other hand, we found statistically significant differences in the marker RUNX2 (p = 0.03) for the implants inside the joint without pre-differentiated MSCs, with a lower expression than the positive control of 0.52%↓ (the down arrow↓, means an expression lower than that of the positive control). Additionally, in the external implants of the joints without pre-differentiated MSCs, we found statistically significant differences for OPN (p = 0.01), with a lower expression of 0.54%↓, and RUNX2 (p = 0.01), with a lower expression 0.56%↓. For the implants inside the joints with pre-differentiated MSCs, we identified statistically significant differences for OPN (p = 0.01) in both markers, with an over-expression of 0.52%↑ (the arrow up ↑, means an expression greater than that of the positive control); similar results were obtained for RUNX2 (p = 0.01), with an over-expression of 0.53%↑ (see Table 1, Figure 4).

Table 1.
Analysis of the expression of markers for bone in the implants at three and six months. First, we can observe that for the 3-month implantation with MSCs pre-differentiated into osteoblasts, the expression of bone markers (OPN and RUNX2) remained similar to those of the positive control obtained from healthy bone (Control +). On the other hand, for the external joint implants without cells at six months, we observed that expression of the markers for bone was decreased concerning the control (Implant vs. Control), which indicates little colonization of the cells adjacent to the implant. Contrastingly, external joint implants with pre-differentiated cells demonstrated an increase in markers for bone, implants inside joint without cells at six months behaved similarly to their non-joint counterparts’ and finally, implants inside joint with MSCs pre-differentiated demonstrated a significant increase for bone markers analyzed.
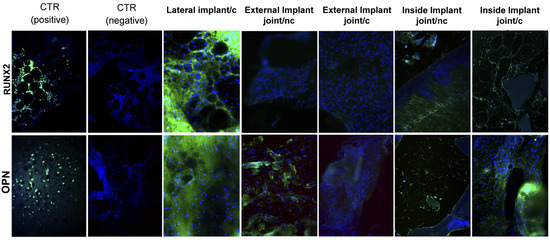
Figure 4.
Characterization via immunofluorescence of lateral, external, and internal implants after three and six months. The nuclei of each cell appear in blue stained with DAPI, and green markings indicate positivity for different bone markers that we used (OPN and RUNX2). The positive markers are labeled in green with FITC. c. Implant with pre-differentiated MSCs. nc. Implant without pre-differentiated MSCs.
3.2.2. Cartilage Markers
After 3 months, lateral implants were created with pre-differentiated MSCs to chondrocytes; we observed statistically significant differences for the following markers: Sox9 (p = 0.03), with an over-expression of 0.72%↑, and Aggrecan (p = 0.01), with an over-expression of 1.03%↑. For the marker COL2A1, we did not find any statistically significant differences (p = 0.15), and its expression was lower compared to that of the positive control by 0.23%↓ (Figure 5).
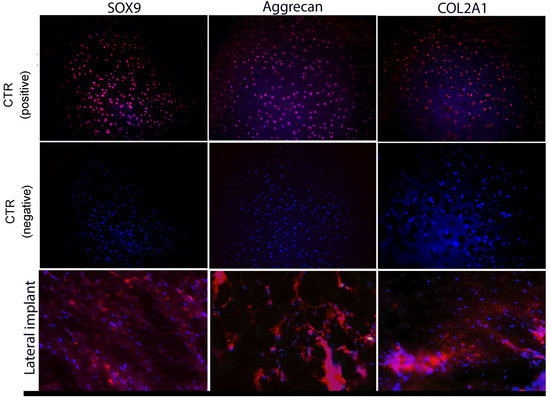
Figure 5.
Characterization via immunofluorescence of lateral implant after three months. The nuclei of each cell appear in blue (stained with 4′6-diamidino-2-phenylidole (DAPI); magenta markings indicate positivity for different cartilage markers (COL2A1, Aggrecan, and SOX9).
After 6 months, in the external joint implants with or without pre-differentiated MSCs to chondrocytes, we found statistically significant differences only for Aggrecan with or without pre-differentiated MSCs (p = 0.01), with an over-expression of 0.77%↑. Moreover, we did not find statistically significant differences for Sox9 either with (p = 0.15, over-expression of 0.29%↑) or without pre-differentiated MSCs (p = 0.06, over-expression of 0.23%↑), Aggrecan in the condition with pre-differentiated MSCs (p = 0.91, lower expression of 0.02%↓), or COL2A1 for the two conditions with (p = 0.83, lower expression of 0.03%↓) and without pre-differentiated MSCs (p = 0.07, lower expression of 0.22%↓).
In the implants inside the joint with pre-differentiated MSCs to chondrocytes, we found statistically significant differences between the implants and the positive control for the three markers: Sox9 (p = 0.01), with an over-expression of 0.80%↑, Aggrecan (p = 0.02), with an over-expression of 0.80%↑, and COL2A1(p = 0.01), with an over-expression of 0.47%↑. For the implants inside the joint with or without pre-differentiated MSCs to chondrocytes, we found statistically significant differences (p = 0.01) and an over-expression of 0.67%↑ for Aggrecan with or without pre-differentiated MSCs. On the other hand, we did not find statistically significant differences for Sox9 (p = 0.17, over-expression of 0.13%↑) or COL2A1 (p = 0.39, over-expression of 0.14%↑) (see Table 2, Figure 6).
Table 2.
Analysis of the expression of markers for cartilage in the implants at three and six months. We used as markers for cartilage: SOX9, Aggrecan, and COL2A1, to compare the expressions of each one of the markers against the positive control (Control +) obtained from healthy cartilage, and based on the results, we determined how many times more or less each marker was expressed concerning the control (Implant vs. Control). After three months, the implant with MSCs pre-differentiated to chondrocytes, SOX9, and Aggrecan behaved similarly to the control, and only COL2A1 was observed to be decreased. External joint implant without pre-differentiated MSCs at six months, as well as the lateral implant with pre-differentiated MSCs, showed that SOX9 and Aggrecan were similar to the control and only COL2A1 was decreased. According to this result, we can deduce that in both experimental conditions, we obtained a phenotype similar to fibro-cartilage. On the other hand, the external joint implant with pre-differentiated MSCs only behaved similarly to the control for SOX9 and was decreased for Aggrecan and COL2A1, indicating that the microenvironment was not capable of sustaining the chondrocyte population present in the implant. In the case of the implant inside joint without pre-differentiated MSCs, the three markers were increased concerning the control, indicating that the chondrocytes surrounding the implant can successfully colonize to it, and finally, the implant inside joint with pre-differentiated differentiated MSCs presented the three markers as significantly increased concerning the control; this makes us suppose that the cells that migrate from the periphery of the implant towards it are being added to the population of cells pre-differentiated to chondrocytes, thus increasing the expression of cartilage markers.
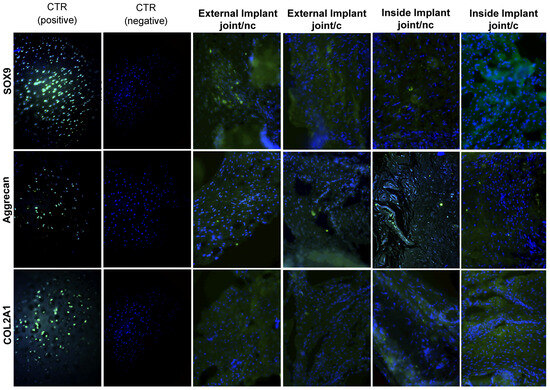
Figure 6.
Characterization via immunofluorescence of external and internal implants after six months. The nuclei of each cell appear in blue (DAPI), and green markings indicate positivity for different cartilage markers (COL2A1, Aggrecan, and SOX9). The positive markers are labeled in green with fluorescein isothiocyanate (FITC). c. Implant with pre-differentiated MSCs. nc. Implant without pre-differentiated MSCs.
4. Discussion
This study analyzed the distinctive proteins of articular cartilage and bone tissue on 3D-printed scaffolds at 3 and 6 months in an ovine experimental model.
According to the results, there was a prevailing expression of cartilage markers (SOX9, Aggrecan, and COL2A1) on the implant inside the joint with MSCs that were pre-differentiated to chondrocytes; there was a significant positive difference of 0.8% corresponding to SOX9, 0.8% to Aggrecan, and 0.45% to COL2A1, compared to the positive control of the native tissue.
Weimin et al. [26] and collaborators demonstrated that mesenchymal stem cells assist with chondrogenic differentiation when the cells are stimulated in vivo, which means that their regeneration can be stimulated by the following mechanisms: (1) MSCs can differentiate directly in native cells. (2) The cells can experience paracrine effects due to the secretion of hormones and growth factors, rescuing the damaged tissue. (3) The cells can transfer mitochondria through the tunnel’s nanotubes and secrete specific exosomes and microvesicles that influence the surrounding cells.
Our results matched those of the above-mentioned authors because the mechanism of potential regeneration on a scaffold charged with MSCs can directly differentiate if the microenvironment is appropriate. According to the considered points in Figure 3C, in which we can observe the external joint implant with MSCs that were pre-differentiated to chondrocytes, the analysis in Table 2 showed no significant difference between the implants for Sox9, Aggrecan, COL2A1, and the positive control (normal tissue), as mentioned in point 2: “the cells can have paracrine effects due to the secretion of hormones and growth factors, rescuing the damaged tissue.” This supports our results because, for 6 months, the implant remained external to the articulation, meaning that the surrounding microenvironment might have supplied nutrients to the implant, helping it to differentiate directly in similar tissue to the native cartilage. A similar effect occurred with the section of the implant with MSCs pre-differentiated to bone, 3 months after the lateral implant was placed in the sheep (see Table 1).
On the other hand, in the implant inside the joint with MSCs that were pre-differentiated to chondrocytes, we could see the same behavior, because the implant was inside an articulation, with the most suitable environment in comparison to the external implant. We observed a significant difference that benefited the intraarticular implant, supporting the third statement: “The cells can transfer and secrete specific exosomes and microvesicles that influence surrounding cells” and the first statement: The MSCs can differentiate directly in native cells if they are stimulated”. In this instance, the MSCs benefitted the injured tissue [26].
The report also described the in vivo stimulation of the charged zones of articular cartilages that are exposed to contact pressures between 0 and 20 megapascals (MPa) in frequencies that run between 0.1 and 10 Hz [27]. According to these authors, the cyclic charging period rarely lasts more than 1 h and alternates with periods of partial recovery and total recovery of at least 14 h per day. Concurrently, D’Lima et al. [28] mentioned that charges under 7 MPa do not show measurable cell death, and charges over 20 MPA result in prolonged structural tissue damage. Meanwhile, Suh et al. [29] established that low-pressure levels are those that comprise 5 and 15 MPa, while high-pressure levels are between 20 and 50 MPa.
We established that chondral cells support and remodel the tissue matrix of cartilage with processes that involve the expression of genes such as SOX9 and Cfba/RUNX2, whose main objective is matrix metalloproteinases (MMPs) and tissue metalloproteinases inhibitors (TIMPs) [30,31,32]. For this reason, the presence of the SOX9 gene is critical, allowing us to evaluate the articular cartilage response in relation to the charges. As mentioned, the expression of SOX9 helps with cartilage protection, maintaining the balance between chondrogenesis/osteogenesis [33].
Chondrocytes exhibit unique behavior: they secrete a matrix of plenty of collagen II and aggrecan proteoglycans, expressing a programmed genetic feature driven by SOX9; thus, the levels of SOX9 must be controlled so that normal chondrogenesis occurs [34]. SOX9 regulates the expressions of collagen II, IX, X, and aggrecan; based on this, we are able to determine that, when this gene regulates these proteins, they behave in a certain way. In the present study, we observed cartilage regeneration induced by SOX9 as a result of over-expressions of SOX9, 0.80%↑, Aggrecan, 0.80%↑, and the consequent over-expression of COL2A, 0.47%↑, in the implant inside joint with MSCs that were pre-differentiated to chondrocytes. This may have been caused by the articular charge zone [35], because SOX9 regulates the expression and formation of proteins, as well as the cartilage phenotype and growth [36].
For the control implants without pre-differentiated MSCs, we observed similar expressions of SOX9 and Aggrecan tissue control, but the expression of COL2A1 always remained lower than that of the tissue control. This may have been the result of the migration of cells from the surrounding tissue to the implants.
In relation to bone tissue, the obtained results provided null expressions of the specific markers in almost all the implants, except for the one used inside the joint with MSCs that were pre-differentiated to osteoblasts for 6 months, which presented positive significant differences of 0.52%↑ for OPN and 0.63%↑ for RUNX2.
5. Conclusions
We demonstrated that the presence of pre-differentiated MSCs in the implants was a determinant factor for the expression of bone-specific markers at 3 and 6 months. We also determined that the joint microenvironment was necessary for achieving an expression of COL2A1 on the cartilage implant similar to that of the control tissue and RUNX2 and OPN in relation to the bone implant. One factor that might have affected our results was the period of time for which the implants remained in the inserted site.
Author Contributions
Conceptualization, C.L.-S. and E.J.H.-L.; investigation, C.O.-S., C.L.-S. and A.B.L.-A.; writing—original draft preparation C.L.-S.; writing—review and editing C.I., A.S.-R. and M.d.R.A.-G.; supervision C.L.-S., A.B.L.-A. and A.S.-R.; funding acquisition C.L.-S. All authors have read and agreed to the published version of the manuscript.
Funding
This work was funded by the CONACyT, Mexico City, Mexico, funding number: PDCPN-2013-01-215138.
Institutional Review Board Statement
This work was approved by the ethics committee of the National Institute of Rehabilitation “Luis Guillermo Ibarra Ibarra” (INR LGII 23/14), in compliance with the “Guide for the Care and Use of Laboratory Animals” published by the National Institutes of Health (National Institutes of Health publication no.85-23, revised 1985)”. All the experiments were performed in the research and veterinary facilities at the INR LGII.
Informed Consent Statement
Not applicable.
Data Availability Statement
The data that support the findings of this study are available from the corresponding author upon reasonable request.
Acknowledgments
We would like to thank all the staff of the INR GLL animal veterinary facilities for all the help they have provided while we carried out this work.
Conflicts of Interest
The authors declare no conflict of interest.
References
- Makovicka, J.L.; Patel, K.A.; Hassebrock, J.D.; Hartigan, D.E.; Wong, M.; Chhabra, A. Arthroscopic Evaluation of Knee Cartilage Using Optical Reflection Spectroscopy. Arthrosc. Tech. 2019, 8, e399–e405. [Google Scholar] [CrossRef]
- Paunipagar, B.K.; Rasalkar, D. Imaging of articular cartilage. Indian J. Radiol. Imaging 2014, 24, 237–248. [Google Scholar] [CrossRef]
- Aigner, T.; Stove, J. Collagens—Major component of the physiological cartilage matrix, major target of cartilage degeneration, major tool in cartilage repair. Adv. Drug Deliv. Rev. 2003, 55, 1569–1593. [Google Scholar] [CrossRef]
- Keinan-Adamsky, K.; Shinar, H.; Navon, G. The effect of detachment of the articular cartilage from its calcified zone on the cartilage microstructure, assessed by 2H-spectroscopic double quantum filtered MRI. J. Orthop. Res. 2005, 23, 109–117. [Google Scholar] [CrossRef]
- Glyn-Jones, S.; Palmer, A.J.; Agricola, R.; Price, A.J.; Vincent, T.L.; Weinans, H.; Carr, A.J. Osteoarthritis. Lancet 2015, 386, 376–387. [Google Scholar] [CrossRef] [PubMed]
- Woolf, A.D.; Pfleger, B. Burden of major musculoskeletal conditions. Bull. World Health Organ. 2003, 81, 646–656. [Google Scholar]
- Mouzopoulos, G.; Kanakaris, N.K.; Mokawem, M.; Kontakis, G.; Giannoudis, P.V. The management of post-traumatic osteoarthritis. Minerva Med. 2011, 102, 41–58. [Google Scholar] [PubMed]
- Lotz, M.K.; Kraus, V.B. New developments in osteoarthritis. Posttraumatic osteoarthritis: Pathogenesis and pharmacological treatment options. Arthritis Res. Ther. 2010, 12, 211. [Google Scholar] [CrossRef] [PubMed]
- Olivos-Meza, A.; Brittberg, M.; Martínez-Nava, G.; Landa-Solis, C. Suitable characteristics in the selection of human allogeneic chondrocytes donors to increase the number of viable cells for cartilage repair. Cell Tissue Bank. 2023, 22, 1–11. [Google Scholar] [CrossRef]
- López-Chicón, P.; Riba-Tietz, T.; Fariñas, O.; Gelber, P.E.; Casaroli-Marano, R.P.; Vilarrodona, A. A Comparative Study Using Fluorescent Confocal Microscopy and Flow Cytometry to Evaluate Chondrocyte Viability in Human Osteochondral Allografts. Bioengineering 2022, 9, 515. [Google Scholar] [CrossRef]
- Copp, M.E.; Chubinskaya, S.; Bracey, D.N.; Shine, J.; Sessions, G.; Loeser, R.F.; Diekman, B.O. Comet assay for quantification of the increased DNA damage burden in primary human chondrocytes with aging and osteoarthritis. Aging Cell 2022, 21, e13698. [Google Scholar] [CrossRef]
- Zamudio-Cuevas, Y.; Plata-Rodríguez, R.; Fernández-Torres, J.; Flores, K.M.; Cárdenas-Soria, V.H.; Olivos-Meza, A.; Hernández-Rangel, A.; Landa-Solís, C. Synovial membrane mesenchymal stem cells for cartilaginous tissues repair. Mol. Biol. Rep. 2022, 49, 2503–2517. [Google Scholar] [CrossRef]
- Abpeikar, Z.; Javdani, M.; Mirzaei, S.A.; Alizadeh, A.; Moradi, L.; Soleimannejad, M.; Bonakdar, S.; Asadpour, S. Macroporous scaffold surface modified with biological macromolecules and piroxicam-loaded gelatin nanofibers toward meniscus cartilage repair. Int. J. Biol. Macromol. 2021, 183, 1327–1345. [Google Scholar] [CrossRef] [PubMed]
- Martínez-Flores, K.; Plata-Rodríguez, R.; Olivos-Meza, A.; López-Macay, A.; Fernández-Torres, J.; Landa-Solís, C.; Zamudio-Cuevas, Y. Osteogenic Potential of Monosodium Urate Crystals in Synovial Mesenchymal Stem Cells. Medicina 2022, 58, 1724. [Google Scholar] [CrossRef]
- Rosenzweig, D.H.; Carelli, E.; Steffen, T.; Jarzem, P.; Haglund, L. 3D-Printed ABS and PLA Scaffolds for Cartilage and Nucleus Pulposus Tissue Regeneration. Int. J. Mol. Sci. 2015, 16, 15118–15135. [Google Scholar] [CrossRef]
- Yin, P.; Su, W.; Li, T.; Wang, L.; Pan, J.; Wu, X.; Shao, Y.; Chen, H.; Lin, L.; Yang, Y.; et al. A modular hydrogel bioink containing microsphere-embedded chondrocytes for 3D-printed multiscale composite scaffolds for cartilage repair. iScience 2023, 26, 107349. [Google Scholar] [CrossRef]
- Maihemuti, A.; Zhang, H.; Lin, X.; Wang, Y.; Xu, Z.; Zhang, D.; Jiang, Q. 3D-printed fish gelatin scaffolds for cartilage tissue engineering. Bioact. Mater. 2023, 26, 77–87. [Google Scholar] [CrossRef]
- Hu, G.; Liang, Z.; Fan, Z.; Yu, M.; Pan, Q.; Nan, Y.; Zhang, W.; Wang, L.; Wang, X.; Hua, Y.; et al. Construction of 3D-Bioprinted cartilage-mimicking substitute based on photo-crosslinkable Wharton’s jelly bioinks for full-thickness articular cartilage defect repair. Mater. Today Biol. 2023, 21, 100695. [Google Scholar] [CrossRef]
- Wang, S.; Luo, B.; Bai, B.; Wang, Q.; Chen, H.; Tan, X.; Tang, Z.; Shen, S.; Zhou, H.; You, Z.; et al. 3D Printed Chondrogenic Functionalized PGS Bioactive Scaffold for Cartilage Regeneration. Adv. Healthc. Mater. 2023, e2301006. [Google Scholar] [CrossRef]
- Fairag, R.; Rosenzweig, D.H.; Ramirez-Garcialuna, J.L.; Weber, M.H.; Haglund, L. Three-Dimensional Printed Polylactic Acid Scaffolds Promote Bone-like Matrix Deposition in Vitro. ACS Appl. Mater. Interfaces 2019, 11, 15306–15315. [Google Scholar] [CrossRef]
- Xu, W.; Pranovich, A.; Uppstu, P.; Wang, X.; Kronlund, D.; Hemming, J.; Oblom, H.; Moritz, N.; Preis, M.; Sandler, N.; et al. Novel biorenewable composite of wood polysaccharide and polylactic acid for three dimensional printing. Carbohydr. Polym. 2018, 187, 51–58. [Google Scholar] [CrossRef]
- Chung, R.; Kalyon, D.M.; Yu, X.; Valdevit, A. Segmental bone replacement via patient-specific, three-dimensional printed bioresorbable graft substitutes and their use as templates for the culture of mesenchymal stem cells under mechanical stimulation at various frequencies. Biotechnol. Bioeng. 2018, 115, 2365–2376. [Google Scholar] [CrossRef]
- Wang, M.; Favi, P.; Cheng, X.; Golshan, N.H.; Ziemer, K.S.; Keidar, M.; Webster, T.J. Cold atmospheric plasma (CAP) surface nanomodified 3D printed polylactic acid (PLA) scaffolds for bone regeneration. Acta Biomater. 2016, 46, 256–265. [Google Scholar] [CrossRef] [PubMed]
- Pada, S.; Perl, T.M. Operating room myths: What is the evidence for common practices. Curr. Opin. Infect. Dis. 2015, 28, 369–374. [Google Scholar] [CrossRef] [PubMed]
- Estrada-Villaseñor, E.; Valdés-Flores, M.; Meneses-García, A.; Silva-Bermudez, P.; Pichardo-Bahena, R.; Ostoa-Saloma, P.; Mercado-Celis, G.; Delgado-Cedillo, E.D.; Olivos-Meza, A.; Landa-Solís, C. A novel model to culture cells from giant cell tumor of bone using three-dimensional (3D) polycaprolactone scaffold. Eng. Life Sci. 2021, 21, 539–543. [Google Scholar] [CrossRef]
- Weimin, P.; Zheng, C.; Shuaijun, J.; Dan, L.; Jianchang, Y.; Yue, H. Synergistic enhancement of bone regeneration by LMP-1 and HIF-1alpha delivered by adipose derived stem cells. Biotechnol. Lett. 2016, 38, 377–384. [Google Scholar] [CrossRef]
- Wong, M.; Carter, D.R. Articular cartilage functional histomorphology and mechanobiology: A research perspective. Bone 2003, 33, 1–13. [Google Scholar] [CrossRef]
- D’Lima, D.D.; Hashimoto, S.; Chen, P.C.; Colwell, C.W., Jr.; Lotz, M.K. Human chondrocyte apoptosis in response to mechanical injury. Osteoarthritis Cartil. 2001, 9, 712–719. [Google Scholar] [CrossRef] [PubMed]
- Suh, J.K.; Li, Z.; Woo, S.L. Dynamic behavior of a biphasic cartilage model under cyclic compressive loading. J. Biomech. 1995, 28, 357–364. [Google Scholar] [CrossRef] [PubMed]
- Prasadam, I.; van Gennip, S.; Friis, T.; Shi, W.; Crawford, R.; Xiao, Y. ERK-1/2 and p38 in the regulation of hypertrophic changes of normal articular cartilage chondrocytes induced by osteoarthritic subchondral osteoblasts. Arthritis Rheum. 2010, 62, 1349–1360. [Google Scholar] [CrossRef] [PubMed]
- Hung, C.T.; Henshaw, D.R.; Wang, C.C.; Mauck, R.L.; Raia, F.; Palmer, G.; Chao, P.H.; Mow, V.C.; Ratcliffe, A.; Valhmu, W.B. Mitogen-activated protein kinase signaling in bovine articular chondrocytes in response to fluid flow does not require calcium mobilization. J. Biomech. 2000, 33, 73–80. [Google Scholar] [CrossRef]
- Jin, G.; Sah, R.L.; Li, Y.S.; Lotz, M.; Shyy, J.Y.; Chien, S. Biomechanical regulation of matrix metalloproteinase-9 in cultured chondrocytes. J. Orthop. Res. 2000, 18, 899–908. [Google Scholar] [CrossRef]
- Umezawa, A.; Akutsu, H. Osteogenesis and chondrogenesis from a stem cell source. Clin. Calcium 2008, 18, 1721–1727. [Google Scholar] [PubMed]
- Kawakami, Y.; Rodriguez-Leon, J.; Izpisua Belmonte, J.C. The role of TGFbetas and Sox9 during limb chondrogenesis. Curr. Opin. Cell Biol. 2006, 18, 723–729. [Google Scholar] [CrossRef]
- Fahy, N.; Alini, M.; Stoddart, M.J. Mechanical stimulation of mesenchymal stem cells: Implications for cartilage tissue engineering. J. Orthop. Res. 2018, 36, 52–63. [Google Scholar] [CrossRef]
- Martinez-Sanchez, A.; Dudek, K.A.; Murphy, C.L. Regulation of human chondrocyte function through direct inhibition of cartilage master regulator SOX9 by microRNA-145 (miRNA-145). J. Biol. Chem. 2012, 287, 916–924. [Google Scholar] [CrossRef] [PubMed]
Disclaimer/Publisher’s Note: The statements, opinions and data contained in all publications are solely those of the individual author(s) and contributor(s) and not of MDPI and/or the editor(s). MDPI and/or the editor(s) disclaim responsibility for any injury to people or property resulting from any ideas, methods, instructions or products referred to in the content. |
© 2023 by the authors. Licensee MDPI, Basel, Switzerland. This article is an open access article distributed under the terms and conditions of the Creative Commons Attribution (CC BY) license (https://creativecommons.org/licenses/by/4.0/).