Abstract
The alarm data contain abundant fault information related to almost all components of the wind turbine. Reasonable analysis and utilization of alarm data can assist wind farm maintenance personnel in quickly identifying the types of turbine faults, reducing operation and maintenance costs. This paper proposes a clustering analysis method that groups similar alarm sequences with the same fault type. Firstly, the alarm data are preprocessed, where alarm sequences are segmented, and redundant alarms are removed. Then, a domain knowledge-fused Word2vec (DK-Wrod2vec) method is introduced to transform non-numeric alarm codes into numeric vector representations. Finally, new distance metrics are incorporated into the K-means clustering algorithm to improve clustering performance. The performance of the proposed clustering method is assessed by applying it to labeled alarm sequences. The results demonstrate that the clustering performance is the best when using DK-Word2vec and the word rotator’s distance compared with other methods. Additionally, with the optimal parameter combination, the fault types of unlabeled alarm sequences are also analyzed.
1. Introduction
1.1. Background
Recent years have witnessed a rapid expansion in wind turbine numbers and capacities, notably impacting the global energy landscape. In 2022, global wind power integration reached 77.6 GW, culminating in a total installed capacity of 906 GW [1]. Given the advancement of the wind power industry and the extended lifespan of turbines, the operation and maintenance of wind turbines have received significant attention. According to statistics, operational and maintenance costs are projected at 10–15% for onshore wind farm projects, while offshore wind farms might incur higher costs, ranging from 14% to 30% of total project expenses [2]. Hence, investigating condition monitoring and fault diagnosis technologies becomes essential for advancing preventive maintenance strategies and subsequently lowering operational and maintenance costs.
Fault diagnosis methods for wind turbines can be categorized into analyzing sensor signals, model-based methods, and data-driven methods. Analyzing sensor signals primarily includes vibration signal analysis [3] and acoustic emission signal analysis [4]. Nevertheless, these methods necessitate the installation of additional sensors to capture vibration and other data, thereby increasing the cost of fault diagnosis. Model-based methods entail the creation of precise physical models of wind turbine subcomponents, relying on advanced expertise [5]. However, the complexity and diverse interactions among subcomponents present difficulties in achieving universal applicability for these methods. Conversely, data-driven fault diagnosis methods have garnered increasing attention due to their independence from strict mathematics. Furthermore, as information technology advances, modern wind turbines commonly incorporate Supervisory Control and Data Acquisition (SCADA) systems. These systems collect and store vital operational signals from nearly all wind turbine subcomponents. The cost-effective acquisition and real-time monitoring potential offered by SCADA data have generated substantial research interest in data-driven methods for wind turbine fault diagnosis. Employing SCADA data has demonstrated promising results for wind turbine fault diagnosis [6,7,8].
Compared to SCADA data, employing alarm data to diagnose wind turbine faults is relatively overlooked. Alarm data are generated by the alarm system of a wind turbine, which is based on SCADA data. The alarm system monitors real-time values of SCADA parameters and triggers relevant alarms when one or more parameters exceed predefined thresholds [9]. These triggered alarms are stored chronologically as code and text. Alarm data generation intends to promptly alert wind farm operators about abnormal conditions in wind turbines and guide them in maintenance tasks [10]. However, diagnosing wind turbine faults through alarms remains a challenge for on-site operators. As a result, alarm data are often disregarded by operators in wind farms.
In recent years, with the increasing demand for online condition monitoring in large-scale wind turbines, there has been a rise in alarm configurations. Researchers have started to pay more attention to alarm data. The research directions encompass quantifying the reliability of wind turbines using alarm data [11,12], labeling SCADA data with alarm data to enhance the wind turbine fault diagnosis models’ accuracy [13], and uncovering the propagation mechanisms of wind turbine faults using alarm data [14]. Among these, the most prominent area of interest lies in wind turbine fault diagnosis using alarm data.
1.2. Fault Diagnosis Using Alarm Data
Refs. [15,16] respectively employed an artificial neural network and Apriori algorithms for mining alarm patterns. The research represents initial attempts, although the results are not very satisfactory. In [17], the Dempster–Shafer evidence theory was employed for analyzing wind turbine’ alarms, aiming to achieve better performance in fault diagnosis. It relies on high-quality maintenance records. However, ensuring high-quality maintenance records in wind farms is challenging due to manual entry, which introduces significant uncertainties.
The application of similarity analysis to compare alarm sequences has achieved relatively successful results, primarily due to the method’s ease of understanding, implementation, and independence from data labels. The underlying concept of this method is that alarm sequences triggered by the same fault event in wind turbines exhibit a higher degree of similarity under different operational conditions. In [18], a method was proposed to extract feature vectors from alarm sequences, which were subjected to agglomerative clustering and density-based spatial clustering to group similar alarm sequences. The authors of ref. [19] presented a wind turbine fault diagnosis method that employed the weighted Hamming distance to calculate the similarity of alarm lists. In [20], a Siamese convolutional neural network was designed to extract discriminative features of alarm sequences, and fault diagnosis was conducted based on the similarity scores derived from these features.
When a fault occurs, multiple alarms are triggered within a short time. These alarms triggered by a fault event are usually referred to as an alarm sequence. When comparing these alarm sequences using similarity analysis methods for diagnosing wind turbine faults, the first issue to address is how to represent these individual alarms numerically. A common approach is to use binary vectors, as described in Ref. [18,19]. However, this method only considers whether alarms occur or not. In natural language processing, Word2vec serves as a word embedding method to transform plain text words into real-valued vector representations, considering sequential and frequency relationships among words in sentences. Due to its numerical transformation and similarity relationship mining capabilities, Word2vec has been applied for the analysis of alarms. In [21], Word2vec was used for learning vector representations of alarms, followed by a long short-term memory used to predict potential alarms. Word2vec was used to map alarms to corresponding vectors of real numbers, enabling representation of the degree of correlation between alarms in [22].
Based on the vector representations of individual alarms, the second issue to address lies in evaluating the distance between alarm sequences. Unsupervised clustering, as a mature data mining tool, has been widely applied in the research of comparing alarm sequences’ similarity [18,22]. It groups similar alarm patterns in alarm sequences into one cluster. The type of similarity used, also known as distance measure, is a crucial factor in clustering algorithms. When using binary vector representation for alarms, the distance of alarm sequences can be computed using either Euclidean distance or Hamming distance. When employing multi-dimensional vector representation for alarms using Word2vec, the alarm sequence consists of multiple vectors forming a vector sequence. A commonly used approach involves computing the average of all alarm vectors in a sequence, followed by calculating the Euclidean distance between these average values.
For the first issue, the application of Word2vec in handling alarm data involves the process of simulating the semantic information presented in the context of the learning documents. While this approach effectively enhances the capability of mining similarity relationships among individual alarms, it fails to fuse the actual abnormal information represented by the alarm data during modeling. Therefore, the established vector representations may deviate from the actual fault patterns in terms of capturing the relationships between the alarms. For the second issue, the process of averaging all alarm vectors in a sequence compresses much of the informative content in the word embedding space and fails to fully exploit its potential.
In order to address the aforementioned issues, this paper presents an unsupervised clustering method for alarm sequences, aiming to group similar alarm sequences triggered by the same fault event. The clusters obtained through clustering can facilitate the identification of fault types triggering unknown alarm sequences, thereby achieving fault diagnosis for wind turbines. It becomes possible to assist on-site operational personnel at wind farms in promptly locating wind turbine malfunctions, thereby reducing maintenance time and downtime losses. The proposed method consists of three main steps: preprocessing alarm data, obtaining vector representations of alarms, and finally, clustering alarm sequences. To address the first issue, we propose an improved Word2vec approach that fuses alarm category information obtained from domain knowledge. As for the second issue, we apply two novel distance metrics in clustering to enhance clustering performance. These two distance metrics have shown successful applications in sentence semantic similarity analysis, but they remain unexplored in alarm sequence comparison. This paper makes the following main contributions:
- Proposing an improved Word2vec approach that fuses domain knowledge in the form of alarm category information, resulting in a more realistic vector representation of alarms aligned with actual fault patterns.
- Employing word mover’s distance (WMD) and word rotator’s distance (WRD) separately for measuring the distance of alarm sequences, thereby improving clustering performance.
- Conducting statistical analysis of alarms of a wind farm to gain insights into alarm data.
The subsequent sections of this paper are structured as follows: In Section 2, an introduction to alarm data is provided, along with a statistical analysis of the data. Section 3 elaborates on the fundamental principles of Word2vec and K-means clustering. Section 4 introduces the proposed method. The results and discussions are encompassed in Section 5, followed by the conclusions section.
2. Alarm Data Description and Statistical Analysis
2.1. Alarm Data Description
The alarm system of a wind turbine may vary depending on the manufacturer but generally possesses similar fundamental functionalities. It monitors the values of SCADA parameters, and when the monitored parameters exceed the predefined thresholds, relevant alarms are triggered. Similar to SCADA data, alarm data includes the status information of almost all key subcomponents of the wind turbine. The difference lies in the following aspects: SCADA data are recorded at regular intervals (typically every 10 min) as numerical data, covering both the healthy and faulty states of the wind turbine. In contrast, alarm data do not follow a fixed periodicity and consist of non-numerical records triggered and saved during abnormal conditions in the wind turbine. Hence, alarm data contain abundant fault information about wind turbines. By analyzing alarm data, it can be used for wind turbine fault diagnosis.
Diagnosing wind turbine faults through alarms remains a challenge for on-site operators, which is primarily caused by the following three factors. First, alarms commonly include descriptive details concerning the wind turbine’s anomalous condition. However, they may not directly specify the fault event’s type. Second, alarm systems commonly exhibit redundant and unreasonable alarm configurations, resulting in false alarms, repeated alarms, and nuisance alarms [23]. In addition, when a fault occurs, a substantial quantity of alarms is activated within a short period. This surge of alarms can overwhelm the operator.
The alarm data used in this paper are sourced from a wind farm situated in southern China. There are 24 wind turbines equipped with direct-drive, variable-speed, and variable-pitch generators. The provided alarm data cover the period from May 2016 to October 2017. Examples of several alarm records are shown in Table 1. The alarm records are organized chronologically, providing turbine number, triggering time, alarm type, alarm code, alarm flag, and description. Within this context, the alarm code assumes the role of a distinct identifier for each alarm occurrence. The alarm flag, on the other hand, designates the start or end of an alarm, thereby leading to the creation of two records for each alarm. Three categories of alarms exist: information alarms, warning alarms, and fault alarms. Information alarms primarily communicate changes in specific operational conditions. Warning alarms are initiated upon the approach of monitored variables to predefined thresholds, while fault alarms are activated upon the surpassing of these thresholds.

Table 1.
Examples of several alarm records.
When analyzing alarm data, our initial focus is on the numerical representations of individual alarms, such as A155 and T110 in Table 1. Subsequently, our focus shifts to alarm sequences. Due to the extensive interconnections among the mechanical structure, electrical connections, and complex control systems of wind turbines [24], the occurrence of a fault can trigger multiple alarms, forming an alarm sequence. For instance, [I2, A155, A155, T110] in Table 1 represents an alarm sequence. The alarms triggered by the same fault may vary under different operating conditions of the wind turbine [12]. However, these alarms exhibit a high level of similarity. Therefore, diagnosing wind turbine faults can be achieved by clustering alarm sequences triggered by the same type of fault.
The alarm data of wind turbines are a manifestation of fault occurrences. Therefore, the labeling of an alarm sequence can be established based on the corresponding fault type. Maintenance records can provide the types of historical faults. However, owing to the self-diagnostic capabilities of wind turbines and inconsistent operational practices of personnel, a significant portion of faults lack corresponding maintenance records. This issue has been comprehensively addressed in the study by Ref. [20]. That is to say, a considerable proportion of alarm sequences do not have available fault labels. Consequently, the alarm sequences used in this paper consist of a few labeled alarm sequences and many unlabeled alarm sequences. Consequently, it becomes imperative to investigate the similarity of alarm data through the utilization of unsupervised clustering techniques.
2.2. Statistical Analysis of Alarm Data
In the alarm system used in this paper, a total of 568 alarms are configured. These alarms are classified based on their monitored sub_assembles and functions. In Figure 1, we present statistics for the number of alarms configured in the system for each category, as well as the percentage of times each category of alarm is triggered. The right y-axis represents the number of alarms configured for each category, with the number indicated by red crosses. Among them, the top three categories in terms of the number are power supply, cabin, and pitch and blades, with quantities of 118, 110, and 73, respectively. The left y-axis represents the percentage of times each category is triggered. The top three categories are cooling, pitch and blades, and operational state. Upon examining the detailed alarm information, it is found that frequent triggering of repetitive alarms occurs when the coolant hydraulic pressure is low in the cooling system, resulting in a higher alarm proportion. Alarms in the operational state category are related to wind turbine status transitions and mostly consist of information alarms. The higher proportion of alarms related to the pitch and blades reflects the higher frequency of pitch system and blade failures.
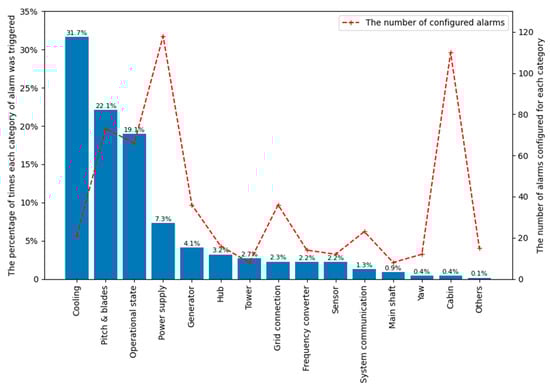
Figure 1.
The number of alarms configured and the percentage of times triggered for each category.
For the 24 wind turbines, we separately calculated the average daily alarm trigger number, as shown by the orange bar in Figure 2. Then, based on the fault time recorded in the maintenance records, we calculated the average daily alarm trigger number for wind turbines when faults occurred, as shown by the blue bar in Figure 2. It can be observed that the average daily alarm trigger number is significantly higher when faults occur compared to normal conditions. This indicates that alarm data serve as strong indicators of wind turbine faults. Additionally, we calculated the maximum daily alarm trigger number for each wind turbine, denoted by red asterisks in Figure 2. The top three values for the maximum daily alarm trigger numbers are 2225, 1172, and 1079, respectively. Handling such a large number of alarms poses a significant challenge for on-site personnel. Additionally, for the entire wind farm, we have calculated the percentage of daily alarm trigger numbers within different ranges, as shown in Figure 3. It can be observed that, on average, there are 36.97 days in a year where the wind farm has 10 to 50 alarm triggers. On average, there are 17.56 days in a year where the wind farm has more than 50 alarm triggers. Therefore, effective methods for analyzing alarm data can significantly increase the efficiency of on-site maintenance personnel.
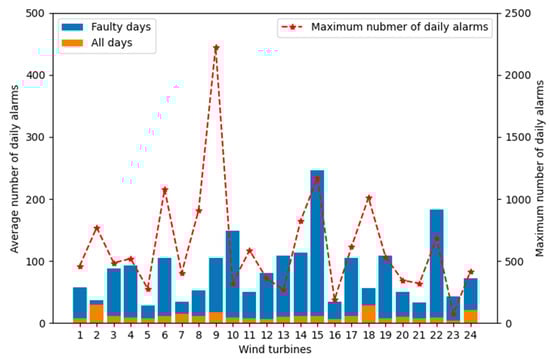
Figure 2.
The average daily alarm trigger number and the maximum daily alarm trigger number for each wind turbine.
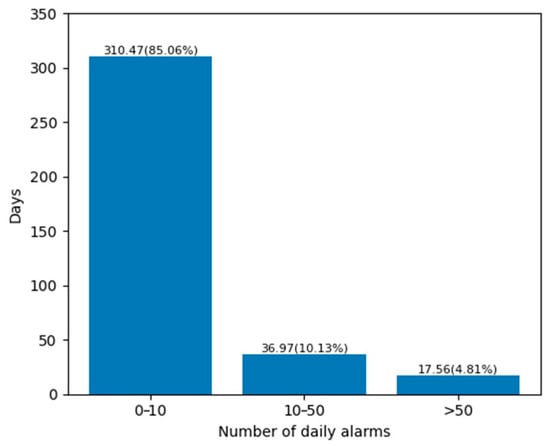
Figure 3.
The percentage distribution of daily alarm trigger numbers in different segments.
3. Basic Methods
This section presents the fundamental training process of Word2vec and highlights the limitations encountered when converting alarms into vector representations using this approach. Subsequently, the chosen K-means algorithm is introduced, along with a commonly employed method for similarity measure and its associated drawbacks.
3.1. Word2vec
Word embedding techniques can be used to convert words from plain text into real-valued representations. Word2vec, being a form of word embedding, has proven to be exceptionally proficient in producing numeric representations for textual data. Transforming textual content into numerical representations facilitates subsequent analysis using algorithms such as cluster analysis [25]. Based on this functionality, Word2vec has been used in the domain of fault diagnosis for analyzing text from maintenance records [26]. Regarding alarm data, Word2vec has been applied to learn its vector representation, enabling the simultaneous capture of relationships between alarms [21,22].
Skip-gram model serves as an implementation technique for Word2vec. Four key terminologies are employed in the model, namely, word, vocabulary, sentence, and corpus. Words are the fundamental units in textual descriptions. A vocabulary is a collection of all available words. A sentence is composed of multiple words and is used to describe an event. A corpus represents the collection of all available sentences. The objective of the training is to obtain vector representations for words based on all the sentences in the corpus, such that these vector representations can capture the correlation of the neighboring words within sentences.
The skip-gram model is a neural network architecture, which is shown in Figure 4. The input layer consists of one-hot encoded vectors representing the target word. Hence, it has a dimension of corresponding to all the words in the vocabulary. One input word is expressed as . Following the input layer, a hidden layer of dimension is connected. In this case, represents the dimensionality of the word embedding. Between the input layer and the hidden layer, there exists a transformation facilitated by a weight matrix . Each row within this matrix corresponds to a vector representation of a respective word, and these vector representations are continually refined during training. The values across each dimension of the vector fall within the range of −1 to 1. Finally, the output layer consists of panels, each panel containing nodes. Here, corresponds to the length of the contextual window, which represents the number of neighboring words under consideration. signifies the dimension of the word embedding. The hidden layer and the output layer are connected via a weight matrix , which remains consistent across each panel. When the semantic window length is , the output of the j-th word in the vocabulary is denoted as . Its corresponding vector representation is denoted as , which is a row vector of the output weights .
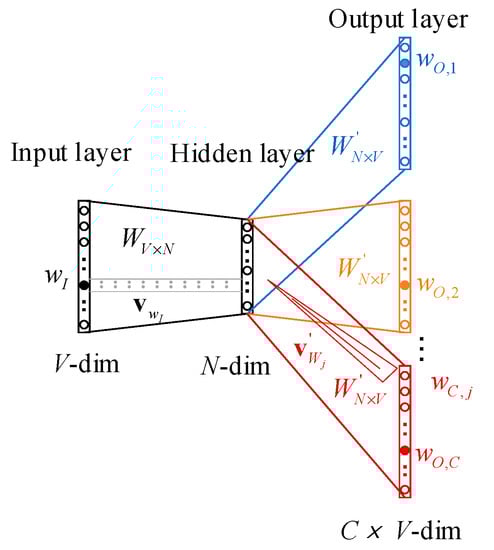
Figure 4.
The Neural network architecture of the skip-gram model. Multiple panels in the output layer are represented by different colors.
The objective of the skip-gram model training is to discover word vector representations that aid in predicting context words within sentences. For a given input word , the probability associated with the actual c-th context word being is represented as
where represents the net dot product of the j-th word in the c-th panel, is the index of the actual output context word occurring at the j-th index of the c-th, is the index for words of the output layers.
By training on a corpus, real contextual words obtain the highest softmax scores compared to other words. The ultimate representation of the raw training loss function is
where is the soft-max activation function, is the output vector, and is the hidden layer vector.
During the training of alarm data using the skip-gram model, alarm codes are treated as words, alarm sequences are treated as sentences, the configured alarms within the alarm system are regarded as the vocabulary, and the collection of all alarm sequences is considered the corpus.
When training alarm sequences using the basic skip-gram model, it reveals that both the sequential and frequency relationships between neighboring alarms within alarm sequences are considered. However, it does not take into account the actual abnormal information represented by the alarm codes. For instance, in the alarm sequence [I2, A155, A155, T110], the skip-gram model can capture the relevant relationship between A155 and T110 but fails to capture the semantic meaning represented by A155, which corresponds to “low coolant pressure”. Existing literature often addresses this by connecting a downstream classification task to optimize the hyperparameters of the skip-gram model when establishing the vector representations [20]. However, the need for a large number of labeled alarm sequences for wind turbines is a major obstacle when applying classification tasks. In natural language processing, a variety of increasingly intricate models have also been proposed to achieve more effective vector representations. However, the volume of alarm data from wind turbines is significantly smaller than that encountered in natural language processing, rendering it challenging to accommodate the training demands of complex models. Therefore, this paper presents an enhanced Word2vec training model as a proposed solution.
3.2. K-Means Clustering
An efficient, easily understandable, and profoundly interpretable method characterizes the K-means algorithm within the domain of clustering [27]. Due to its widespread and successful applications, this study adopts the K-means algorithm to cluster alarm sequences. The K-means operates on the concept that a centroid can effectively represent a cluster. Initially, k centroids are randomly chosen, and each document is assigned to a cluster using a distance metric. Subsequently, the k centroids are recalculated. The process is iteratively repeated until an optimal set of k clusters is achieved, guided by an objective function. In this algorithm, the choice of a suitable distance metric significantly influences the clustering performance.
When alarms are transformed into vector representations using Word2vec, the alarm sequences are represented as sequences of vectors. A method for measuring similarity involves the calculation of Euclidean distances between average vectors derived from the aggregation of alarm vectors across alarm sequences. Let two alarm sequences be represented as and , respectively. After mapping them using Word2vec, they become the corresponding vector sequences and , where , and is the dimensionality of the word embedding. The distance is calculated as
Intuitively, the information of alarm vectors in the word embedding space is significantly compressed. As a result, the clustering performance obtained needs improvement.
4. The Proposed Method
This paper proposes a clustering analysis of alarm sequences using the K-means algorithm, as illustrated in Figure 5. The overall process involves preprocessing alarm data to obtain alarm sequences. Subsequently, the domain knowledge-fused Word2vec (DK-Word2vec) method is employed to represent alarms in vector form. Lastly, K-means clustering is applied to group alarm sequences, using WMD and WRD as distance metrics. In order to demonstrate the effectiveness of the proposed method, the labeled alarm sequences are used to evaluate the clustering performance. The proposed process allows us to cluster alarm sequences with the same fault type together, assisting on-site wind farm operators in promptly identifying the causes of alarms.
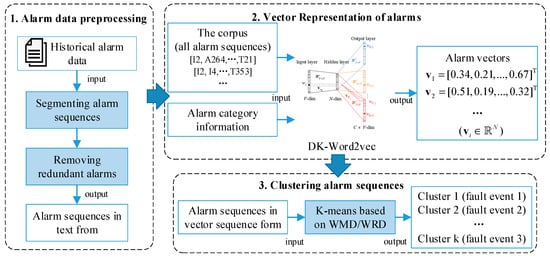
Figure 5.
Workflow of the proposed method.
4.1. Alarm Data Preprocessing
4.1.1. Segmenting Alarm Sequences
A single fault event occurrence can trigger multiple alarms, which are continuously recorded without being distinguished according to their respective fault events. The initial step involves the selection of alarms associated with the same fault events. In the context of an alarm system, information alarms serve to communicate changes in specific operating conditions of wind turbines. Specifically, I2 is an information alarm, indicating alterations in the wind turbine’s operational status. The start and end of I2, respectively, signify the activation and deactivation of wind turbine operations. Thus, the alarms corresponding to a fault event emerge within the start and end of the I2 alarm. Consequently, the continuous stream of alarms can be segmented into alarm sequences by using the I2 alarm. Each resulting alarm sequence comprises alarms that are associated with an identical fault event.
4.1.2. Removing Redundant Alarms
Initially, we eliminated the repeated alarm records. Each alarm possesses an alarm code along with two alarm flags: “start” and “end.” Consequently, a single alarm occurrence may result in two records within a given alarm sequence. To address this, we consolidate the repeated alarm records, retaining only the “start” record.
Next, we proceed to eliminate chattering alarms. These alarms exhibit frequent repetitions for a brief duration. They represent the prevalent category of nuisance alarms. An alarm that is activated three or more times in one minute is typically classified as a severe chattering alarm [28]. Since chattering alarms often offer redundant information, we merge them into a single entry.
4.2. Vector Representation of Alarms Using DK-Word2vec
In order to enhance the rationality of generated alarm vectors using Word2vec, this paper proposes a method that utilizes domain knowledge to intervene and guide the process of alarm vector generation. Specifically, during the training of Word2vec, a loss component related to alarm category information is fused into the loss function, which is provided by domain knowledge.
4.2.1. The Category Information of Alarms
Based on the previous description, the alarm code serves as a unique identifier for each alarm. Additionally, alarm records can offer multiple pieces of information, such as the alarm types (displayed in the third row of Table 2) and descriptions. Moreover, relying on wind turbine domain knowledge, alarms can be further classified based on various criteria. For instance, based on the monitored sub_assembles, alarms can be classified into 16 categories, which are displayed in the third row of Table 2 (This classification is identical to the one presented in Section 2.2). Based on the fault mechanisms of alarms, alarms can be classified as temperature-failure alarms, voltage-failure alarms, current-failure alarms, and control-failure alarms, which are displayed in the fourth row of Table 2. Furthermore, certain alarms can be further classified based on the specific focus of the study. For instance, as indicated by the earlier statistics, the alarming rate of the pitch and blades is relatively high. Therefore, it is necessary to conduct further studies on alarms related to the pitch and blades. The pitch system consists of three pitch actuator units, each controlling its corresponding blade. As a result, alarms related to pitch and blades can be classified according to their respective unit, as shown in the last row of Table 2.
Table 2.
Alarm categories classified under different criteria.
These pieces of category information are attributes of the alarm codes. These attributes are correlated with the fault patterns indicated by alarms, as provided by domain knowledge. We will utilize the category information to intervene and guide the process of alarm vector generation. How to reflect these attributes in the vectors of alarms is the next problem to solve.
It should be noted that an alarm may have multiple categorical attributes. For example, alarm A155, with the description “low coolant pressure”, can be classified as an information alarm under the first classification criterion, a cooling alarm under the second classification criterion, and a temperature failure alarm under the third classification criterion. However, it does not possess the relevant attributes for the fourth classification criterion.
4.2.2. DK-Word2vec
Aiming at the issue of Word2vec neglecting actual abnormal information during training, this study proposes a training approach that fuses alarm category information provided by domain knowledge. The method optimizes the loss function of the skip-gram model, taking the provided alarm category information into account when constructing vector representations for individual alarms. The detailed process is as follows.
Under a particular classification criterion, let
represent the set of categories and denote one category within this set, where each category contains multiple alarms. From an intuitive standpoint, to enhance the distinguishability of clustering, our objective is to minimize the differences among vectors within the same category. Simultaneously, we aspire to maximize the differences among vectors from distinct categories. Let two alarms be denoted as and , where represents the total number of alarms, and their vector representations are represented as and , respectively. The similarity between these two alarms can be calculated using the cosine similarity of vectors:
Based on the categories within the set , the vector representations of two alarms can be denoted as and , where and are the labels of their respective categories. We employ the sum of differences between alarm vectors within the same category to characterize the effectiveness of intra-category classification, denoted as:
where and belong to the same category . A smaller value of indicates a better classification performance within the category content. We use the sum of similarities between alarm vectors in different categories to represent the effectiveness of inter-category classification, denoted as
where and belong to different categories. A smaller value of indicates a better classification performance between different categories.
Since we propose to simultaneously learn the category information provided by domain knowledge during the training of the skip-gram model, we now define a category loss function as
where and are evaluation values under the i-th classification criterion, and is the total number of classification criteria. We combine the category loss function and the skip-gram loss function. The resulting new loss function is referred to as Optimized_Loss, and it is formulated by the following equation:
where is the weight of category loss.
The method of obtaining vector representations through the proposed method is referred to as DK-Word2vec in this paper. The weighted average of two loss functions provides a balance between learning the relationships among neighboring alarms and the category information. A higher value of implies a higher proportion of category information in the vector representation of the alarm.
4.3. Clustering Alarm Sequences Based on WMD and WRD
The goal of clustering is to group alarm sequences triggered by the same faults. Based on the vector representations of alarms obtained from DK-Word2vec, the alarm sequences are represented as a sequence of vectors. Subsequently, the K-means algorithm is employed for clustering. To improve the performance of clustering, we use the WMD and WRD as the distance metric in K-means clustering.
In natural language processing, considerable research has been conducted on sentence semantic similarity analysis based on word embeddings [29]. A sentence or document is a sequentially ordered collection of multiple words. A sentence can be represented as a sequence of vectors. The WMD and WRD are two effective methods for computing the similarity between sentences.
The WMD is a pioneering work that introduced earth move’s distance to the natural language processing field [30]. Let two alarm sequences be represented as and , respectively. After mapping them using Word2vec, they become the corresponding vector sequences and , where , and is the dimensionality of the word embedding. It is the minimum cumulative cost of moving to given the constraints. We allow each alarm in to be transformed into any alarm in in total or parts. The dissimilarity between two alarm sequences can be expressed as
where denotes how much of the alarm in travels to the alarm in .
The WRD is based on the concept of rotating one word’s vector towards the other word’s vector to align their directions [31]. The idea is that this rotation captures the underlying semantic relationship between the words, and the degree of rotation needed represents their similarity or dissimilarity. Formally, WRD is calculated as the minimum angle of rotation needed to align vector to vector in a higher-dimensional space and is expressed as
where , , and denotes how much of alarm in travels to alarm in .
5. Results and Discussion
5.1. Experiment Settings
5.1.1. Experiment Data
The data used have been introduced in Section 2. Following data preprocessing, a total of 1624 alarm sequences were obtained. Among these, 261 alarm sequences were associated with their corresponding maintenance records, resulting in 261 labeled and 1363 unlabeled alarm sequences. The fault event’s types and sample numbers corresponding to labeled data are presented in Table 3. For the fault events with a higher occurrence frequency, we categorize them separately, for instance, pitch system communication fault and frequency-converter communication fault. As for the fault events with lower occurrence frequency, we group them based on their respective subsystems, for example, generator faults.
Table 3.
Types of fault events and the number of samples.
5.1.2. Model Parameters
There are three key parameters in the proposed DK-Word2vec: the vector dimension , the semantic window length , and the weight of the category loss. Owing to the relatively small size of the alarm corpus compared to natural language corpora, a modest value of 50 is chosen for the vector dimension. The semantic window length and the weight will be selected using the labeled alarm sequences based on the external evaluation metrics proposed later.
After obtaining the vector representations of alarms, alarm sequences are represented by vector sequences. Subsequently, the K-means is applied to cluster these alarm sequences. The distance measures employed during K-means clustering include WMD and WRD. For comparison purposes, we also compute the clustering results using AVD.
5.1.3. Evaluation Metrics
In order to assess the performance and effectiveness of clustering algorithms, two types of evaluation metrics are commonly used: external evaluation and internal evaluation metrics. The foremost metrics assess the clustering performance by comparing the clustering results to some external, predefined ground truth or known labels. These metrics require a labeled dataset to measure how well the clustering aligns with the true class assignments. As mentioned in the previous section, we have 261 labeled alarm sequences available for analysis. Initially, we perform clustering on these sequences and assess their clustering performance under various parameter settings using external evaluation metrics to determine the optimal parameter combination. The external metrics employed for evaluation are Purity and Adjusted Rand Index (ARI) [32].
Purity measures the extent to which each cluster consists of instances from a single, dominant class. It is quantified as the ratio of correctly classified objects to the total number of objects.
where is the number of correctly classified objects, is the number of clusters, is the number of true classes, is the object belonging to cluster i, and is the object belonging to class j. The Purity score ranges from 0 to 1, where 1 indicates perfect clustering, meaning each cluster contains data points belonging to a single class only. Conversely, lower Purity values indicate a less accurate clustering, with more mixed-class clusters. Purity is a straightforward and easy-to-interpret metric but has limitations, especially when dealing with unbalanced datasets or clusters with overlapping class distributions. In such cases, ARI might be more informative.
The ARI is a clustering evaluation metric used to assess the quality of clustering results by measuring the similarity between the clustering assignments and the true class labels of the data. It is an improvement over the Rand Index (RI), as it accounts for the expected similarity between random clusterings. The RI is calculated as follows:
where denotes the count of data, signifies the quantity of data within the true and predicted clusters, and f denotes the quantity of data positioned in distinct clusters according to the true and predicted classifications. The ARI is computed by adjusting the RI based on the expected similarity between random clusterings:
where ExpectedRI represents the expected value of RI. The value of ARI ranges from −1 to 1, where 1 indicates perfect clustering, 0 indicates clustering results no better than random, and negative values indicate poor clustering results.
Conversely, internal evaluation metrics measure the quality of clustering results based solely on the data and the clustering structure themselves. These metrics do not rely on any external information or ground truth labels. After obtaining the optimal parameters for DK-Word2vec, we proceed to cluster all the alarm sequences and evaluate them using internal evaluation metrics. The internal evaluation metric used in the paper is the silhouette coefficient (SC).
The SC is a clustering evaluation metric used to assess the quality of clustering results. It provides a measure of how well the data points within a cluster are separated from each other compared to the neighboring clusters. It is defined as follows:
where represents the average distance between a sample and all other samples within the identical cluster, and signifies the average distance between a sample and all other points within the adjacent nearest cluster. The range of SC is [−1, 1]. A higher SC indicates better-defined clusters, while a lower value suggests that the clusters are not well-separated or might be incorrectly formed.
5.2. Case Study
An example of a raw alarm sequence record is presented in Table 4. The fault type of the alarm sequence is pitch system driver fault, which arises due to an under-voltage condition in the power supply. There are 31 alarm records in the raw data. To ensure data confidentiality, we have concealed critical identifying information. The repetitive alarms and chattering alarms are respectively labeled as blue and red. After removing these redundant alarms, the obtained alarm code sequence is [I2, I4, I200, I4, I4, T21, T211, A155, A31, T349, T319, T484, T43, T353, T354, T355, A157, T110, T392, T393, T391, T353]. Then, it will serve as one of the inputs for the proposed DK-Word2vec model.
Table 4.
An example of a raw alarm sequence record. The repetitive alarms and chattering alarms are respectively labeled as blue and red.
The proposed DK-Word2vec model, upon being trained on all alarm sequences and their corresponding category information, yields vector representations for all alarms. Each alarm’s vector has a dimensionality of 50. For instance, the vector representation of alarm T353 is denoted as . In order to visually represent the vector relationships between different alarms more effectively, we employed t-SNE to reduce the dimensionality of alarm vectors to three dimensions. All alarm vectors are depicted in Figure 6. Within the aforementioned alarm sequence, alarms T391, T392, and T393 correspond to low voltage in three battery cabinets of the variable pitch system, while alarms T353, T354, and T355 correspond to low voltage in the three blades. These alarms are frequently triggered simultaneously, exhibiting a noticeable clustering trend in the visualization. This indicates that numerical vectors can depict the interrelated relationships among alarms.
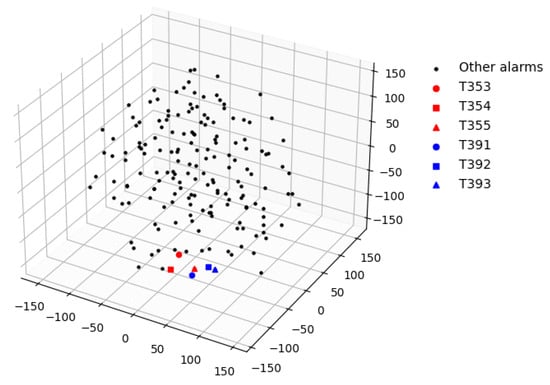
Figure 6.
The alarm vectors displayed in a three-dimensional plot.
Subsequently, the aforementioned alarm sequences can be represented as a sequence of vectors, denoted as . Following this, the K-means algorithm will be applied to conduct cluster analysis on all vector sequences.
5.3. Results
5.3.1. The Clustering Results of Labeled Alarm Sequences
The clustering results based on WMD are illustrated in Figure 7, with Figure 7a representing the Purity metric and Figure 7b representing the ARI metric. In Figure 7a, the x-axis represents the semantic window length, while the y-axis denotes the values of Purity. The weight of the category loss is differentiated by varying shades of purple, where deeper shades indicate a higher proportion of category loss weight. In Figure 7b, the annotations are similar to Figure 7a, where the x-axis represents the semantic window length, and the y-axis represents the ARI values. The weight of the category loss is distinguished by varying shades of blue, with deeper shades indicating a higher proportion of category loss weight. Due to the sensitivity of the K-means algorithm to the initial selection of cluster centroids, it can lead to different outcomes. The data in this study were tested five times under the same parameter settings, and the average values were reported.
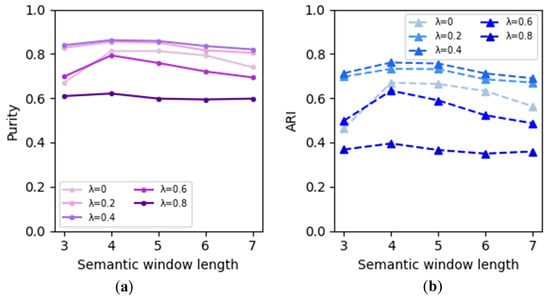
Figure 7.
The clustering results based on WMD: (a) The results of Purity; (b) The result of ARI.
It can be observed that the weight significantly impacts the clustering results. When the weight is set to 0, the obtained results correspond to those obtained using the original loss function of Word2vec. With the increase in the proportion of category loss, the overall clustering performance exhibits an initial improvement followed by a decline. When the weight is 0.4, both Purity and ARI reach their maximum values. Therefore, it can be concluded that by incorporating the alarm category information provided by domain knowledge, the alignment between the alarm vector representation and actual fault patterns can be enhanced. However, the proportion of category loss should not be excessively high, as the context semantic information captured by the original Word2vec is also crucial for the vector transformation of alarms. Furthermore, it can be observed that the length of the semantic window also affects the clustering performance. When the semantic window is set to 4, the overall performance is the best.
The clustering results based on WRD and AVD are shown in Figure 8 and Figure 9, respectively, with the same annotations as in Figure 7. As depicted in Figure 8, the clustering results using WRD follow a similar pattern as those using WMD, but the WRD-based results exhibit superior performance to the WMD-based results. In Figure 9, the overall clustering performance based on AVD is not as satisfactory as that based on WRD and WMD. This is because when computing AVD, the multi-dimensional information of alarm vectors significantly collapses, leading to the underutilization of essential information. This demonstrates that employing WMD and WRD as distance metrics in K-means clustering can effectively enhance the clustering performance of alarm sequences.
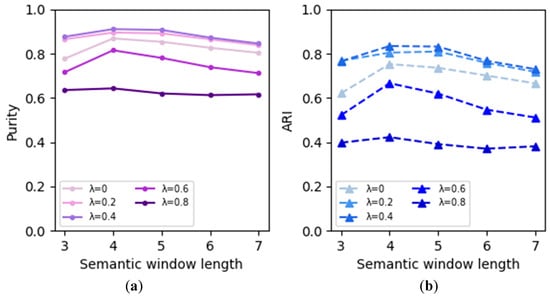
Figure 8.
The clustering results based on WRD: (a) The results of Purity; (b) The result of ARI.
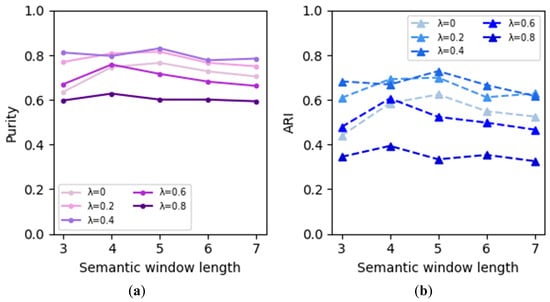
Figure 9.
The clustering results based on AVD: (a) The results of Purity; (b) the result of ARI.
Furthermore, we compared our alarm numerical representation method with the existing methods used in prior research. Specifically, we employed the binary vector representation method from Ref. [19], the method combining binary vector representation and subsequent feature extraction from Ref. [18], and the original skip-gram model from Ref. [22]. All clustering methods used in the comparison were K-means based on AVD. The results are presented in Table 5, which show that the clustering approach based on the proposed DK-Word2vec obtain the highest Purity and ARI.
Table 5.
The comparison results of alarm numerical representation methods.
5.3.2. The Clustering Results of All Alarm Sequences
Based on the clustering results using labeled alarm sequences, it is determined that the optimal clustering performance for K-means clustering, using the distance metric WRD, is achieved when DK-Word2vec has a weight of 0.4 and a semantic window length of 4. Consequently, these parameters were employed to cluster all the alarm sequences, including the labeled and unlabeled data. The average SC was computed for different numbers of clusters, as illustrated in Figure 10. The highest average SC is observed when there are 18 clusters, indicating that the clustering performance is optimal.
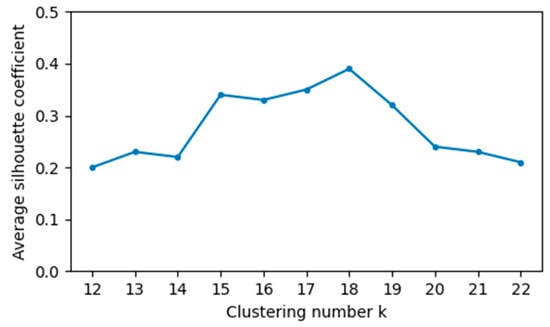
Figure 10.
Average silhouette coefficient scores obtained for different numbers of clusters. The highest average SC is observed when there are 18 clusters.
Based on the number of labeled alarm sequences in each cluster and existing domain knowledge, we analyzed the alarm sequences within each cluster and identified the corresponding fault events. Furthermore, we conducted a statistical analysis of the number of alarm sequences within each cluster. The results are presented in Figure 11. Compared to the fault events corresponding to labeled alarm sequences, the wind turbine unwinding control, the restart of the wind turbine, tower faults, and low grease tank liquid levels are newly identified fault types. Therefore, these faults are primarily associated with unlabeled alarm sequences. Consultation with wind turbine maintenance experts revealed that the wind turbine unwinding control is a routine operation during wind turbine operation and does not require maintenance. Restart of the wind turbine is a predefined self-check and protection action in the wind turbine’s main control system. Tower faults and Low grease tank liquid levels are faults that field operators tend to overlook.
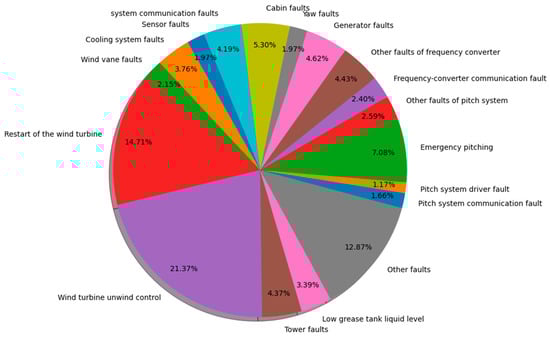
Figure 11.
Statistical pie chart depicting the proportion of fault events.
6. Conclusions
When wind turbines experience faults, a large number of alarms are generated in a short period. These alarm data represent the manifestations of turbine faults and, through proper analysis and utilization, can be used to diagnose the types of faults. Due to its ease of understanding, implementation, and independence from data labels, similarity analysis methods have found widespread application. One efficient implementation approach for these methods involves the identification of alarm sequences triggered by the same fault events, and clustering analysis is one of the effective techniques employed. In existing research, a direct application of Word2vec to transform alarm codes into numerical vectors resulted in deviations from the actual fault patterns. Furthermore, deficiencies are observed in the distance evaluation methods for vector sequences representing alarm sequences during clustering analysis. In response to these two primary issues, our study was conducted.
This paper proposed a method using K-means clustering to analyze wind turbine alarm data. Firstly, a preprocessing step was applied to the continuous alarms to obtain alarm sequences triggered by the same fault. Then, the proposed DK-Word2vec was used to obtain vector representations of individual alarms. Finally, the K-means algorithm based on new distance metrics was used to cluster alarm sequences. The wind turbine alarm data consists of a small portion of labeled data sequences and a large portion of unlabeled alarm sequences. The proposed method’s performance was validated using the labeled data. The results show that in DK-Word2vec, when the weight of the class loss is set to 0.4, and the semantic window length is four, the established alarm vectors match the actual fault patterns most accurately, leading to optimal clustering performance based on these vector representations. The WMD and WRD used in K-means can improve the Purity and ARI values. Moreover, using the optimal parameter combination, all the alarm sequences were clustered, revealing four new fault types in the unlabeled data.
Existing research mainly focuses on analyzing historical alarm data. However, the generation of an alarm sequence often requires a process. In future research, it will be essential to predict alarms in an alarm sequence for early fault diagnosis in wind turbines.
Author Contributions
Conceptualization, L.W. (Lu Wei) and L.W. (Liliang Wang); methodology, L.W. (Lu Wei); software, L.W. (Lu Wei); validation L.W. (Lu Wei); formal analysis, L.W. (Liliang Wang); writing—original draft preparation, L.W. (Lu Wei); writing—review and editing, L.W. (Liliang Wang), Z.Q. and F.L.; resources and funding acquisition, Z.Q.; supervision, F.L. and Z.Q. All authors have read and agreed to the published version of the manuscript.
Funding
This research was supported by the National Natural Science Foundation of China (No. 61573046), the Program for Changjiang Scholars and Innovative Research Team in University (No. IRT1203), and the National Nature Science Foundation of China under Grant Nos. U2233216 and U2033215.
Institutional Review Board Statement
Not applicable.
Informed Consent Statement
Not applicable.
Data Availability Statement
Not applicable.
Conflicts of Interest
The authors declare no conflict of interest.
References
- Hutchinson, M.; Zhao, F. Global Wind Report 2023; Global Wind Energy Council: Brussels, Belgium, 2023; 120p, Available online: https://gwec.net/globalwindreport2023/ (accessed on 27 March 2023).
- Wang, D.; Teng, W.; Zhang, G.; Qu, X.; Liu, Y.; Ma, Z.; Kusiak, A. An opportunistic maintenance strategy for wind turbines. IET Renew. Power Gener. 2021, 15, 3793–3805. [Google Scholar] [CrossRef]
- Li, J.; Meng, Z.; Yin, N.; Pan, Z.; Cao, L.; Fan, F. Multi-source feature extraction of rolling bearing compression measurement signal based on independent component analysis. Measurement 2021, 172, 108908. [Google Scholar] [CrossRef]
- Zhao, Z.; Chen, N. Acoustic emission based damage source localization for structural digital twin of wind turbine blades. Ocean Eng. 2022, 265, 112552. [Google Scholar] [CrossRef]
- Cross, P.; Ma, X. Nonlinear system identification for model-based condition monitoring of wind turbines. Renew. Energy 2014, 71, 166–175. [Google Scholar] [CrossRef]
- Du, B.; Narusue, Y.; Furusawa, Y.; Nishihara, N.; Indo, K.; Morikawa, H.; Iida, M. Clustering wind turbines for SCADA data-based fault detection. IEEE Trans. Sustain. Energy 2023, 14, 442–452. [Google Scholar] [CrossRef]
- Gonzalez, E.; Stephen, B.; Infield, D.; Melero, J.J. Using high-frequency SCADA data for wind turbine performance monitoring: A sensitivity study. Renew. Energy 2019, 131, 841–853. [Google Scholar] [CrossRef]
- Bao, C.; Zhang, T.; Hu, Z.; Feng, W.; Liu, R. Wind turbine condition monitoring based on improved active learning strategy and KNN algorithm. IEEE Access 2023, 11, 13545–13553. [Google Scholar] [CrossRef]
- Qiu, Y.; Feng, Y.; Tavner, P.; Richardson, P.; Erdos, G.; Chen, B. Wind turbine SCADA alarm analysis for improving reliability. Wind Energy 2012, 15, 951–966. [Google Scholar] [CrossRef]
- Gonzalez, E.; Reder, M.; Melero, J.J. SCADA alarms processing for wind turbine component failure detection. In Proceedings of the Conference on Science of Making Torque from Wind (TORQUE), Munich, Germany, 5–7 October 2016. [Google Scholar]
- Kaidis, C.; Uzunoglu, B.; Amoiralis, F. Wind turbine reliability estimation for different assemblies and failure severity categories. IET Renew. Power Gener. 2015, 9, 892–899. [Google Scholar] [CrossRef]
- Rodríguez-López, M.A.; López-González, L.M.; López-Ochoa, L.M. Development of indicators for the detection of equipment malfunctions and degradation estimation based on digital signals (alarms and events) from operation SCADA. Renew. Energy 2022, 18, 288–296. [Google Scholar] [CrossRef]
- Leahy, K.; Gallagher, C.; O’Donovan, P.; Bruton, K.; O’Sullivan, D.T.J. A robust prescriptive framework and performance metric for diagnosing and predicting wind turbine faults based on SCADA and alarms data with case Study. Energies 2018, 11, 1738. [Google Scholar] [CrossRef]
- Zhang, K.; Tang, B.; Deng, L.; Yu, X.; Wei, J. Fault source location of wind turbine based on heterogeneous nodes complex network. Eng. Appl. Artif. Intell. 2021, 103, 104300. [Google Scholar] [CrossRef]
- Chen, B.; Qiu, Y.N.; Feng, Y.; Tavner, P.J.; Song, W.W. Wind turbine SCADA alarm pattern recognition. In Proceedings of the IET Conference on Renewable Power Generation, Edinburgh, UK, 5–8 September 2011. [Google Scholar]
- Tong, C.; Guo, P. Data mining with improved Apriori algorithm on wind generator alarm data. In Proceedings of the 25th Chinese Control and Decision Conference, Guiyang, China, 25–27 May 2013. [Google Scholar]
- Qiu, Y.; Feng, Y.; Infield, D. Fault diagnosis of wind turbine with SCADA alarms based multidimensional information processing method. Renew. Energy 2020, 145, 1923–1931. [Google Scholar] [CrossRef]
- Leahy, K.; Gallagher, C.; O’Donovan, P.; O’Sullivan, D.T. Cluster analysis of wind turbine alarms for characterising and classifying stoppages. IET Renew. Power Gener. 2018, 12, 1146–1154. [Google Scholar] [CrossRef]
- Wei, L.; Qian, Z.; Pei, Y.; Zareipour, H. Wind turbine fault diagnosis by the approach of SCADA alarms analysis. Appl. Sci. 2023, 12, 69. [Google Scholar] [CrossRef]
- Wei, L.; Qu, J.; Wang, L.; Liu, F.; Qian, Z.; Zareipour, H. Fault diagnosis of wind turbine with alarms based on word embedding and Siamese convolutional neural network. Appl. Sci. 2023, 13, 7580. [Google Scholar] [CrossRef]
- Cai, S.; Palazoglu, A.; Zhang, L.; Hu, J. Process alarm prediction using deep learning and word embedding methods. ISA Trans. 2019, 85, 274–283. [Google Scholar] [CrossRef] [PubMed]
- Cai, S.; Zhang, L.; Palazoglu, A.; Hu, J. Clustering analysis of process alarms using word embedding. J. Process Control 2019, 83, 11–19. [Google Scholar] [CrossRef]
- Wang, J.; Yang, F.; Chen, T.; Shah, S.L. An overview of industrial alarm systems: Main causes for alarm overloading, research status, and open problems. IEEE Trans. Autom. Sci. Eng. 2016, 13, 1045–1061. [Google Scholar] [CrossRef]
- Shen, Y.; Chen, B.; Guo, F.; Meng, W.; Yu, L. A modified deep convolutional subdomain adaptive network method for fault diagnosis of wind turbine systems. IEEE Trans. Instrum. Meas. 2022, 71, 3504110. [Google Scholar] [CrossRef]
- Nasim, Z.; Haider, S. Cluster analysis of urdu tweets. J. King Saud Univ.-Comput. Inf. Sci. 2022, 34, 2170–2179. [Google Scholar] [CrossRef]
- Bhardwaj, A.S.; Deep, A.; Veeramani, D.; Zhou, S. A custom word embedding model for clustering of maintenance records. IEEE Trans. Ind. Inform. 2022, 18, 816–826. [Google Scholar] [CrossRef]
- Li, H.; Wang, J. Collaborative annealing power k-means++ clustering. Knowl.-Based Syst. 2022, 255, 109593. [Google Scholar] [CrossRef]
- International Society of Automation (ISA). Management of Alarm Systems for the Process Industries; International Society of Automation: Research Triangle Park, NC, USA, 2009. [Google Scholar]
- Han, M.; Zhang, X.; Yuan, X.; Jiang, J.; Yun, W.; Gao, C. A survey on the techniques, applications, and performance of short text semantic similarity. Concurr. Comput.-Pract. Exp. 2020, 33, e5971. [Google Scholar] [CrossRef]
- Kusner, M.J.; Sun, Y.; Kolkin, N.L.; Weinberger, K.Q. From word embeddings to document distances. In Proceedings of the International Conference of Machine Learning, Lille, France, 7–9 July 2015. [Google Scholar]
- Yokoi, S.; Takahashi, R.; Akama, R.; Suzuki, J.; Inui, K. Word rotator’s distance. In Proceedings of the Empirical Methods in Natural Language Processing (EMNLP 2020), Online, 16–20 November 2020. [Google Scholar]
- Amigó, E.; Gonzalo, J.; Artiles, J.; Verdejo, F. A comparison of extrinsic clustering evaluation metrics based on formal constraints. Inf. Retr. 2009, 12, 461–486. [Google Scholar] [CrossRef]
Disclaimer/Publisher’s Note: The statements, opinions and data contained in all publications are solely those of the individual author(s) and contributor(s) and not of MDPI and/or the editor(s). MDPI and/or the editor(s) disclaim responsibility for any injury to people or property resulting from any ideas, methods, instructions or products referred to in the content. |
© 2023 by the authors. Licensee MDPI, Basel, Switzerland. This article is an open access article distributed under the terms and conditions of the Creative Commons Attribution (CC BY) license (https://creativecommons.org/licenses/by/4.0/).