Article

Electrochemical Detection of SARS-CoV-2 Using Immunomagnetic Separation and Gold Nanoparticles on Unmodified Screen-Printed Carbon Electrodes

by
Christopher J. Lambert
1,†,
Harikrishnan Jayamohan
1,*,†,
Bruce K. Gale
1,2,
Lars B. Laurentius
3,
Dhruv Patel
1,
Madison Hansen
1,
Tawsif Mahmood
1 and
Himanshu Jayant Sant
2,4
1
Department of Mechanical Engineering, University of Utah, Salt Lake City, UT 84112, USA
2
Espira Inc., 825N 300W Suite N-223, Salt Lake City, UT 84103, USA
3
Department of Electrical and Computer Engineering, University of Utah, Salt Lake City, UT 84112, USA
4
Department of Chemical Engineering, University of Utah, Salt Lake City, UT 84112, USA
*
Author to whom correspondence should be addressed.
These authors contributed equally to this work.
Appl. Sci. 2023, 13(18), 10007; https://doi.org/10.3390/app131810007
Submission received: 26 July 2023 / Revised: 28 August 2023 / Accepted: 3 September 2023 / Published: 5 September 2023
(This article belongs to the Topic Advanced Nanomaterials for Sensing Applications)

Abstract

:
The COVID-19 pandemic has underscored the critical need for virus detection methods that are precise, simple, quick, and cost-effective. Electrochemical immunoassay-based methods are a practical solution given their ability to quickly, inexpensively, sensitively, and selectively detect the virus at the point of care. This study details the immunomagnetic capture of SARS-CoV-2 nucleocapsid protein in nasal samples, followed by electrochemical detection using gold nanoparticle labels on a screen-printed carbon electrode. We determined ideal conditions for the size of the gold nanoparticles and the length of the deposition time to maximize the electrochemical signal. The limit of detection for nucleocapsid protein was determined to be 2.64 ng/mL in PBS. The assay was successfully demonstrated to detect nucleocapsid protein in SARS-CoV-2-positive samples with a viral load as low as Ct = 25 (p-value < 0.0001 vs. negative patient control).

1. Introduction

The social, economic, and healthcare challenges posed by the COVID-19 pandemic have been unprecedented. As of January 2023, worldwide COVID-19 cases have surpassed over half a billion, with an associated death toll of more than 6.6 million [1]. Early in the pandemic, large-scale testing, timely detection, and isolation were identified as vital elements to control the spread [2]. The 2019 COVID pandemic has demonstrated the need for easy, fast, cost-effective, and accurate virus detection techniques. Recently, viral outbreaks such as Monkeypox, Marburg, Ebola, and COVID-19 variants have been of concern. Such outbreaks highlight the need for effective and inexpensive point-of-care (POC) diagnostic tools for surveillance and to deploy rapid medical countermeasures.
Since December 2021, the FDA has authorized two oral antiviral medications for COVID-19. While vaccinations remain the primary and potent tool against COVID-19, antiviral drugs have been found to be effective if administered as soon as possible after diagnosis (within five days of developing symptoms) [3]. Polymerase chain reaction (PCR) remains the gold standard for COVID-19 detection. However, centralized laboratory-based PCR testing involves long turnaround times (up to several days) [4]. Currently authorized COVID-19 antiviral drugs are effective if administered within five days of symptom onset. Hence, widespread access to rapid and accurate point-of-care companion diagnostic tests is essential for the success of antiviral drugs against SARS-CoV-2 infections [5].
Antigen-based immunoassays have been extensively utilized to test for COVID-19. Detection methods include electrochemical, optical, piezoelectric, magnetic, and plasmonics-based methods to detect the COVID-19 antigen [6,7]. Among these, electrochemical immunoassay-based biosensors are a practical approach given their capability for rapid, inexpensive, sensitive, and selective detection at the point of care [8]. Electrochemical (EC) biosensors recognize the interaction between an analyte (e.g., a pathogen or a label) and a recognition element (e.g., a capture antibody), producing an electrical signal that is monitored by a transducer [9]. Often, EC biosensors are combined with metal nanomaterials such as silver (Ag) and gold (Au) nanoparticles (NPs). Such nanomaterials provide distinct advantages such as a high surface-to-volume ratio, superior electron transfer properties, and stability in immobilized biomolecules. EC biosensors utilizing screen-printed carbon electrodes (SPCEs) modified with such nanomaterials offer improved analytical and miniaturization capabilities for POC use [10]. Further, the addition of an immunomagnetic step enables the capture and concentration of the analyte of interest, especially from larger-volume samples [11].
A “sandwich approach” combining immunomagnetic beads for analyte capture and an antibody-conjugated EC label has been utilized to detect pathogens [12]. The use of immunomagnetic beads enables the preconcentration of analytes from complex biological samples and the magneto-controlled transport of the sandwich to the surface of an SPCE for detection [13,14,15]. The secondary component of the sandwich involves antibodies that are labeled with an EC marker. These antibodies are designed to bind to the target analyte at a different site than the immunomagnetic bead-conjugated antibodies. The use of secondary EC labels enables the amplification of the detection signal [16]. Thus, the sandwich approach combines two advantages: preconcentration from large sample volumes and signal amplification. Nascimento et al. reported the use of magnetic beads combined with AuNPs for the detection of the SARS-CoV-2 spike protein in saliva [17]. Karakus et al. developed an AuNP-based biosensor that was utilized for the detection of the SARS-CoV-2 spike antigen in spiked saliva samples [18]. More broadly, EC biosensors for detecting SARS-CoV-2 have been well described, and readers can refer to recent reviews on the same [19,20,21].
Most immunoassays for detecting SARS-CoV-2 active infections utilize the nucleocapsid (N) or the spike protein (antigen) as targets. Many commercially available immunoassay-based COVID-19 self-tests in the US use the N protein (antigen) as a target of detection (Flowflex, BinaxNOW, QuickVue, InteliSwab, BD Veritor, iHealth) [22]. N-based antigen assays have been reported to have higher sensitivity than spike-based assays in nasopharyngeal specimens [23]. According to the literature, 1000 copies of the N protein are expressed by each SARS-CoV-2 virion, compared with an estimated 100 spike protein trimers, which equates to 300 monomers [24]. Here, we target the N protein as our diagnostic marker for SARS-CoV-2 infection in nasal samples.
In this work, we report the use of a magneto-controlled immuno-capture of the SARS-CoV-2 N protein in nasal samples and subsequent EC detection using gold nanoparticle (AuNP) labels (Figure 1). The feasibility of using AuNP labels for EC detection on an SPCE has been well established. The authors direct the interested reader to several noteworthy resources wherein the characterization of the EC mechanism has been described theoretically and experimentally [25,26,27,28]. Magnetic beads (MBs) conjugated with anti-nucleocapsid protein were used to preconcentrate the N protein from nasal samples while simultaneously labeling with AuNPs, forming a sandwich. We identified the ideal size for AuNPs to be used in the assay by considering both the strength of the signal they produce and the ease of attaching antibodies to them. We also determined the ideal deposition time that yields a maximum EC signal and lower noise. Utilizing these parameters, we can report the detection of the N protein in PBS buffer and COVID-19-positive nasal samples. To the best of our knowledge, this is the first protocol to demonstrate the simultaneous magnetic particle preconcentration and AuNP labeling of human-nasal-sample-extracted N proteins for EC detection. Once generated, the MB-N protein-AuNP sandwich is transferred to an SPCE for EC detection utilizing Differential Pulse Voltammetry (DPV).

2. Materials

2.1. Reagents for Immunomagnetic Separation and Sandwich Formation

The SARS-CoV-2 N protein (Catalog# NUN-C5227), the S46 Anti-SARS-CoV-2 N antibody (Catalog# NUN-S46) for conjugation to AuNPs, and the biotinylated anti-SARS-CoV-2 N antibody (Catalog# NUN-S47) for conjugation to M-280 streptavidin beads were obtained from ACROBiosystems (Newark, DE, USA). AuNPs of different nominal diameters (5 nm dia., Catalog# EM.GC5/4; 10 nm dia., Catalog# EM.GC10/4; 20 nm dia., Catalog# EM.GC20/4; 40 nm dia., Catalog# EM.GC40/4) suspended in DI water were procured from BBI Solutions (Portland, ME, USA). M-280 streptavidin superparamagnetic particles (Catalog# 11205D), PBS buffer (pH 7.4, Catalog# 10010049), and dithiobis(succinimidyl propionate) (DSP) (Catalog# 22585) were obtained from Thermo Fisher Scientific (Waltham, MA, USA). The conjugation of S46 Ab to AuNPs (S46-AuNP) was performed using a previously described thiol chemistry [29]. The stock concentration of the 20 nm AuNPs used in the N protein detection experiments was calculated to be 1.132 × 10⁻⁴ g/mL (1.4 × 10¹² AuNPs/mL) and does not account for losses incurred during the antibody conjugation process. Unless otherwise mentioned, PBS was used at 1× concentration. The conjugation of M-280 particles to S47 antibody (S47-M280) was performed as per Thermo Fisher Scientific’s protocol [30]. The concentration of the prepared M-280 particles was calculated to be 5 mg/mL (3.25 × 10⁸ MBs/mL) and does not account for particle losses incurred during the conjugation process. SARS-CoV-2 N protein was obtained from ACROBiosystems (Catalog# NUN-C5227, 400 μg/mL, 50 μL aliquots). All reagents were of analytical grade and were used as received. Ultra-pure deionized (DI) water prepared with a Purelab System (ELGA Purelab, High Wycombe, UK) was used throughout this work. A custom 3D-printed fixture positioned the SPCE directly above the magnet for magnetic bead capture (Supporting Information, Figure S1). A 2 mm neodymium magnet (Dura Magnetics, Sylvania, OH, USA) was integrated into the 3D-printed fixture. All instances of rotation within the protocol occurred on a Mini Lab Roller (Labnet H5500 Mini Lab Roller (Edison, NJ, USA)). A BioTek ELx800 plate reader (Winooski, VT, USA) was used to analyze an enzyme-linked immunosorbent assay (ELISA) plate. BinaxNOW extraction reagent was procured as part of the BinaxNOW COVID-19 Antigen Self-Test Kit (Catalog# 550147, CVS Pharmacy, Woonsocket, RI, USA).

2.2. Materials for ELISA

ELISA was used to quantify the immunological qualities of the antibody. A high-affinity polystyrene 96-well plate (Corning Costar, Catalog# 3590), BuPH Modified Dulbecco’s phosphate buffered saline solution (MPBS, Catalog# 50-255-873), bovine serum albumin (Catalog# B14), Tween 20 (Catalog# 655204), StartingBlock Blocking Buffer (“blocking buffer,” Catalog# PI-37538, lot# VH312465), biotinylated mouse IgG1 (AS47) anti-SARS-CoV-2 N antibody (ACROBiosystems NUN-S47L8-200ug, Catalog# 50-205-5033, lot# BLS47-20AUF1-2117), and 1-Step Ultra TMB (3,3′,5,5′ tetramethylbenzidine) ELISA Substrate Solutions (Catalog# 34028) were obtained from Thermo Fisher Scientific (Waltham, MA, USA). Streptavidin-conjugated horseradish peroxidase (HRP, Catalog# DY998) was obtained from R&D Systems (Minneapolis, MN, USA). The “wash buffer” used in the protocol consisted of 0.05% Tween 20 (v/v) in MPBS. The “tracer antibody” included a biotinylated anti-SARS-CoV-2 N antibody diluted to 800 ng/mL in MPBS (1% BSA (w/v)). The “stop solution” used was 2 normal sulfuric acid.

2.3. Apparatus for Electrochemical Detection

Hydrochloric acid (HCl) (Catalog# 339253) was obtained from Sigma-Aldrich (St. Louis, MO, USA). The SPCE used in the EC detection (Catalog# TE-100, Zensor R&D, Taiwan) was a three-electrode system consisting of a carbon working electrode (3 mm dia., geometric working area of 7.07 mm2), a carbon counter electrode, and a silver pseudo-reference electrode. A Gamry Reference 600 potentiostat (Warminster, PA, USA) was used for EC analysis.

2.4. Clinical Samples

We utilized residual nasal swab samples collected from individuals seeking a diagnosis for symptoms that align with COVID-19. The nasal swabs were collected in viral transport media (VTM). These samples were previously subjected to RT-PCR testing for SARS-CoV-2 using platforms that received emergency use authorization (EUA) from the U.S. Food and Drug Administration (FDA). After testing, residual patient samples were stored at −20 °C. Prior to using them for this study, these specimens were deidentified (IRB protocol 7275) and unlinked from subjects. In this study, residual, deidentified specimens were collected from 72 females and 61 males, ranging in age from 1 to 96 years. All samples were from patients presenting with respiratory symptoms consistent with COVID-19 at the University of Utah hospital and clinic system. Freeze–thaw cycles were minimized.

3. Methods

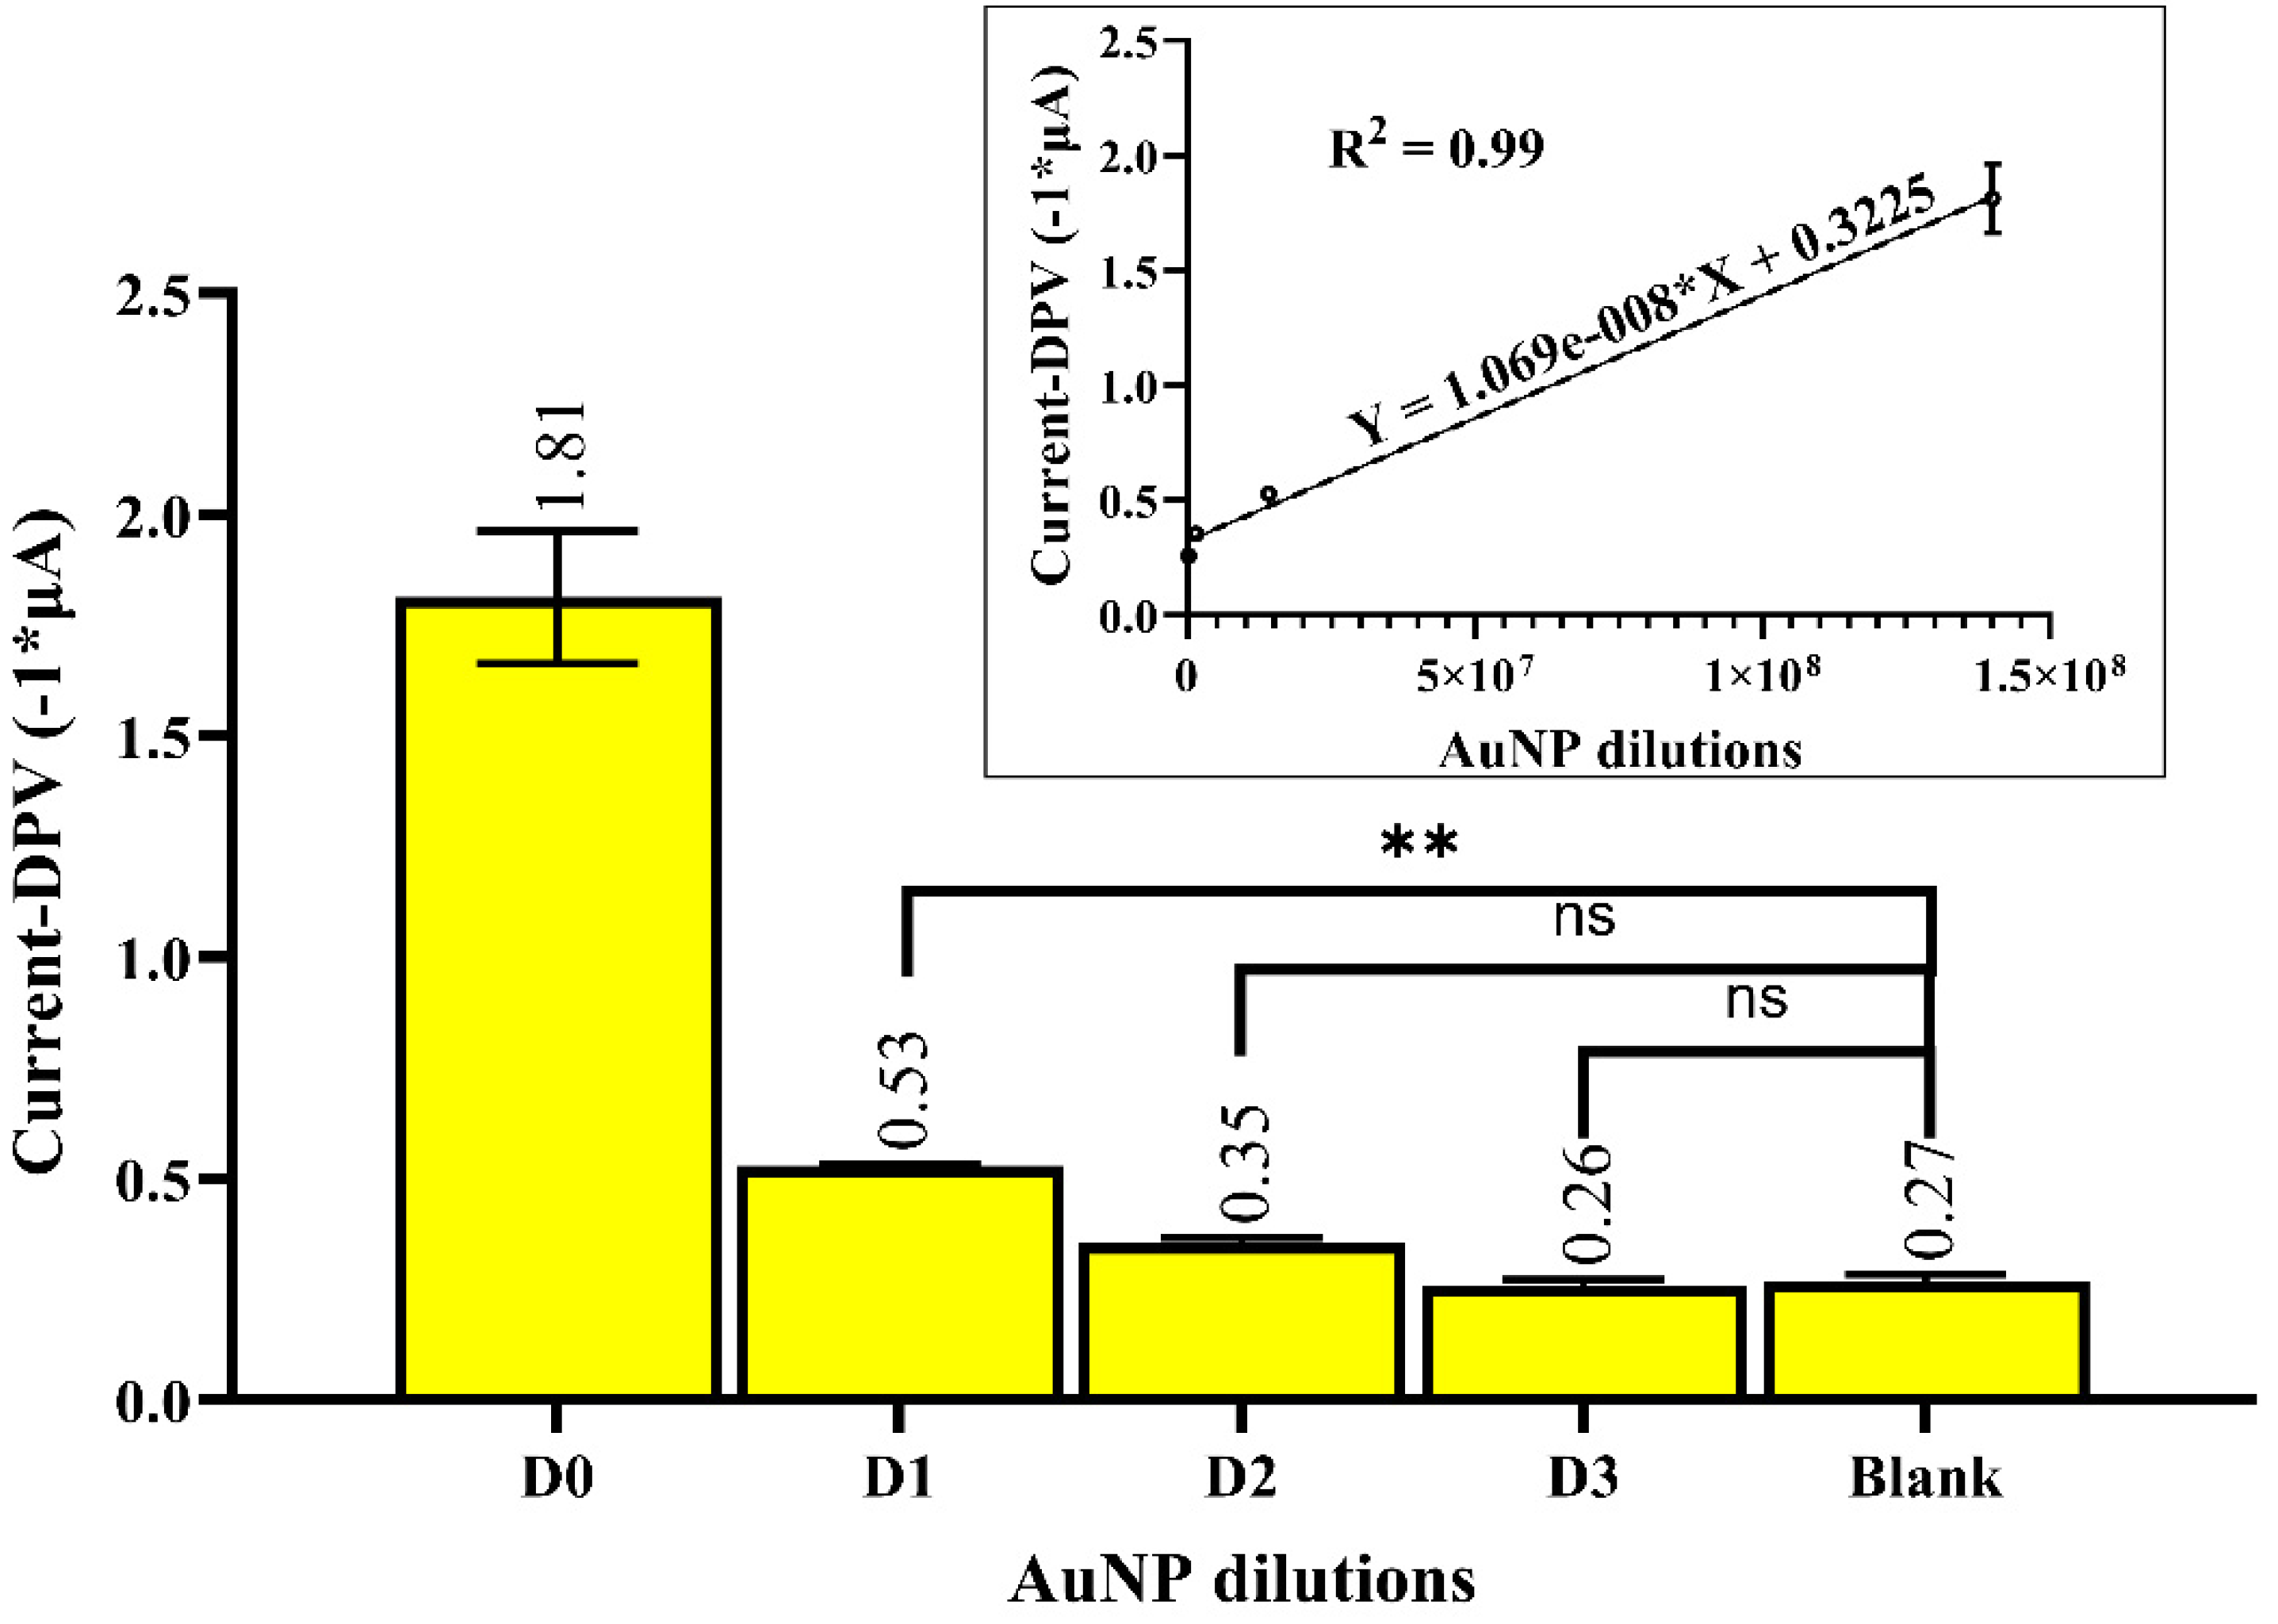
3.1. Direct EC Detection of AuNPs on the SPCE

We utilized two pulsed voltammetric techniques, square wave voltammetry (SWV), and DPV, for our analysis. SWV is a special type of DPV [27]. We utilized SWV to identify improved parameters for AuNP size and deposition time. Utilizing these parameters, we performed the subsequent analysis using DPV.
A volume of 2 μL containing different concentrations (D0 = 1.4 × 10⁸, D1 = 1.4 × 10⁷, D2 = 1.4 × 10⁶ and D3 = 1.4 × 10⁵ particles per 2 μL) of different-sized AuNPs (diameter = 5, 10, 20, 40 nm) in DI water was drop-cast on the carbon working electrode of the SPCE and dried in a laminar flow hood until completely dry. A volume of 2 μL was chosen because this volume completely covers but does not extend beyond the surface area of the 3 mm working electrode surface. The droplet on the working electrode was observed to wet the whole working electrode surface up to the electrode insulation material of the SPCE. The control consisted of 2 μL of DI water (no AuNPs) used as a sample for EC detection. Scanning electron microscopy (SEM) was used to verify that the dried AuNP coverage of the working electrode was uniform (image not shown). After the AuNP sample was completely dry, 50 μL of 0.1 M HCl in 5 mM PBS (the supporting electrolyte) was added to the SPCE, completely covering the working, counter, and reference electrodes. A constant voltage of 1.25 V was applied for 120 s (deposition time) to oxidize the AuNPs adsorbed on the surface of the SPCE. This was followed by an SWV scan from 1.25 to 0 V with a pulse size of 50 mV and a frequency of 10 Hz.
The SWV EC signal was normalized by the total mass of the particles in the 2 μL volume (such that the Au ion concentration for a given dilution was equal for all the AuNP sizes under consideration). AuNPs (in an HCl solution) at a potential of +1.25 V oxidized to AuCl4. Subsequently, a potential scan from 1.25 to −0.2 V resulted in the reduction of AuCl4 to Au, with a cathodic peak observed at 0.3 V. We hypothesized that smaller AuNPs should yield a higher cathodic peak given the larger proportion of surface atoms vs. core atoms (in comparison with larger AuNPs with a lower surface-area-to-volume ratio) [31].
We then determined the optimal deposition time by drop-casting 2 μL of 20 nm AuNPs (concentration = 1.4 × 10⁶ particles in 2 μL DI water) on the SPCE and applying a constant voltage of 1.25 V at four different durations (deposition times = 30, 60, 120, 180 s, performed in 50 μL of 0.1 M HCl solution (supporting electrolyte)). We then performed SWV and measured the peak current. The control (blank) consisted of the peak signal from the SPCE when 2 μL DI water (no AuNPs) was drop-casted and subject to different deposition times (30, 60, 120, 180 s, supporting electrolyte = 50 μL of 0.1 M HCl). The rest of the EC parameters were the same as noted above.
DPV was also used for analysis at the optimized AuNP size (20 nm AuNPs) and deposition time (120 s). The DPV settings were as follows: step size = 10 mV, sample period = 0.294 s, pulse size = 50 mV, and pulse time = 0.1 s. DPV was performed at different concentrations of AuNPs in 2 μL of DI water (from D0 = 1.4 × 10⁸ to D3 = 1.4 × 10⁸). The control (blank) consisted of the peak signal when 2 μL of DI water (no AuNPs) was drop-casted on the SPCE (deposition time = 120 s, supporting electrolyte = 50 μL of 0.1 M HCl). For the EC experiments (SWV and DPV), peak current (associated with reducing Au3+ to Au0+) at 0.3 V was measured and recorded. Data were processed using the GraphPad Prism and JMP software (one-way ANOVA, Tukey multiple comparison test). In the figures, an asterisk (*) denotes different probability values as per the GraphPad style (Supporting Information, Table S1). The selection criteria for the optimal nanoparticle diameter included (1) high signal-to-mass ratio and (2) ease of use in antibody conjugation and assay integration.

3.2. ELISA Protocol for the Characterization of SARS-CoV-2 Capture Antibody

ELISA was performed to confirm the affinity of capture antibodies utilized to target the N protein. In total, 100 μL of 2.5 μg/mL S46 anti-SARS-CoV-2 nucleocapsid antibody (in MPBS) was added to each well of the 96-well plate. The plates were then sealed and incubated overnight (16 h) at 4 °C. Subsequently, the plates were incubated at 37 ℃ on a shaking incubator (250 RPM, VorTemp) for 30 min. The plates were then rinsed thrice with 300 μL (422 μL/s, MultiFlo dispenser) of wash buffer. The plates were blocked by adding 200 μL of blocking buffer and incubated at 37 °C on a shaking incubator (250 RPM, VorTemp) for 60 min. Subsequently, the plates were washed thrice with 300 μL of wash buffer. In total, 100 μL of tracer antibody was added to each well, sealed, and incubated at 37 ℃ on the shaking incubator for 2 h. The plates were then rinsed thrice with 300 μL of wash buffer and labeled by adding 100 μL of 1:200 streptavidin-HRP (1% BSA in MPBS) to each well. The plates were then incubated at 37 ℃ for 25 min and rinsed thrice with 300 μL of wash buffer. Finally, 100 μL of 1-Step Ultra TMB-ELISA Substrate Solution was added to each well and incubated at 37 °C for 30 min. The reaction was stopped by adding 50 μL of the stop solution to each well. A standard ELISA plate reader was utilized to measure the absorbance of each well (measured at 450 nm and 630 nm). The absorbance values were normalized with an optical density at 630 nm subtracted from the optical density at 450 nm.

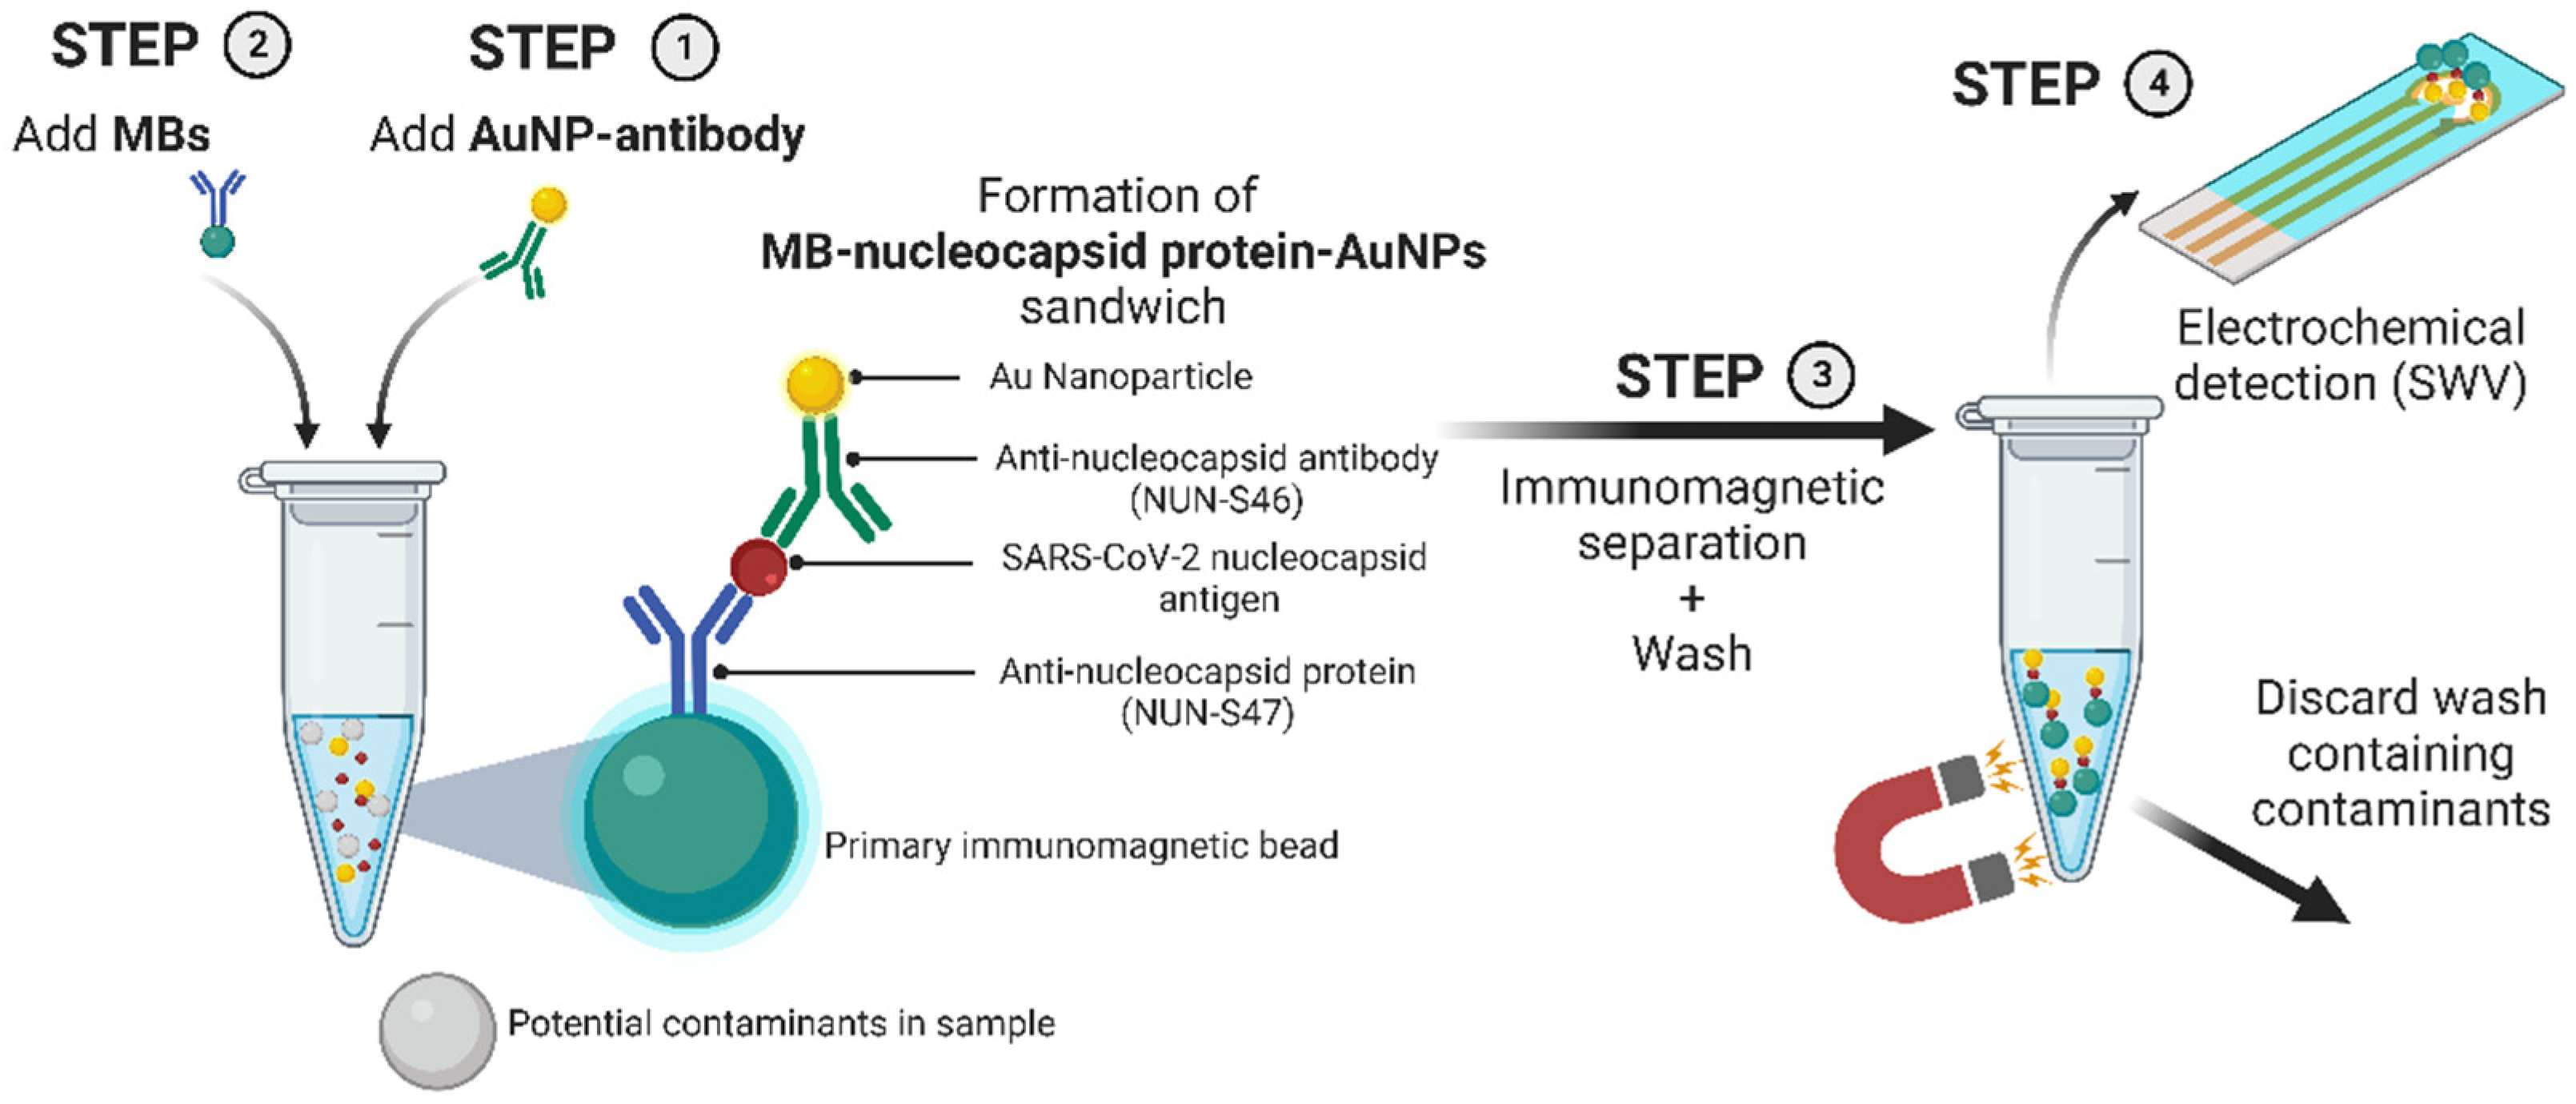
3.3. Immunomagnetic Capture and EC Detection of COVID-19 Nucleocapsid Protein

AuNP conjugation and immunomagnetic capture were performed on different dilutions of SARS-CoV-2 N protein suspended in 500 μL of PBS to determine the analytical sensitivity of the assay. N protein was serially diluted by factors of ten or less to generate concentrations of 10, 5, 2, and 1 ng/mL (control = 0 ng/mL, i.e., PBS).
Next, 15 μL of prepared S46-AuNPs (20 nm AuNPs) and 4 μL of S47-M-280 magnetic particles were added to each aliquot. The samples were then placed on a rotator for 120 min. Samples were then placed on a custom magnetic separation rack for 3 min with a gentle inversion of the tube performed at 90 s. The supernatant was removed, and 1 mL of PBS containing 0.1% Tween 20 was added to each sample tube. The tubes were returned to the rotator for 5 min and again placed on the magnetic separation rack for 3 min with a gentle inversion of the tube performed at 90 s. The supernatant was removed, and 1 mL of PBS was added to each sample tube, followed by a 5 min rotation and magnetic separation, as previously performed. Then, 100 μL of PBS was added to the sample, followed by 20 cycles of gentle pipette mixing.
Samples were electrochemically analyzed in a randomized sequence. In total, 25 μL of each sample (100 μL) was gently pipette mixed with 25 μL of 0.2 M HCl and placed on the SPCE covering all three electrodes. DPV was then performed on each sample (same DPV setting as described in Section 3.1; deposition time = 120 s).

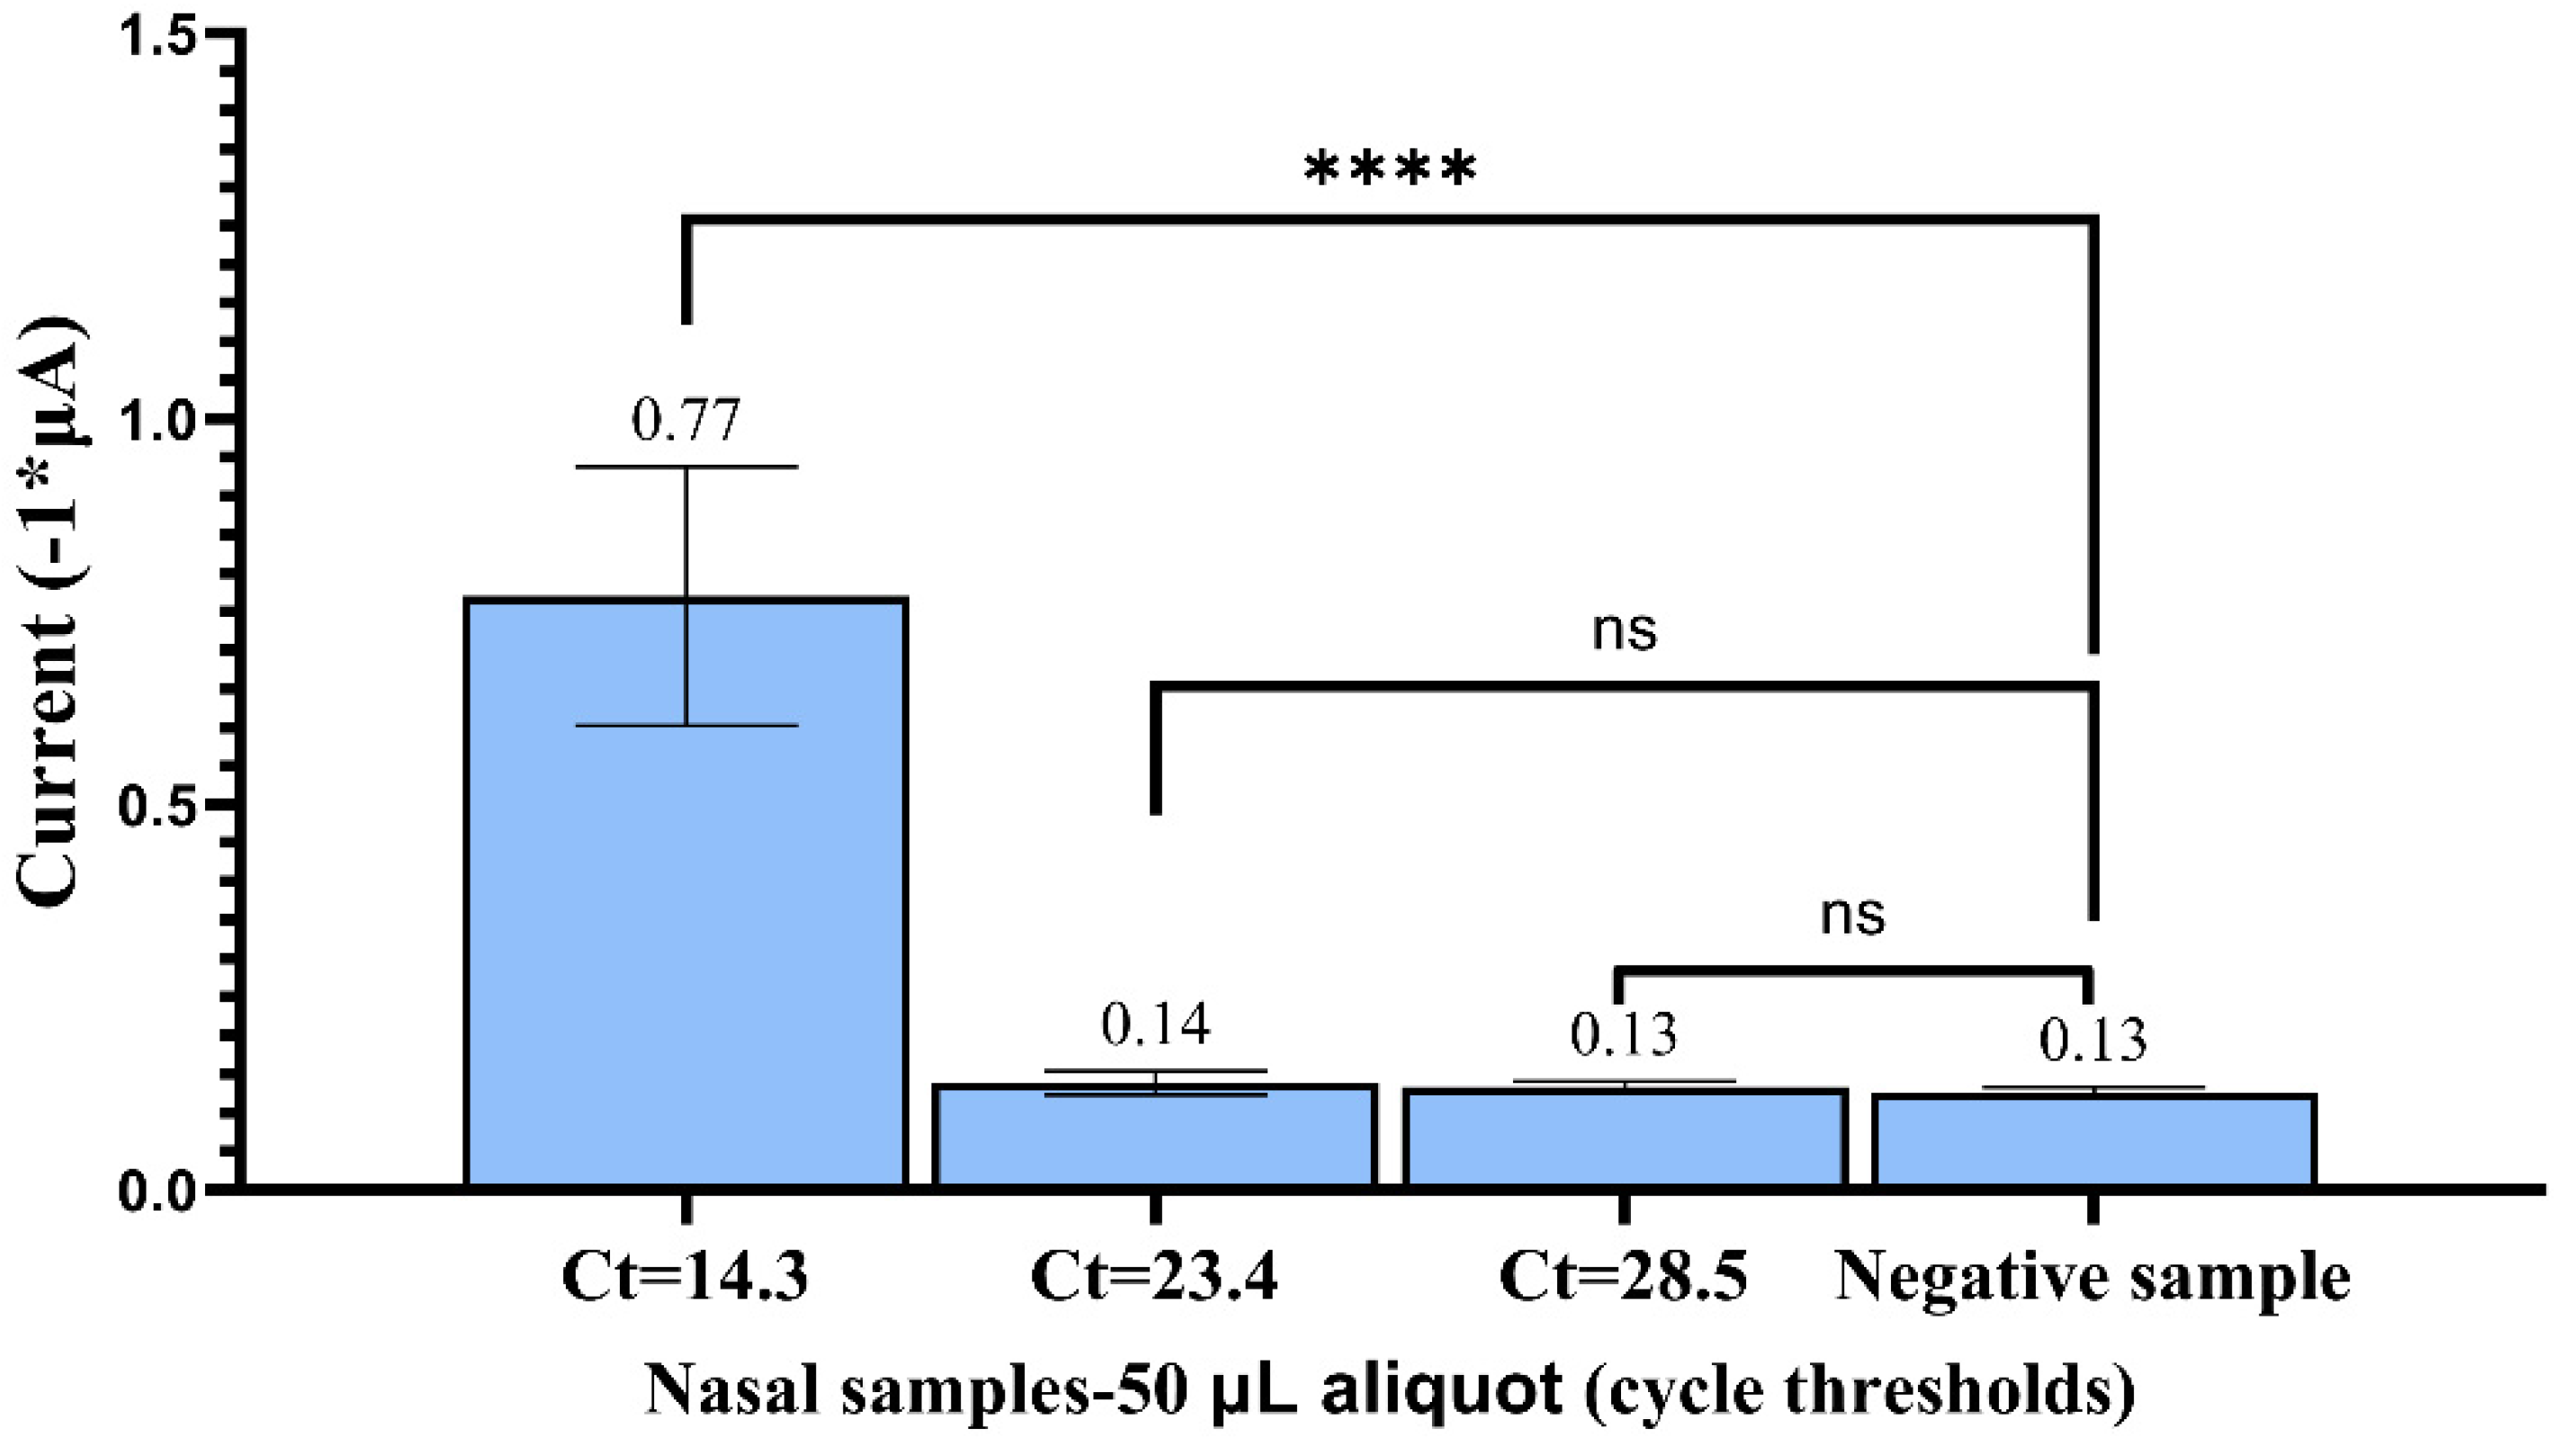
3.4. Immunomagnetic Capture and EC Detection of COVID-19-Positive Human Nasal Samples

All patient samples were handled adhering to Biosafety Level-2 (BSL-2) regulations. Patient samples were gently resuspended by inverting the sample tube ten times. A 50 or 250 μL aliquot was taken from the patient sample. Next, an equivalent volume (50 or 250 μL, respectively) of BinaxNOW extraction reagent was added to each aliquot and placed on the rotator for 10 min. Then, 15 μL of prepared S46-AuNP and 4 μL of S47-M-280 magnetic particles were added to each aliquot and placed on the rotator for 120 min. Subsequent mixing, magnetic separation, washing, resuspension (in 100 μL of PBS), and SWV-based detection (25 μL aliquot) were performed as described in Section 3.3.

4. Results and Discussion

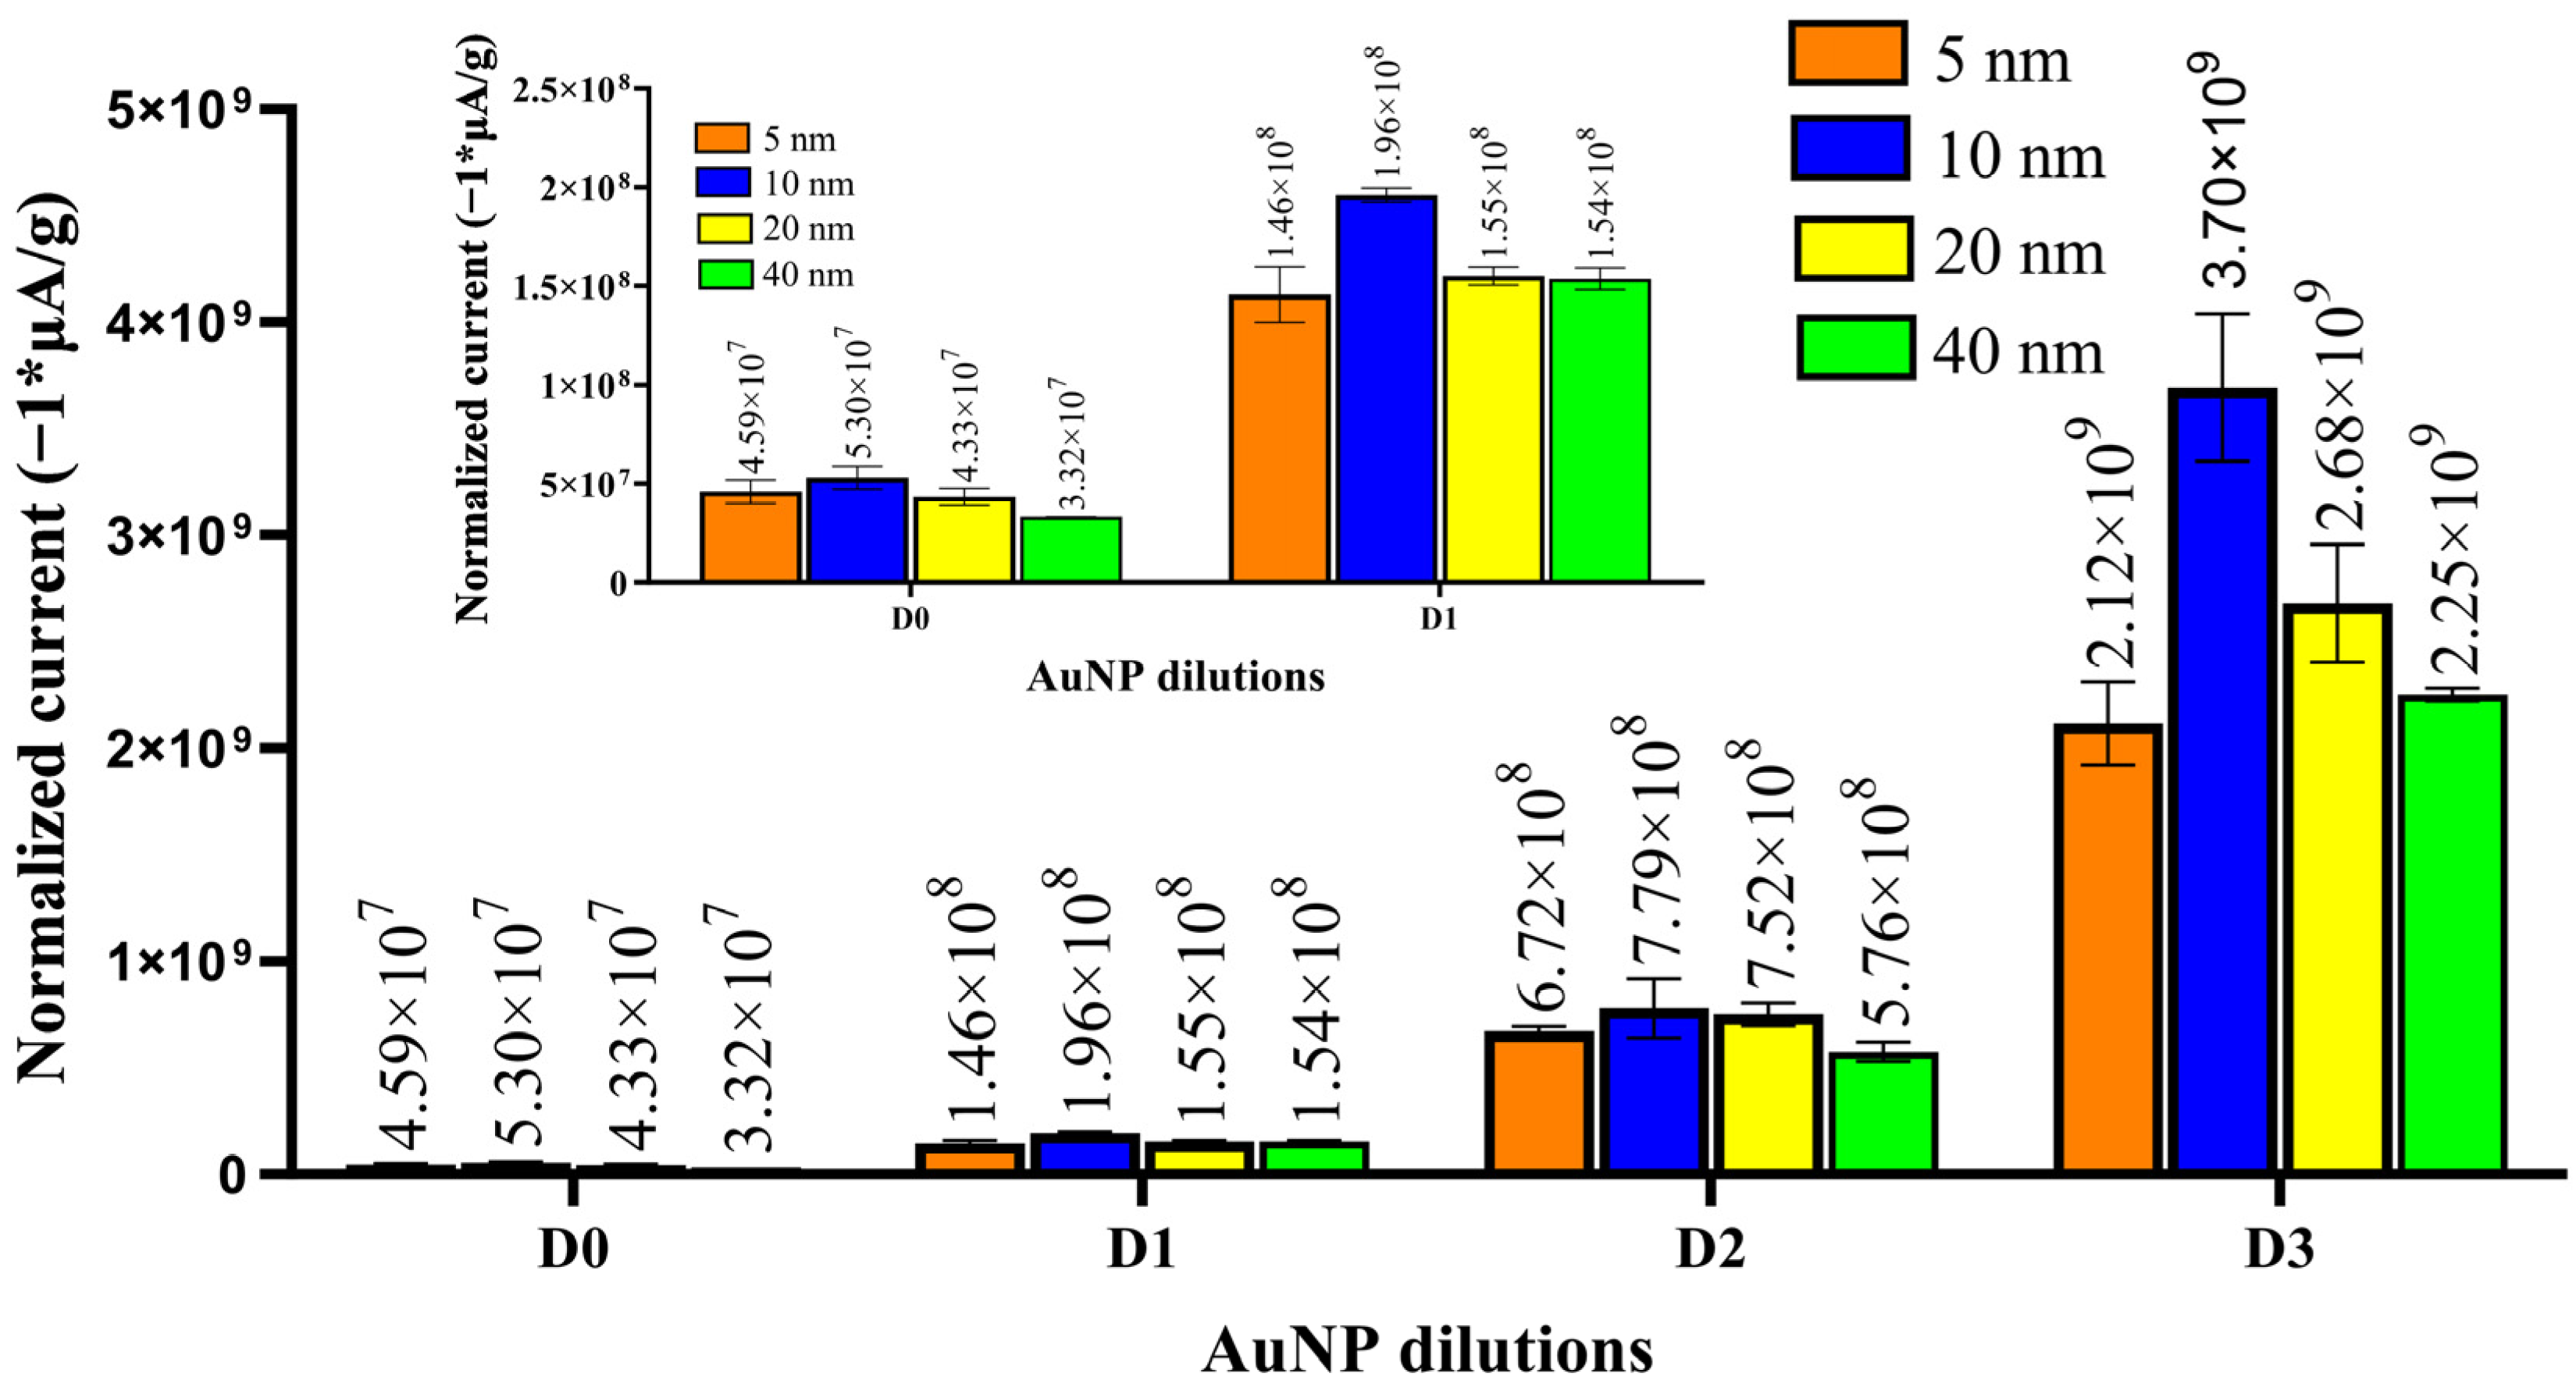
4.1. Optimization of AuNP Size and Deposition Time to Yield Maximum EC Signal

The ideal size for AuNPs was chosen based on two primary factors: the signal-to-mass ratio and the density of antibody conjugation. As the mean diameter of the particles decreases, the ratio of surface-exposed gold atoms to the given mass of gold increases. Theoretically, a higher proportion of surface-exposed gold for a specific mass should facilitate greater electron transfer, leading to an amplified normalized signal.
As shown in Figure 2, 10 nm AuNPs produced the maximum normalized signal for all the dilutions under consideration. The 20 nm AuNPs produced the second-highest normalized signal for the three lower dilutions under consideration (D1, D2, D3). This result is expected given the relative increase in surface area to mass as the diameter of the particle decreases. However, the smallest particle diameter, 5 nm AuNPs, with the highest surface-to-volume ratio, did not yield the highest normalized signal as expected. This was previously observed by de la Escosura-Muñiz et al. and attributed to the Brownian effects governing smaller particles [32].
The rationale for selecting the 20 nm AuNPs and not the particles with the largest EC signal, the 10 nm AuNPs, was due to the antibody conjugation density and ease of conjugation. Our detection assay’s effectiveness depends on the number of IgG antibodies that can conjugate to AuNPs. Previous experimental studies have shown that ~3 antibodies conjugate to a single 20 nm diameter AuNP using our conjugation process [33]. We argue that the number of attached antibodies would be even lower for 10 nm AuNPs (given the jamming limit) [33]. This work also predicts that the conjugation of antibodies to 10 nm and 5 nm AuNPs will be 0.88 and 0.22, respectively (see Supporting Information), and insufficient for reliable labeling [33]. For these reasons, we selected the 20 AuNP as the most ideal for electrochemical labeling in our system.
It was important to determine the optimal deposition time for the 20 nm AuNPs. Numerous factors can influence the optimal deposition time for an EC system. Through empirical testing, we observed that increased deposition times resulted in increased noise. As shown in Figure S2, the highest peak current was observed at 180 s. However, the blank signal also increased when the deposition time increased (observed to be highest at 300 s). This was possibly due to the supporting electrolyte (0.1 M HCl) affecting the carbon or reference electrodes over time [34]. The ΔSignal illustrates the combined influence of the increased deposition time with the increase in noise. The ΔSignal for the 120 and 180 s deposition times had similar values (0.60 and 0.62 μA, respectively). Hence, we chose the lower duration, viz—120 s, as the optimum deposition time.
Figure 3 shows the absolute EC signal (DPV) from various dilutions (D0 to D3) of 20 nm AuNPs. The lowest signal that could be detected was at D2, which was 30% higher than the blank signal. However, ANOVA shows that the signal at D2 was not statistically significant vs. the blank (p-value = 0.558). The D1 signal was statistically significant compared with the blank (p-value = 0.0027). We also generated a calibration curve (Inset Figure 3). The curve was observed to be linear in the range of D3 = 1.4 × 10⁵ to D1 = 1.4 × 10⁷ (AuNPs in 2 μL of DI water) with the regression equation y = 1.069 × 10 8   x + 0.3225 ( R 2 = 0.99 , where y is the absolute DPV peak current in μA, and x is the AuNP dilution). The limit of detection (LOD) was equal to 9 × 10 6 AuNPs (in a 2 μL volume). The LOD was calculated as 3.3*(σ/S), where σ is the standard deviation of the regression line, and S is the slope of the calibration curve. The LOD represents the lowest absolute number of 20 nm AuNPs we can detect (on a 3 mm dia. SPCE under given DPV parameters). The LOD also represents the best-case scenario for detecting an analyte on a 3 mm SPCE under our experimental parameters (assuming a near or one-to-one binding of the analyte to an AuNP).

4.2. Validation of SARS-CoV-2 Nucleocapsid Protein Binding to Anti-SARS-CoV-2 Nucleocapsid Antibody Utilizing ELISA

Of the four structural proteins comprising SARS-CoV-2, the spike and nucleocapsid proteins are particularly interesting in viral detection. The spike protein was identified early in the 2019 coronavirus pandemic as a potential viral target. As research on the virus progressed, an RNA-binding protein responsible for genome packaging known as the N protein was identified as one of the most abundant proteins in the virions [35]. The N protein was reported to be of potentially more significant interest as a viral target than the spike protein [36]. This protein has been well characterized by others [37,38]. As per the ELISA data (Figure S3) provided by the manufacturer (ACROSBiosystems), the anti-SARS-CoV-2 capture antibodies used in our work (S46 and S47) exhibited minimal cross-reactivity with the nucleocapsid proteins of other coronaviruses (MERS, HCoV-229E, HCoV-NL63, and HCoV-OC43) [39,40]. The limit of detection (LOD = 3.3σ/S) for the nucleocapsid protein in the ELISA was determined to be 0.075 ng/mL. A plot of this data is shown in Figure S4.

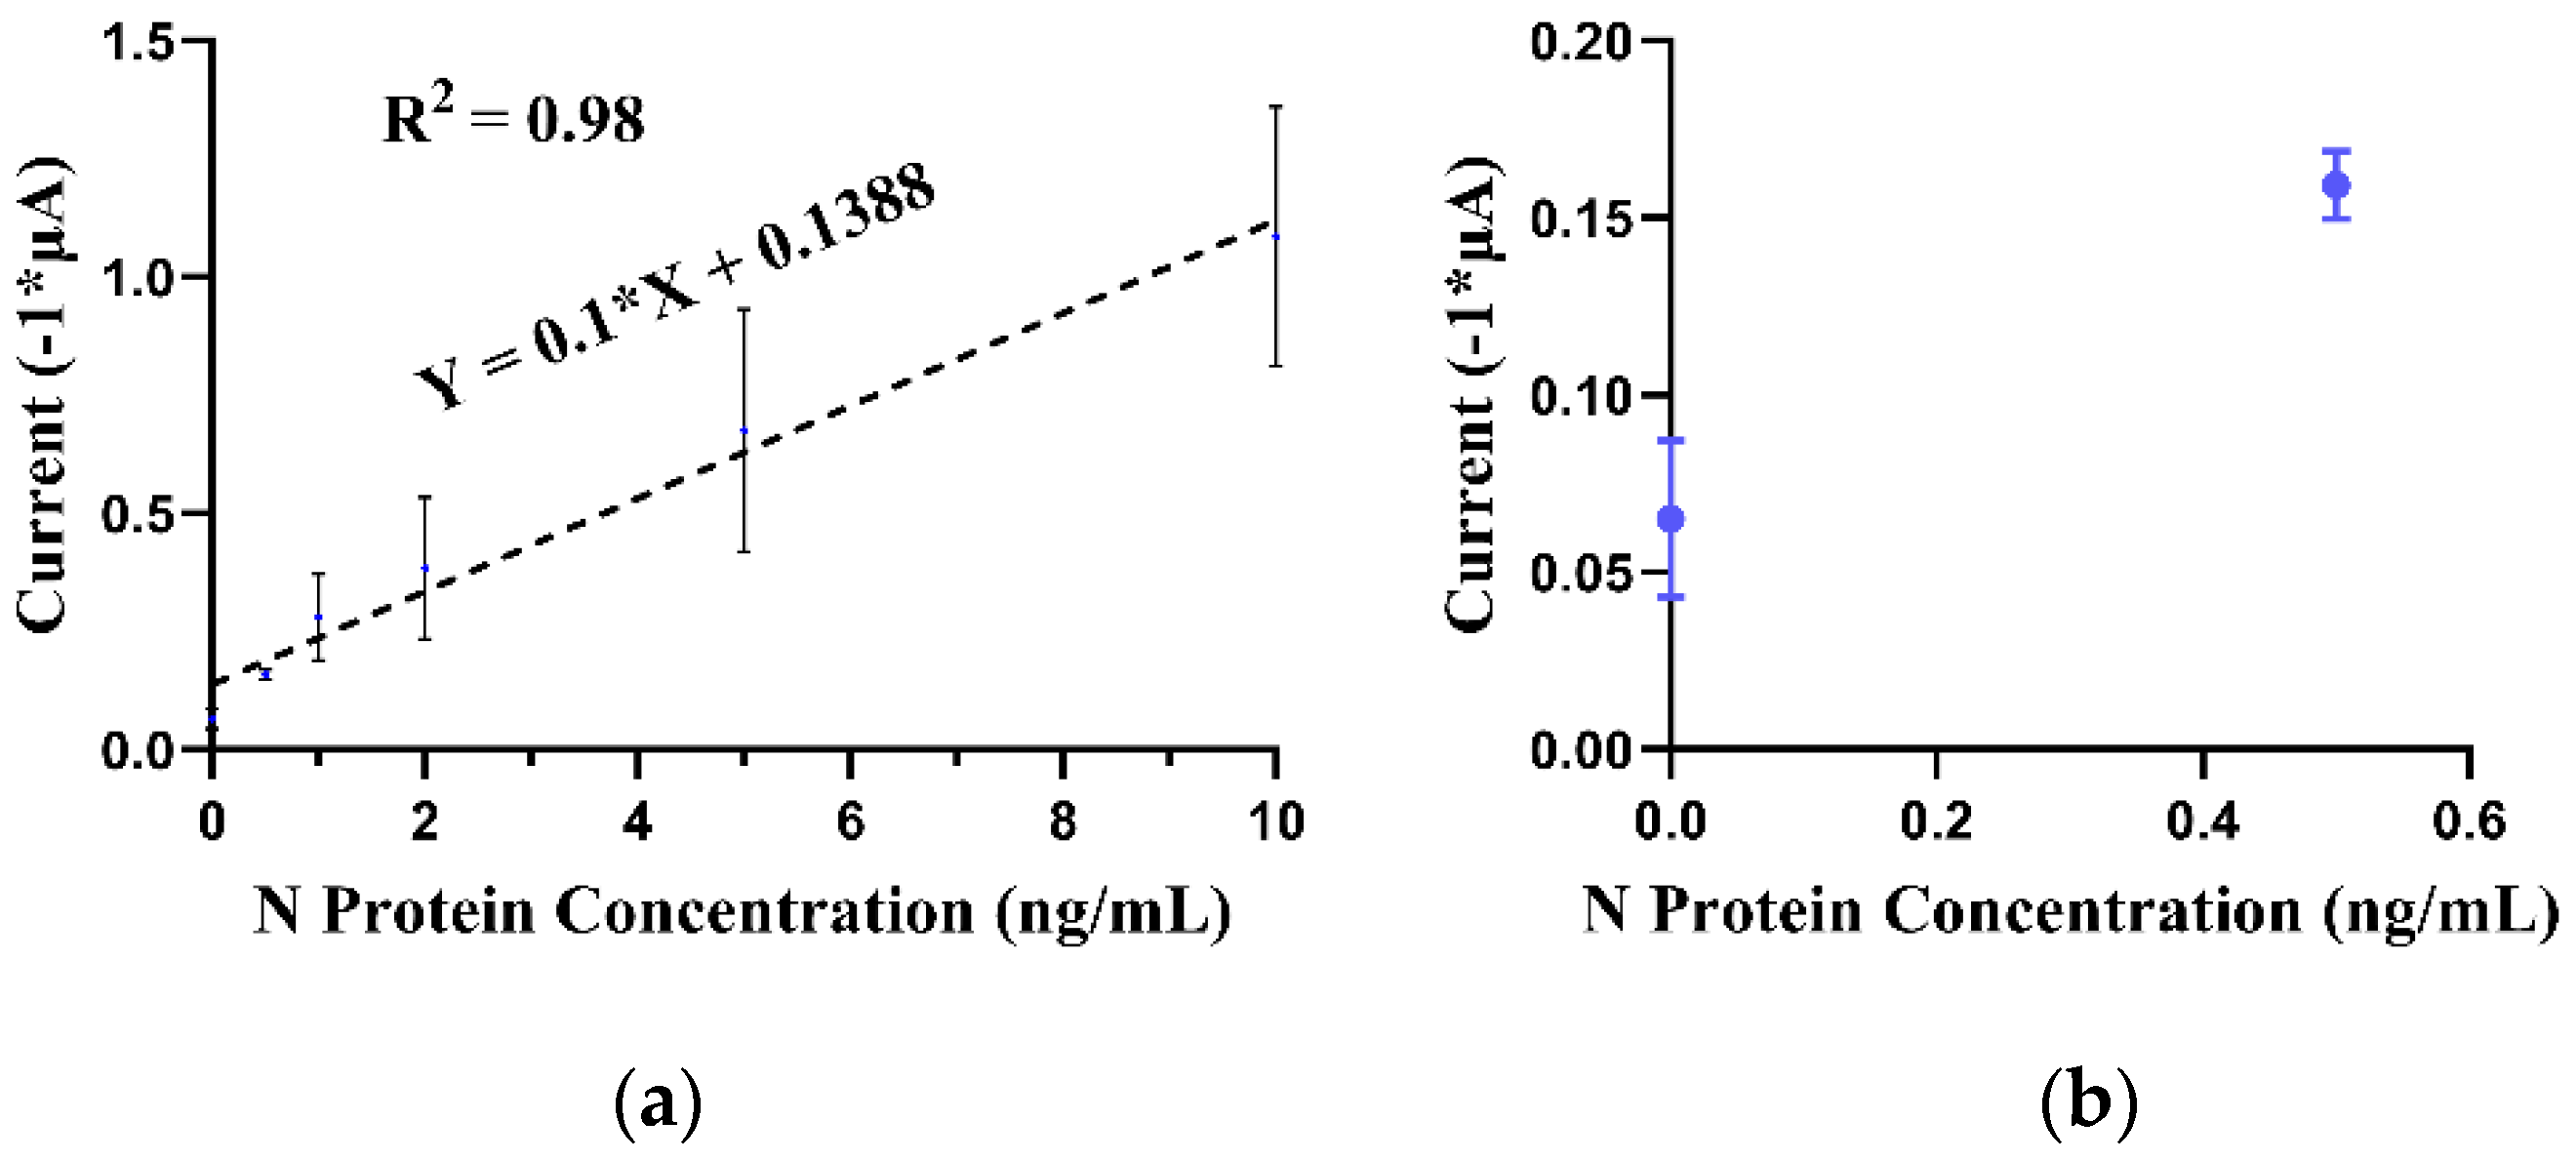
4.3. Analytical Sensitivity of the Assay for the Detection of SARS-CoV-2 Nucleocapsid Protein in PBS

Analytical sensitivity refers to the ability of an assay to detect the smallest amount of a target analyte, in this case, the SARS-CoV-2 nucleocapsid protein [21]. The assay’s performance in detecting different concentrations of SARS-CoV-2 N protein in PBS was evaluated. As described in Section 3.3, AuNP conjugation and immunomagnetic capture were performed on different concentrations of SARS-CoV-2 N protein suspended in 500 μL of PBS (ranging from 1 to 10 ng/mL). Figure 4 shows that a linear calibration plot was observed in the 1–10 ng/mL range with a regression equation: y = 0.1   x + 0.1388 ( R 2 = 0.98 ). The calculated LOD was 2.64 ng/mL (calculated as LOD = 3.3 (σ/S), where σ is the standard deviation of the calibration curve, and S is the slope of the calibration curve). The 0 ng/mL blank control provided a peak current of 0.065 μA. This signal corresponds to AuNP conjugation and immunomagnetic capture performed on 500 μL of PBS (no analyte present). While we observed large standard deviations in our current results (as seen in Figure 4), we recognize the importance of assay precision. To address this and further validate our findings, we plan to conduct a spike-recovery test in subsequent studies. Our current assay comprises a 120 min incubation period, followed by a cumulative washing duration of 19 min and a 2 min electrochemical signal acquisition. The overall duration of the entire procedure is approximately 141 min. Table 1 lists the performance of EC immunoassays that utilize separation with immunomagnetic particles (either antibody- or peptide-conjugated) and an EC tag for the detection of SARS-CoV-2. Our LOD is comparable [41] or better [13] than the results described in the literature. Malla et al. utilized peroxidase-loaded magnetic beads to capture and detect the spike protein of COVID-19 in serum, urine, and saliva. The study utilized human samples spiked with different concentrations (3.12–200 ng/mL) of SARS-CoV-2 spike protein and did not utilize the study on actual clinical samples [41]. Fabiani et al. developed an EC immunoassay for N protein using primary-antibody-conjugated MBs and a secondary phosphatase EC tag. The device provided a LOD of 10 ng/mL and was utilized to detect N protein in SARS-CoV-2-positive human saliva samples [13]. An EC immunoassay utilizing peptide-conjugated MBs and a secondary AuNP EC tag was utilized by Nascimento et al. for the detection of the spike protein of SARS-CoV-2 in clinical saliva samples. The assay reported a LOD of 0.35 ag/mL spike protein in saliva. This is about ten orders of magnitude better than what is currently reported in the literature (Table 1). A LOD of 0.35 ag/mL for the spike protein, using a 50 µL aliquot (used in the study) and a 3 mm working electrode dia., translates into the detection of less than one AuNP (20 nm) on a given SPCE (see Supporting Information). We observed a LOD of 2.8 × 10 6 (20 nm) for bare, immobilized AuNPs on the working electrode of the SPCE. A recent study reported a LOD of 6.1 × 10 3 (60 nm) for AuNPs on an SPCE (2.64 mm2 geometric working electrode area) [42]. We were not able to replicate the same result observed by Nascimento et al. with similar equipment, and the reason for this greatly enhanced performance is not obvious based on our current knowledge.

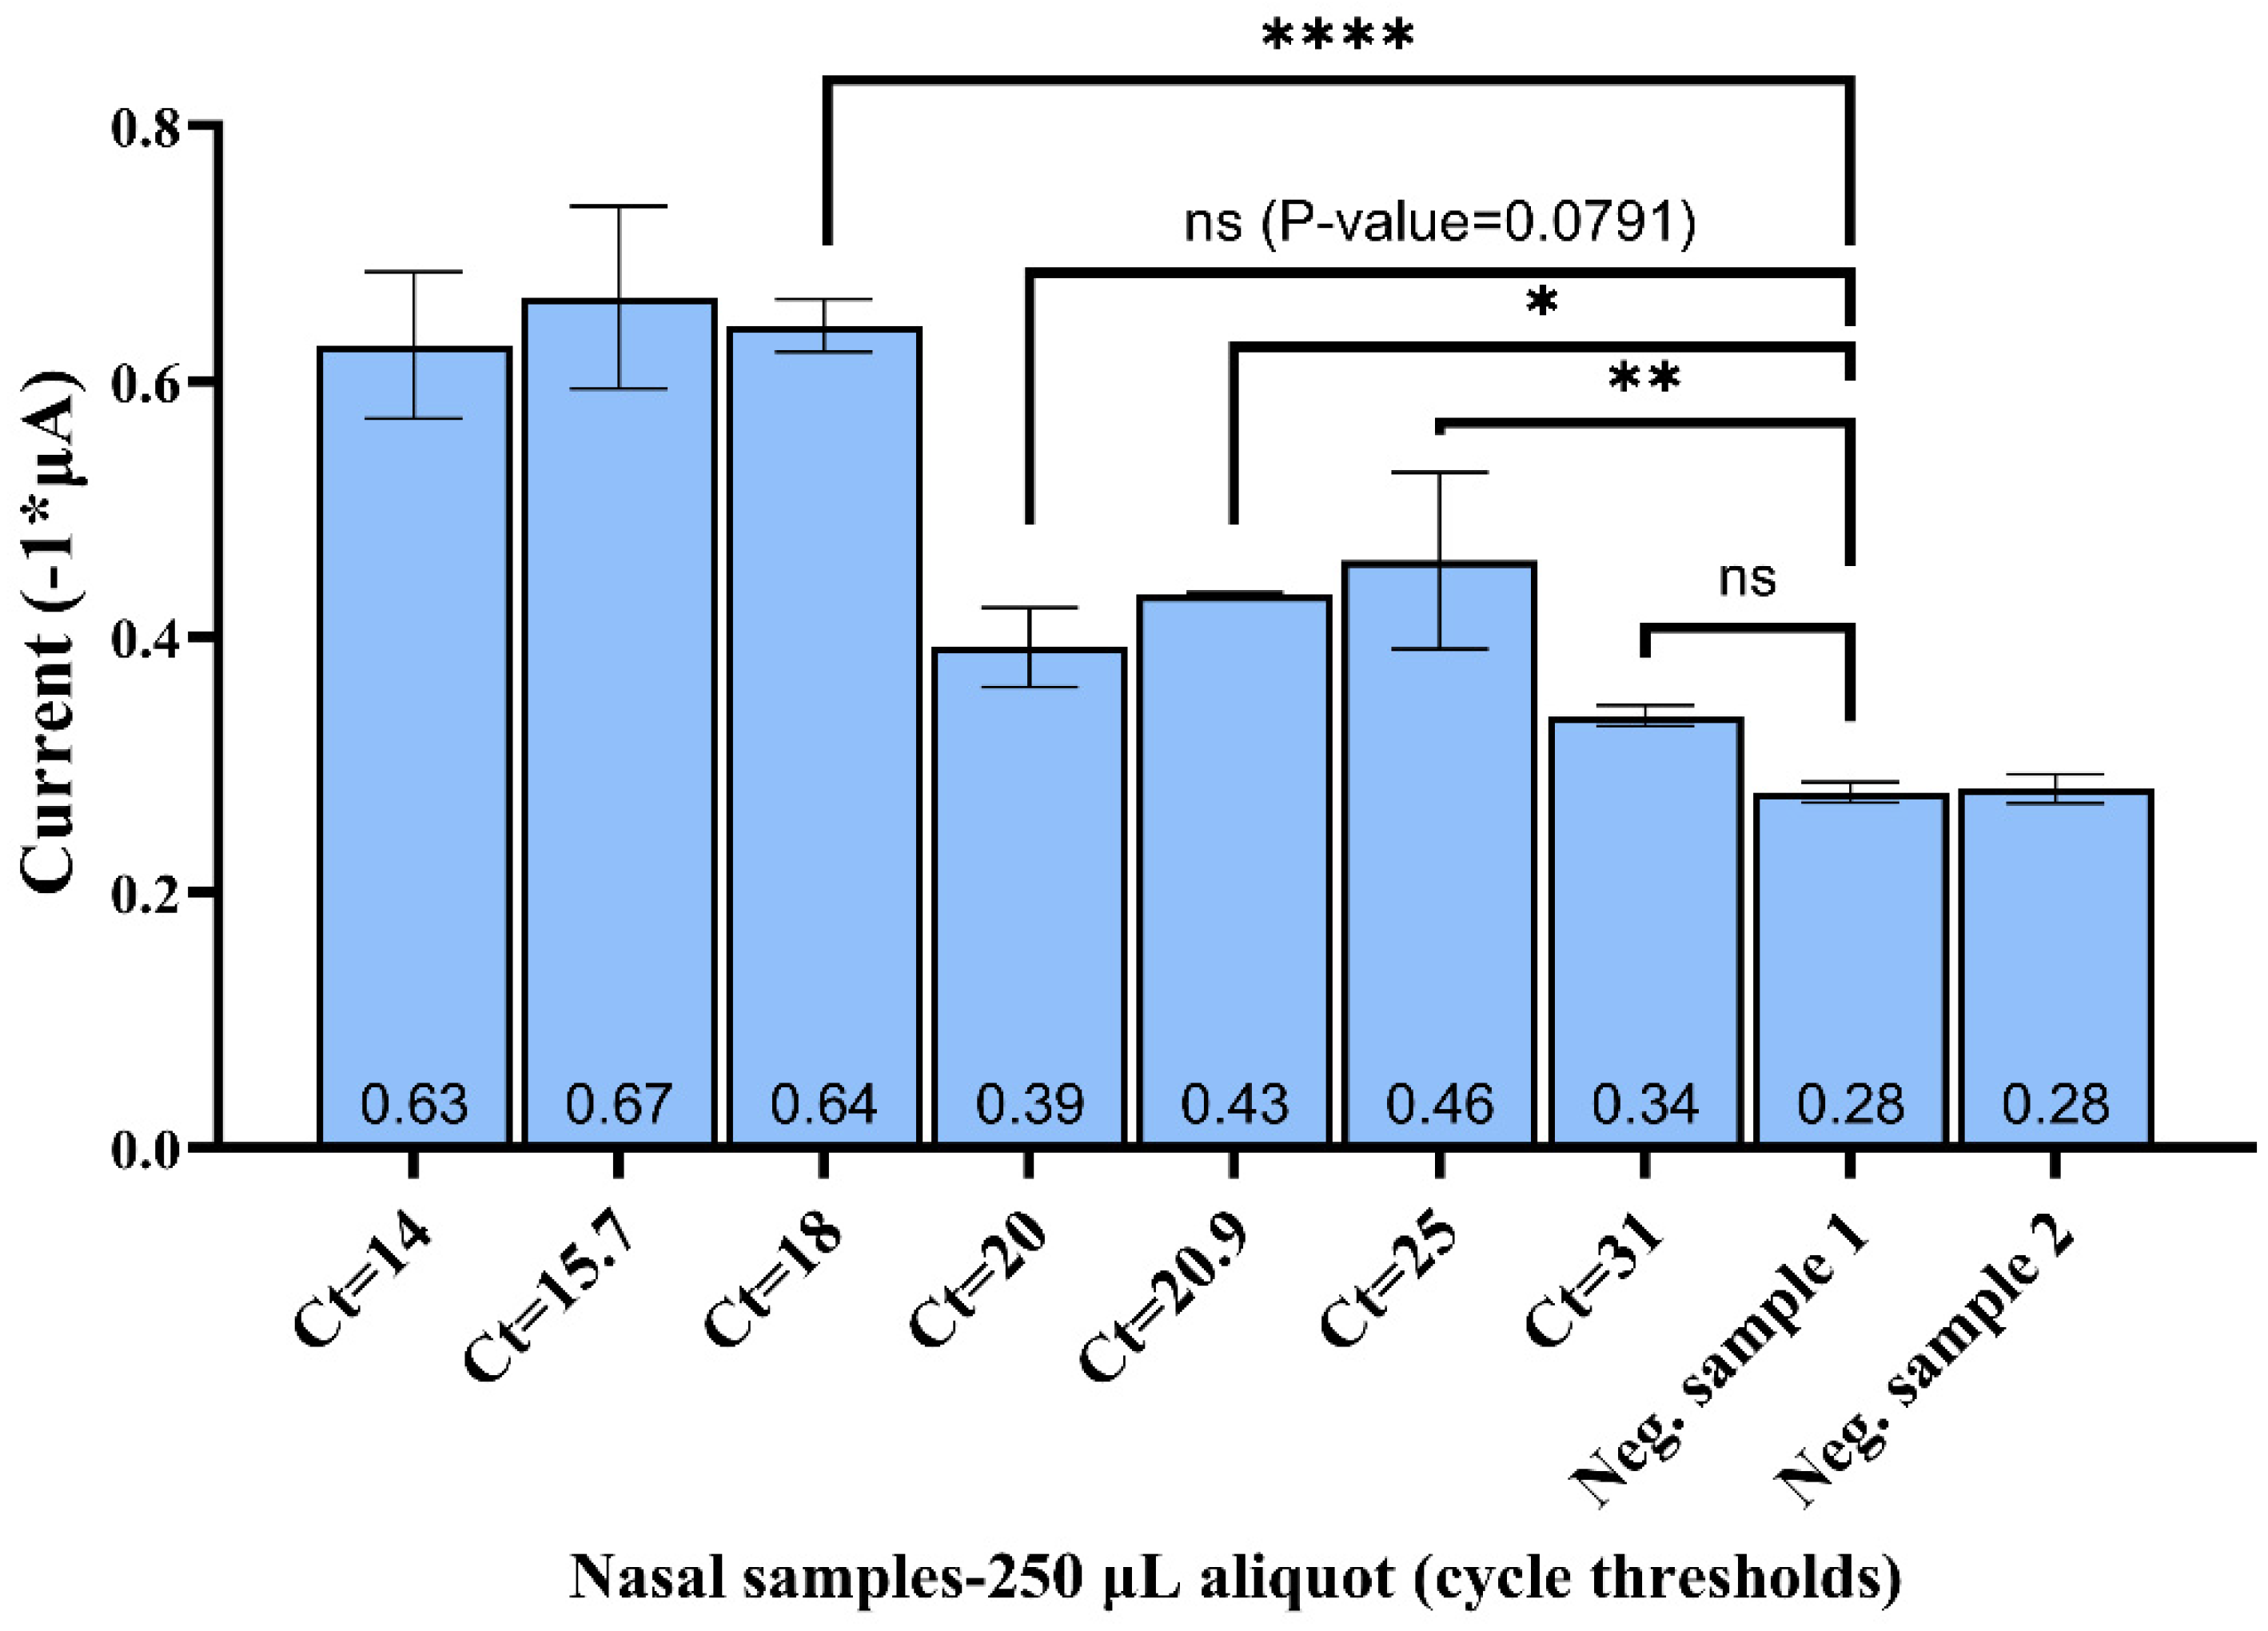
4.4. Detection of SARS-CoV-2 in Clinical Samples

The clinical sensitivity of the assay for detecting SARS-CoV-2 in nasal samples was evaluated. The assay was able to detect SARS-CoV-2-positive samples with cycle thresholds (Ct) of up to 14.3 with statistical significance (p-value < 0.0001 vs. negative sample; one-way ANOVA) (Figure 5). However, the signals for Ct = 23.4 and Ct = 28.5 were not statistically significant (p-values = 0.9980 and 0.9997, respectively, vs. negative sample; one-way ANOVA). We hypothesized that by utilizing a larger-volume aliquot of the nasal sample, we could utilize the MB-based preconcentration to increase the clinical sensitivity of our assay. Hence, we repeated the assay on a 250 μL aliquot (out of the 1 mL nasal samples) and performed EC (DPV) detection. One of the key advantages of immunomagnetic separation over the BinaxNow and similar lateral flow detection mechanisms is the volumetric range that the assay can intake. The BinaxNow detection kit is limited to a sample volume equal to that captured by the nasal swab, which is approximately 50 μL. Using immunomagnetic separation, our assay can reasonably intake up to 500 μL of the sample input. Increased sample intake increases the total amount of analyte and consequently improves the LOD.
Figure 6 shows that the peak currents associated with all the positive samples tested were above those of the negative samples. The assay detected SARS-CoV-2-positive samples with a viral load down to Ct = 25 with statistical significance (p-value < 0.0001 vs. negative sample 1). The peak current associated with Ct = 31 was 21% higher than that for negative samples. However, this difference was not statistically significant (p-value = 0.0976 vs. negative sample 1). It is important to note that we achieved an improved LOD by increasing the sample aliquot from 50 to 250 μL. For nasal samples, the swabs were placed in 1 mL of viral transport media for SARS-CoV-2 commercial PCR assays [43]. Hence, by utilizing a larger sample volume (volumes higher than the 250 μL used in our study) for the MB preconcentration, the assay can, in principle, achieve increased sensitivity. Alternatively, the modification of the collection protocol by reducing the initial sample dilution volume from 1 mL to 250 μL could further improve the clinical sensitivity. The future integration and automation of various steps described in this work utilizing microfluidic devices can lead to the assay being run at the point-of-care [44,45].

5. Conclusions

We described an EC immunosensor for detecting SARS-CoV-2 via the detection of the N protein in nasal samples. The detection utilizes the immunomagnetic capture of SARS-CoV-2 N protein from nasal samples and a second antibody conjugated to 20 nm AuNPs as the EC label. The LOD for the drop-cast bare AuNPs on the electrode under the same EC conditions was determined to be 9 × 10 6 AuNPs. We believe this represents the lowest LOD possible for non-aggregated N protein bound in a one-to-one ratio with AuNPs. We used ELISA to confirm the sensitivity of the SARS-CoV-2 N protein. We optimized the size of the AuNPs used and the deposition time. We determined that a deposition time of 120 s was the most ideal for this EC system. Immunomagnetic capture of SARS-CoV-2 N protein from infected nasal samples and subsequent EC detection using AuNP labels were demonstrated using human patient samples with PCR detection values as high as 25 Ct. As part of our future research endeavors, we plan to conduct comprehensive specificity tests to ensure the robustness and reliability of our approach. To the best of our knowledge, this is the first instance of combining immunomagnetic separation with EC secondary bead-based tags (AuNPs) utilized for the EC detection of SARS-CoV-2 in nasal samples on an unmodified SPCE. Future efforts will focus on automating and integrating the various processes in our assay into a point-of-care platform.

Supplementary Materials

The following supporting information can be downloaded at https://www.mdpi.com/article/10.3390/app131810007/s1. References [17,33,46] are cited in the supplementary materials.

Author Contributions

C.J.L. and H.J. contributed equally to this paper. Conceptualization, C.J.L., H.J., D.P., B.K.G. and H.J.S.; methodology, C.J.L., H.J., D.P., B.K.G. and H.J.S.; validation, C.J.L., H.J., D.P., L.B.L., B.K.G. and H.J.S.; formal analysis, C.J.L., H.J. and D.P.; investigation, C.J.L., D.P, L.B.L., M.H. and T.M.; resources, L.B.L. and H.J.S.; data curation, C.J.L., H.J. and D.P.; writing—original draft preparation, C.J.L. and H.J.; writing—review and editing, C.J.L., H.J, D.P, B.K.G. and H.J.S.; visualization, C.J.L., H.J., D.P. and L.B.L.; supervision, B.K.G. and H.J.S.; project administration, B.K.G. and H.J.S.; funding acquisition, H.J.S. All authors have read and agreed to the published version of the manuscript.

Funding

This research was partially funded by the Department of Defense Phase II Small Business Innovation Research, USA, contract W911QY-17-C-0032, and the Department of Defense Phase II Sequential Small Business Innovation Research, USA, contract W911QY-20-C-0061, USA, to Espira Inc. and through the Special Emphasis: Emerging COVID-19/SARS-CoV-2 Research seed grant program to Laurentius from the Immunology, Inflammation and Infectious Diseases (3i) Initiative and the Office of the Vice President for Research, University of Utah, USA.

Institutional Review Board Statement

Not applicable.

Informed Consent Statement

Informed consent was obtained from all subjects involved in the study.

Data Availability Statement

The data presented in this study are available on request from the corresponding author.

Acknowledgments

The authors acknowledge support from the Immunology, Inflammation, and Infectious Disease (3i) Initiative and the Office of the Vice President for Research at the University of Utah. Deidentified patient samples were graciously provided by Kimberly Hanson and Salika Shakir (Department of Pathology, Division of Clinical Microbiology, University of Utah, and ARUP Laboratories).

Conflicts of Interest

Bruce K. Gale and Himanshu J. Sant have a financial interest in Espira Inc. (Salt Lake City, UT, USA). All conflicts are managed by the University of Utah Conflict of Interest Committee. The funders had no role in the design of the study; in the collection, analyses, or interpretation of the data; in the writing of the manuscript; or in the decision to publish the results.

References

  1. World Health Organization. WHO Coronavirus (COVID-19) Dashboard. Available online: https://covid19.who.int/ (accessed on 1 January 2023).
  2. Batista, C.; Hotez, P.; Ben Amor, Y.; Kim, J.H.; Kaslow, D.; Lall, B.; Ergonul, O.; Figueroa, J.P.; Gursel, M.; Hassanain, M.; et al. The silent and dangerous inequity around access to COVID-19 testing: A call to action. eClinicalMedicine 2022, 43, 101230. [Google Scholar] [CrossRef] [PubMed]
  3. U.S. Food and Drug Administration. Coronavirus (COVID-19) Update: FDA Authorizes Additional Oral Antiviral for Treatment of COVID-19 in Certain Adults. December 2021. Available online: https://www.fda.gov/news-events/press-announcements/coronavirus-covid-19-update-fda-authorizes-additional-oral-antiviral-treatment-covid-19-certain (accessed on 27 October 2022).
  4. Brendish, N.J.; Poole, S.; Naidu, V.V.; Mansbridge, C.T.; Norton, N.J.; Wheeler, H.; Presland, L.; Kidd, S.; Cortes, N.J.; Borca, F.; et al. Clinical impact of molecular point-of-care testing for suspected COVID-19 in hospital (COV-19POC): A prospective, interventional, non-randomised, controlled study. Lancet Respir. Med. 2020, 8, 1192–1200. [Google Scholar] [CrossRef] [PubMed]
  5. Whitley, R. Molnupiravir—A Step toward Orally Bioavailable Therapies for COVID-19. N. Engl. J. Med. 2022, 386, 592–593. [Google Scholar] [CrossRef] [PubMed]
  6. Benda, A.; Zerajic, L.; Ankita, A.; Cleary, E.; Park, Y.; Pandey, S. COVID-19 Testing and Diagnostics: A Review of Commercialized Technologies for Cost, Convenience and Quality of Tests. Sensors 2021, 21, 6581. [Google Scholar] [CrossRef]
  7. Filchakova, O.; Dossym, D.; Ilyas, A.; Kuanysheva, T.; Abdizhamil, A.; Bukasov, R. Review of COVID-19 testing and diagnostic methods. Talanta 2022, 244, 123409. [Google Scholar] [CrossRef] [PubMed]
  8. Kaya, H.O.; Cetin, A.E.; Azimzadeh, M.; Topkaya, S.N. Pathogen detection with electrochemical biosensors: Advantages, challenges and future perspectives. J. Electroanal. Chem. 2021, 882, 114989. [Google Scholar] [CrossRef]
  9. Ronkainen, N.J.; Halsall, H.B.; Heineman, W.R. Electrochemical biosensors. Chem. Soc. Rev. 2010, 39, 1747. [Google Scholar] [CrossRef]
  10. Arduini, F.; Micheli, L.; Moscone, D.; Palleschi, G.; Piermarini, S.; Ricci, F.; Volpe, G. Electrochemical biosensors based on nanomodified screen-printed electrodes: Recent applications in clinical analysis. TrAC Trends Anal. Chem. 2016, 79, 114–126. [Google Scholar] [CrossRef]
  11. Burlage, R.S.; Tillmann, J. Biosensors of bacterial cells. J. Microbiol. Methods 2017, 138, 2–11. [Google Scholar] [CrossRef]
  12. Afonso, A.S.; Pérez-López, B.; Faria, R.C.; Mattoso, L.H.; Hernández-Herrero, M.; Roig-Sagués, A.X.; Costa, M.M.-D.; Merkoçi, A. Electrochemical detection of Salmonella using gold nanoparticles. Biosens. Bioelectron. 2013, 40, 121–126. [Google Scholar] [CrossRef]
  13. Fabiani, L.; Fabiani, L.; Saroglia, M.; Saroglia, M.; Galatà, G.; Galatà, G.; De Santis, R.; De Santis, R.; Fillo, S.; Fillo, S.; et al. Magnetic beads combined with carbon black-based screen-printed electrodes for COVID-19: A reliable and miniaturized electrochemical immunosensor for SARS-CoV-2 detection in saliva. Biosens. Bioelectron. 2021, 171, 112686. [Google Scholar] [CrossRef]
  14. Katz, E. Synthesis, Properties and Applications of Magnetic Nanoparticles and Nanowires—A Brief Introduction. Magnetochemistry 2019, 5, 61. [Google Scholar] [CrossRef]
  15. Smith, J.E.; Sapsford, K.E.; Tan, W.; Ligler, F.S. Optimization of antibody-conjugated magnetic nanoparticles for target preconcentration and immunoassays. Anal. Biochem. 2011, 410, 124–132. [Google Scholar] [CrossRef] [PubMed]
  16. Jayamohan, H.; Gale, B.; Minson, B.; Lambert, C.; Gordon, N.; Sant, H. Highly Sensitive Bacteria Quantification Using Immunomagnetic Separation and Electrochemical Detection of Guanine-Labeled Secondary Beads. Sensors 2015, 15, 12034–12052. [Google Scholar] [CrossRef]
  17. Nascimento, E.D.; Fonseca, W.T.; de Oliveira, T.R.; de Correia, C.R.; Faça, V.M.; de Morais, B.P.; Silvestrini, V.C.; Pott-Junior, H.; Teixeira, F.R.; Faria, R.C. COVID-19 diagnosis by SARS-CoV-2 Spike protein detection in saliva using an ultrasensitive magneto-assay based on disposable electrochemical sensor. Sens. Actuators B Chem. 2022, 353, 131128. [Google Scholar] [CrossRef] [PubMed]
  18. Karakuş, E.; Erdemir, E.; Demirbilek, N.; Liv, L. Colorimetric and electrochemical detection of SARS-CoV-2 spike antigen with a gold nanoparticle-based biosensor. Anal. Chim. Acta 2021, 1182, 338939. [Google Scholar] [CrossRef]
  19. Kumar, N.; Shetti, N.P.; Jagannath, S.; Aminabhavi, T.M. Electrochemical sensors for the detection of SARS-CoV-2 virus. Chem. Eng. J. 2022, 430, 132966. [Google Scholar] [CrossRef]
  20. Madhurantakam, S.; Muthukumar, S.; Prasad, S. Emerging Electrochemical Biosensing Trends for Rapid Diagnosis of COVID-19 Biomarkers as Point-of-Care Platforms: A Critical Review. ACS Omega 2022, 7, 12467–12473. [Google Scholar] [CrossRef]
  21. Jayamohan, H.; Lambert, C.J.; Sant, H.J.; Jafek, A.; Patel, D.; Feng, H.; Beeman, M.; Mahmood, T.; Nze, U.; Gale, B.K. SARS-CoV-2 pandemic: A review of molecular diagnostic tools including sample collection and commercial response with associated advantages and limitations. Anal. Bioanal. Chem. 2021, 413, 49–71. [Google Scholar] [CrossRef]
  22. At-Home OTC COVID-19 Diagnostic Tests|FDA. Available online: https://www.fda.gov/medical-devices/coronavirus-covid-19-and-medical-devices/home-otc-covid-19-diagnostic-tests (accessed on 13 April 2023).
  23. Barlev-Gross, M.; Weiss, S.; Ben-Shmuel, A.; Sittner, A.; Eden, K.; Mazuz, N.; Glinert, I.; Bar-David, E.; Puni, R.; Amit, S.; et al. Spike vs nucleocapsid SARS-CoV-2 antigen detection: Application in nasopharyngeal swab specimens. Anal. Bioanal. Chem. 2021, 413, 3501–3510. [Google Scholar] [CrossRef]
  24. Bar-On, Y.M.; Flamholz, A.; Phillips, R.; Milo, R. SARS-CoV-2 (COVID-19) by the numbers. eLife 2020, 9, e57309. [Google Scholar] [CrossRef] [PubMed]
  25. García, M.B.G.; García, A.C. Adsorptive stripping voltammetric behaviour of colloidal gold and immunogold on carbon paste electrode. Bioelectrochem. Bioenerg. 1995, 38, 389–395. [Google Scholar] [CrossRef]
  26. Dequaire, M.; Degrand, C.; Limoges, B. An Electrochemical Metalloimmunoassay Based on a Colloidal Gold Label. Anal. Chem. 2000, 72, 5521–5528. [Google Scholar] [CrossRef]
  27. Authier, L.; Grossiord, C.; Brossier, P.; Limoges, B. Gold Nanoparticle-Based Quantitative Electrochemical Detection of Amplified Human Cytomegalovirus DNA Using Disposable Microband Electrodes. Anal. Chem. 2001, 73, 4450–4456. [Google Scholar] [CrossRef]
  28. Saha, K.; Agasti, S.S.; Kim, C.; Li, X.; Rotello, V.M. Gold Nanoparticles in Chemical and Biological Sensing. Chem. Rev. 2012, 112, 2739–2779. [Google Scholar] [CrossRef] [PubMed]
  29. Driskell, J.D.; Kwarta, K.M.; Lipert, R.J.; Porter, M.D.; Neill, J.D.; Ridpath, J.F. Low-Level Detection of Viral Pathogens by a Surface-Enhanced Raman Scattering Based Immunoassay. Anal. Chem. 2005, 77, 6147–6154. [Google Scholar] [CrossRef] [PubMed]
  30. Dynabeads M-280 Streptavidin. Available online: https://assets.thermofisher.com/TFS-Assets/LSG/manuals/MAN0014017_Dynabeads_M280_Streptavidin_UG.pdf (accessed on 17 April 2023).
  31. Ealia, S.A.M.; Saravanakumar, M.P. A review on the classification, characterisation, synthesis of nanoparticles and their application. IOP Conf. Ser. Mater. Sci. Eng. 2017, 263, 032019. [Google Scholar] [CrossRef]
  32. de la Escosura-Muñiz, A.; Parolo, C.; Maran, F.; Mekoçi, A. Size-dependent direct electrochemical detection of gold nanoparticles: Application in magnetoimmunoassays. Nanoscale 2011, 3, 3350. [Google Scholar] [CrossRef]
  33. Patel, D.M. Novel Sample Isolation and Nanomaterial-Based Electrochemical Detection of Bacterial Toxins for Food Security. Ph.D. Thesis, The University of Utah, Salt Lake City, UT, USA, 2023. Available online: https://www.proquest.com/docview/2781661883/abstract/1B197B4D063D4A65PQ/1 (accessed on 18 April 2023).
  34. Kinoshita, K. Carbon: Electrochemical and Physicochemical Properties; Wiley: Hoboken, NJ, USA, 1988. [Google Scholar]
  35. Wu, C.; Qavi, A.J.; Hachim, A.; Kavian, N.; Cole, A.R.; Moyle, A.B.; Wagner, N.D.; Sweeney-Gibbons, J.; Rohrs, H.W.; Gross, M.L.; et al. Characterization of SARS-CoV-2 nucleocapsid protein reveals multiple functional consequences of the C-terminal domain. iScience 2021, 24, 102681. [Google Scholar] [CrossRef]
  36. Wu, W.; Cheng, Y.; Zhou, H.; Sun, C.; Zhang, S. The SARS-CoV-2 nucleocapsid protein: Its role in the viral life cycle, structure and functions, and use as a potential target in the development of vaccines and diagnostics. Virol. J. 2023, 20, 6. [Google Scholar] [CrossRef]
  37. Cubuk, J.; Alston, J.J.; Incicco, J.J.; Singh, S.; Stuchell-Brereton, M.D.; Ward, M.D.; Zimmerman, M.I.; Vithani, N.; Griffith, D.; Wagoner, J.A.; et al. The SARS-CoV-2 nucleocapsid protein is dynamic, disordered, and phase separates with RNA. Nat. Commun. 2021, 12, 1936. [Google Scholar] [CrossRef] [PubMed]
  38. Zeng, W.; Liu, G.; Ma, H.; Zhao, D.; Yang, Y.; Liu, M.; Mohammed, A.; Zhao, C.; Yang, Y.; Xie, J.; et al. Biochemical characterization of SARS-CoV-2 nucleocapsid protein. Biochem. Biophys. Res. Commun. 2020, 527, 618–623. [Google Scholar] [CrossRef] [PubMed]
  39. Anti-SARS-CoV-2 Nucleocapsid Antibody, Mouse IgG1 (AS46) (Trehalose Free)—ACROBiosystems. Available online: https://www.acrobiosystems.com/P3309-Anti-SARS-CoV-2-Nucleocapsid-Antibody-Mouse-IgG1-%28AS46%29-%28Trehalose-free%29.html (accessed on 20 April 2023).
  40. Anti-SARS-CoV-2 Nucleocapsid Antibody, Mouse IgG1 (AS47) (Trehalose Free)—ACROBiosystems. Available online: https://www.acrobiosystems.com/P3307-Anti-SARS-CoV-2-Nucleocapsid-Antibody-Mouse-IgG1-%28AS47%29-%28Trehalose-free%29.html (accessed on 20 April 2023).
  41. Malla, P.; Liao, H.-P.; Liu, C.-H.; Wu, W.-C.; Sreearunothai, P. Voltammetric biosensor for coronavirus spike protein using magnetic bead and screen-printed electrode for point-of-care diagnostics. Microchim. Acta 2022, 189, 168. [Google Scholar] [CrossRef] [PubMed]
  42. Osaki, S.; Espulgar, W.V.; Wakida, S.; Saito, M.; Tamiya, E. Optimization of electrochemical analysis for signal amplification in gold nanoparticle-probed immunoassays. Electrochimica Acta 2022, 432, 141180. [Google Scholar] [CrossRef]
  43. Levy, J.M.; Frediani, J.K.; Tyburski, E.A.; Wood, A.; Figueroa, J.; Kempker, R.R.; Rebolledo, P.A.; Gonzalez, M.D.; Sullivan, J.; Vos, M.B.; et al. Impact of repeated nasal sampling on detection and quantification of SARS-CoV-2. Sci. Rep. 2021, 11, 14903. [Google Scholar] [CrossRef]
  44. Jayamohan, H.; Romanov, V.; Li, H.; Son, J.; Samuel, R.; Nelson, J.; Gale, B. Chapter 11—Advances in Microfluidics and Lab-on-a-Chip Technologies. In Molecular Diagnostics, 3rd ed.; Patrinos, G.P., Ed.; Academic Press: Cambridge, MA, USA, 2017; pp. 197–217. [Google Scholar] [CrossRef]
  45. Jamshaid, T.; Neto, E.T.T.; Eissa, M.M.; Zine, N.; Kunita, M.H.; El-Salhi, A.E.; Elaissari, A. Magnetic particles: From preparation to lab-on-a-chip, biosensors, microsystems and microfluidics applications. TrAC Trends Anal. Chem. 2016, 79, 344–362. [Google Scholar] [CrossRef]
  46. Available online: https://www.prosci-inc.com/product/sars-cov-2-covid-19-trimeric-spike-s-recombinant-protein-10-075 (accessed on 25 July 2023).
Figure 1. This schematic depicts the nucleocapsid protein detection process utilized in this work. This figure is not drawn to scale. The figure was created using BioRender.com (accessed on 2 July 2023).
Applsci 13 10007 g001
Figure 2. Normalized EC peak current (SWV) was obtained for different sizes of AuNPs (5, 10, 20, 40 nm) at different dilutions (D0 = 1.4 × 10⁸, D1 = 1.4 × 10⁷, D2 = 1.4 × 10⁶, and D3 = 1.4 × 10⁵ AuNPs in 2 μL of DI water). The inset shows the normalized EC plots for dilutions D0 and D1 for clarity. Error bars represent standard deviation (n = 3). A 0.24 μA peak current (n = 3, standard deviation = 0.014) was obtained for the control (2 μL of DI water, no AuNPs). The mean values of normalized current are labeled above the columns.
Applsci 13 10007 g002
Figure 3. Absolute EC peak current (DPV) was obtained for 20 nm AuNPs in serial 10x dilutions (D0 = 1.4 × 10⁸, D1 = 1.4 × 10⁷, D2 = 1.4 × 10⁶, and D3 = 1.4 × 10⁵ AuNPS in 2 μL of DI water). Error bars represent standard deviation (n = 3). The blank (2 μL of DI water, no AuNPs) represents the control. The mean values of peak current are labeled above the columns. The inset shows the calibration curve generated for AuNP dilutions in a range of D0–D3. In total, 50 μL of 0.1 M HCl was used as the supporting electrolyte (deposition time = 120 s). The asterisk (**) denotes different probability values as per the GraphPad style (see Supporting Information, Table S1).
Applsci 13 10007 g003
Figure 4. (a) EC DPV peak current corresponding to varying concentrations (0–10 ng/mL) of N protein in 500 μL of PBS buffer (linear regression curve). (b) Subset of the EC DPV peak current corresponding to N protein concentration (in 500 μL of PBS buffer) in a 0–0.5 ng/mL concentration range. Error bars represent standard deviation (n = 3).
Applsci 13 10007 g004
Figure 5. EC (DPV) peak currents corresponding to human nasal samples obtained from SARS-CoV-2-infected patients (three different cycle thresholds representing varying viral load; analyzed volume = 50 μL). The negative samples (nasal samples from healthy patients) represent the control. Error bars represent standard deviation (n = 3). The mean values of peak current are labeled above the columns. The asterisk (****) denotes different probability values as per the GraphPad style (see Supporting Information, Table S1).
Applsci 13 10007 g005
Figure 6. EC (DPV) peak currents correspond to human nasal samples obtained from SARS-CoV-2-infected patients (seven cycle thresholds representing varying viral load; analyzed volume = 250 μL). The negative samples (nasal samples from healthy patients) represent the control. Error bars represent standard deviation (n = 3). The mean values of peak current are labeled at the bottom of respective columns above the X-axis. The asterisk (*, ** and ****) denotes different probability values as per the GraphPad style (see Supporting Information, Table S1).
Applsci 13 10007 g006
Table 1. Electrochemical immunoassays utilized for COVID-19 diagnostics.
TechniqueSampleAnalytical Performance (LOD)Ref.
Immunomagnetic beads for analyte capture and a secondary antibody conjugated to alkaline phosphatase as the EC label (DPV)S and N proteins in untreated human saliva19 ng/mL for S protein
8 ng/mL for N protein (in untreated human saliva)
[13]
Immunomagnetic beads loaded with peroxidase as the EC label (SWV)S protein in saliva, urine, and serum (spiked samples)0.20, 0.31, and 0.54 ng/mL in human saliva, urine, and serum, respectively[41]
Peptide-conjugated magnetic beads for analyte capture and a secondary peptide conjugated to AuNPs as the EC label (DPV)S protein in human saliva0.35 ag/mL in human saliva[17]
Immunomagnetic beads for analyte capture and a secondary antibody conjugated to AuNPs as the EC label (DPV)N protein in PBS and nasopharyngeal samples2.64 ng/mLThis work
Disclaimer/Publisher’s Note: The statements, opinions and data contained in all publications are solely those of the individual author(s) and contributor(s) and not of MDPI and/or the editor(s). MDPI and/or the editor(s) disclaim responsibility for any injury to people or property resulting from any ideas, methods, instructions or products referred to in the content.

