Abstract
In this work, the path from the cultivation of Arthrospira platensis at an increased concentration of CO2 to the production of bio-oil by hydrothermal liquefaction (HTL) of the grown biomass is realized. The cultivation was carried out in a 90 L photobioreactor at an initial CO2 concentration of 8 vol.% for 15 days. During the cultivation stage, the optical density for microalgae suspension, pH and chemical composition of nutrient medium were monitored. The grown biomass was separated from the nutrient medium with a 100 µm mesh and then subjected to HTL at 330 °C for 1 h. The biomass growth rate was 82 ± 4.1 mg × L−1day−1 and the pH was in the range from 9.08 ± 0.22 to 8.9 ± 0.24. Biochemical and CHNS analyses were applied for the obtained biomass. The contents of carbohydrates, proteins and lipids in the grown biomass were 38.7 ± 0.4 wt.%, 37.4 ± 0.5 wt.% and 3.8 ± 0.4 wt.%, respectively. Bio-oil yield after the HTL procedure was 13.8 wt.%. The bio-oil composition and properties were determined by GH-MS, TLC-PID and ICP-MS techniques. ICP-MS revealed the contents of 51 metals in bio-oil.
1. Introduction
The growth of the world’s population and mass urbanization entail an increase in industrial production volumes that, in turn, require huge energy consumption. According to estimations [1,2], energy resource consumption is going to increase by 1.3% per year on average during the next 10 years, and at the same time, 80 percent of the currently consumed energy comes from fossil fuels. This is of concern due to the huge amount of greenhouse gas emitted into the atmosphere during the extraction and use of fossil fuels. It is a well-known fact that the CO2 concentration in the atmosphere has doubled over the last century and that this speeds up the process of global warming [3,4]. The change in oil prices and the COVID-19 pandemic have also worsened the situation of carbon dioxide emissions [5]. The other worrying point is the pollution of the world’s oceans, where waters are subjected to millions of tons of oil annually due to, for example, different kinds of accidents involving oil tankers or offshore oil platforms or due to natural oil seepage into the ocean [6]. Obviously, the existing environmental threats point to the need to reduce the volume of fossil fuel production and search for alternative energy sources, which is supported by the Paris Agreement of 2015 under the UN Framework Convention regarding climate change.
A promising alternative energy option is biofuel. This kind of fuel is produced from plant raw materials and causes no harm to the atmosphere as the carbon released during its combustion is absorbed with the growth of biomass, which makes it possible to consider the CO2 process as neutral. Additionally, the advantage of such an energy source lies in the similarity of some physical properties of biofuel and fossil fuels, so that gives the opportunity to use biofuels as a future energy source [7].
The study of third-generation biofuels properties, methods and prospects is of great interest. Using this method, microalgae cultures are the substrate for energy production, the grown biomass of which is then subjected to chemical or thermal treatment to produce biofuels [8]. Microalgae have a number of advantages in comparison with other raw materials. These organisms are characterized by a high growth rate and they require much less water during cultivation [9]. Moreover, when using microalgae as a fuel source, there is no conflict with agriculture as the cultivation can take place on land unsuitable for agriculture. Microalgae are being used for wastewater treatment to extract nutrient resources from undrinkable water, which implies the further biomass usage for energy production [10,11]. Like plants, microalgae are autotrophic organisms; under the influence of sunlight, they are capable of oxidizing inorganic compounds to organic compounds. This is why it is very important to develop technologies for capturing the CO2 emissions produced by microalgae [12]. This property also allows us to combine the process of utilization of excess carbon dioxide in the atmosphere and produce biofuel from the obtained biomass, making this process closed.
Some methods for growing microalgae biomass under the stressful conditions caused by a high content of carbon dioxide in the environment are being investigated. One of the most accessible and widespread types of microalgae for such studies is Arthrospira platensis. Both open pounds and closed ones, for example, photo bioreactors with an artificial light source, can be used to increase biomass production. Besides CO2 concentration, factors such as temperature, light intensity, pH, the nutrient medium and aeration also have an influence on the rate and efficiency of microbial growth [13]. In turn, the CO2 concentration in the gas–air environment during the microalgae cultivation affects not only the growth of the culture but also the biochemical composition of the biomass, which makes it possible to obtain a biomass richer in lipids or carbohydrates for further processing of the biomass into biodiesel or bio-alcohol, respectively. Therefore, some factors affecting the content of carbohydrates in the biomass of Arthrospira platensis were studied in [14]. Cultivation was carried out in a Zarrouk-modified medium with a reduced content of nitrogen-containing salts and with the use of fly ashes and a constant CO2 concentration of 2%. At the same time, a carbon dioxide–air mixture was added to the bubbling reactor every 40 min in the ratio of 1:9. Such an experiment made it possible to increase the content of carbohydrates in the final biomass up to 50%, so it can later be used for more efficient production of bioethanol.
In [15], an experiment was carried out for Arthrospira platensis cultivation in an atmosphere containing 15% CO2. It was shown that adding CO2 leads to an increase in the total sugar concentration for the further producing of biomass into biogas. The experiment was also carried out to study the efficiency of Arthrospira platensis biomass growth in atmospheres containing 2, 5, 10 and 15 vol.% of carbon dioxide [16]. The experiment showed that a CO2 concentration increase had a positive effect on the growth of microorganisms in comparison with the control sample that was grown under atmospheric conditions. However, the maximum growth rate was shown by microalgae grown in CO2 at 10%; this means that further increases in carbon dioxide concentration could have a harmful effect on the cultivation efficiency. It was also seen in this experiment that when increasing the concentration of carbon dioxide, the biochemical composition of the biomass changed in favor of a significant increase in carbohydrate content. According to [17], Arthrospira platensis is tolerant to a CO2 concentration of 12% in the atmosphere, which also confirms the possibility of its use as a CO2-capture agent. In this way, we can say that the use of Arthrospira platensis is very effective for capturing atmospheric CO2 and that this process allows the further processing of the biomass into biofuel.
A lot of research has also been carried out to study the effectiveness of CO2 fixation and the further processing of the obtained biomass into biofuel for other types of microalgae. The influence of CO2 concentration in the atmosphere on lipid content in biomass for further processing into biodiesel has been studied [2,18,19]. The growth rate of different strains of microalgae according to CO2 concentration in the atmosphere and in flue gas was compared in [2]. It was shown that the growth of an organism can be inhibited due to the presence of such strong oxidizing agents as sulfur- and nitrogen-containing oxides. It was found that a CO2 concentration increase in the gas–air environment has a different effect on different types of microalgae: depending on microalgae strain, the CO2 concentration increase in the gas–air environment leads to an increase or decrease of the biomass growth rate. Another reported investigated Desmarestia viridis growth in conditions of increased CO2 concentration and nitrogen deficiency, which led to a 21% increase in the lipid part of the biomass [18]. The strain Micractinium sp. was also cultivated using different CO2 concentrations, light intensities and cultivation times [19]. As with the previous samples, the microalgae showed a greater productivity with the increased CO2 concentration in the atmosphere and was also characterized by a high lipid concentration. At a 10% CO2 concentration the average lipid level was about 30% of the total mass, which is a promising indicator for the further processing of this biomass into biodiesel. Therefore, the analysis of the studied works shows the efficiency of microalgae use as guides for atmospheric CO2, fixing and also the necessity for the further studying of biomass cultivation methods under stress conditions to obtain biofuel.
The microalgae biomass extracted after cultivation can be processed in various ways depending on the type of biofuel required. Therefore, biochemical methods for biomass processing are mainly used to produce bio-alcohol (ethanol/butanol) or biogas (methane/hydrogen) [20]. Other types of biofuel, such as biodiesel or bio-oil, can be separated from microalgae chemically and thermally. The traditional method of biomass processing into biodiesel is to extract its lipid part with further interesterification by various alcohols [21]. However, the peculiarities of microalgae biomass, such as a high moisture concentration (80–90%), make this method of biofuel production economically and energetically unprofitable, as water presence in the lipid part of the biomass reduces the efficiency of interesterification and, moreover, the use of pre-drying requires more energy than can be obtained after biodiesel combustion [22]. The high moisture concentration in the biomass also makes such methods as pyrolysis and gasification ineffective from the point of energy production [23]. Currently, in connection with this fact, the use of hydrothermal technologies, in particular hydrothermal liquefaction (HTL), has attracted the greatest interest for the production of bio-oil from microalgae [24]. When using this method, the method of biomass processing occurs at a near critical state for the solvent and, consequently, at a high pressure. In the case of microalgae, water is often used as a solvent and the temperature varies from 250 to 350 °C for biomass production [25]. This method of biomass processing makes it possible to forego pre-drying and gives the opportunity to make the process of bio-oil production uninterrupted. The bio-oil produced by HTL has a higher calorific value than the crude biomass and bio-oil obtained as a result of pyrolysis, which is also an undoubted advantage of this method [26].
Due to the fact that microalgae are very promising source of bio-oil, in this article we decided to describe the whole process for Arthrospira platensis microalgae—from the growth under stressful conditions with the increased CO2 concentration to the transformation of this biomass into bio-oil—and to study its properties.
The main targets of this work:
- Analysis of CO2 sequestration efficiency by the method of CO2 absorption by Arthrospira platensis and biomass conversion into bio-oil;
- Analysis of bio-oil properties.
2. Materials and Methods
2.1. Plan of Experiments
The block scheme with the experiment plan description is shown in Figure 1. Biomass cultivation was carried out in an atmospheric gas chamber in a tubular photobioreactor (PBR) with a volume of 90 L for 15 days; samples were taken for analysis on the 0, 5th, 10th and 15th days. The pH and the components of the nutrient medium (by spectrometry) were assessed. The cultivation experiment was completed on the 15th day as planned; the suspension was passed through a sieve with a cell diameter of 100 microns to separate the microalgae. The moisture content, biochemical concentration and elemental analysis (CHNS) of the microalgae were determined from the one part of biomass. The remaining concentrated biomass was treated with HTL for bio-oil production. The bio-oil was analyzed using the following methods: GC-MS, TLC-FID and MS-ICP.
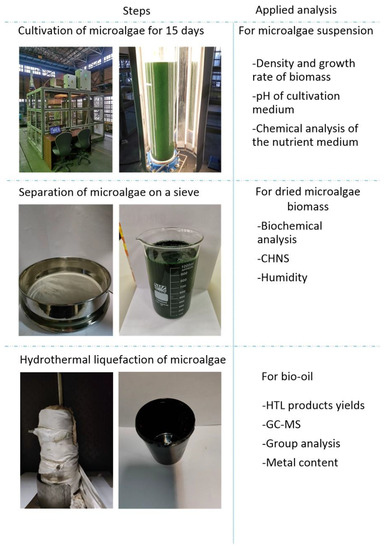
Figure 1.
Block scheme of the experiment: cultivating Arthrospira platensis for 15 days (initial concentration of CO2 8 vol.%) and further bio-oil production from it by the hydrothermal liquefaction method and its analysis.
2.2. Microalgae Strain
The clone culture Arthrospira platensis rsemsu 1/02-P was used as the microalgae; the original strain was taken from the lake of the Chad Republic in its North. This strain is a producer of unsaturated fatty acids and protein in normal cultivation conditions. The initial cultivation of microalgae took place in an open-type cultivator with an atmospheric CO2 concentration in Zarruk’s medium in a semi-continuous way, with a temperature of 21 °C and lightning of 25 ± 3 µmol/m2 × s. The content of Zarrouk’s medium: FeSO4 × 7H2O—0.018 g × L−1, KNO3—3.0 g × L−1, K2HPO4 × 3H2O—0.66 g × L−1, NaHCO3—16.8 g × L−1, K2SO4—1.0 g × L−1, NaCl—1.0 g × L−1, MgSO4 × 7H2O—0.2 g × L−1 and CaCl2—0.04 g × L−1, the addition of microelements for Zarrouk’s medium is 1 mL × L−1.
2.3. The Scheme of the Atmospheric Gas Chamber and Photobioreactor
Microalgae cultivation experiments were carried out in a PBR placed in an atmospheric gas chamber. The detailed description for the PBR and the atmospheric gas chamber can be found in our previous work [27]. In this article, we give a brief description. The PBR is shown in Figure 1 and is a vertical tube made from acrylic plexiglass with a volume of 100 L (the tube has an internal diameter of 30 cm and a height of 150 cm) that has LED strips along its perimeter that give a maximum lightning of 14–14.4 kLx and a lighting directly behind the wall of the PBR of 12.1–13.4 kLx.
The atmospheric gas chamber has a volume of 12 m3 and is used to create a controlled gas environment with a constant volume (gas concentration, temperature and humidity). A total of 12 thermocouples are installed along the perimeter of the atmospheric gas chamber to measure the temperature, as well as gas analyzers for measuring carbon dioxide, sulfur dioxide, oxygen, carbon monoxide, methane, ammonia, sulfur dioxide and nitrogen dioxide. The atmospheric gas chamber is equipped with a programmable heater and cooler to maintain a constant temperature. All of the temperature, pressure, gas concentration and humidity data are monitored in real time and stored in the recording system, from which they are then transferred to a personal computer. The concentration of the required gas is prepared by using a connected set of balloons with the required gas; the gas is pumped out from the chamber with the help of a vacuum pump. Gas mixing is performed by a compressor. The gas is supplied to the PBR from the atmospheric gas chamber by bubbling.
2.4. Installation for the Hydrothermal Liquefaction of Microalgae
The installation is a laboratory bench with an autoclave reactor. The autoclave reactor volume is 0.9 L. The maximum pressure is 40 MPa. The maximum heating temperature is 400 °C. Heating is performed with the help of a PID controller. The temperature was controlled by two thermocouples installed on the outer top and side surfaces of the reactor. The reactor and the thermocouples were placed in an insulated environment to prevent heat losses. Pressure changes in the reactor were measured by the manometer connected to the reactor.
2.5. The Experimental Methodology
2.5.1. Microalgae Cultivation and Collection of the Resulting Biomass
A concentrated suspension of microalgae was poured into a clean PBR with distilled water in Zarrouk’s medium up to a total volume of 90 L. Then, a constant lightning was set up on the PBR, the bubbler was connected to the supply gas from the atmospheric gas chamber into the PBR without interruption; the gas was supplied through the bottom of the PBR. The compressor was switched on for continuous mixing of the gas phase in the atmospheric gas chamber. Then, the atmospheric gas chamber was closed, carbon dioxide was supplied through the opened gas valve to create the appropriate concentration in the atmospheric gas chamber of 8.00 vol.%. Afterwards, the valve was closed to seal the chamber. The temperature in the chamber was kept constant: 27 ± 1 °C. On the 0, 5th, 10th and 15th days of the experiment, a sample of the suspension was taken from the PBR to determine the biomass density, as well as to determine the concentration of nutrients (the full list of nutrients is in Section 2.6.4). The biomass obtained on the 15th day was filtered using a sieve. The sieve was a stainless-steel mesh with a size of 100 microns and an inner diameter of 30 cm. As the obtained biomass was wet, its moisture content was determined. The biomass drying was performed in a Binder VD53 drying oven cabinet at 105 °C for 24 h. Drying was performed 5 times to account for errors; the mass of each sample of filtered biomass was about 10 g. The biomass drying was carried out to determine its moisture content. As HTL was performed for wet biomass, its moisture content is important to determine the water’s influence on the maximum pressure in the reactor when using HTL.
2.5.2. Hydrothermal Liquefaction of Concentrated Biomass Arthrospira platensis
In HTL experiments, wet biomass was placed in the HTL reactor described above. Before each experiment, the reactor was cleaned with dichloromethane. Then, 330 g of distilled water was poured into the reactor. Next, the sealed reactor was heated up to 330 °C, the temperature was kept for 60 min and after the reactor had cooled to room temperature it was opened to drain its contents. Afterwards the reactor was cleaned again with dichloromethane; the cleaning of the reactor was performed twice before HTL.
HTL was carried out with a maximum reactor temperature of 330 °C, a reactor heating rate of 4.2 °C × min−1 and a holding time at maximum temperature of 60 min. The pressure in the reactor was measured by a manometer connected to it. Then, as the reactor cooled down the residual pressure was measured. After that, the reactor mass was compared with the reactor mass before the hydrothermal treatment to assess if there were any leaks. Then, the gaseous products were released into the atmosphere, the mass of which was estimated by using subtraction of the residual principle from the sum of the masses of the other products. The rest of the products were emptied into glass containers. The biofuel and biochar were filtered out of this using paper filters. Then, to find the mass of dry biochar, this filtered biochar was placed in a Binder VD53 drying oven, where drying was carried out for 24 h with the temperature of 105 °C. The choice of the maximum temperature was due to our previous work on the HTL of this microalgal strain cultivated when using atmospheric carbon dioxide. The HTL conditions in our previous works were identical to the HTL conditions in the current work with one exception: in previous works, 100 g of dried microalgae and 330 mL of distilled water were placed into the reactor [28,29]. The choice of the holding time at the maximum temperature was because of the fact that at a holding time of 60 min the biofuel yield is maximum [30].
2.6. Analysis Methods
2.6.1. Biochemical Analysis of Microalgae
Microalgae extraction was further conducted following the Folch procedure to determine the amount of lipids [31]. After lipid extraction, the remaining sediment was dried in a Binder VD53 drying oven at 50 °C for 20 h. The protein content was found using the method in [32]. The biomass sediment remaining after the protein extraction was then dried in a Binder VD53 desiccator at 60 °C for 20 h. The phenol-sulfuric acid method was used to determine the amount of carbohydrate [33]. All samples were analyzed 2 times.
2.6.2. Optical Density of Microalgae Biomass
The optical density of the suspension was measured using a photocolorimeter KFK-2UHL 4.2 versus (Russia) at 670 nm. The sample were analyzed 2 times.
2.6.3. Cultivation Medium pH
The pH of the samples was measured directly by using a pH meter (Shindengen Electric Mfg. Co., Ltd., Tokyo, Japan), with pre-calibration of the pH meter before each measurement. The samples were analyzed 2 times.
2.6.4. Cultivation Medium Analysis
Chemical oxygen demand (COD), biochemical oxygen demand (BOD) and bicarbonate and carbonate contents were determined by titration. Magnesium and potassium quantities were determined by using an inductively coupled plasma optical emission spectrometer Agilent 720 ICP-OES, USA. To determine the content of phosphates, nitrates and sulfates, ion chromatograph with a conductivity detector ICS-1600 (USA) was used.
2.6.5. CHNS Analysis of Microalgae
CHNS analysis of Arthrospira platensis was completed with the help of a Thermo Scientific Flash 2000 HT (USA) analyzer. The sample was analyzed three times to find the average value of each of the elements. The resulting errors were less than 4%. The samples were analyzed 2 times.
2.6.6. Group Analysis of Saturated, Aromatic and Polar Biofuel Compounds
The group hydrocarbon composition (content of saturated, aromatic, polar I and polar II compounds) of the bio-oil was established according to the standard method IP 469 on thin-layer chromatography with flame ionization detection (TLC-PID) latroscan MK-6s SES GmbH (Ltd.), Analysesysteme, Germany.
2.6.7. The Content of Elements in Bio-Oil
The element content was determined by using an inductively coupled plasma mass spectrometer (ICP-MS) Agilent 7900, Agilent Technologies, equipped with a two-way glass spray chamber cooled up to 2 °C with the glass spray MicroMist, a quartz burner and nickel cones. The samples were analyzed 2 times.
2.6.8. Qualitative and Quantitative Analysis of Bio-Oil
Qualitative and quantitative analysis of the bio-oil was carried out by gas chromatography–mass spectrometry (GC-MS) on a 7890 gas chromatograph with a 5977 MS detector, Agilent Technologies, USA, using a proline 100–1000 µL dispenser, Sartorius AG.
3. Results
3.1. Microalgae Biomass Production Efficiency
On the 0, 5th, 10th, and 15th days of the experiment, the suspension samples from the biomass were taken from the atmospheric gas chamber to estimate the biomass density using a spectrophotometer. The value of biomass density throughout the experiment is shown in Figure 2; Table 1 shows the average biomass growth rate per day.
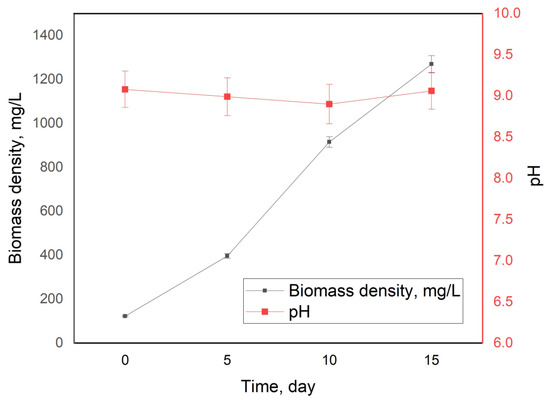
Figure 2.
Biomass density and pH changes during the 15-day cultivation of Arthrospira platensis.

Table 1.
Growth rate of biomass during the entire cultivation stage of Arthrospira platensis.
The biomass density increase linearly in our previous works; a larger scatter in average biomass growth rates was observed due to strain adaptation to new conditions [27,34]. According to the biomass rate growth data, the experimental rates of CO2 absorption are found. During the whole experiment, 0.22 kg of CO2 was absorbed (60 g in terms of carbon). The dry weight of the grown biomass was 103 g.
In Ref. [35], Arthrospira platensis biofixation was studied at a CO2 concentration of 10 vol.% in four cultivation periods in an outdoor PBR under environmental conditions. The cultivation periods were from January to March, from April to June, from July to September and from October to December. It was found that the biomass growth rate for each cultivation period was the following: 40 mg × L−1day−1, 32 mg × L−1day−1, 28 mg × L−1day−1 and 48 mg × L−1day−1, respectively [35]. The absorption of Arthrospira platensis LEB 18 at a CO2 volume of 12 vol.% was studied in a closed PBR for 10 days; it was shown that the biomass rate was 80 ± 10 mg × L−1day−1 [36]. Different strains of Arthrospira platensis have different growth rates. For example, in [37], nine strains of Arthrospira platensis were cultivated in a columnar photobioreactor at 10 CO2. A large spread was found in terms of the growth rates between different strains of Arthrospira platensis, which was associated with the Arthrospira platensis strains themselves since the cultivation conditions were the same [37]. Since various factors affect the rate of biomass growth [14,38,39], it is logical to compare the results of this work with the results of our previous work [27]. The work was carried out using the same strain of Arthrospira platensis. The conditions, parameters and cultivation methods were similar to the present work with one exception: different concentrations of CO2 were used in the previous work. It was found in the work that the growth rate of biomass density was 79.4 and 76.3 mg × L−1day−1 at CO2 concentrations of 1 and 5 vol.%, respectively [27]. This correlates with the results of this work.
3.2. CO2 Absorption Efficiency
The data from the CO2 concentration changes in the atmospheric gas chamber during the cultivation of Arthrospira platensis at a CO2 volume of 8% are shown in Figure 3. The ratio of the gas–air environment volume to the working volume of the microalgae suspension was 120 (12 m3/0.1 m3). The value of CO2 changed from 8 vol.% at the beginning of the experiment to 6.47 vol.% at the end of the experiment. The average rate of CO2 change over the whole experiment was 0.109 vol.%/day; the average rate over the first half of the experiment was 0.107 vol.%/day, whereas in the second half of the experiment it was 0.11 vol.%/day. In our previous work with this strain [27,34], the average rates varied from 0.14 vol.%/day to 0.12 vol.%/day throughout the experiment. The experimental conditions and nutrient medium were identical to the experimental conditions and nutrient medium in the current work, the only exception was the initial concentration of carbon dioxide, which was 6 vol.% [27] or 5 vol.% [34]. At the same time, the spread between the average speeds of the first and second halves of the experiment was significant (additionally, in the 2nd half of the experiments the average speeds were lower than those in the first half), which was caused by the adaptation of Arthrospira platensis to the increased concentrations of carbon dioxide in the gas–air environment [27,34].
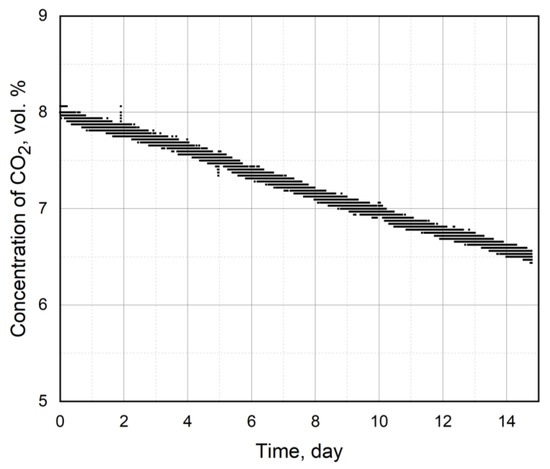
Figure 3.
Change in CO2 concentration in the atmospheric gas chamber during a 15-day cultivation of Arthrospira platensis at an initial CO2 concentration of 8 vol.%.
When considering the average rate of CO2 absorption, we also need to take into account the losses of CO2 from the chamber to the atmosphere. The gas losses in the chamber decrease in relative terms depending on the initial volume percentages of the studied gas medium in the chamber. Additionally, losses can be due to the methods of the experiment, the method of supplying gas to the PBR, the duration of maintaining the gas–air environment in the PBR and so on. With an initial CO2 volume of 8 vol.%, the losses were 0.67% or 0.04 vol.%/day, which was also obtained directly. Therefore, the CO2 absorption takes on average 0.11 − 0.04 = 0.07 vol.%/day in the atmospheric gas chamber during the process of photosynthesis.
In the current work, we managed “to include” the biomass presence into the new conditions from the very beginning of the experiment, which shows the excellent adaptive ability of Arthrospira platensis to new extreme conditions in the shortest possible time. The biomass growth rate turned out to be linear, with the average rate of biomass growth in the first half of the experiment (the first 7 days of the experiment) being the same as the rate of biomass growth in the second half of the experiment (the last 7 days of the experiment).
3.3. Moisture Content of the Obtained Suspension and the pH Value of the Cultivation Medium
At the end of the experiment, biomass from the PBR was selected by concentrating the biomass through a sieve with a mesh size of 100 microns; 1070 g of concentrated wet biomass was obtained. The moisture content of the concentrated microalgae biomass was 91.3 ± 0.4%. The moisture content was determined by drying five samples of the suspension. As the ratio of one mass sample to the mass of the completely concentrated microalgae biomass was about 1%, this small error in determining the moisture content shows that the biomass from the PBR was correctly separated from the nutrient medium. This is why the extra moisture did not get into the microalgae HTL reactor in the process of biomass concentrating from the PBR.
The pH values of the experiment are shown in Figure 2. One can see that the pH value was almost constant throughout the experiment; the value was around pH = 9, which is the optimal value when cultivating this type of microalgae at high CO2 concentrations [14,16,17].
3.4. Biochemical Analysis of Microalgae
The biochemical analysis of microalgae biomass grown with a CO2 volume of 8% is shown in Figure 4. Compared with the initial values (values of the biochemical analysis of Arthrospira platensis cultivated at atmospheric CO2 concentration) of the biochemical analysis, there is a tendency towards an increase in the amount of carbohydrates and a decrease in the amount of lipids, which indicates a change in the metabolism of Arthrospira platensis at high concentrations of CO2 [14].
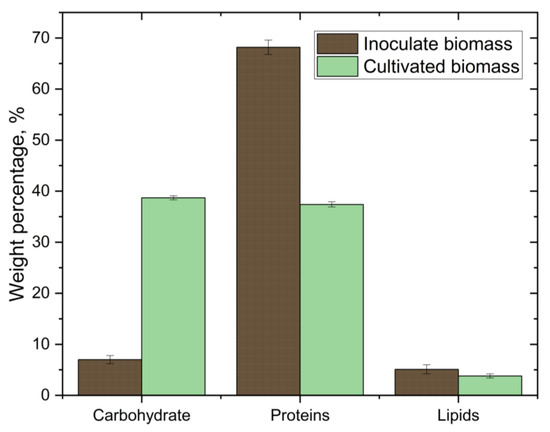
Figure 4.
Biochemical composition of the initial (inoculate) biomass (cultivated at atmospheric CO2 concentration) in comparison with Arthrospira platensis cultivated at 8% CO2.
In the present work, a decrease in the concentration of lipids is observed. In the literature, a decrease in the concentration of lipids is associated with various parameters. For example, it is known that the washout effect occurs when the maximum specific growth rate of microalgae is less than or equal to the dilution rate [38]. The paper shows that when cultivating microalgae Arthrospira platensis during continuous cultivation in a tubular photobioreactor, pure CO2 can be used as a carbon source and ammonia can be used as a nitrogen source. Then, with a sufficient amount of nitrogen in the nutrient medium, the concentration of proteins increases along with the dilution rate, changing from 23.78% protein to 57% protein [38]. It was shown in [40] that a decrease in the nitrogen source leads to a decrease in the growth rate of Arthrospira platensis, a decrease in the concentration of proteins and an increase in the concentration of carbohydrates. Additionally, in [16], it was shown that when cultivating various Arthrospira platensis strains in a columnar photobioreactor at various CO2 concentrations, the protein concentration has a negative correlation with the carbohydrate concentration. Moreover, with an increase in the concentration of CO2, the concentration of proteins decreases from 68% to 61% [16]. At the same time, the paper presents data showing that the protein concentrations for various strains of Arthrospira platensis can range from 23.78% to more than 60% depending on various conditions [16].
The CO2 supply also affects the amount of protein, fat and carbohydrate in microalgae. In this work, cultivation of Arthrospira platensis was carried out for two different gas velocities and for four different diffusers [41]. The paper shows that not only the gas flow rate but also the shape of the diffuser affects the concentrations of proteins, lipids and carbohydrates [41]. At the same time, the shape of the diffuser had a much greater effect on the concentrations of proteins, lipids and carbohydrates [41].
Therefore, when considering the results of this work, more attention should be paid to our previous work with this strain of Arthrospira platensis [27]. The cultivation conditions were similar to the conditions in this work with one exception: in the previous work, a study was conducted on the effect of different concentrations of CO2 on the cultivation of Arthrospira platensis [27]. It was found that at 0.04 CO2 and at 1 CO2, the concentrations of lipids (5.3 ± 1.1% and 5.7 ± 0.6%, respectively) and proteins (69.0 ± 1.5% and 70.0 ± 0.6%, respectively) remained almost unchanged. In addition, at 5 CO2, there was a sharp drop in the concentrations of lipids (4.2 ± 0.5%) and proteins (47.7 ± 1.5%) [27].
In this work, a decrease in the concentrations of proteins and lipids and an increase in the concentration of carbohydrates when compared with the control sample is observed. These changes correlate with our previous work [27]. It is assumed that such a sharp change in the concentration of proteins is due to the lack of a source of nitrogen in the cultivation medium, as can be seen from Table 2.
Table 2.
The components of the cultivation medium during the cultivation of Arthrospira platensis for 15 days at an initial CO2 concentration of 8 vol.%.
3.5. CHNS Analysis of Arthrospira platensis
Figure 5 shows the data from the CHNS analysis of Arthrospira platensis. One can see the decrease in each of the CHNS elements compared with the initial biomass. These changes in CHNS are explained by the cultivation conditions—the choice of cultivation medium and the use of a gas–air environment with a high concentration of CO2 in the PBR—as the amount of the corresponding chemical elements in microalgae increases when the concentration of any chemical element in the cultivation medium increases [36,42].
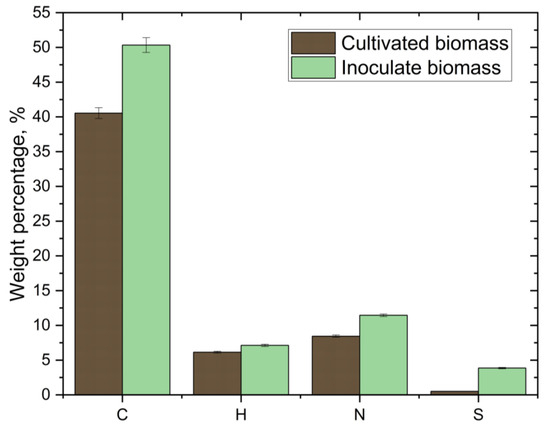
Figure 5.
Change in the elemental analysis of the initial biomass of Arthrospira platensis relative to the biomass at the end of the 15-day cultivation at an initial CO2 concentration of 8 vol.%.
CO2 absorption by Arthrospira platensis LEB 18 at a CO2 volume of 12% was studied in a closed PBR for Arthrospira platensis cultivation. The following CHNS analysis data were obtained: C (40.19%), H (7.30%), N (4.54%) and S (1.21%) [36]. In this work, using a closed 30 m3 PBR in which we studied the absorption of flue gases by using Arthrospira platensis, the following CHNS analysis data were obtained: C (49.85%), H (6.43%), N (9.65%), S (0.76%) and O (24.54%) [42]. The results of this work, presented in Figure 5, are consistent with the results of these two studies. One can see a low content of sulfur, nitrogen and hydrogen that correlates with the manuscripts [36,42]. The low content of sulfur and nitrogen indicates that lower concentrations of sulfur and nitrogen are possible in the resulting bio-oil, which favorably affects the quality of the bio-oil [43].
3.6. The Components of the Cultivation Medium
The results of the analysis of the cultivation medium components are presented in Table 2. About 50% of the biomass consists of carbon during the cultivation of Arthrospira platensis, so the main contribution to the result of cultivation is made by the amount of carbon [38]. The cultivation medium determines the biomass growth rate and the biochemical parameters that will change during cultivation [37,44,45]. The main research is currently focused on identifying the factors influencing the cultivation of microalgae. Currently, the key factors include the following: pH [16,17,37], nutrient medium [36,38,46], type of cultivation [38,45,47], geometric dimensions of the reactor [47,48], temperature [44,47,49], light [38,44,47], diffuser configuration [41,48,49], mixing speed of nutrient medium components [38,48,49], nutrient supply method (additional supply of nutrients during cultivation [40,46,47] and method and nature of CO2 supply [37,38,48]) and nitrogen and phosphorus consumption [17,47,48].
Variations of Zarrouk’s medium are mainly used as a nutrient medium [47]. The main directions of research on its application are related to the search for a cheaper source of carbon, since the carbon source is its most expensive component in the price of Zarrouk medium [38,47] (studies are also being conducted to find a cheaper source of nitrogen [38,47], which is especially important for microalgae with a high concentration of proteins). Currently, the main ideas to reduce the cost of the carbon source are associated with the use of carbon dioxide in the cultivation medium, which is a by-product of many factories, for example, the use of flue gases as a source of carbon or only CO2 from flue gases [46,49]; however, its use is limited by pollutants in flue gases (heavy metals, SOX, NOX). For example [49], at SO2 concentrations of 150 ppmv, Chlorella KR-1 cell growth is inhibited (inhibition starts from 60 ppmv). At the same time, research is underway to find a cheaper culture medium. For example, the use of wastewater or any by-products of industry as components of a nutrient medium for the cultivation of microalgae [47].
Few studies have been conducted to investigate the effect of aeration on the growth pattern of Arthrospira platensis [48]. At the same time, it was shown for Arthrospira platensis that growth is better with CO2 aeration, and it is also easier to maintain a constant pH in a system with intermittent aeration compared with a continuous supply of carbon dioxide [16]. At the same time, critical concentrations of CO2 lead to a decrease in the growth rate of microalgae [16]. It is necessary to take into account the efficiency of CO2 utilization for the growth of microalgae, since only a part of carbon from carbon dioxide will be spent on photosynthesis [16]. The utilization efficiency, in turn, shows a dependence on the gas–liquid transfer of CO2 [16]. The growth of Arthrospira platensis is accelerated at an aeration rate of 150–500 mL × min−1 and that at an aeration rate of 2000 mL × min−1 and higher, a decrease in the growth rate of microalgae is observed [38]. In [48], an analysis was made regarding the effect of a deficiency of nutrients (studied for nitrogen and phosphorus) on the growth of microalgae Arthrospira platensis depending on the rate of CO2 supply for various concentrations of CO2, nitrogen and phosphorus. It was shown in [48] that the rate of biomass growth depended on the rate of supply of CO2 and its concentration. In this case, the growth rate also decreased at high rates. At the same time, the aeration rate had practically no effect on the concentrations of nitrogen and phosphorus. Additonally, small as well as large concentrations of nitrogen in the initial cultivation medium lead to a more rapid decrease in the growth rate of microalgae. Furthermore, when the nitrogen source in the nutrient medium was depleted, the growth of microalgae did not stop but continued due to changes in the composition of the biomass [48].
During the experiment, the concentrations of the nutrient medium components remained almost unchanged, which follows from Table 2. The main absorption of substances from the nutrient medium occurred for magnesium, phosphates and nitrates. The remaining components remained practically unchanged (in percentage terms). The change in biochemical oxygen consumption (increase) was associated with the growth of bacteria in the PBR. The main carbon consumption came from CO2. The change in bicarbonates was associated with a strong buffering of the Zarruk medium and a constant pH: Arthrospira platensis absorbs HCO3− and CO3−, CO3− is not consumed due to the high pH, it remains in the form of a buffer and is not consumed.
3.7. Yield of Hydrothermal Liquefaction Products of Microalgae
Figure 6a shows previous results regarding HTL product yields with this strain of Arthrospira platensis cultivated under atmospheric conditions. The HTL conditions are similar to those that are used in the current work with one exception: 100 g of dry biomass and 330 mL of distilled water were placed in the reactor [50]. In Figure 6b are the results regarding the yield of the HTL products of wet concentrated biomass obtained during the current work. At the end of HTL, the residual pressure in the reactor was 16 atm, which is similar to our previous results with Arthrospira platensis cultivated at atmospheric CO2 concentration. In our previous works regarding the HTL of this strain of Arthrospira platensis cultivated at atmospheric gas concentrations with similar HTL parameters, the yields of bio-oil were 34.7 wt.% [28] and 37.2 wt.% [29].
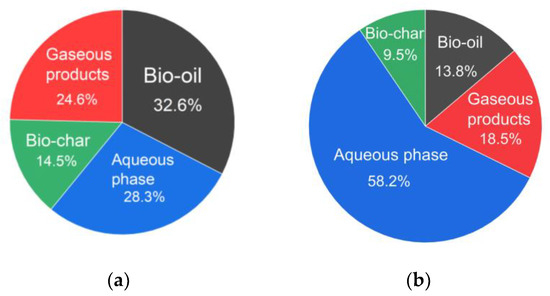
Figure 6.
The product yield of Arthrospira platensis hydrothermal liquefaction (wt.%) when cultivating Arthrospira platensis in an atmospheric medium (a) [50] or in a medium with an initial CO2 concentration of 8 vol.% (b).
The bio-oil yield in the current work was 13.8 wt.%, which was caused by an increase in the amount of carbohydrates and a decrease in the amount of lipids when Arthrospira platensis was cultivated in a medium with high carbon dioxide content [27]. This leads to the bio-oil yield decrease, as the main contribution to the bio-oil yield is due to lipids [50]. This can also be seen when comparing Figure 6a,b: the bio-oil yield decreased from 32.6 to 18.5 wt.%, whereas the aqueous phase yield increased from 28.3 to 58.2 wt.%.
It is considered that the changes in the concentration of carbon dioxide during the cultivation of Arthrospira platensis affects the changes in the proportions of the aqueous phase and bio-oil and that the yield of biochar and of gaseous products is almost constant. In the currently work, we show a decrease of the yield of biochar and of gaseous products when compared with [50]. An increase in the yield of the aqueous phase shows the promise of this direction for studying its application. The promising directions for the use of aqueous phase are as one of the components of the nutrient medium in the process of microalgae cultivation [51,52] or as an additive to fertilizers [52]. The promising directions for the use of biochar are the application biochar as a biofertilizer for the soil [51], its reuse as a nutrient medium for the cultivation of microalgae [53,54] or its use in wastewater treatment [53,54]. The main component of the gas phase is CO2 [51]. A promising direction for its application is the use of carbon dioxide as a nutrient medium in the cultivation of microalgae [51]. The economic potential of microalgae processing by hydrothermal liquefaction has not yet been fully studied [55,56,57]. In our opinion, when assessing the economic potential the main research should focus on the following points: determination of the products’ production costs changing depending on production volumes and the physical and chemical characteristics of the products.
3.8. Group Analysis of Saturated, Aromatic and Polar Biofuel Compounds
The results of the group analysis of saturated, aromatic and polar bio-oil compounds are presented in Table 3. The IP 469 method is the primary method for determining the types of hydrocarbons. According to our data, bio-oil from Arthrospira platensis was not analyzed by this method. The results in Table 3 show that the obtained bio-oil does not contain saturated hydrocarbons, the content of aromatic hydrocarbons is 0.2 wt.% and the remaining hydrocarbon compounds are polar compounds. However, the review shows that the bio-oils from various microalgae contain aromatic and saturated hydrocarbons [43]. The method IP 469 is applied to fossil oil. The results of this analysis indicate that this method should be modified for bio-oil analysis.
Table 3.
The results of the group analysis of saturated, aromatic and polar bio-oil compounds obtained by HTL from Arthrospira platensis cultivated for 15 days at an initial CO2 concentration of 8 vol.%.
Based on the IP 469 methodology, it is assumed that other solvents should be used for accurate identification of hydrocarbon composition when using this method (the choice of solvent and its composition affects the data obtained during the analysis and it might be worth completing a separate job to prepare samples) and take into account the high viscosity of bio-oil. The analysis results are also affected by the amount of water in the bio-oil, the amount of which needs to be studied separately [58,59,60].
3.9. The Content of Elements in Bio-Oil
The elemental analysis is presented in Table 4. According to our data, this method of analysis is used very rarely for the analysis of bio-oil. Some of the elements are trace elements that entered Arthrospira platensis (and afterwards the bio-oil) during the cultivation of Arthrospira platensis. For biofuel from Arthrospira platensis in [30], we obtained results that are comparable with the results of this work: 848, 116.0, 69.3, 11.1, 8.2, 72.1, 14.6, 22.4, 19.4, 5.9 and 1.17 mg × kg−1 for Fe, Ca, Mg, Cu, Zn, Ni, Na, K, Mo, Cr and Mn, respectively.
Table 4.
The results of determining the content of elements in bio-oil that was obtained by the HTL method from microalgae Arthrospira platensis after 15 days of cultivation in an atmospheric gas chamber at an initial CO2 concentration of 8 vol.%.
In this work, we analyzed Arabian fossil oil for the content of metal impurities and obtained 14, 9, 6, 3.5, 5, 10, 11 and 2 ppm for Ca, Fe, Mg, Cu, Zn, Na, Ni and Mo, respectively [61], which is less than our data. When compared with fossil oil or soil in oil production areas, it can be noticed that there is a greater concentration of heavy metals in the bio-oil obtained in this work, which leads to the need for additional stages of bio-oil purification [62,63,64].
3.10. Gas Chromatography–Mass Spectrometry of Bio-Oil
The results of the GC-MS of bio-oil are presented in Table 5. During the analysis in this work, 19 compounds were identified: phenol and its alkyl derivatives, indole and its alkyl derivatives, palmitic acid, hexadecanamide and its alkyl derivatives, and oleic acid diethanolamide. A total of 63% of the peaks of the detected compounds were identified. Similar compounds were obtained in other works [30,43,65].
Table 5.
The results of relative quantification of the content of the identified compounds in bio-oil by GC-MS.
In microalgae bio-oil, six main types of chemical compounds can be distinguished according to their functional groups: monoaromatic compounds and their derivatives, aliphatic compounds, fatty acids, nitrogenous compounds, polyaromatic compounds and other oxygenated compounds such as alcohols, aldehydes and ketones [43]. In the current work, we obtained microalgae with a high carbohydrate content, significant protein content and low lipid content. It is thought that lipids form the main contribution to the yield of bio-oil, whereas carbohydrates and proteins make less significant contributions [66]. The compounds No. 1–5, 7, 8, 11 and 12 are aromatic, the compounds No. 1–3, 10 and 13–19 are polar, which suggests that the IP 469 method from the previous section should be revised towards the development of a sample preparation methodology. Several heterocyclic compounds were obtained (compounds No. 5–8). It is considered that bio-oil from microalgae usually contains from 10 to 15% heterocycles [43]. The compounds No. 5, 8 and 11–19 are nitrogen-containing and the compounds No. 1, 2, 3 and 10–19 are oxygen-containing; a large amount of oxygen and nitrogen indicates that there is a need for bio-oil refining stages before it can be used as a fuel [43]. The large presence of heptadecane and hexadecanoic acid is characteristic of bio-oil from microalgae; these compounds lead to an increase in oil viscosity [66]. There is also a big difference in the results from the analysis of fossil oil [65].
4. Conclusions
During the cultivation of Arthrospira platensis under 8% CO2, we obtained the following main results.
- The efficiency of CO2 absorption by Arthrospira platensis was determined directly. During the experiment, the average rate of CO2 absorption due to photosynthesis was 0.07 vol.%/day, with constant biomass growth rate of 82 ± 4.1 mg × L−1day−1;
- The pH value was almost constant and in the optimal value for cultivating this type of microalgae. The concentrations of the following components of the nutrient medium decreased: magnesium, phosphates and nitrates. CO2 was the main source of carbon.
At the end of the cultivation stage, the biomass was separated on a sieve with a mesh of 100 microns, the analysis of which showed:
- CHNS analysis shows a decrease in C and H in comparison with the initial biomass (cultivated at atmospheric CO2 concentration);
- The amount of carbohydrates compared with the initial biomass changed from 7 ± 0.8 to 38.7 ± 0.4 wt.%, lipids from 5.1 ± 0.9 to 3.8 ± 0.4 wt.% and proteins from 68.2 ± 1.4 to 37.4 ± 0.5 wt.%.
From the obtained wet biomass, bio-oil was obtained by the HTL method, establishing the following:
- The bio-oil yield was 13.8 wt.%; it is shown that when increasing the CO2 concentration of the gas–air environment the yield of bio-oil decreases;
- The group analysis of saturated, aromatic and polar compounds of bio-oil using the IP 469 method showed that bio-oil consists of 99.8 wt.% polar 1 and polar 2 compounds. This suggests that this method needs to be modified for use in the analysis of bio-oil;
- The content of 51 metals in bio-oil was determined by the ICP-MS technique, and 19 compounds were identified by the GC-MS technique. The results of these two methods showed that refining stages for bio-oil should be used in order to use bio-oil as a traditional fossil fuel.
Author Contributions
K.G.R.—conducting HTL experiments, visualization, writing—original draft preparation. A.V.B.—conducting CHNS analysis, visualization, writing—original draft preparation. A.V.G.—preparing atmospheric gas chamber and photobioreactor for experiments, harvesting microalgae and preparing it for HTL, data curation, software. E.A.C.—cultivating of Arthrospira platensis, measuring optical density and pH, preparing microalgae for elemental and biochemical analyses. N.I.C.—preparing inoculate of Arthrospira platensis, preparing microalgae for elemental and biochemical analyses, conducting biochemical analysis of microalgae, visualization, methodology. S.V.K.—conducting analysis of cultivation medium, visualization, writing—review and editing. S.Y.M.—formal analysis, investigation. E.A.B.—project administration. O.V.S.—resources. K.O.—conducting TLC-PID and ICP-MS. T.A.M.—conducting GH-MS. V.K.—validation, conceptualization. M.S.V.—supervision, writing—review and editing, funding acquisition. All authors have read and agreed to the published version of the manuscript.
Funding
This work was funded by the Russian Science Foundation (RSF), Grant No. 22-49-02003, https://rscf.ru/project/22-49-02003/ (accessed on 11 September 2022).
Institutional Review Board Statement
Not applicable.
Informed Consent Statement
Not applicable.
Data Availability Statement
Not applicable.
Conflicts of Interest
The authors declare no conflict of interest.
References
- Pugazhendhi, A.; Mathimani, T.; Varjani, S.; Rene, E.R.; Kumar, G.; Kim, S.-H.; Ponnusamy, V.K.; Yoon, J.-J. Biobutanol as a promising liquid fuel for the future-recent updates and perspectives. Fuel 2019, 253, 637–646. [Google Scholar] [CrossRef]
- Brindhadevi, K.; Mathimani, T.; Rene, E.R.; Shanmugam, S.; Chi, N.T.L.; Pugazhendhi, A. Impact of cultivation conditions on the biomass and lipid in microalgae with an emphasis on biodiesel. Fuel 2021, 284, 119058. [Google Scholar] [CrossRef]
- Boot-Handford, M.E.; Abanades, J.C.; Anthony, E.J.; Blunt, M.J.; Brandani, S.; Mac Dowell, N.; Fernández, J.R.; Ferrari, M.-C.; Gross, R.; Hallett, J.P.; et al. Carbon capture and storage update. Energy Environ. Sci. 2014, 7, 130–189. [Google Scholar] [CrossRef]
- Xu, Y.; Ramanathan, V.; Victor, D.G. Global warming will happen faster than we think. Nature 2018, 564, 30–32. [Google Scholar] [CrossRef] [PubMed]
- Jawadi, F.; Rozin, P.; Bourghelle, D. Insights into CO2 emissions in Europe in the context of COVID-19: A panel data analysis. Int. Econ. 2023, 173, 164–174. [Google Scholar] [CrossRef]
- Gilmour, M.; Borrelle, S.; Elliott, L.; Okawa, R.; Rodríguez, A. Pollution—Lights, plastics, oil, and contaminants. In Conservation of Marine Birds; Academic Press: Cambridge, MA, USA, 2023; pp. 177–216. [Google Scholar]
- Lee, X.J.; Ong, H.C.; Gan, Y.Y.; Chen, W.H.; Mahlia, T.M.I. State of art review on conventional and advanced pyrolysis of macroalgae and microalgae for biochar, bio-oil and bio-syngas production. Energy Convers. Manag. 2020, 210, 112707. [Google Scholar] [CrossRef]
- Chisti, Y. Introduction to algal fuels. In Biofuels from Algae; Elsevier: Amsterdam, The Netherlands, 2019; pp. 1–31. [Google Scholar]
- Chaudry, S.; Bahri, P.A.; Moheimani, N.R. Pathways of processing of wet microalgae for liquid fuel production: A critical review. Renew. Sustain. Energy Rev. 2015, 52, 1240–1250. [Google Scholar] [CrossRef]
- Chen, J.; Dai, L.; Mataya, D.; Cobb, K.; Chen, P.; Ruan, R. Enhanced sustainable integration of CO2 utilization and wastewater treatment using microalgae in circular economy concept. Bioresour. Technol. 2022, 366, 128188. [Google Scholar] [CrossRef]
- Avila, R.; Justo, Á.; Carrero, E.; Crivillés, E.; Vicent, T.; Blánquez, P. Water resource recovery coupling microalgae wastewater treatment and sludge co-digestion for bio-wastes valorisation at industrial pilot-scale. Bioresour. Technol. 2022, 343, 126080. [Google Scholar] [CrossRef]
- Mohapatra, R.K.; Padhi, D.; Sen, R.; Nayak, M. Bio-inspired CO2 capture and utilization by microalgae for bioenergy feedstock production: A greener approach for environmental protection. Bioresour. Technol. Rep. 2022, 19, 101116. [Google Scholar] [CrossRef]
- Soni, R.A.; Sudhakar, K.; Rana, R.S. Spirulina–From growth to nutritional product: A review. Trends Food Sci. Technol. 2017, 69, 157–171. [Google Scholar] [CrossRef]
- Braga, V.d.S.; Moreira, J.B.; Costa, J.A.V.; de Morais, M.G. Enhancement of the carbohydrate content in Spirulina by applying CO2, thermoelectric fly ashes and reduced nitrogen supply. Int. J. Biol. Macromol. 2019, 123, 1241–1247. [Google Scholar] [CrossRef] [PubMed]
- Ding, L.; Cheng, J.; Lu, H.; Yue, L.; Zhou, J.; Cen, K. Three-stage gaseous biofuel production combining dark hydrogen, photo hydrogen, and methane fermentation using wet Arthrospira platensis cultivated under high CO2 and sodium stress. Energy Convers. Manag. 2017, 148, 394–404. [Google Scholar] [CrossRef]
- Zhu, B.; Xiao, T.; Shen, H.; Li, Y.; Ma, X.; Zhao, Y.; Pan, K. Effects of CO2 concentration on carbon fixation capability and production of valuable substances by Spirulina in a columnar photobioreactor. Algal Res. 2021, 56, 102310. [Google Scholar] [CrossRef]
- Saratale, R.G.; Ponnusamy, V.K.; Jeyakumar, R.B.; Sirohi, R.; Piechota, G.; Shobana, S.; Dharmaraja, J.; Lay, C.; Saratale, G.D.; Shin, H.S.; et al. Microalgae cultivation strategies using cost–effective nutrient sources: Recent updates and progress towards biofuel production. Bioresour. Technol. 2022, 361, 127691. [Google Scholar] [CrossRef]
- Gordillo, F.J.; Goutx, M.; Figueroa, F.L.; Niell, F.X. Effects of light intensity, CO2 and nitrogen supply on lipid class composition of Dunaliella viridis. J. Appl. Phycol. 1998, 10, 135–144. [Google Scholar] [CrossRef]
- Xu, S.; Hu, S.; Zhu, K.; Liu, Y.; Wang, S.; Chen, H.; Barati, B.; Lakshmikandan, M. Effects of CO2 concentration and light intensity on macromolecules accumulation of Micractinium sp. Biomass-Bioenergy 2022, 163, 106522. [Google Scholar] [CrossRef]
- Razzak, S.A.; Lucky, R.A.; Hossain, M.M.; Delasa, H. Valorization of Microalgae Biomass to Biofuel Production: A review. Energy Nexus 2022, 7, 100139. [Google Scholar] [CrossRef]
- Chisti, Y. Biodiesel from microalgae. Biotechnol. Adv. 2007, 25, 294–306. [Google Scholar] [CrossRef]
- Lam, M.K.; Lee, K.T. Microalgae biofuels: A critical review of issues, problems and the way forward. Biotechnol. Adv. 2012, 30, 673–690. [Google Scholar] [CrossRef]
- Mathimani, T.; Mallick, N. A review on the hydrothermal processing of microalgal biomass to bio-oil—Knowledge gaps and recent advances. J. Clean. Prod. 2019, 217, 69–84. [Google Scholar] [CrossRef]
- Lachos-Perez, D.; Torres-Mayanga, P.C.; Abaide, E.R.; Zabot, G.L.; De Castilhos, F. Hydrothermal carbonization and Liquefaction: Differences, progress, challenges, and opportunities. Bioresour. Technol. 2022, 343, 126084. [Google Scholar] [CrossRef]
- Tekin, K.; Karagöz, S.; Bektaş, S. A review of hydrothermal biomass processing. Renew. Sustain. Energy Rev. 2014, 40, 673–687. [Google Scholar] [CrossRef]
- Gollakota, A.; Kishore, N.; Gu, S. A review on hydrothermal liquefaction of biomass. Renew. Sustain. Energy Rev. 2018, 81, 1378–1392. [Google Scholar] [CrossRef]
- Chunzhuk, E.A.; Grigorenko, A.V.; Chernova, N.I.; Kiseleva, S.V.; Ryndin, K.G.; Popel, O.S.; Malaniy, S.Y.; Slavkina, O.V.; de Farias Neves, F.; Leng, L.; et al. Direct Study of CO2 Capture Efficiency during Microalgae Arthrospira platensis Cultivation at High CO2 Concentrations. Energies 2023, 16, 822. [Google Scholar] [CrossRef]
- Grigorenko, A.V.; Vlaskin, M.S.; Kotelev, M.S.; Ivanov, E.V. Two-step separation of bio-oil from condensed products of hydrothermal liquefaction of microalgae. J. Phys. Conf. Ser. 2018, 1111, 012057. [Google Scholar] [CrossRef]
- Vlaskin, M.S.; Kostyukevich, Y.I.; Vladimirov, G.N.; Chernova, N.I.; Kiseleva, S.V.; Grigorenko, A.V.; Nikolaev, E.N.; Popel, O.S.; Zhuk, A.Z. Chemical composition of bio-oil obtained via hydrothermal liquefaction of Arthrospira platensis biomass. High Temp. 2018, 56, 915–920. [Google Scholar] [CrossRef]
- Jena, U.; Das, K.; Kastner, J. Effect of operating conditions of thermochemical liquefaction on biocrude production from Spirulina platensis. Bioresour. Technol. 2011, 102, 6221–6229. [Google Scholar] [CrossRef] [PubMed]
- Folch, J.; Lees, M.; Stanley, G.H.S. A simple method for the isolation and purification of total lipids from animal tissues. J. Biol. Chem. 1957, 226, 497–509. [Google Scholar] [CrossRef]
- Dawson, R.; Elliott, D.C.; Elliott, W.H.; Jones, L.M. Handbook on Biochemistry. Oxford University Press: Oxford, UK, 1986. [Google Scholar]
- Dubois, M.; Gilles, K.A.; Hamilton, J.K.; Rebers, P.A.; Smith, F. Colorimetric method for determination of sugars and related substances. Anal. Chem. 1956, 28, 350–356. [Google Scholar] [CrossRef]
- Vlaskin, M.S.; Kiselevaa, S.V.; Chernovaa, N.I.; Grigorenko, A.V.; Ryndin, K.G.; Popel’, O.S.; Malanii, S.Y.; Slavkin, O.V.; de Farias Naves, F.; Kumar, V. Effectiveness of CO2 Capture by Arthrospira platensis Microalgae from a Mixture Simulating Flue Gases. Therm. Eng. 2023, 70, 370–383. [Google Scholar] [CrossRef]
- Almomani, F.; Al Ketife, A.; Judd, S.; Shurair, M.; Bhosale, R.R.; Znad, H.; Tawalbeh, M. Impact of CO2 concentration and ambient conditions on microalgal growth and nutrient removal from wastewater by a photobioreactor. Sci. Total. Environ. 2019, 662, 662–671. [Google Scholar] [CrossRef]
- Radmann, E.M.; Camerini, F.V.; Santos, T.D.; Costa, J.A.V. Isolation and application of SOX and NOX resistant microalgae in biofixation of CO2 from thermoelectricity plants. Energy Convers. Manag. 2011, 52, 3132–3136. [Google Scholar] [CrossRef]
- Zhu, B.; Shen, H.; Li, Y.; Liu, Q.; Jin, G.; Han, J.; Zhao, Y.; Pan, K. Large-scale cultivation of Spirulina for biological CO2 mitigation in open raceway ponds using purified CO2 from a coal chemical flue gas. Front. Bioeng. Biotechnol. 2020, 7, 441. [Google Scholar] [CrossRef]
- Matsudo, M.C.; Bezerra, R.P.; Sato, S.; Converti, A.; de Carvalho, J.C.M. Photosynthetic Efficiency and Rate of CO2 Assimilation by Arthrospira (Spirulina) platensis Continuously Cultivated in a Tubular Photobioreactor; WILEY-VCH Verlag: Weinheim, Germany, 2012; Volume 7, pp. 1412–1417. [Google Scholar]
- Almomani, F.; Judd, S.; Bhosale, R.R.; Shurair, M.; Aljaml, K.; Khraisheh, M. Intergraded wastewater treatment and carbon bio-fixation from flue gases using Spirulina platensis and mixed algal culture. Process Saf. Environ. Prot. 2019, 124, 240–250. [Google Scholar] [CrossRef]
- da Rosa, G.M.; Moraes, L.; Cardias, B.B.; de Souza, M.d.R.A.Z.; Costa, J.A.V. Chemical absorption and CO2 biofixation via the cultivation of Spirulina in semicontinuous mode with nutrient recycle. Bioresour. Technol. 2015, 192, 321–327. [Google Scholar] [CrossRef] [PubMed]
- Moraes, L.; da Rosa, G.M.; Cardias, B.B.; dos Santos, L.O.; Costa, J.A.V. Microalgal biotechnology for greenhouse gas control: Carbon dioxide fixation by Spirulina sp. at different diffusers. Ecol. Eng. 2016, 91, 426–431. [Google Scholar] [CrossRef]
- Chen, H.-W.; Yang, T.-S.; Chen, M.-J.; Chang, Y.-C.; Lin, C.-Y.; Eugene, I.; Wang, E.I.-C.; Ho, C.-L.; Huang, K.-M.; Yu, C.-C.; et al. Application of power plant flue gas in a photobioreactor to grow Spirulina algae, and a bioactivity analysis of the algal water-soluble polysaccharides. Bioresour. Technol. 2012, 120, 256–263. [Google Scholar] [CrossRef]
- Guo, Y.; Yeh, T.; Song, W.; Xu, D.; Wang, S. A review of bio-oil production from hydrothermal liquefaction of algae. Renew. Sustain. Energy Rev. 2015, 48, 776–790. [Google Scholar] [CrossRef]
- Liu, W.; Wang, J.; Liu, T. Low pH rather than high CO2 concentration itself inhibits growth of Arthrospira. Sci. Total. Environ. 2019, 666, 572–580. [Google Scholar] [CrossRef]
- Iamtham, S.; Sornchai, P. Biofixation of CO2 from a power plant through large-scale cultivation of Spirulina maxima. S. Afr. J. Bot. 2022, 147, 840–851. [Google Scholar] [CrossRef]
- Duarte, J.H.; de Morais, E.G.; Radmann, E.M.; Costa, J.A.V. Biological CO2 mitigation from coal power plant by Chlorella fusca and Spirulina sp. Bioresour. Technol. 2017, 234, 472–475. [Google Scholar] [CrossRef] [PubMed]
- Ragaza, J.A.; Hossain, S.; Meiler, K.A.; Velasquez, S.F.; Kumar, V. A review on Spirulina: Alternative media for cultivation and nutritive value as an aquafeed. Rev. Aquac. 2020, 12, 2371–2395. [Google Scholar] [CrossRef]
- Kim, Y.S.; Lee, S.-H. Quantitative analysis of Spirulina platensis growth with CO2 mixed aeration. Environ. Eng. Res. 2018, 23, 216–222. [Google Scholar] [CrossRef]
- Naď, M.; Brummer, V.; Lošák, P.; Máša, V.; Sukačová, K.; Tatarová, D.; Pernica, M.; Procházková, M. Waste-to-energy plants flue gas CO2 mitigation using a novel tubular photobioreactor while producing Chlorella algae. J. Clean. Prod. 2023, 385, 135721. [Google Scholar] [CrossRef]
- Vlaskin, M.S.; Grigorenko, A.V.; Kotelev, M.S.; Kopitsyn, D.S.; Mazurova, K.M.; Ivanov, E.V. Composition and properties of microalgae biomass hydrothermal liquefaction products. Chem. Technol. Fuels Oils 2019, 55, 373–377. [Google Scholar] [CrossRef]
- López Barreiro, D.; Prins, W.; Ronsse, F.; Brilman, W. Hydrothermal liquefaction (HTL) of microalgae for biofuel production: State of the art review and future prospects. Biomass-Bioenergy 2013, 53, 113–127. [Google Scholar] [CrossRef]
- Swetha, A.; ShriVigneshwar, S.; Gopinath, K.P.; Sivaramakrishnan, R.; Shanmuganathan, R.; Arun, J. Review on hydrothermal liquefaction aqueous phase as a valuable resource for biofuels, bio-hydrogen and valuable bio-chemicals recovery. Chemosphere 2021, 283, 131248. [Google Scholar] [CrossRef]
- Kandasamy, S.; Zhang, B.; He, Z.; Bhuvanendran, N.; El-Seesy, A.I.; Wang, Q.; Narayanan, M.; Thangavel, P.; Dar, M.A. Microalgae as a multipotential role in commercial applications: Current scenario and future perspectives. Fuel 2022, 308, 122053. [Google Scholar] [CrossRef]
- Ni Law, X.; Cheah, W.Y.; Chew, K.W.; Ibrahim, M.F.; Park, Y.-K.; Ho, S.-H.; Show, P.L. Microalgal-based biochar in wastewater remediation: Its synthesis, characterization and applications. Environ. Res. 2022, 204, 111966. [Google Scholar] [CrossRef]
- Goswami, R.K.; Agrawal, K.; Upadhyaya, H.M.; Gupta, V.K.; Verma, P. Microalgae conversion to alternative energy, operating environment and economic footprint: An influential approach towards energy conversion, and management. Energy Convers. Manag. 2022, 269, 116118. [Google Scholar] [CrossRef]
- Moshood, T.D.; Nawanir, G.; Mahmud, F. Microalgae biofuels production: A systematic review on socioeconomic prospects of microalgae biofuels and policy implications. Environ. Challenges 2021, 5, 100207. [Google Scholar] [CrossRef]
- Wang, S.; Mukhambet, Y.; Esakkimuthu, S. Integrated microalgal biorefinery–Routes, energy, economic and environmental perspectives. J. Clean. Prod. 2022, 348, 131245. [Google Scholar] [CrossRef]
- Simnofske, D.; Mollenhauer, K. Precision of iatroscan method for assessment of SARA compounds in bitumen. In RILEM 252-CMB Symposium: Chemo-Mechanical Characterization of Bituminous Materials; Springer International Publishing: Berlin/Heidelberg, Germany, 2019; pp. 162–167. [Google Scholar]
- Germi, F.; Gabdushev, B.; Zakiyev, T. Karachaganak field–innovational method of direct determination of saturates–waxes–aromatics–resins–asphaltens by TLC-FID technique. Chem. Bull. Kazakh Natl. Univ. 2011, 61, 223–229. [Google Scholar]
- Meermann, B.; Nischwitz, V. ICP-MS for the analysis at the nanoscale—A tutorial review. J. Anal. At. Spectrom. 2018, 33, 1432–1468. [Google Scholar] [CrossRef]
- Gondal, M.; Hussain, T.; Yamani, Z.; Baig, M. Detection of heavy metals in Arabian crude oil residue using laser induced breakdown spectroscopy. Talanta 2006, 69, 1072–1078. [Google Scholar] [CrossRef]
- Adebiyi, F.M.; Ore, O.T.; Akhigbe, G.E.; Adegunwa, A.O. Metal fractionation in the soils around a refined petroleum products depot. Environ. Forensics 2020, 21, 121–131. [Google Scholar] [CrossRef]
- Oyewole, F.G.; Adebiyi, F.M. Total and speciation analyses of heavy metals in the sand fraction of Nigerian oil sands for human and ecological risk assessment. Hum. Ecol. Risk Assess. Int. J. 2017, 23, 2046–2068. [Google Scholar] [CrossRef]
- Nanda, S.; Pattnaik, F.; Borugadda, V.B.; Dalai, A.K.; Kozinski, J.A.; Naik, S. Catalytic and noncatalytic upgrading of bio-oil to synthetic fuels: An introductory review. Catal. Noncatalytic Upgrad. Oils 2021, 1379, 1–28. [Google Scholar] [CrossRef]
- Nguyen, H.K.D.; Pham, V.V.; Do, H.T. Preparation of Ni/biochar catalyst for hydrotreating of bio-oil from microalgae biomass. Catal. Lett. 2016, 146, 2381–2391. [Google Scholar] [CrossRef]
- Duan, P.; Savage, P.E. Hydrothermal liquefaction of a microalga with heterogeneous catalysts. Ind. Eng. Chem. Res. 2011, 50, 52–61. [Google Scholar] [CrossRef]
Disclaimer/Publisher’s Note: The statements, opinions and data contained in all publications are solely those of the individual author(s) and contributor(s) and not of MDPI and/or the editor(s). MDPI and/or the editor(s) disclaim responsibility for any injury to people or property resulting from any ideas, methods, instructions or products referred to in the content. |
© 2023 by the authors. Licensee MDPI, Basel, Switzerland. This article is an open access article distributed under the terms and conditions of the Creative Commons Attribution (CC BY) license (https://creativecommons.org/licenses/by/4.0/).