1. Introduction
Buildings may be subjected to a variety of accidental loads throughout their design service life, such as collisions, impacts, and explosions. Examples include the impact caused by a precast component falling while hoisting a lower component, or the impact caused by stones rolling onto buildings in mountainous areas. These loads, with their short durations and high peak values, pose a threat to the structural safety of a building. Impact loads should be taken into account in structural designs using reinforced concrete beams in particular situations to prevent catastrophic structural progressive collapse, and the impact resistance of existing structural parts should be evaluated. Therefore, it is important to perform research on the impact resistance of building materials. Precast concrete (PC) is gaining popularity in infrastructure and building projects due to its widespread use in residential and commercial structures, tunnels, bridges, metro stations, and roads. Its advantages include faster construction, enhanced quality control, reduced construction waste, and improved durability and stability, which reduces the reliance on labor and materials used in traditional concrete construction. Additionally, investigations on precast reinforced concrete composite beams strengthened by adhesive steel are few in comparison to the studies on cast−in−place reinforced concrete beams. Research conducted on the seismic performance, impact resistance, damage modes, and associated damage mechanisms of precast assembled concrete stacked beams reinforced with viscous steel is therefore practically important for actual engineering designs and safety assessments.
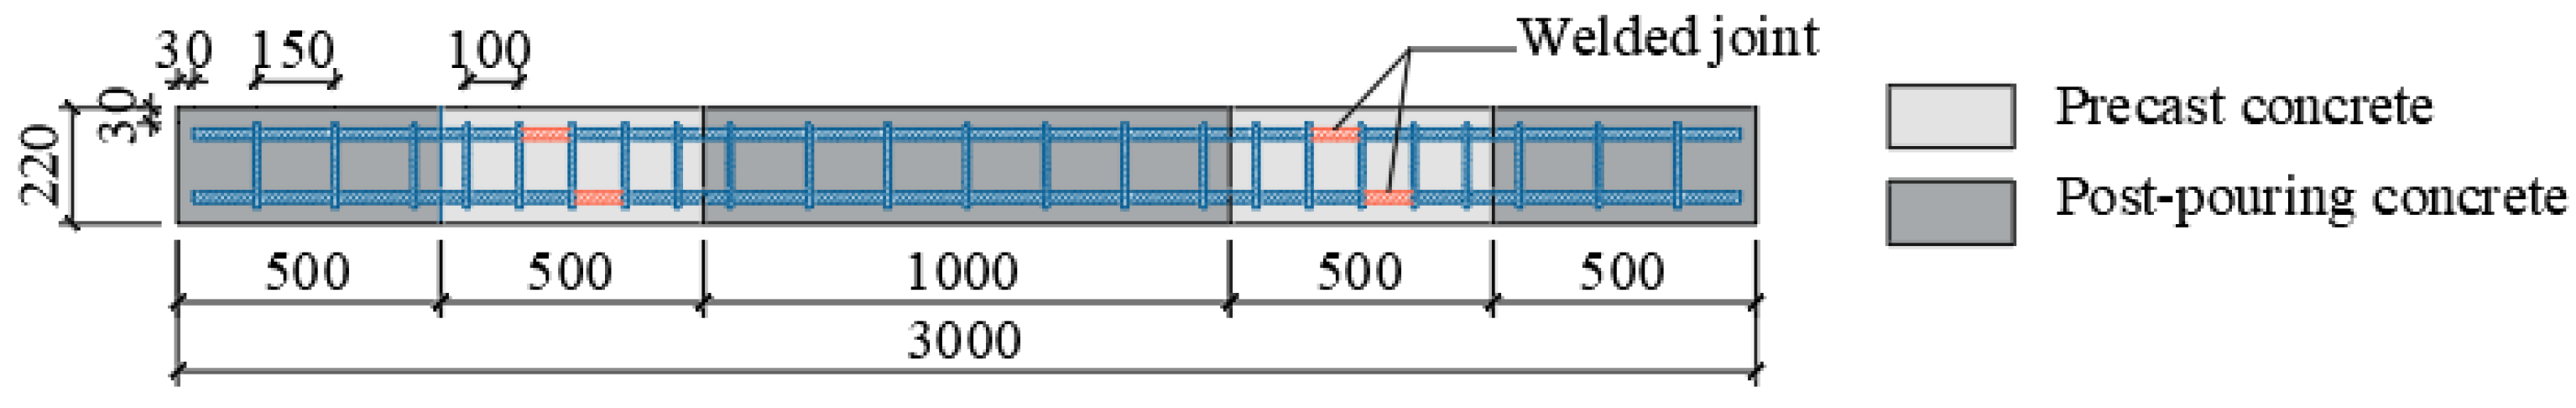
Many scholars have conducted experimental investigations on the impact resistance of reinforced concrete (RC) beams cast in place and precast reinforced concrete (PC) beams. Zhou et al. [
1] and Yoo et al. [
2,
3] conducted experimental studies to investigate the impact resistance of reinforced concrete (RC) beams and ultra−high−performance concrete (UHPC is further researched and developed on the basis of traditional concrete with greater strength, better durability, and a superior engineering performance) beams with varying reinforcement ratios. It was found that increasing the reinforcement ratio could make a beam more rigid overall, reduce damage and displacement, and make components more impact−resistant. Jin et al. [
4] employed a 3D mesoscopic simulation approach, accounting for concrete heterogeneities, to investigate the effect of the hoop ratio on the impact resistance of the member. Their findings indicate that the hoop ratio has a negligible impact on the mid−span deflection of the beam under the impact load. Ozbolt et al. [
5] performed a finite−element study on reinforced concrete beams with different hoop ratios and showed that the configuration of hoops was able to limit the development of diagonal cracks in the beam web. Yu et al. [
6] performed drop weight impact tests on 15 RC beams and investigated the impact resistance of these beams by studying the effect of the cross−section size. The authors discovered that when the cross−section size of a beam was increased, the stiffness was affected, which in turn led to an increase in the impact force. However, this increase in the impact force leads to a decrease in the peak and residual values of a mid−span displacement. Jia et al. [
7] conducted the drop weight impact tests of UHPC and normal RC beams, and observed that UHPC beams had better impact resistance. Wei et al. [
8] proposed a strengthening design method, in which an additional ultra−high−performance concrete (UHPC) layer was used to improve the impact resistance of the RC beam and found that the UHPC layer could absorb part of the impact energy in the early stage of the impact process to improve the impact resistance of the test beam. Moreover, the thicker the UHPC layer, the better the impact resistance. Yoo et al. [
2], Ulzurrun et al. [
9], and Mao et al. [
10] conducted drop weight impact tests to assess the impact resistance of beams composed of steel fiber−reinforced concrete (SFRC) or ultra−high−performance fiber−reinforced concrete (UHPFRC) as the main body. Their results showed that fiber−reinforced concrete beams demonstrated better impact resistance compared to non−fiber−reinforced concrete beams. Liao et al. [
11] strengthened RC beams by using outsourced high−strength steel wire mesh and high−performance mortar (HSSWM−HPM), and then conducted impact performance tests on the reinforced RC beams. The test results showed that the impact resistance and ductility of RC beams significantly improved after being strengthened by HSSWM−HPM. Huang et al. [
12] investigated the effect of the strength of inorganic mineral polymer concrete materials and the reinforcement ratio of BERP rebars on the impact resistance of beams, and the results showed that too much or too little strength of the GPC materials as well as the use of BFRP rebars weakened the impact resistance of the beams. Damasceno et al. [
13] found that shorter steel fibers mixed into concrete, the distribution of steel fibers in the concrete in a way that could be more effective in inhibiting the development of cracks, when the energy used to cause the concrete cracking increases, the cracks can only be further expanded, so that the addition of fiber material to the concrete could enhance its compressive strength as well as toughness. Li et al. [
14] and Li et al. [
15] conducted a numerical simulation and parametric analysis on the model of Yan et al. [
16] and studied the effect of different strength grades of concrete and longitudinal steel rebar on the impact resistance of PC beams. It was discovered that as the strength grade of the precast concrete and longitudinal steel rebar increased, the impact resistance of the PC beams increased dramatically. Moreover, adopting a strengthening design with an additional UHPC layer poses several complications during the construction process, such as the need for formwork support, pouring, and formwork removal. Aykaç et al. [
17] conducted the reinforcement and testing of reinforced concrete T−section beams and performed flexural and flexural shear reinforcements on the test beams, respectively, and the results showed that the strength of the reinforced beams increased about 2.5 times; however, the test beams still had good ductility. Since the use of bonded steel strengthening technology to improve reinforced concrete beams’ flexural bearing capacity was proposed by scholars since the middle of the last century (Khouzam et al. [
18]; Thamrin and Sari [
19]; Alwis et al. [
20]; Rakgate et al. [
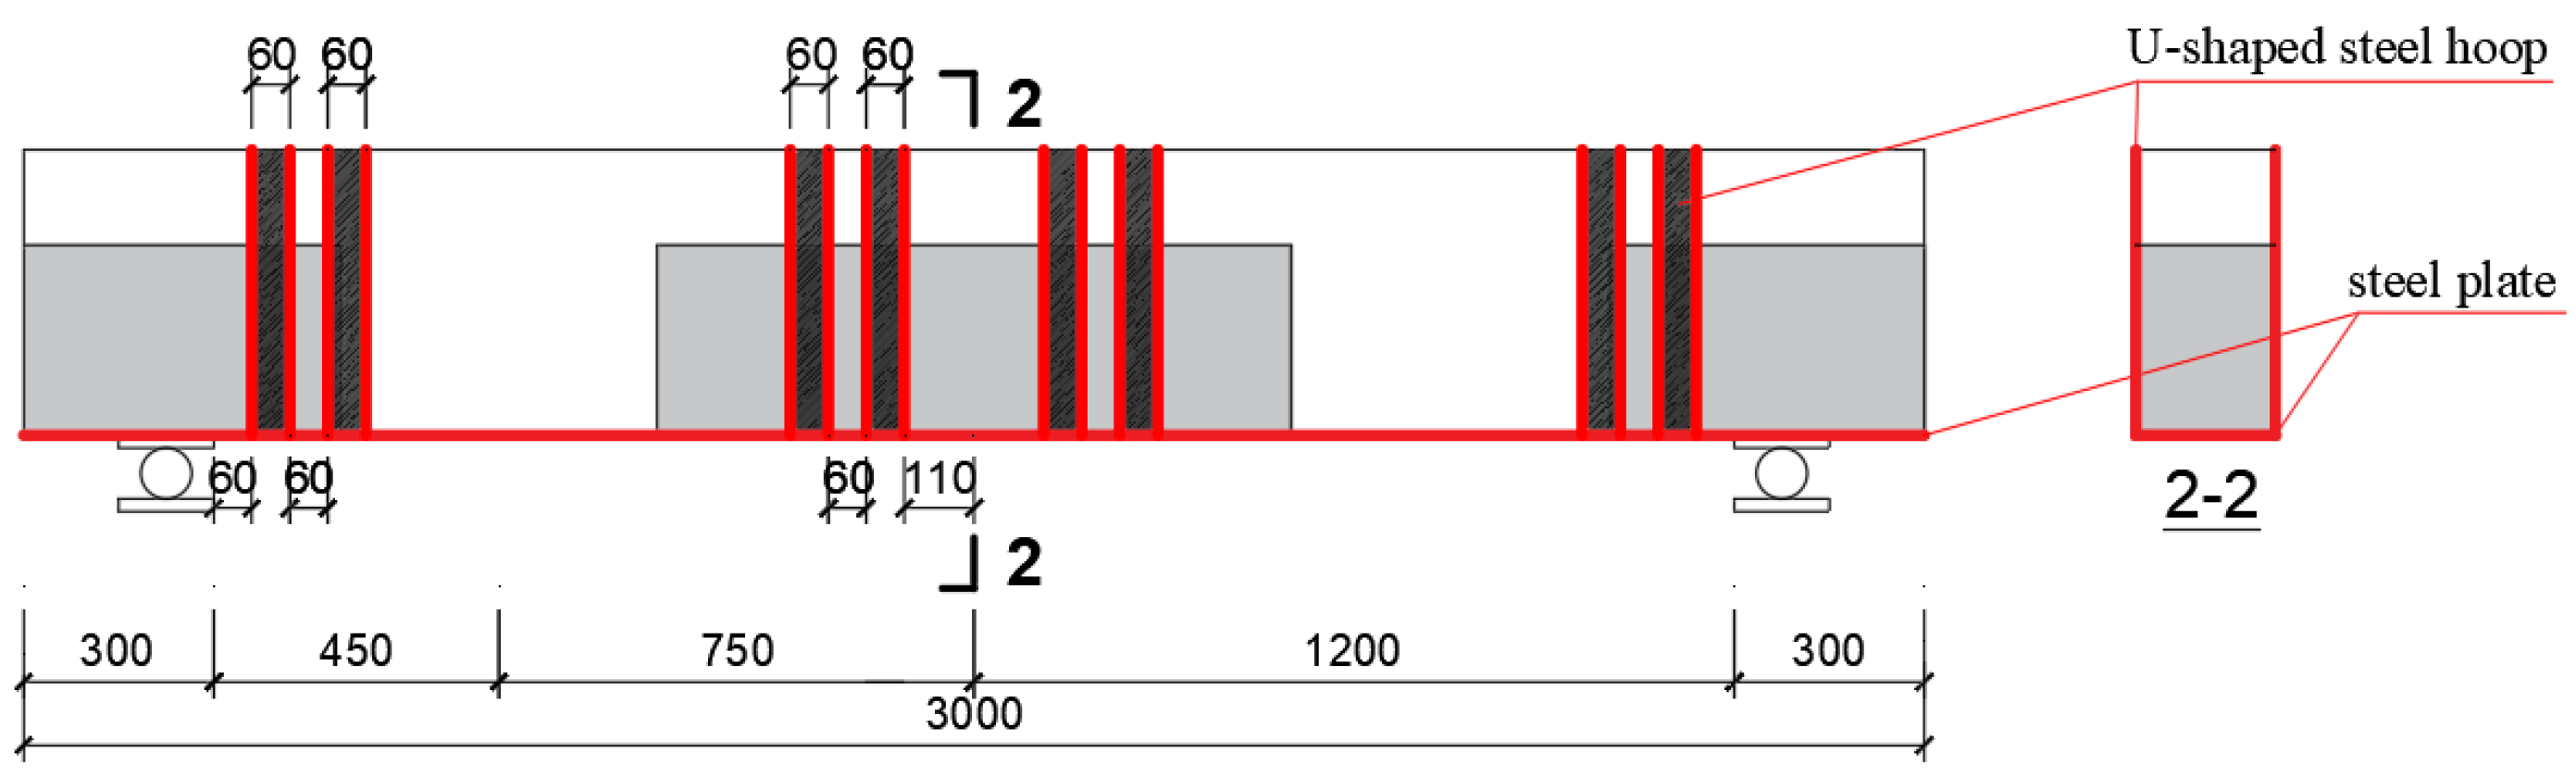
21]), it can be inferred that the impact resistance of reinforced concrete beams can also be improved through this technology. The impact resistance of partially precast concrete beams strengthened with bonded steel plates was investigated. This study designs one PC beam without strengthening and three PC beams strengthened with bonded steel plates for drop weight impact tests and residual flexural bearing capacity tests. In this paper, the impact resistance and residual flexural bearing capacity of test beams are examined in relation to the thickness of the pasted steel plate and whether or not the beam is strengthened by U−shaped steel plate hoops.
3. Result Analysis
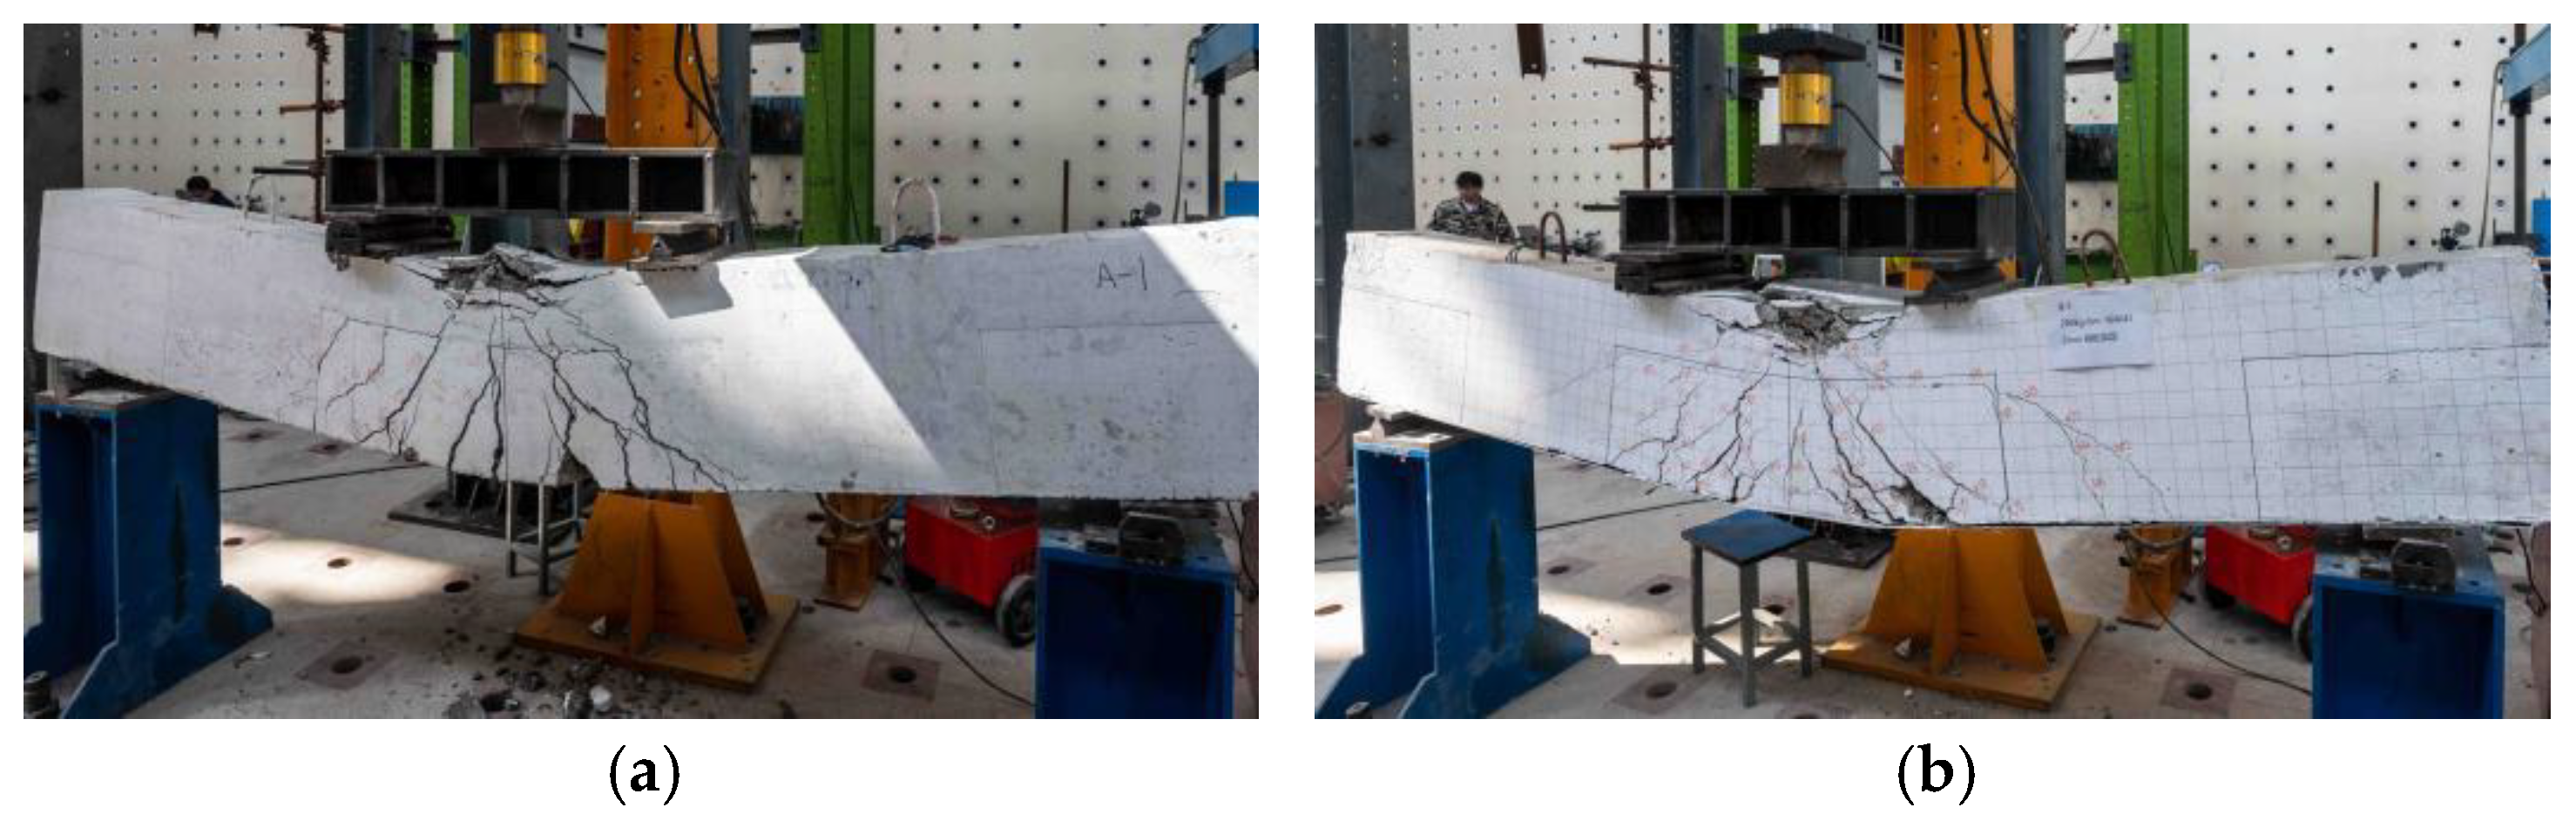
3.1. Failure Mode
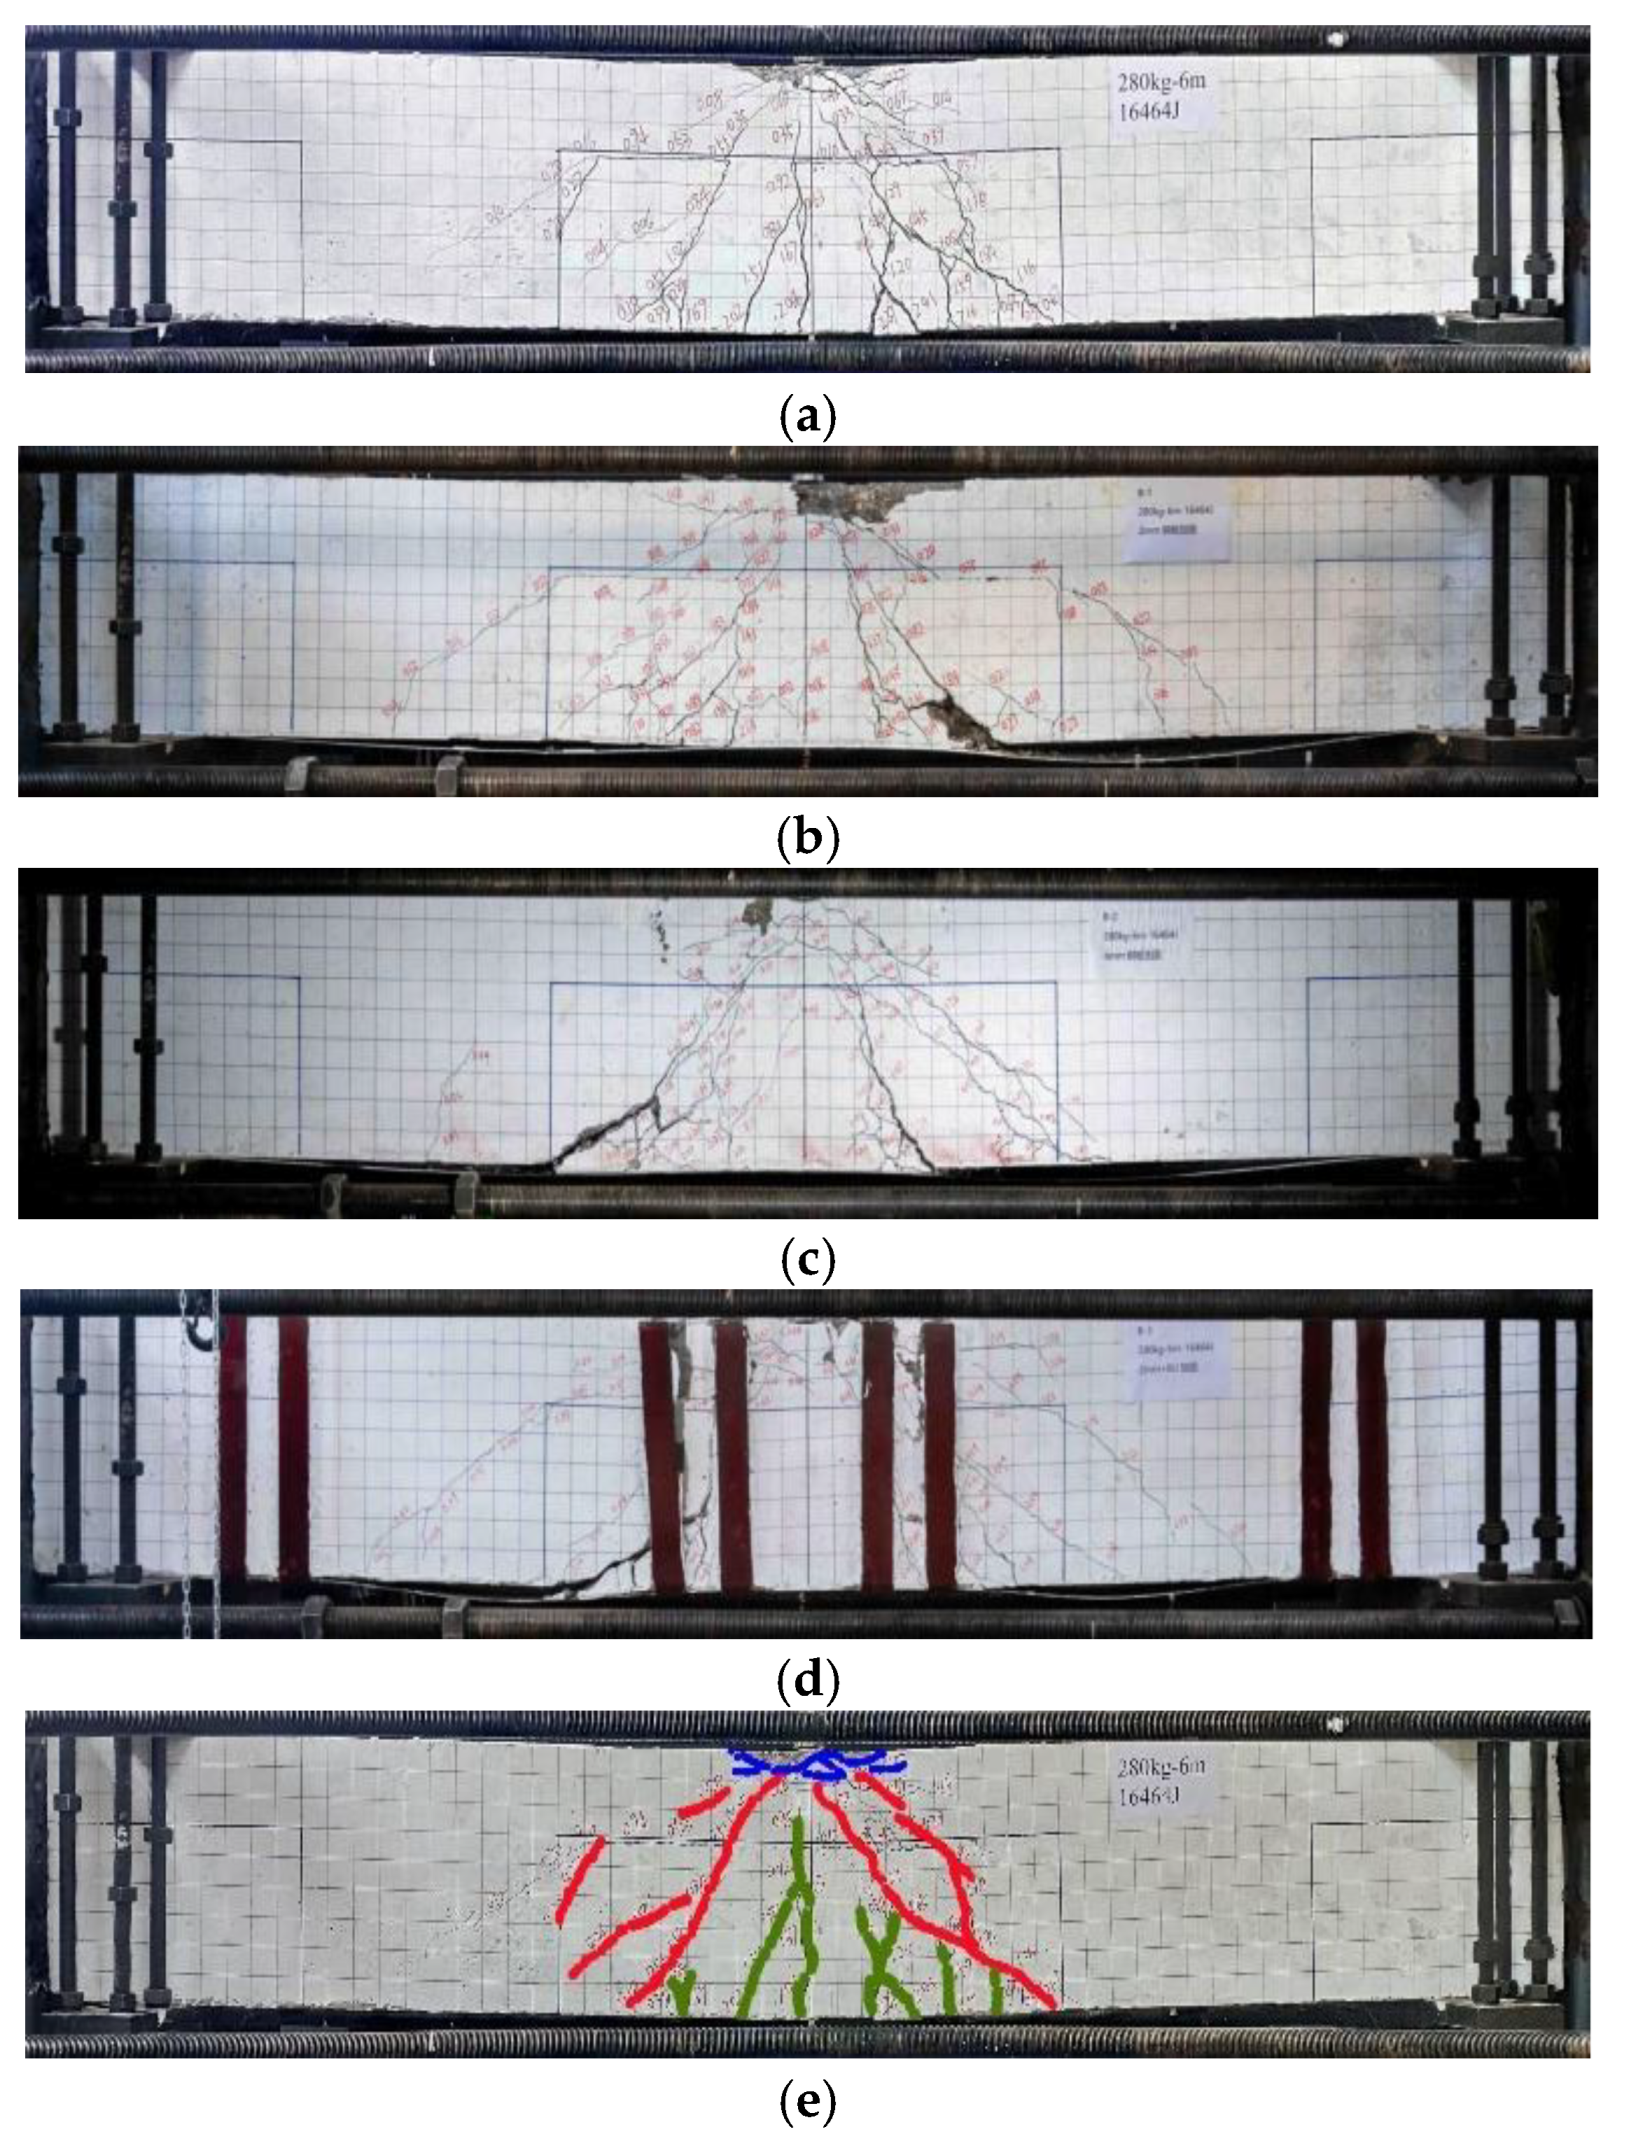
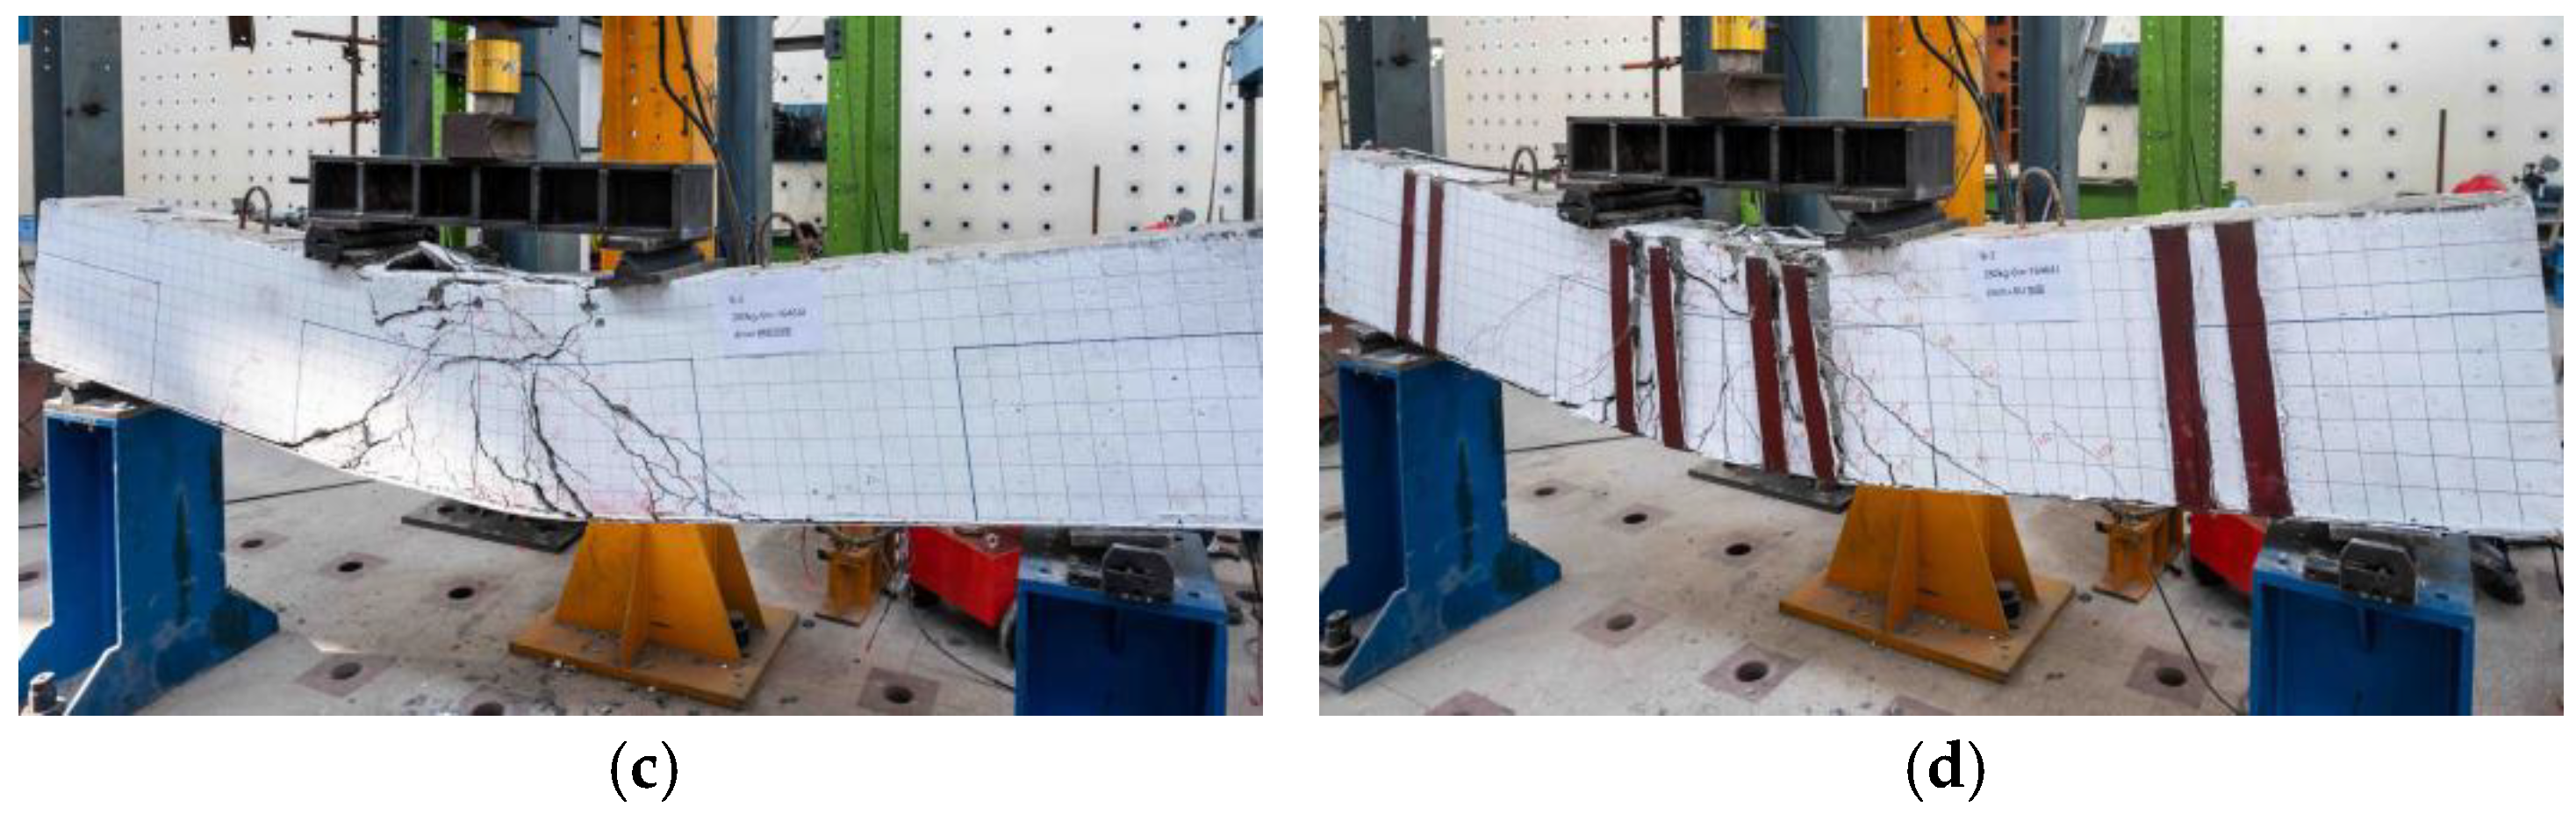
The images in
Figure 9a–d illustrate the failure mode of the prestressed concrete beam under an impact load in the middle of the span.
Figure 9e provides an illustration of different types of fractures. The red lines represent oblique abdominal shear cracks, the green lines represent bending cracks, and the blue lines represent compression cracks. In
Figure 10a–d, we illustrate a partial failure pattern diagram for the PC beam when subjected to mid−span impact stress. As can be seen in
Figure 10e, split cracks are represented by red lines while microcracks are represented by blue lines.
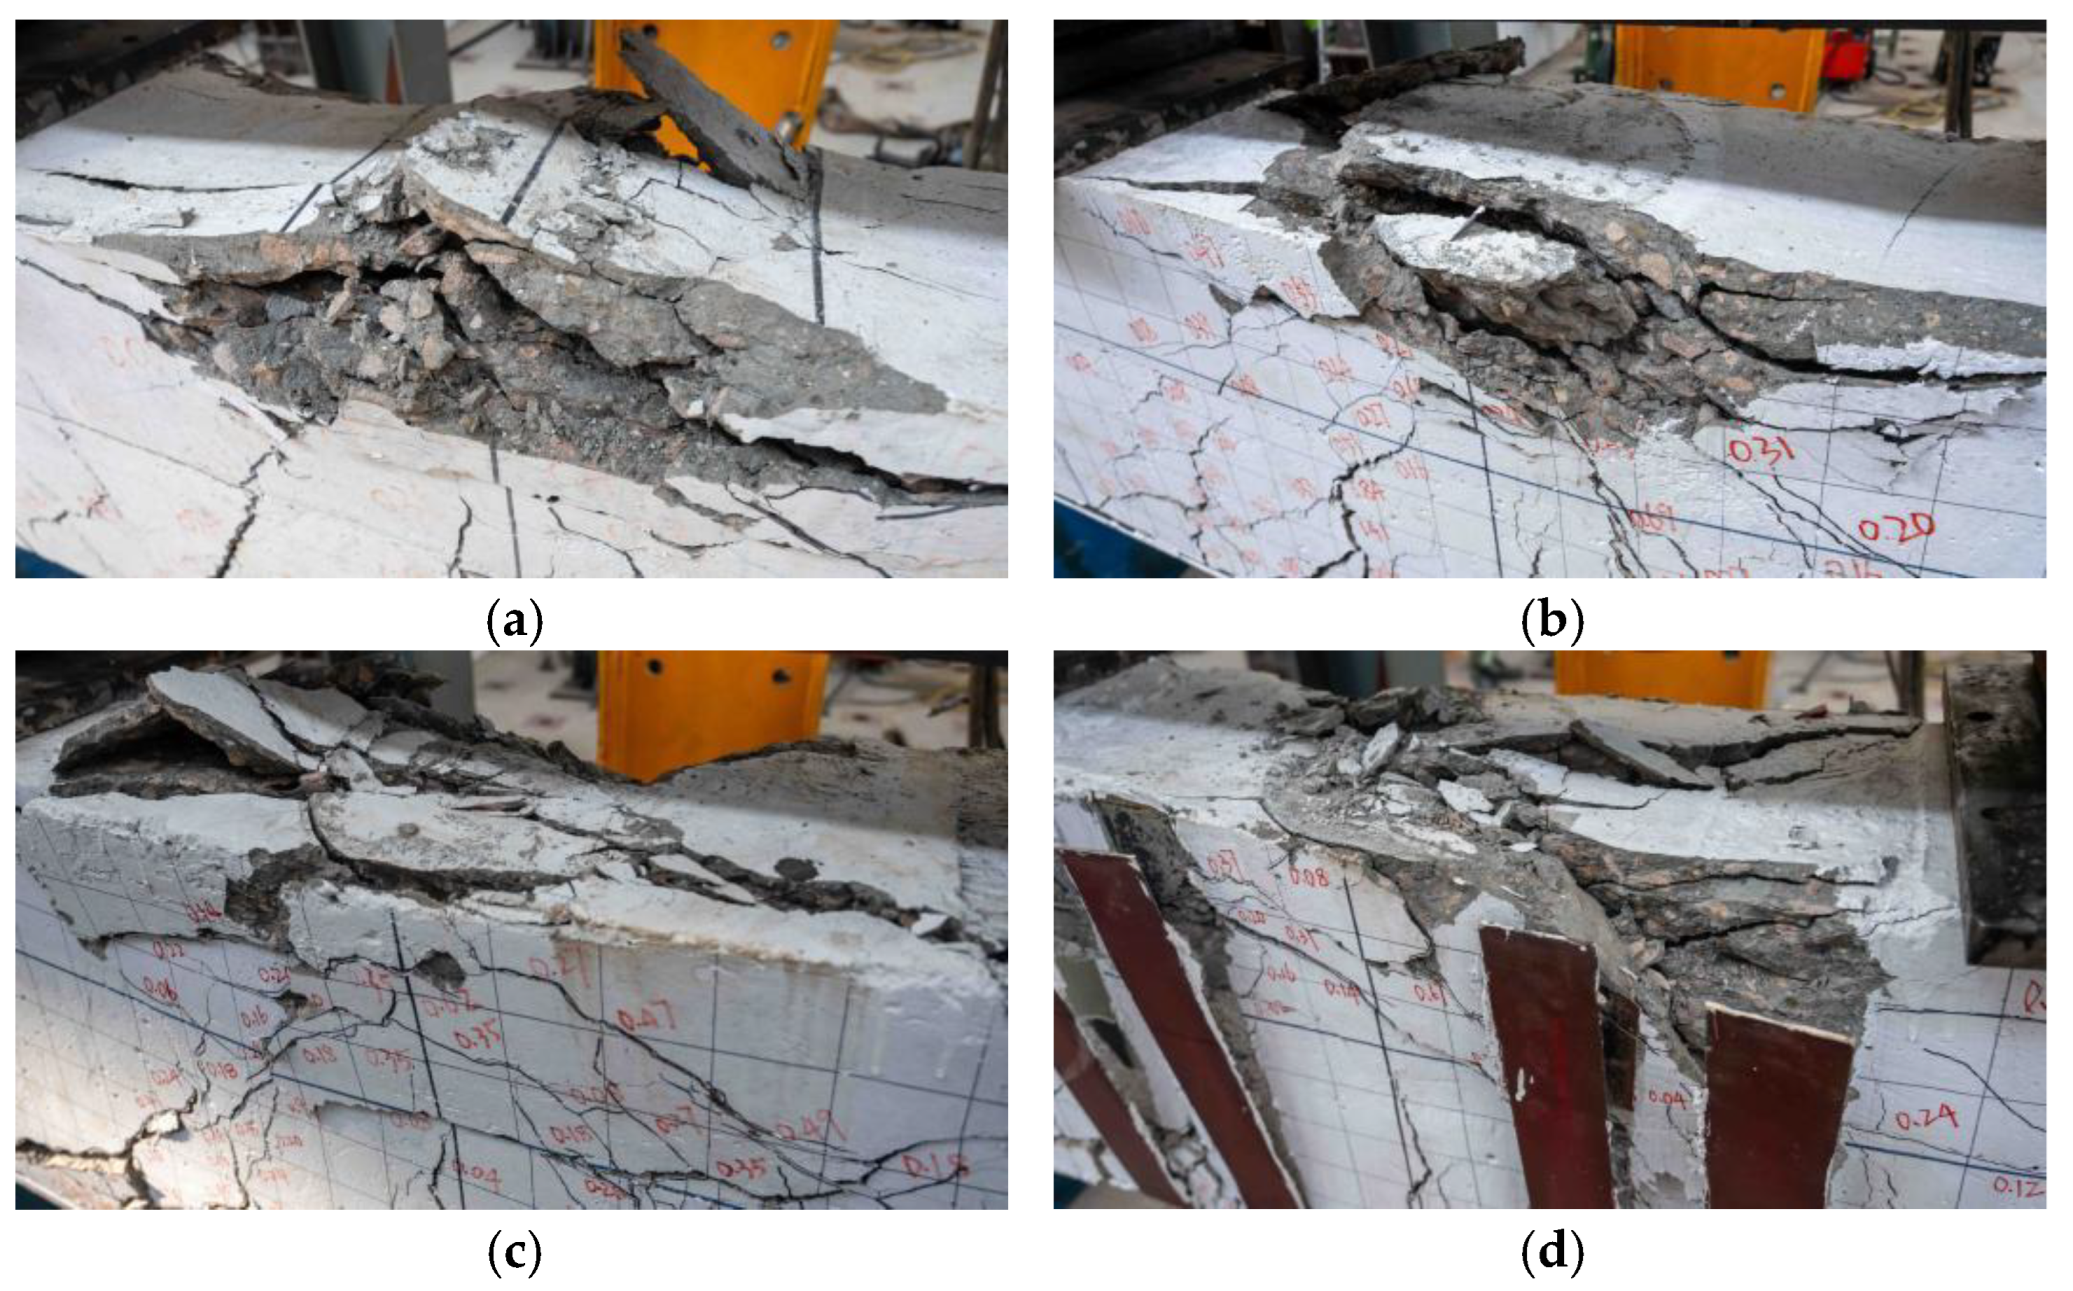
The test beams failed due to midpoint bending cracks and oblique shear cracks, which are characteristic of bending–shear failures. The cracks mainly appeared in the mid−span and splicing sections, indicating a pyramid−like dispersion from the downstream impact point. The failure modes in the vicinity of the hammerhead contact area were also roughly similar, mainly manifested as the small−scale crushing and shedding of concrete in this area. At the same time, there were many splitting cracks, and this damage was mainly manifested by the lateral tearing of the concrete cover at the impact point.
The A1 test beam was a test beam without reinforcement. There were no apparent cracks in the impact area of the top of the beam; however, a large area of concrete samples fell off from both sides of the beam, and the length of the falling concrete samples was long (about 45 cm). The cracks in the beam web were mainly oblique flexural shear cracks and upwardly developed flexural cracks, including the bifurcation and intersection of the two types of cracks, and cracks appeared in the post−poured layer. Compared with the B1 and A1 test beams, the B1 test beam was strengthened with a 2 mm−thick steel plate, and the concrete samples on both sides hardly fell off in large areas. On the left side of the hammerhead impact point, there was an apparent crushing and dislocation of the concrete sample. The concrete in this area was powdery, and an obvious splitting crack appeared through the impact point and the left concrete crushing area. The form of cracks in the mid−span beam was the same as that of the A1 test beam, the crack width was small, and the distribution range was wide. A new failure mode was observed at the lower part of the beam, which was mainly characterized by the partial separation of the bonded steel plate and separation between the steel plate and concrete. This resuled in an oblique separation failure of the concrete cover at the lower part of the test beam. The B2 test beam was strengthened with a 4 mm−thick steel plate at the bottom of the beam. In contrast to the A1 test beam, there was more severe damage to the contact surface. At the same time, the concrete in part of the contact area was damaged in the form of a mesh, and two symmetrical split cracks appeared on both sides of the impact position, and the split cracks had a large width. The shape of the cracks in the mid−span beam was the same as that of A1. The crack width was small, and the distribution range was wide; however, there was no post−poured layer failure.
The thickness of the bonded steel plate at the bottom of both test beams B1 and B2 increased from 2 to 4 mm. The cracks in the B2 test beam were scattered over a larger area; however, the number of primary cracks decreased significantly. Comparing the B3 and A1 test beams, the B3 beam was strengthened with a 2 mm bottom steel plate and eight U−shaped steel plate hoops. Only a small piece of concrete, measuring 5 cm in length, came off the back of the B3 beam. Three split cracks with smaller widths and shorter lengths appeared simultaneously on the concrete surface in the impact area. U−shaped steel plate hoops peeled away from concrete in the area where they were bonded. U−shaped steel plate hoops, however, provided greater protection against oblique cracks due to their shearing impact, as demonstrated primarily by the reduction in the number of bending–shear oblique cracks and the reduction in the width of the bending–shear oblique cracks.
When U−shaped steel plate hoops were installed, the overall damage to the superimposed beam was significantly reduced. The presence of U−shaped steel plate hoops prevented the development of bending and oblique cracks, and the crack width decreased as compared to test beams B3 and B1. The failure forms on the beam side were quite different, and the B3 test beam had peeling damage at the interface between the U−shaped steel plate hoops and the concrete. With the installation of the U−shaped steel plate hoops, the local damage was slightly slowed down, and a small number of concrete samples fell off both sides of the contact area. The number of split cracks increased; however, the width decreased significantly and there was no fracturing or crushing of large−area concrete samples.
Comparing the number and width of cracks in different parts of the test beam, the crack width gradually increased from top to bottom, and there was no bending crack with a large width within 30 cm of the middle span of the test beam with reinforcement. However, due to the cable−stayed failure caused by the peeling of the steel plate, more significant cable−stayed cracks were generated. There were many dense microcracks at the top of the beam, and the crack width was the narrowest but accompanied by the collapse of the concrete cover. The cracks in the web of the beam were mainly composed of oblique flexural shear cracks generated by the web and flexural cracks extending from the bottom of the beam, and the crack width was wider than that of the top of the beam. There were not many cracks at the splicing points on either side of the mid−span, and their width matched that of the top of the mid−span beam.
Based on the aforementioned experimental phenomena, it can be concluded that in the unreinforced beams, their lower flexural stiffness resulted in a higher susceptibility to crack extension and concrete spalling in the case of bending–shear damage. However, for the test beams reinforced with steel plates at the bottom, this approach significantly increased the tensile capacity and stiffness of the beams in the face of bending–shear damage. This effectively reduced the tensile stresses at the bottom of the beams induced by the impact loads, thus slowing down the formation of the cracks. Meanwhile, the application of viscous steel reinforcement also effectively prevented the crack extension and further reduced the stress concentration around the crack. In addition, in the case where U−hoops were applied to the test beams, the presence of the U−hoops resulted in a certain degree of suppression of crack development at the bottom and sides of the beams when flexural−shear damage occurred. This effectively slowed down the cohesive damage and spalling of the concrete and helped to maintain the structural integrity of the beam.
In summary, steel plate reinforcement at the bottom and the installation of U−hoops had significant effects in enhancing the tensile capacity and stiffness of the beams, as well as preventing the extension of cracks under bending–shear damage scenarios. These reinforcements can better protect the integrity and performance of the beams under impact loading.
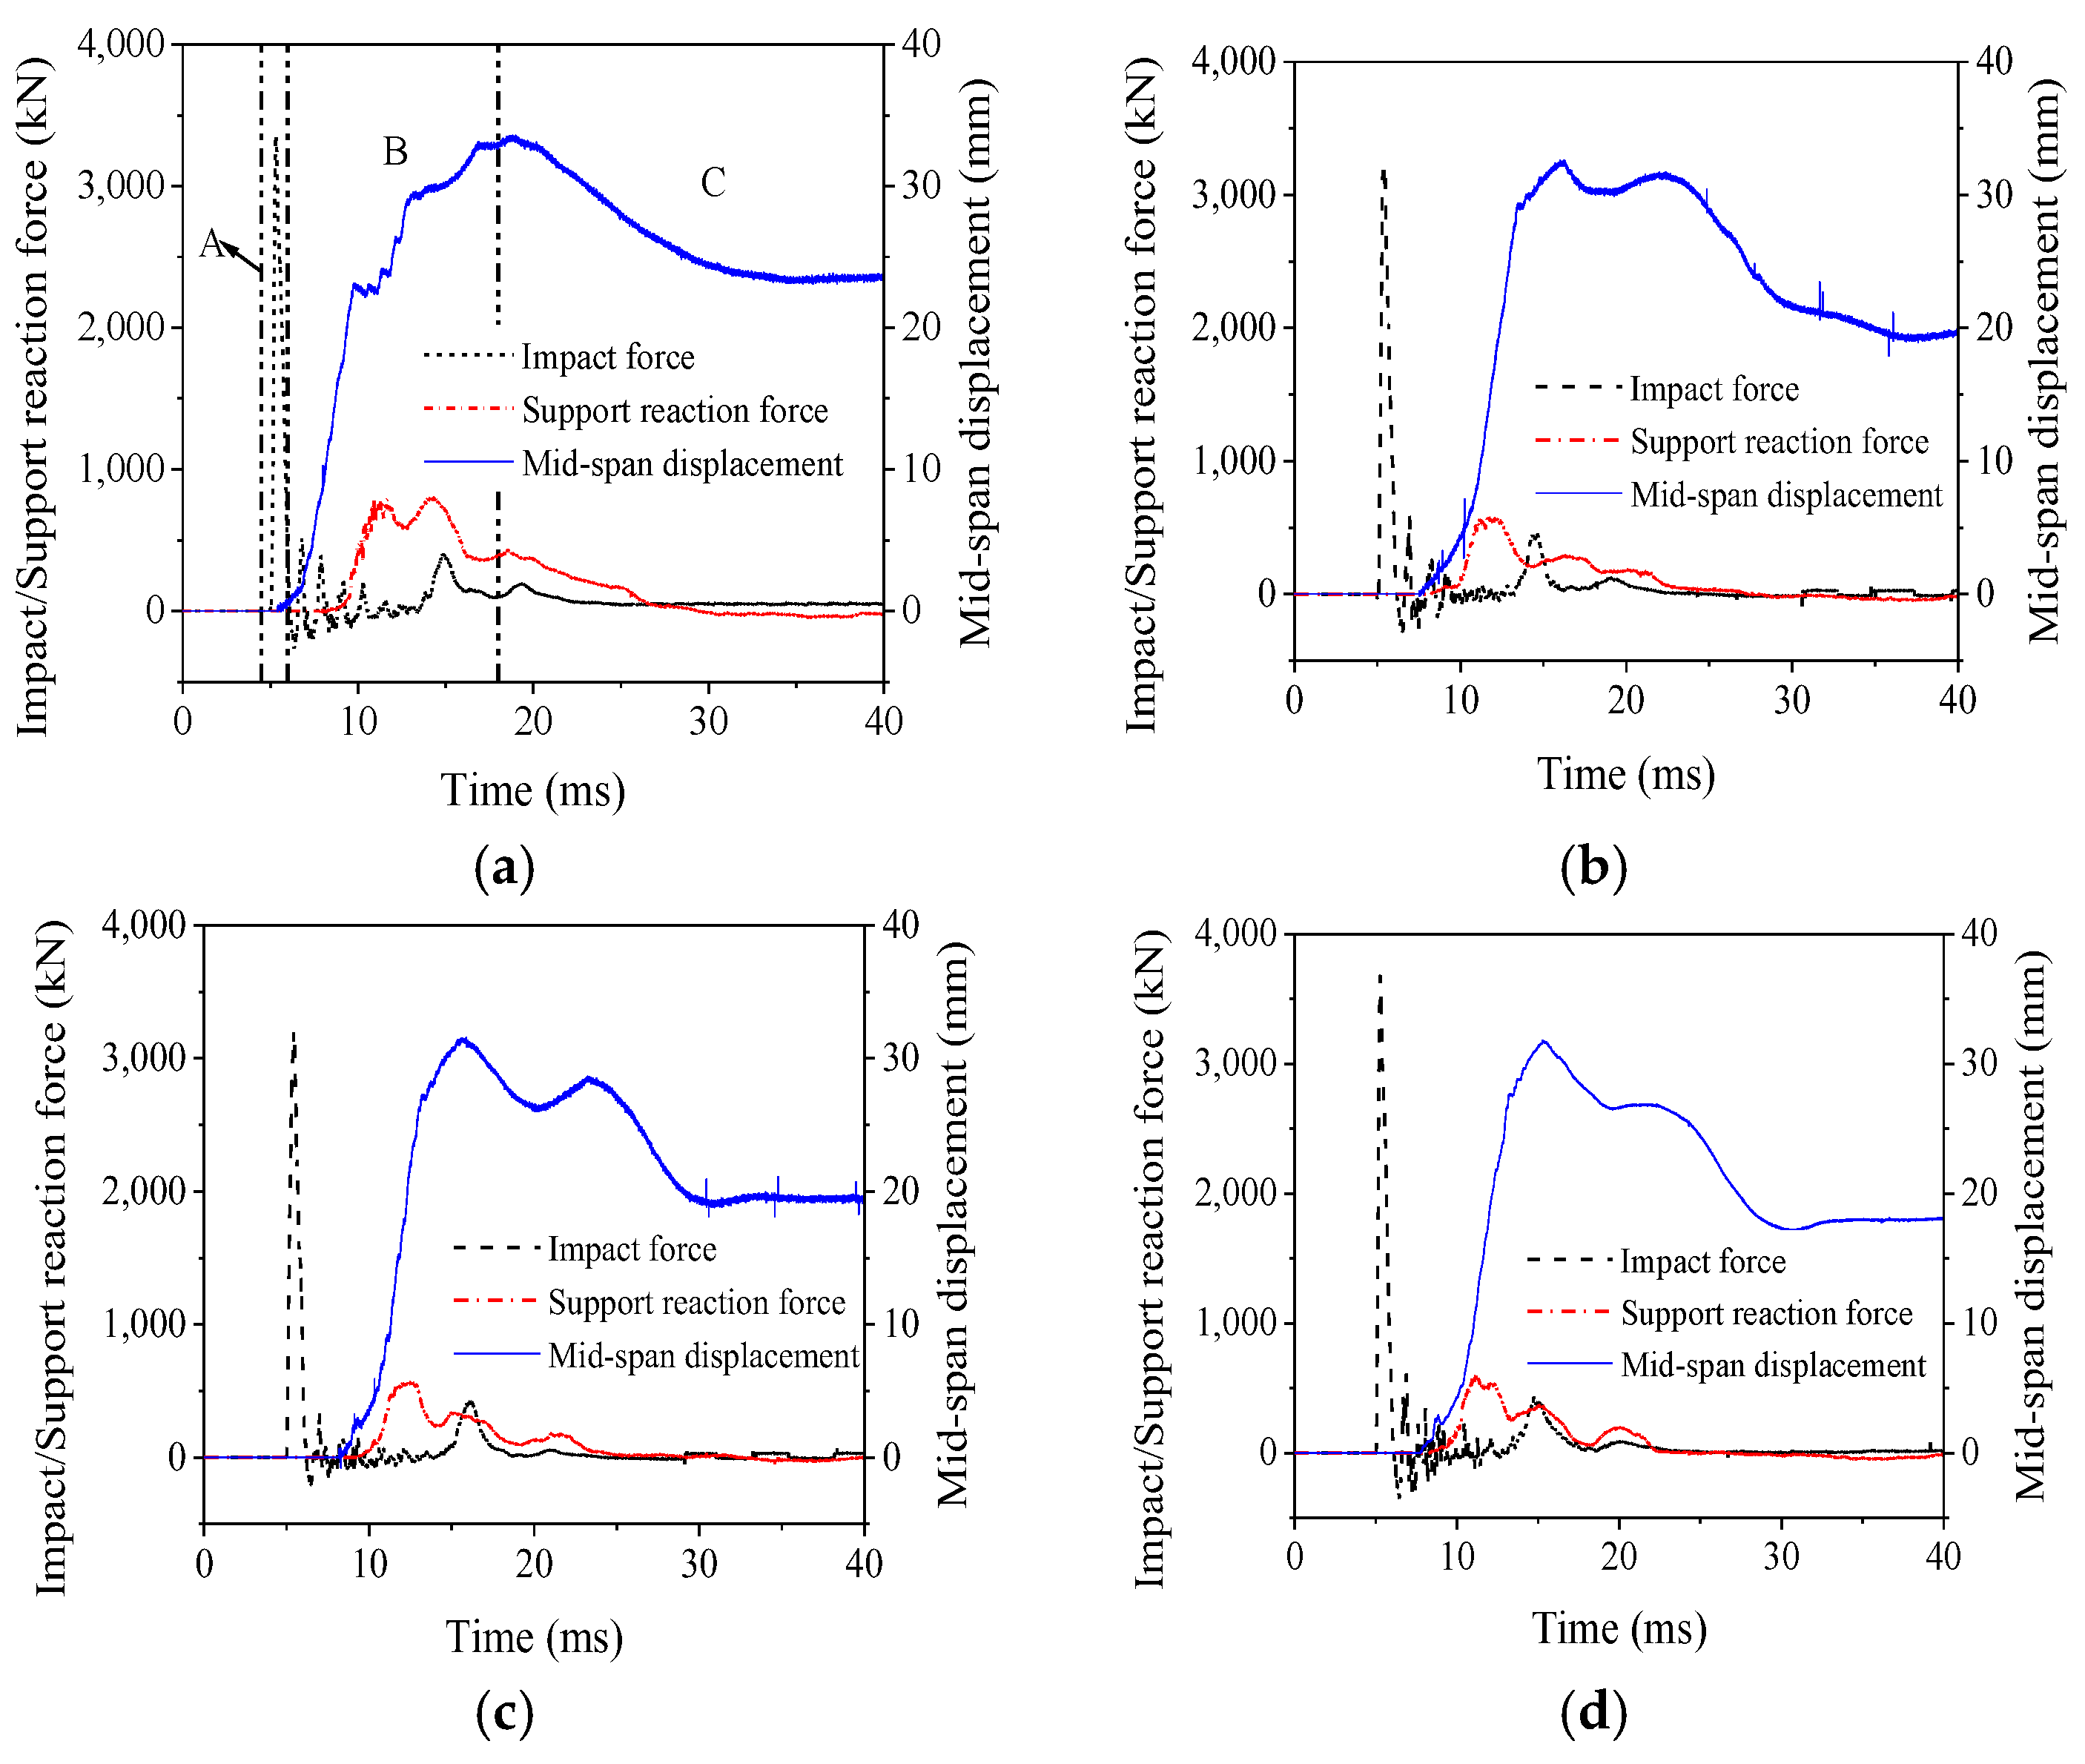
3.2. Analysis of the Time History Curves for Impact and Support Response Forces
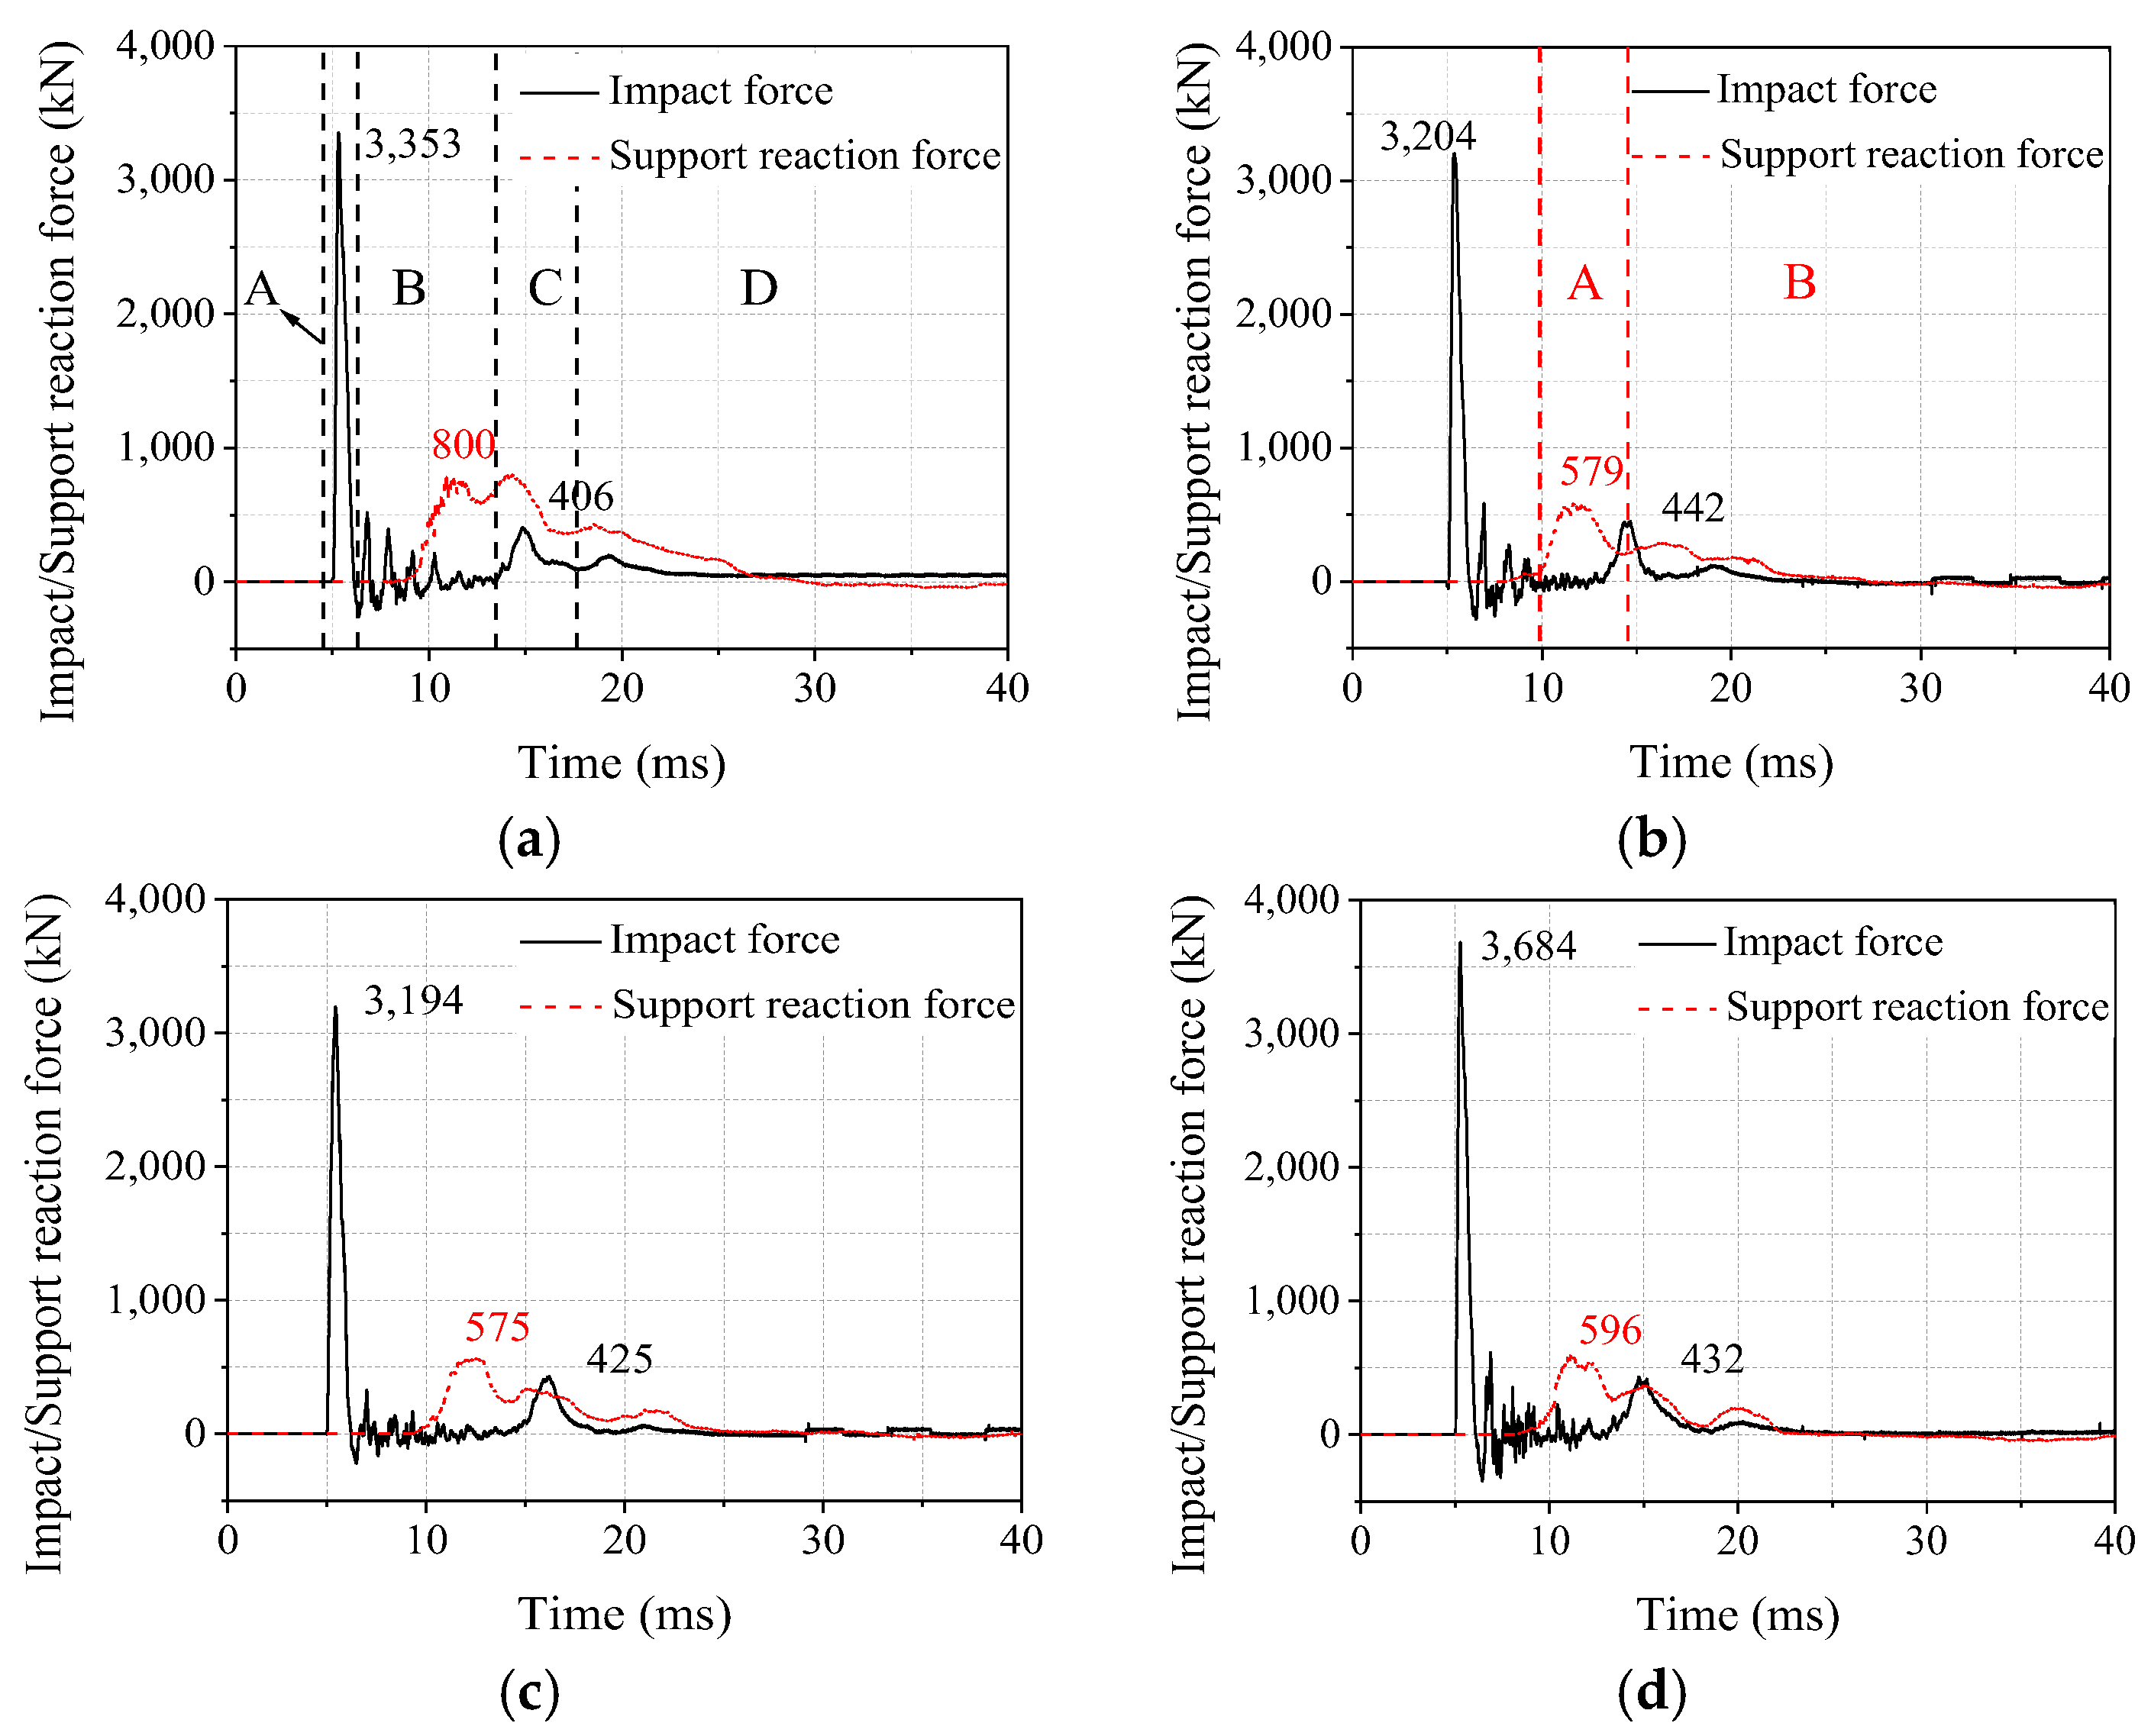
Figure 11 illustrates the time−history curves of the impact force and the support response force for test beams A1–B3. Time history curves for impact forces and support response forces are shown in black and red, respectively. It is generally possible to divide the impact−force–time history curve into segments for the primary wave peak, oscillation peak, secondary wave peak, and attenuation peak. The beginning and end points of each segment are shown in
Figure 11a.
(A) Main wave peak segment: at the beginning of the impact, the impact force resists the stiffness of the beam itself, and the impact force value increases rapidly and reaches the main peak value within 1 ms. The main peak value of each test beam is between 3353 and 3684 kN. The beam moves downward due to the impact force. When the speed of the hammerhead is the same as that of the beam body, the impact force decreases to zero. At this time, the main peak of the impact force ends. The duration of this process is between 1.06 and 1.21 ms. However, during the impact phase, the impact force has a negative value. There is a lack of rigorous display programs and the impact force value is high, indicating an overflow, which is to blame.
(B) Oscillation segment: after the impact force reaches the main peak, the impact force–time history curve fluctuates slightly. This is because the hammerhead is still at the top of the beam body at this time, and the stress wave is continuously reflected in the beam body along the height direction, which is a manifestation of the energy dissipation of the beam body itself.
(C) Secondary wave peak segment: after a relatively long period of low vibrations, the impact force gradually increases and appears as a secondary peak caused by the test beam’s secondary impact after the hammerhead rebounds. The peak value of the secondary peak is low, between 406 and 442 kN, which is only 11.7% to 13.8% of the peak value of the main peak; however, the duration of the secondary peak is longer, ranging from 3.96 to 4.93 ms. The secondary wave peak segment ends when the hammerhead speed is the same as the test beam speed.
(D) Attenuation segment: the impact force value gradually decreases after two wave peaks and remains close to zero. Since the energy level of the hammerhead is low and the energy of the beam body rapidly diminishes, there is no visible fluctuation or shock at this point. As the thickness of the bonded steel plate increases, the peak value of the main wave of the impact force does not change as much as compared to the impact force–time history curves of the A1, B1, and B2 test beams. This is because the impact force is mainly affected by the local contact state and stiffness between the drop hammer and the PC beam, so the strengthening of the beam bottom has little effect on the impact force. There is a similar duration in the main peak section of the impact force, and the curve has a faster initial response. However, the rate of increase in the impact force slows down and the impact area of the impact force–time history curve has a smaller range of fluctuations. The most moderate oscillation segment belongs to the time history curve of the impact force of the B2 test beam. The reason behind this is the significant increase in local damage to the contact surface of the hammerhead with the 4 mm−thick steel plate. The impact−force–time history curves of test beams B1 and B3 are comparable when compared to each other. However, the impact force value increases when the beam is strengthened with U−shaped steel plate hoops, indicating that the U−shaped steel plate hoop increases the stiffness of the test beam. While the duration of the secondary wave peak segment increases significantly and its generation time is delayed, the duration of the main wave peak segment is marginally reduced.
(A) The peak and attenuation segments of each support response force can be separated from the varying trend, which has less variation than the impact force–time history curve. The starting and ending points of each segment are shown in
Figure 11b. When the stress wave shifts from the top span of the beam to the support, the support response force rapidly develops and rapidly reaches the first wave peak between 579 and 800 kN. Then, the curve oscillates and experiences two wave peaks with different amplitudes, and then the impact force peak segment ends. The three wave peaks of different sizes are obtained from the stress wave in the main peak section of the impact force transmitted to the support. The fact that the transmission path of the stress wave mainly consists of the propagation of the wave along the direction of the beam height and length shows how complicated the propagation path of the stress wave in the beam is. As a result, the peak segment of the support reaction force lasts longer and can last up to 14 times longer than the primary peak segment of the impact force, showing that the inertial force effect has less impact on it.
(B) Attenuation segment: after three wave peaks in an oscillation period with a small amplitude and one or two wave peaks with a small value, the support reaction force manifests itself as a result of the propagation of the stress wave during the oscillation segment and the secondary wave peak segment of the impact force to the support. The oscillation amplitude and peak values of the support reaction force are currently quite low. This is because the stress wave in the beam body is continuously reflected along the height direction during this time, and the beam body loses a lot of energy due to the development of cracks, flexural deformation, and peeling of the steel plate from the concrete. At this time, the lower energy of the lowered stress wave can no longer significantly increase the support response force. At the end of the impact phase, the time history curve of the support response force tends to zero. There are three peaks in each of the support reaction force–time history curves for the A1, B1, and B2 test beams. The first two peaks of beam A1 have comparable values. The values of the three peaks of beams B1–B3 drop essentially linearly, with the third peak having a smaller value. The complex stress wave propagation path to the support is the cause of the three peaks, and the first wave peak is formed by the stress wave that moves rapidly and directly away from the impact site to the support. The support response force is triggered to act by this stress wave. However, the second wave peak is created by the longer transmission path of the stress wave, which travels in the direction of the beam height. The stress wave propagates laterally along the width direction of the beam, first propagates to the vicinity of the support pressure beam, and then propagates to the support along the height direction, resulting in the generation of the third wave peak. After the steel plate is bonded, the values of the first two wave peaks have a significant decrease. This is because, after the steel plate is joined, the beam body has a greater energy dissipation impact on the vertically transmitted stress wave, resulting in a significant decrease in the support and reaction force values.
The primary and secondary peaks of the support reaction forces both increase to some extent with the installation of the U−shaped steel plate hoops, and the secondary peak increases by 26.62% when comparing the time history curves of the support reaction forces of the B1 and B3 test beams. This is because the first two peaks of the support response force are significantly influenced by the primary peak wave segment of the impact force. In addition, after the U−shaped steel plate hoops have been installed, the support reaction force response caused by the stress wave transmitted along the height direction of the test beam is more prominent. The trend of the time history curve of the support reaction force in the attenuation segment is roughly similar, indicating that the setting of the U−shaped steel plate hoops only has a greater influence on the peak segment of the support reaction force and has little influence on the attenuation section.
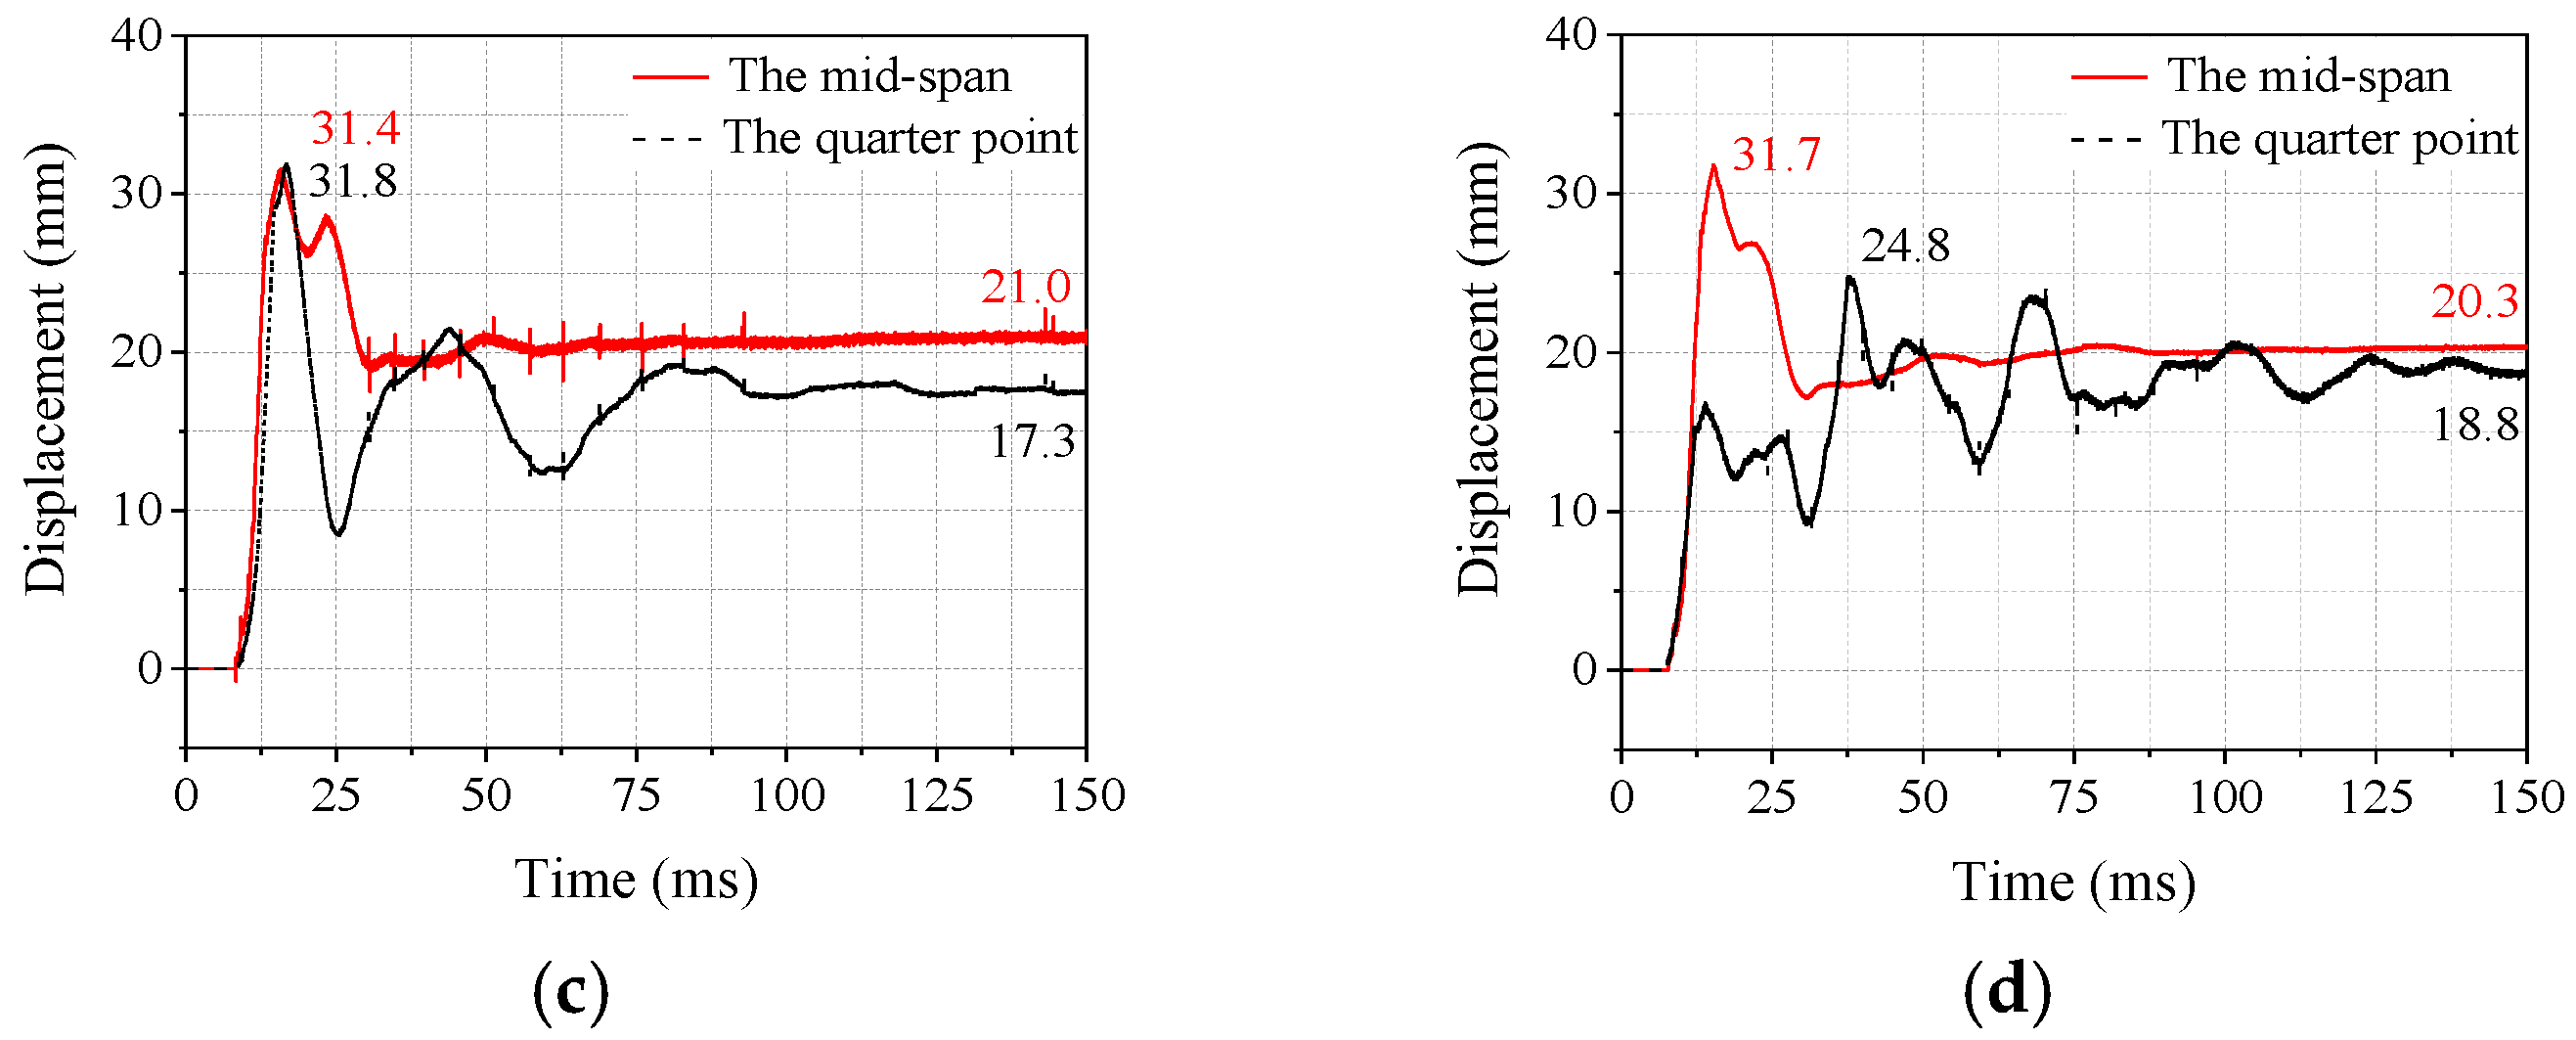
3.3. Displacement
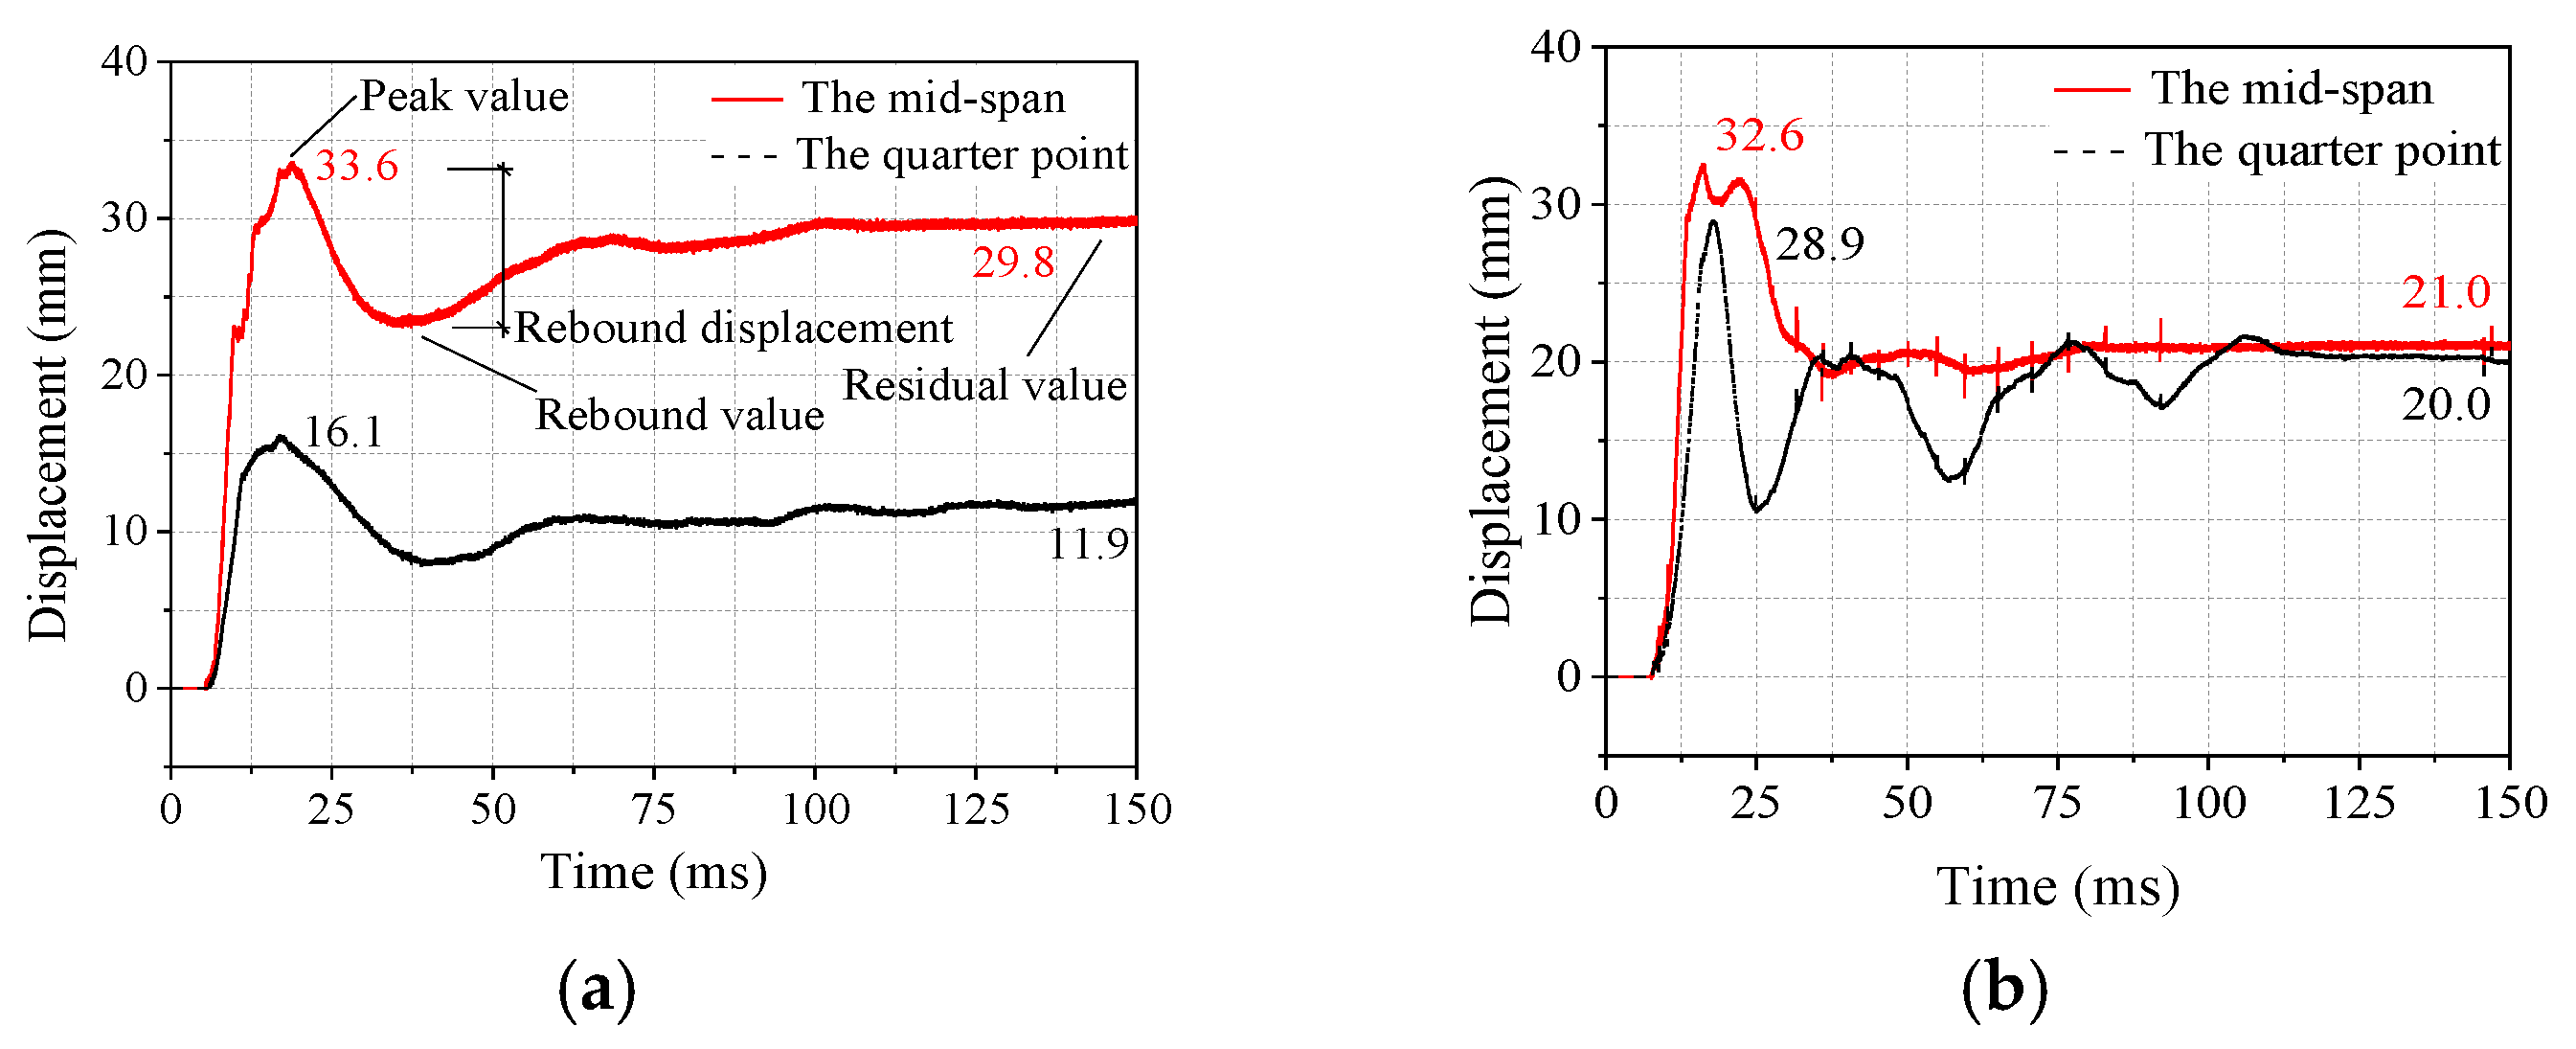
The midpoint and quarter−point displacement–time history curves for each test beam are shown in
Figure 12. While similar to that of the A1 test beam, the mid−span displacement–time history curve of the B1–B3 test beams has a different shifting pattern. The A1 test beam shows a clear trend of increased displacement after spring back, which is the main performance. The displacement–time history curve varies significantly across the quarter−point region. This is caused by the various ways in which displacement gauges are connected.
All of the test beams were damaged to varying degrees when the hammerhead came into contact with the beam body because the stress wave was carried from the top of the beam to the support. It is mainly manifested as local damage in the compression area, the development of cracks in the beam body, and the overall downward acceleration of the test beam to produce flexural deformation. After the displacement of the test beams, B1~B3 reached the peak value, the value of the test beam first decreased after the peak deflection due to the pasting of the steel plate, but then a second smaller wave peak occurred. This was because after the displacement reached the first peak, the bond between the steel plate and concrete led to the cohesive failure of the concrete at the mid−span and quarter−points at the bottom of the beam so that the displacement first decreased and then increased. The second peak gradually decreased as the thickness of the bonded steel plate increased or when the U−shaped steel plate hoops were installed. This was due to the fact that increasing the thickness of the steel plate or installing U−shaped steel plate hoops reduced the cohesiveness and peeling failure of the concrete at the bottom of the beam. Although the displacement decreased after reaching the peak value, the second wave peak was not formed because the A1 test beam was not strengthened by the steel plates. The test beam elastically bounced because of the restraint provided by the steel bars inside and the steel plate at the bottom of the beam. The test beam now moves upwards. When its upward velocity is zero, the displacement–time history curve hits the rebound value. Finally, the displacement gradually approaches the residual displacement value after a short period of fluctuation.
According to
Figure 12, the mid−span displacement response is faster, followed by the displacement response at the quarter−point section, and the mid−span displacement increases more rapidly. This is because the time for the stress wave to reach the mid−span at the bottom of the beam is relatively short, and the mid−span damage is more severe than the quarter−point damage. This shows how the displacement response of the test beam progresses from the mid−span to both sides. The peeling of the steel plate and the change in the connection method of the displacement meter are what cause the displacement at the quarter point. Since the movement of the steel plate, not the test beam, is reflected in the data, it cannot be interpreted logically.
As the steel plate is pasted, the peak mid−span displacement and residual displacement decrease significantly, while the decreasing trend is not apparent as the thickness of the steel plate increases. Because the flexural deformation caused by the quality of the test beam itself is weakened after the bottom of the beam is strengthened with the bonded steel, the difference between the residual displacement and rebound displacement decreases significantly after the steel plate is attached to the beam. The peak displacement and residual displacement values decrease with the U−shaped steel plate hoop configuration; however, it is not immediately apparent. The rate of increase in the response speed of the start displacement is almost the same. This is due to the relationship between the loading and displacement reaction rates and the lift rate. Although the timing of reaching maximum displacement is accelerated by the inclusion of U−shaped steel hoops, the loading rate is unaffected.
Larger peak displacement and displacement residual values may be seen in the unreinforced beams. The lack of reinforcement caused the beams to have reduced flexural stiffness and make them more vulnerable to concrete spalling and crack extension, which increased the peak displacement values. Flexural deformation was significant during the stage of overall damage, which increased the displacement residual values even further. However, the peak displacement and displacement residual values dramatically decreased by bonded steel reinforcement. With this technique, the stiffness and bending capacity increased, concrete spalling at the bottom of the beam was effectively prevented, crack extension was inhibited, and flexural deformation was slowed down, all of which reduced the displacement response. After the U−shaped steel plate hoops was installed, the overall damage of the precast concrete beams was considerably decreased, further preventing the development of flexural and diagonal damage.
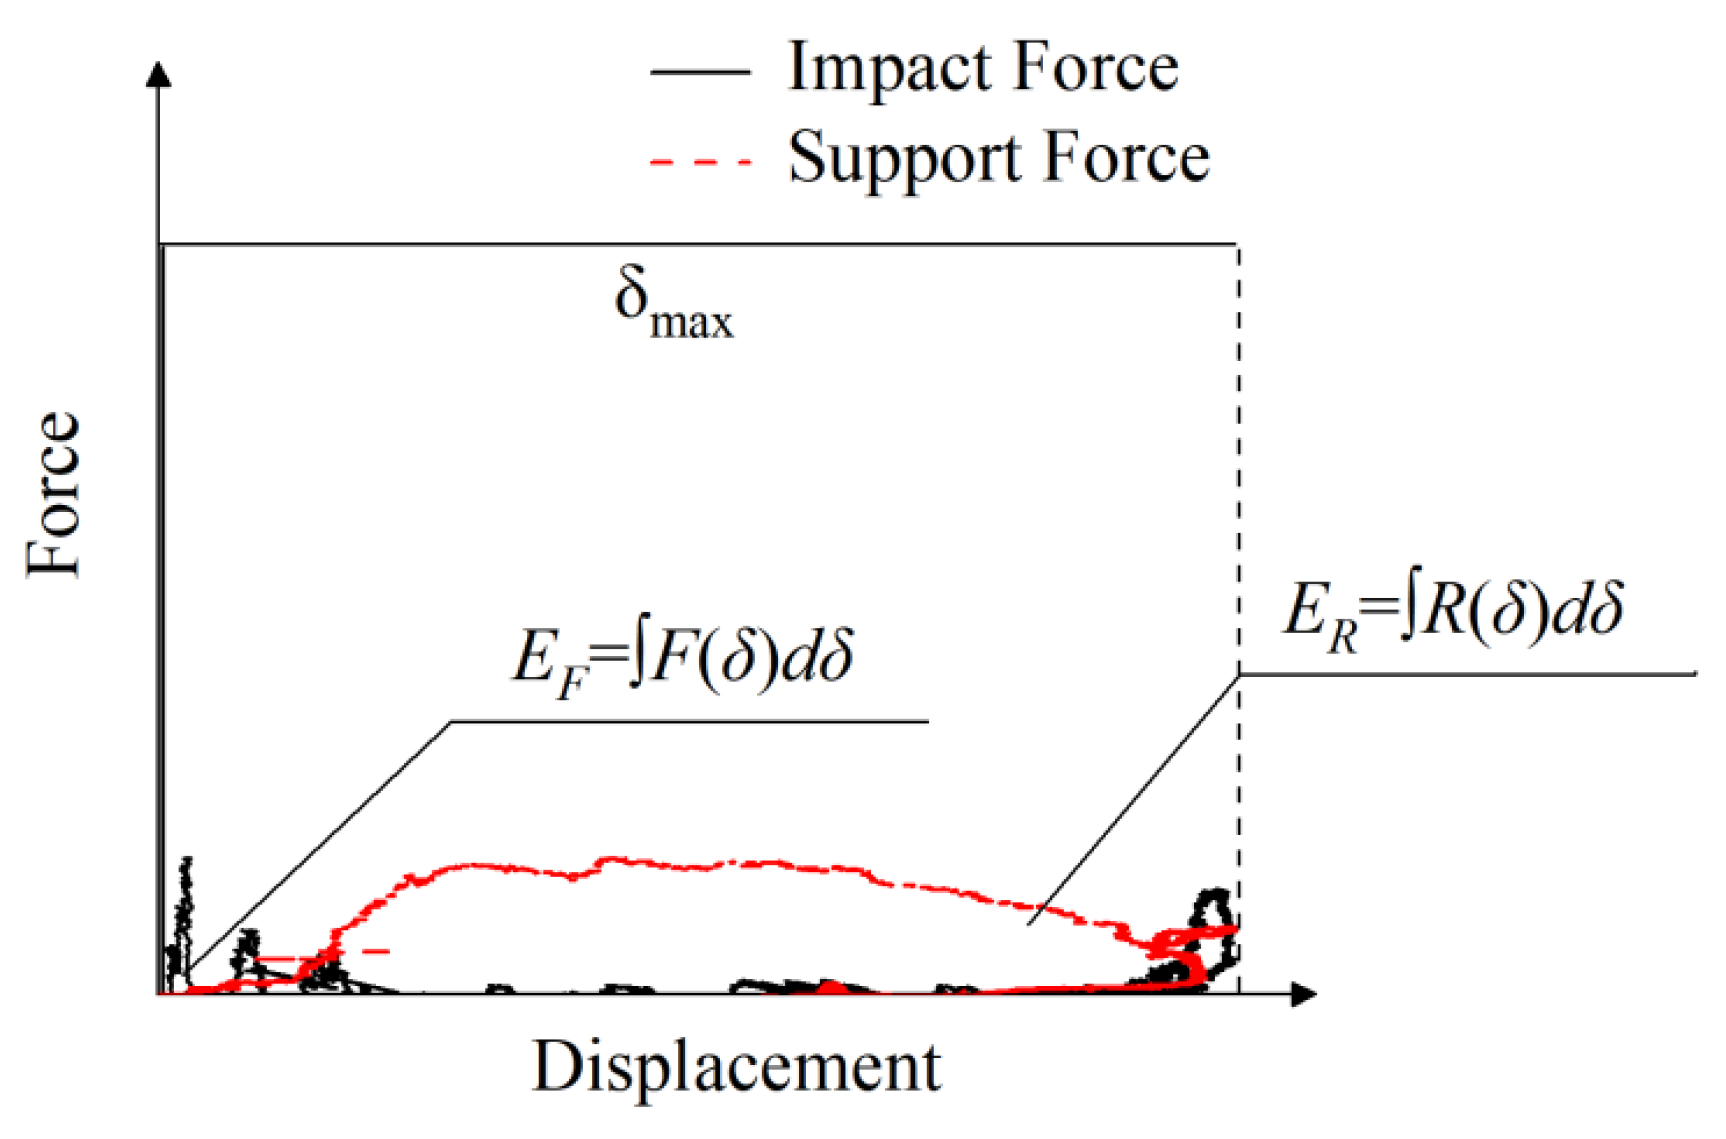
3.4. Energy Consumption
The entire energy dissipation of the test beam could not be determined directly; however, it could be determined indirectly by calculating the work performed on the test beam by the impact and support reaction forces. The regions bounded by the medium−span support response force–displacement curve and the horizontal axis of the coordinates, as well as the regions bounded by the medium−span impact force–displacement curve, are where they were calculated. This is illustrated in
Figure 13.
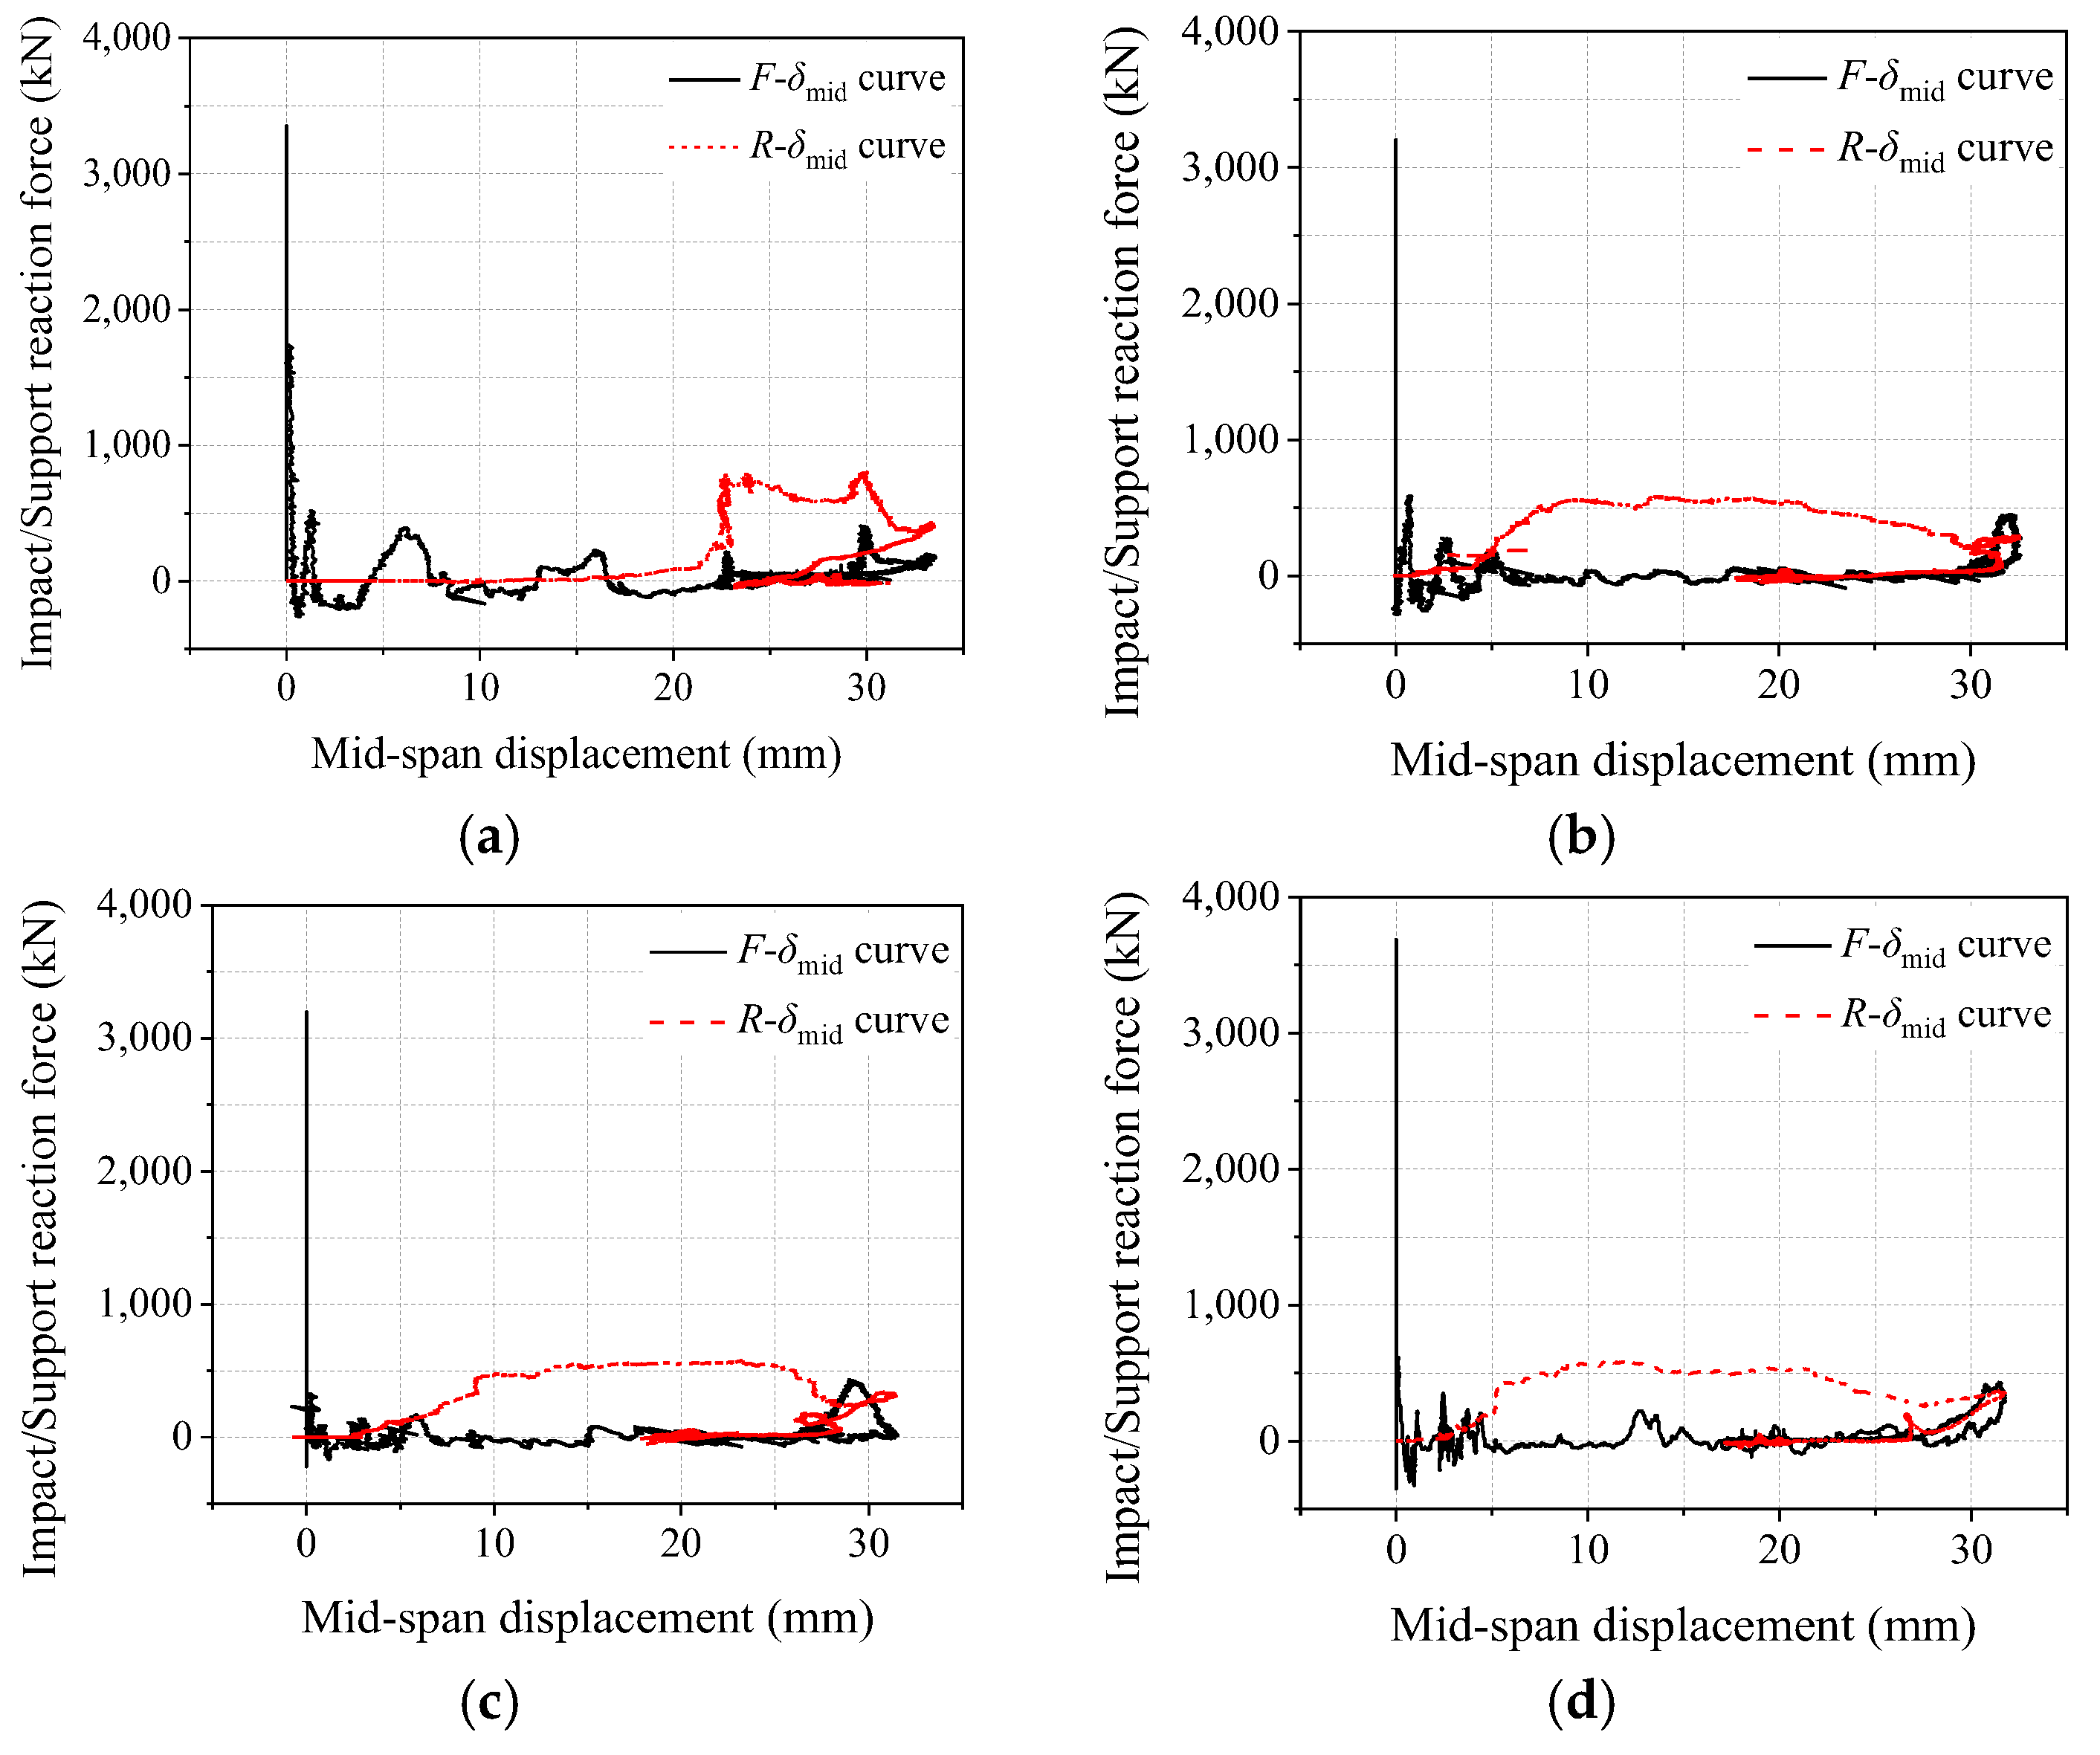
The medium−span displacement curves for the A1−B3 test beams are shown in
Figure 14. This study divided the curve process into three stages: primary wave peak segment, oscillation segment, and secondary wave peak segment. This division was based on the impact force–mid−span displacement curve shown in the image. (A) Main wave peak segment: the impact force value increases linearly from the initial value to the peak value; however, the displacement at the bottom of the beam remains at zero. The transmission of stress waves mainly causes this. At this time, the impact force exerted by the hammer is mainly used for the downward acceleration of the test beam and does not cause the deflection of the test beam. (B) Oscillation segment: after the main wave peak segment, the curve fluctuates and oscillates with a low amplitude and forms several wave crests with smaller peaks related to the oscillating segment of the impact force–time history curve. As the displacement rapidly increases and the impact force oscillates slightly over this time, it is clear that the test beam is repeatedly cracked and deformed due to the repeated propagation of the stress wave into the bottom of the beam. (C) Secondary wave peak segment: because the mid−span displacement peak and the impact force secondary peak arrive at a very close period, the curve reaches the secondary wave peak segment when the displacement significantly develops and is close to the peak value. The impact force enters the attenuation section when the impact reaches a conclusion, bounces back with the movement of the test beam, stabilizes, and eventually tends to zero.
According to the figure’s support reaction force–mid−span displacement curve, the curve process can be divided into four stages: platform, ascending, descending, and attenuation segments. (A) Platform segment: the test beam without reinforcement and the test beam with bonded steel differred significantly in the platform segment of the medium−span displacement curve of the support reaction force. The mid−span displacement had no effect on the test beam support response force values without strengthening the platform segment; however, the support response force responses of the strengthened test beam were significantly more advanced but still lagged in response time. This illustrates the phenomenon where the support response force responds first, and then the displacement response is caused by the transmission of the stress wave. Due to the faster transmission of the stress wave through the steel plate at the bottom of the beam, the reaction force response of the test beam with the bonded steel plate is also faster. (B) Ascending segment: the test beam was deflected and deformed by the impact load, and the response was followed by the support reaction force entering the ascending segment. The rising velocity is related to the peak section of the time history curve of the support reaction force; however, it is less extreme than the primary peak segment of the mid−span displacement curve of the impact force. Comparing the A1 beam without reinforcement and the B1~B3 beams strengthened with bonded steel plates, the A1 test beam rapidly reached the peak value, and the curve oscillated significantly, while the test beam with the bonded steel plate reached the peak value after a long displacement response time, and the curve was relatively smooth. (C) Descending segment: the curve then created a descending segment that was connected to both the attenuation segment and the descending portion of the peak segment of the support reaction force–time history curve. The mid−span displacement response continued to be present. Due to the absence of significant variations and oscillations in the descending segments of the support reaction force and the attenuation section, the test beam with the bonded steel plate had a smoother descending segment. (D) Attenuation segment: as the mid−span displacement reaches its maximum value, the support response force decreases, stabilizes, and tends to zero at this point, causing the curve to enter the attenuation zone.
Table 3 shows the total energy consumption and energy consumption ratio for each test item. With a range of 5.65% to 10.04%, the mid−span displacement curve integrally produces a relatively low overall energy consumption value. The following are the reasons for the low energy ratio: the impact force has a substantial value in the primary peak section; however, due to the short length of this phase, displacement has not yet begun to respond at this time, resulting in a low integral value according to the impact force–time history curve. In addition, due to the high impact force value and the inaccurate display process, the impact force value overflows and results in a negative value in the oscillating part of the curve generated by the fluctuation of the impact force–time history curve. After integration, energy consumption accounts for a small proportion at this stage. The secondary wave peak segment of the curve, which is created by the secondary peak of the impact force, accounts for the majority of the total energy consumption; nevertheless, the integral value of the curve at this point is not high due to the modest value of the impact force in the subpeak portion. The results of this study are consistent with the result of the integration of the response force–mid−span displacement curve, which shows that the overall energy consumption ratio ranges from 34.74% to 72.88%.
Figure 14 shows that the four stages of the combination curve of the support reaction force and the mid−span displacement have varying energy requirements. The support response force of the platform segment does not respond and the energy consumption is almost zero at this time. The area between the ascending and descending sections and the horizontal axis of the coordinate is very large, and this stage becomes the main part of the overall energy consumption. The deflection deformation of the test beam is still progressing at this point, and because the stress wave has already reached the support and has been repeated twice in the beam body, the reaction force of the support is less inert than the impact force. Although the support reaction force steadily decreased to zero and the energy consumption was still high as the combination curve decayed, the displacement was still very high. The support response force response was obtained by the impact force transmitted together with the beam stress wave. This curve was less affected by contact stiffness and had good stability, which made it more suitable for evaluating the overall energy consumption of the beam.
When compared to the A1, B1, and B2 test beams, the QR energy consumption ratio
exhibited a significant increase, followed by a slight decrease as the thickness of the bonded steel plate increased. This suggests that the overall energy dissipation capacity of the test beam is strongest when it is strengthened with a 2 mm−thick steel plate. However, the stiffness of the test beam increased in line with the continued increase in the steel plate thickness. As shown in
Figure 10, local damage increases the energy consumed by the test beam, which causes a reduction in the overall energy consumption. With the U−shaped hoop in place, the overall energy dissipation ratio is somewhat lower than for the B1 and B3 test beams, showing that the test beams’ overall damage is currently the same. The U−shaped hoop’s placement, however, causes the stiffness of the beam body to increase further and the local damage to worsen, which reduces the total energy dissipation rate.
The remaining energy of each test piece during the impact process ranged from 22.48% to 59.35%, mainly consisting of the energy associated with crack development, concrete crushing energy, friction energy between steel bars and concrete, steel plate and beam peeling energy, vibration energy between the beam body and steel plate, and slip energy. The remaining energy proportion of the beams with the bonded steel plate was smaller than that of the beam without reinforcement. This was due to an increase in the overall energy dissipation capacity of the reinforced beam, a decrease in the overall damage, and a reduced risk of beam fracture development. The concrete cover peeled off simultaneously as a result of the steel plate and the tendency of concrete to peel. Therefore, it is believed that the predominant sources of residual energy are the energy associated with the creation of cracks, the energy required to crush concrete, and the energy associated with the peeling of the steel plate and beam.
3.5. Analysis of the Failure Mechanism
In order to comprehensively assess the failure mechanism of PC beams subjected to impact loading,
Figure 15 presents the mid−span displacement–time history curves, support reaction force, and impact force. The stages of local impact damage, global impact failure, and elastic rebound can be used to categorize the impact process. The start and end positions of each stage are shown in
Figure 15a. Along with the failure mode and crack distribution of each specimen, the dynamic reaction of the impact process, the shifting mode of the failure mode, and their interaction are evaluated. (A) Local impact damage stage: the time history curve of the impact force increases rapidly and reaches the primary peak when the falling weight hits the top of the beam. Because the inertial force effect is apparent at the time of contact, the impact force opposes the stiffness of the beam itself, and the material has a higher yield stress at a rapid strain rate; the impact force–time history curve rapidly increases to a higher value. At this point, minute oblique abdominal shear cracks with symmetrical distributions began to appear in the middle span of the test beam. Concrete close to the contact area of the hammerhead undergoes crushing, and there is a localized peeling off of concrete samples. Transverse cracks develop in the superimposed layer when there is no reinforcement or when a 2 mm−thick steel plate is bonded, and microcracks gradually develop in the beam web as a result of the transmission of the stress wave from the top of the beam downward. Then, the impact force drops to near zero within a short period of time and the local impact damage response phase ends. The local impact damage stage is mainly caused by the major peak portion of the impact force. This can be inferred from the curve above and the failure mechanism of the test beam. Due to the propagation of stress waves, neither the displacement nor the support response force respond at this stage, as their response times are slower than those of the impact force. At the same time, it is shown that the main peak section of the impact force is the main influencing factor in the local impact damage stage, and it has little effect on the overall dynamic response and failure mode of the test beam.
(B) Overall impact failure stage: the impact force–time history curve enters the oscillation section after the local impact damage stage, at which point the impact load continues to act. At this point, the displacement–time history curve and the support reaction force–time history curve begin to respond, with the displacement response time being slightly earlier than the support response force. The experimental beam has now reached the stage of global impact failure, which is characterized by an increase in the number of bending fractures that travel upward and inward in the mid−span stress zone of the bottom of the beam and the development of oblique downward−moving cracks in the beam’s web. Increased beam deflection and localized concrete damage near the hammerhead contact point occur. The cohesive failure of the concrete at the bottom of the beam and the peeling of the steel plate and concrete occur as the deflection of the beam increases and a portion of the steel plate attached to the bottom of the beam breaks off. The starting position is about a quarter point on both sides. The time history curve of the support response force increases as the beam continues to descend and rapidly reaches the first wave peak when the stress wave is transmitted in various ways to the supports on either side. Then, the curve oscillates and experiences two peaks of different sizes. The second peak of the impact force is not far from the mid−span displacement peak.
The top concrete layer of the beam now cracks and detaches, and bending cracks at its base cease spreading and become fully developed. As the downward development intensifies, a larger portion of the steel plate breaks off and, at the same time, the concrete at the beam’s base starts to peel. Bending cracks and oblique beam web cracks cross one other.
(C) Elastic rebound stage: the impact reaction enters the decay stage once the displacement–time history curve reaches its apex, at which point the cracks in the beam have fully grown and do not produce any more cracks. After reaching the peak deflection, the displacement value of the test beam strengthened with bonded steel is first reduced, and then the beam begins to recover after the second, smaller wave peak is created. When the displacement reaches the rebound value, the time history curves of the impact force and support reaction force stabilize and move towards zero. At this moment, the elastic deformation of the test beam resumes, and bending cracks close to the bottom of the beam begin to compress. However, due to the peeling of the steel plate, the concrete cover is damaged. Then, the displacement gradually approaches the residual displacement value after a short period of fluctuation, and the dynamic response of the test beam stabilizes.
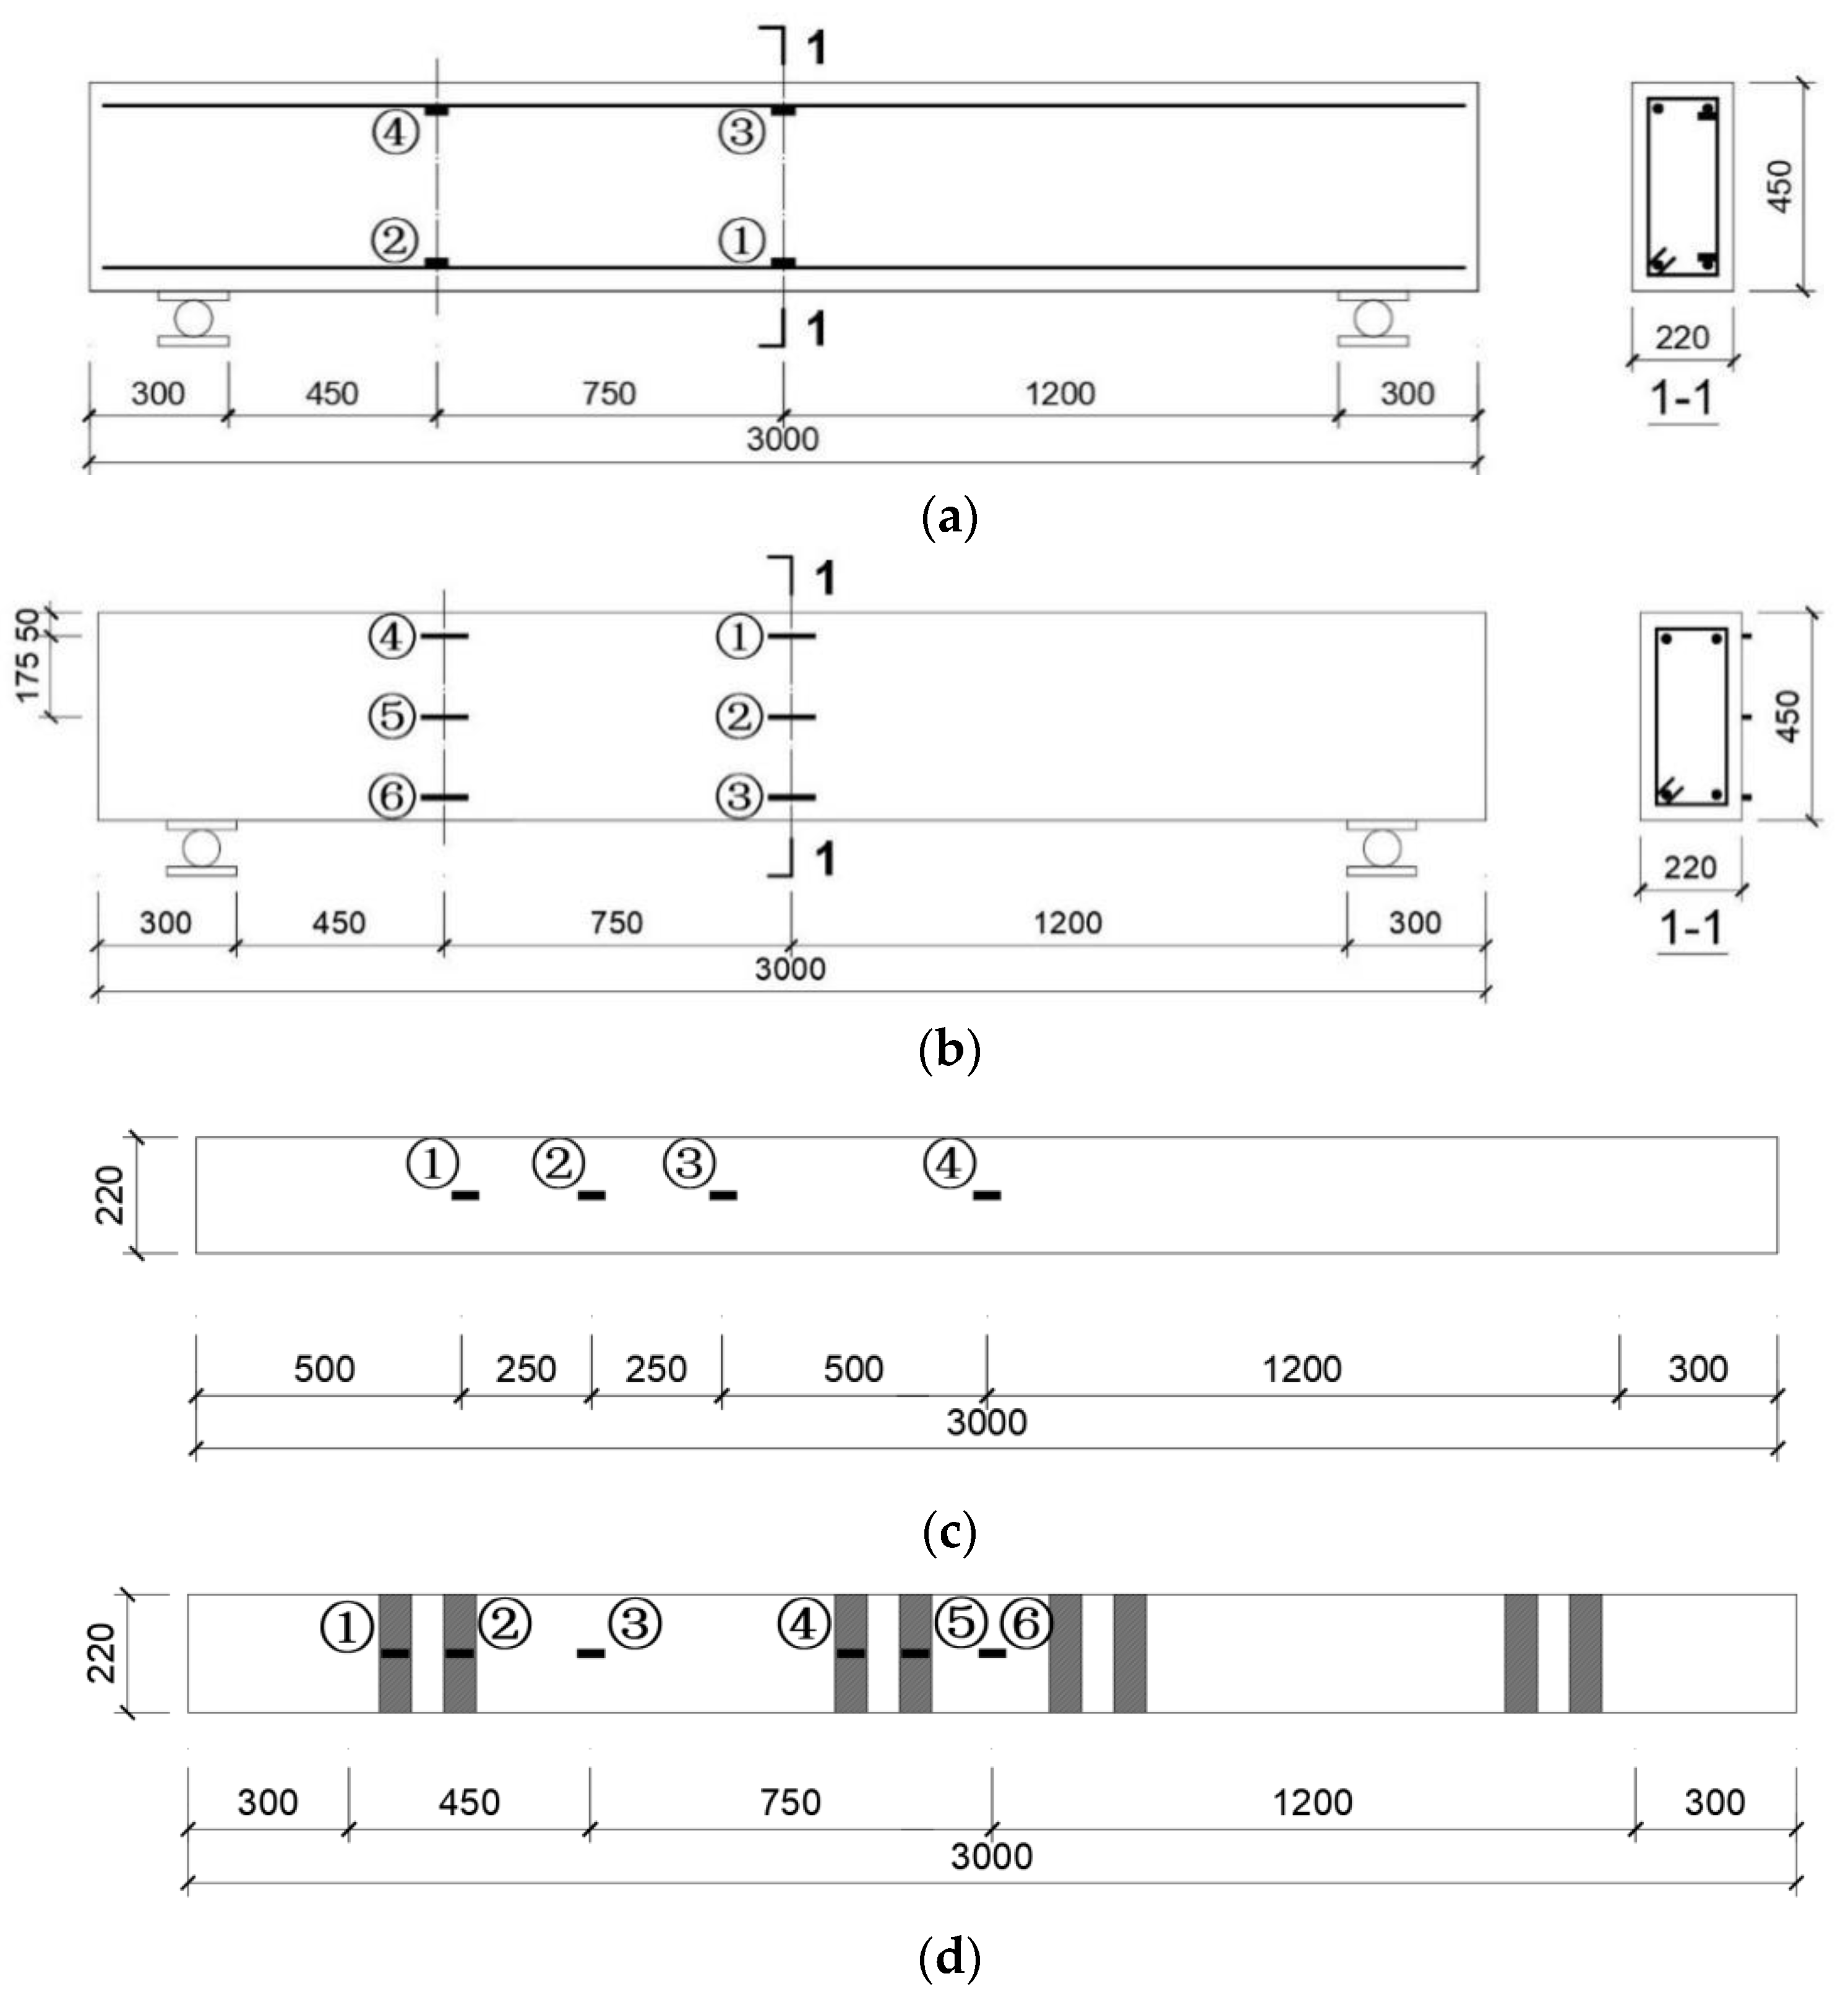
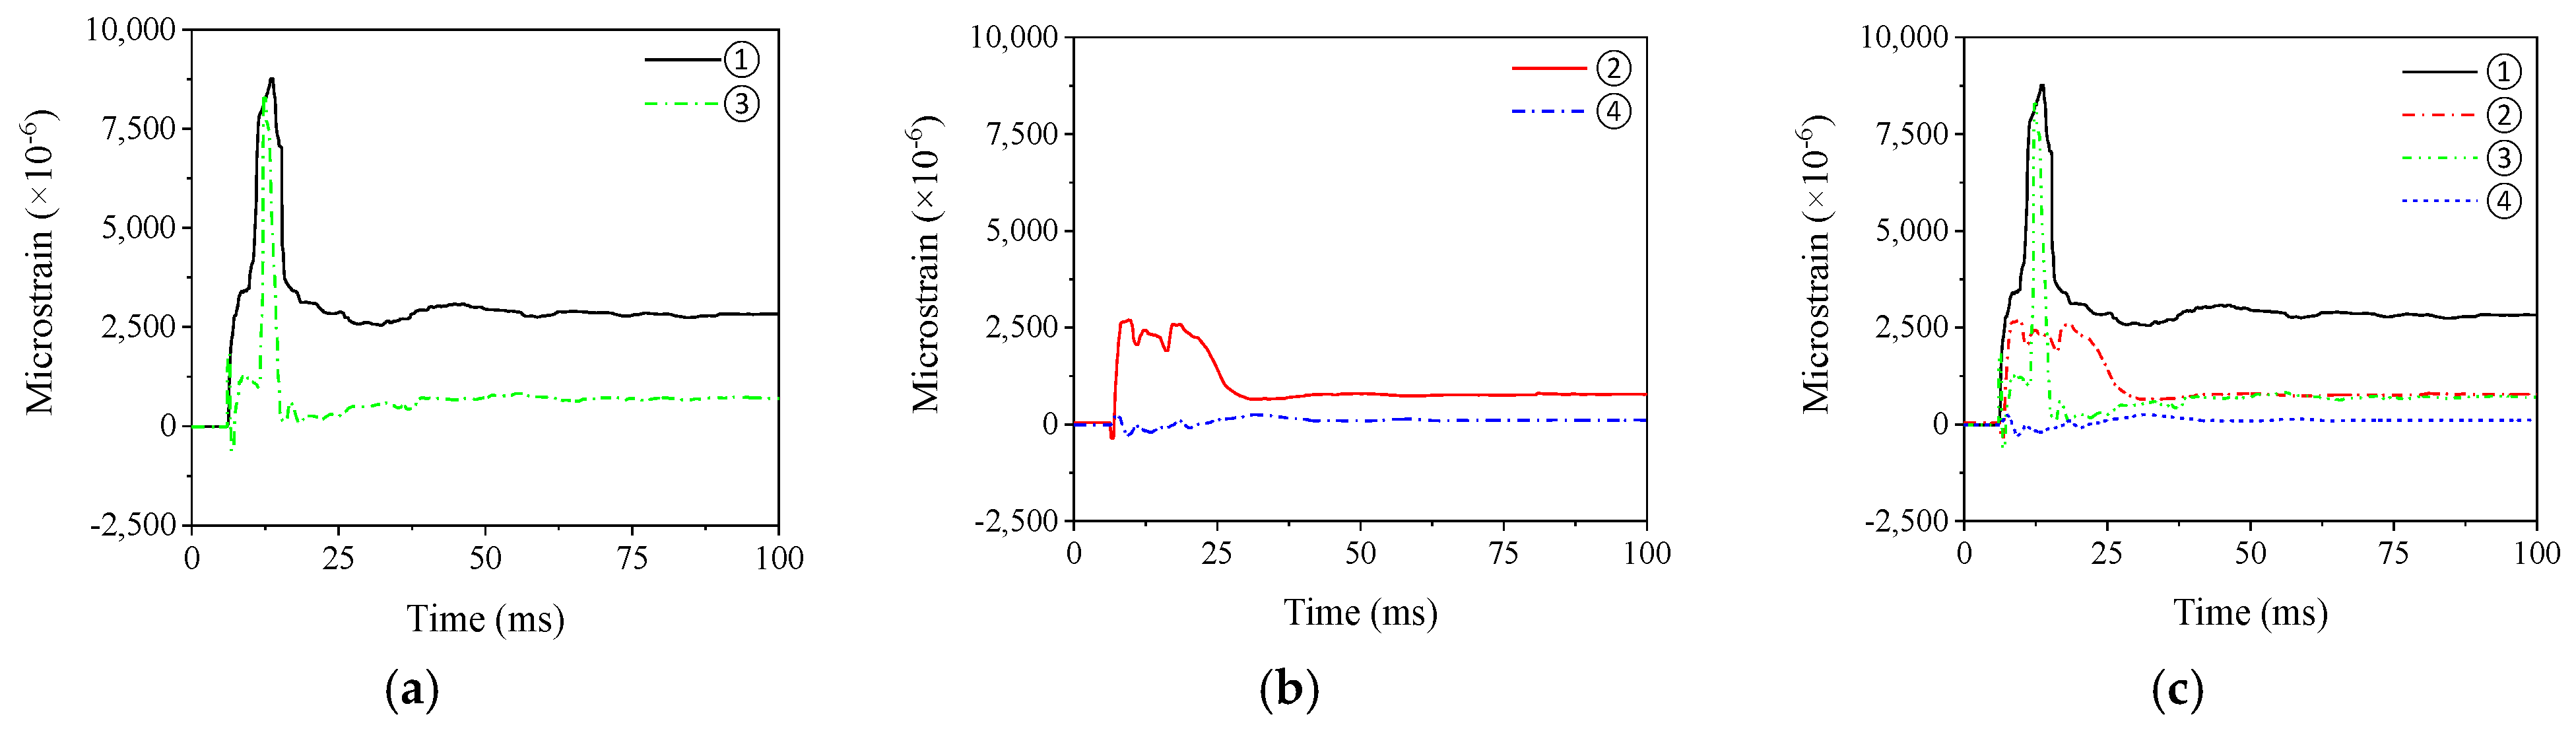
3.6. Steel Rebar, Steel Plate, and Concrete Strain
This section analyzes strain trends of the steel rebar, steel plate, and concrete in the mid−span and quarter−point sections of PC beams during the drop weight impact test, based on the strain data. However, due to severe strain gauge damage, only the data for a short period of time could be recorded, and no complete development trend could be collected.
Figure 16 shows the typical strain–time history curve of a PC beam composed of steel rebar, and
Figure 17 shows the strain changes in the steel plate in the mid−span and quarter−point portions. In addition,
Figure 18 depicts the typical strain–time history curve of a concrete PC beam, all using the B1 test beam as an example. It should be noted that positive values indicate tension, while negative values indicate compression. The strain of the lower steel bar strain gauge ① rapidly increases after the response and reaches the peak tensile strain. With the spring back of the test beam, the tensile strain gradually decreases and tends to be stable. This is attributed to the overall failure of the test beam, resulting in the bending cracks at the bottom of the beam, removal of concrete from the tension zone, and pulling of the bottom steel rebar. The strain of the upper steel bar strain gauge ③ rapidly appears as tensile strain after the response begins, decreases to a compressive strain after a short period, then transforms into tensile strain and decreases after reaching the strain peak, and finally tends to near−zero. This illustrates the stress process in which the upper steel bars of the beam are initially pushed, then compressed, and then pulled again. Due to the strain rate effect of the material, the concrete in the compression zone expands and squeezes laterally when the hammerhead contacts the body of the beam, placing tensile strain on the upper steel bar at the first peak stage of the impact force. Subsequently, due to the continuous reflection of the stress wave between the top and bottom of the beam, a compressive strain was produced as the deflection and deformation of the beam increased and the upper steel bars joined the compression. At the same time, downward flexural deformation occurred, the concrete in this area was compressed, and the steel rebar was tensioned.
The variations in steel rebars’ stress values at the quarter−point portion are depicted in
Figure 16b. The strain response of the lower rebar strain gage ② and the upper rebar strain gage ④ start almost simultaneously. Among them, the strain of the lower steel bar strain gauge ② first appears as a short period of compressive strain after starting to respond, then transforms into tensile strain and rapidly reaches the strain peak, and then the strain gradually decreases and approaches a lower strain value. The strain of the upper steel bar strain gauge ④ first appears during a short period of tensile strain after it starts to respond, and then transforms into compressive strain and finally approaches the zero value. The main reason for the abovementioned strain changes is that the beam’s bending moment distribution changes significantly with the impact process. The strain change process corresponds to the three change processes of the beam moment distribution: (1) when the hammerhead just touches the beam body, the test beam produces a positive bending moment in the mid−span, and negative bending moments appear on both sides of the mid−span. (2) The positive bending moment region in the mid−span increases as the impact process progresses, the stress wave is transferred to both sides, and the negative bending moment region eventually shifts to the quarter point. (3) When the impact enters the decay stage, the negative bending moment area moves to the support and finally disappears, and the beam body is a positive bending moment area globally. At this time, the bending moment distribution of the test beam is the same as that under the static load condition. In addition, the residual steel rebar strain value of this segment is lower than that in the mid−span area, indicating that the damage to the quarter−point is far less severe than that of the mid−span.
Figure 16c presents the overall variations in the steel rebar strain. The strain response time of the strain gauge ③ is slightly quicker than the average for each strain–time history curve, which is a reflection of the fact that the transmission of stress waves does not result in the hysteresis of the steel strain response. This is because the overall flexural deformation of the test beam is what primarily contributes to the strain response of the steel rebar. The peak tensile strain of the lower steel bar in the mid−span section is 3.5 times that of the quarter−point section, and there is also a greater residual tensile strain at the same time. The steel bar strain value of the mid−span section is much higher than that of the quarter−point section. It shows that the overall failure of the test beam and damage to the longitudinal steel rebar occur mostly below the impact point.
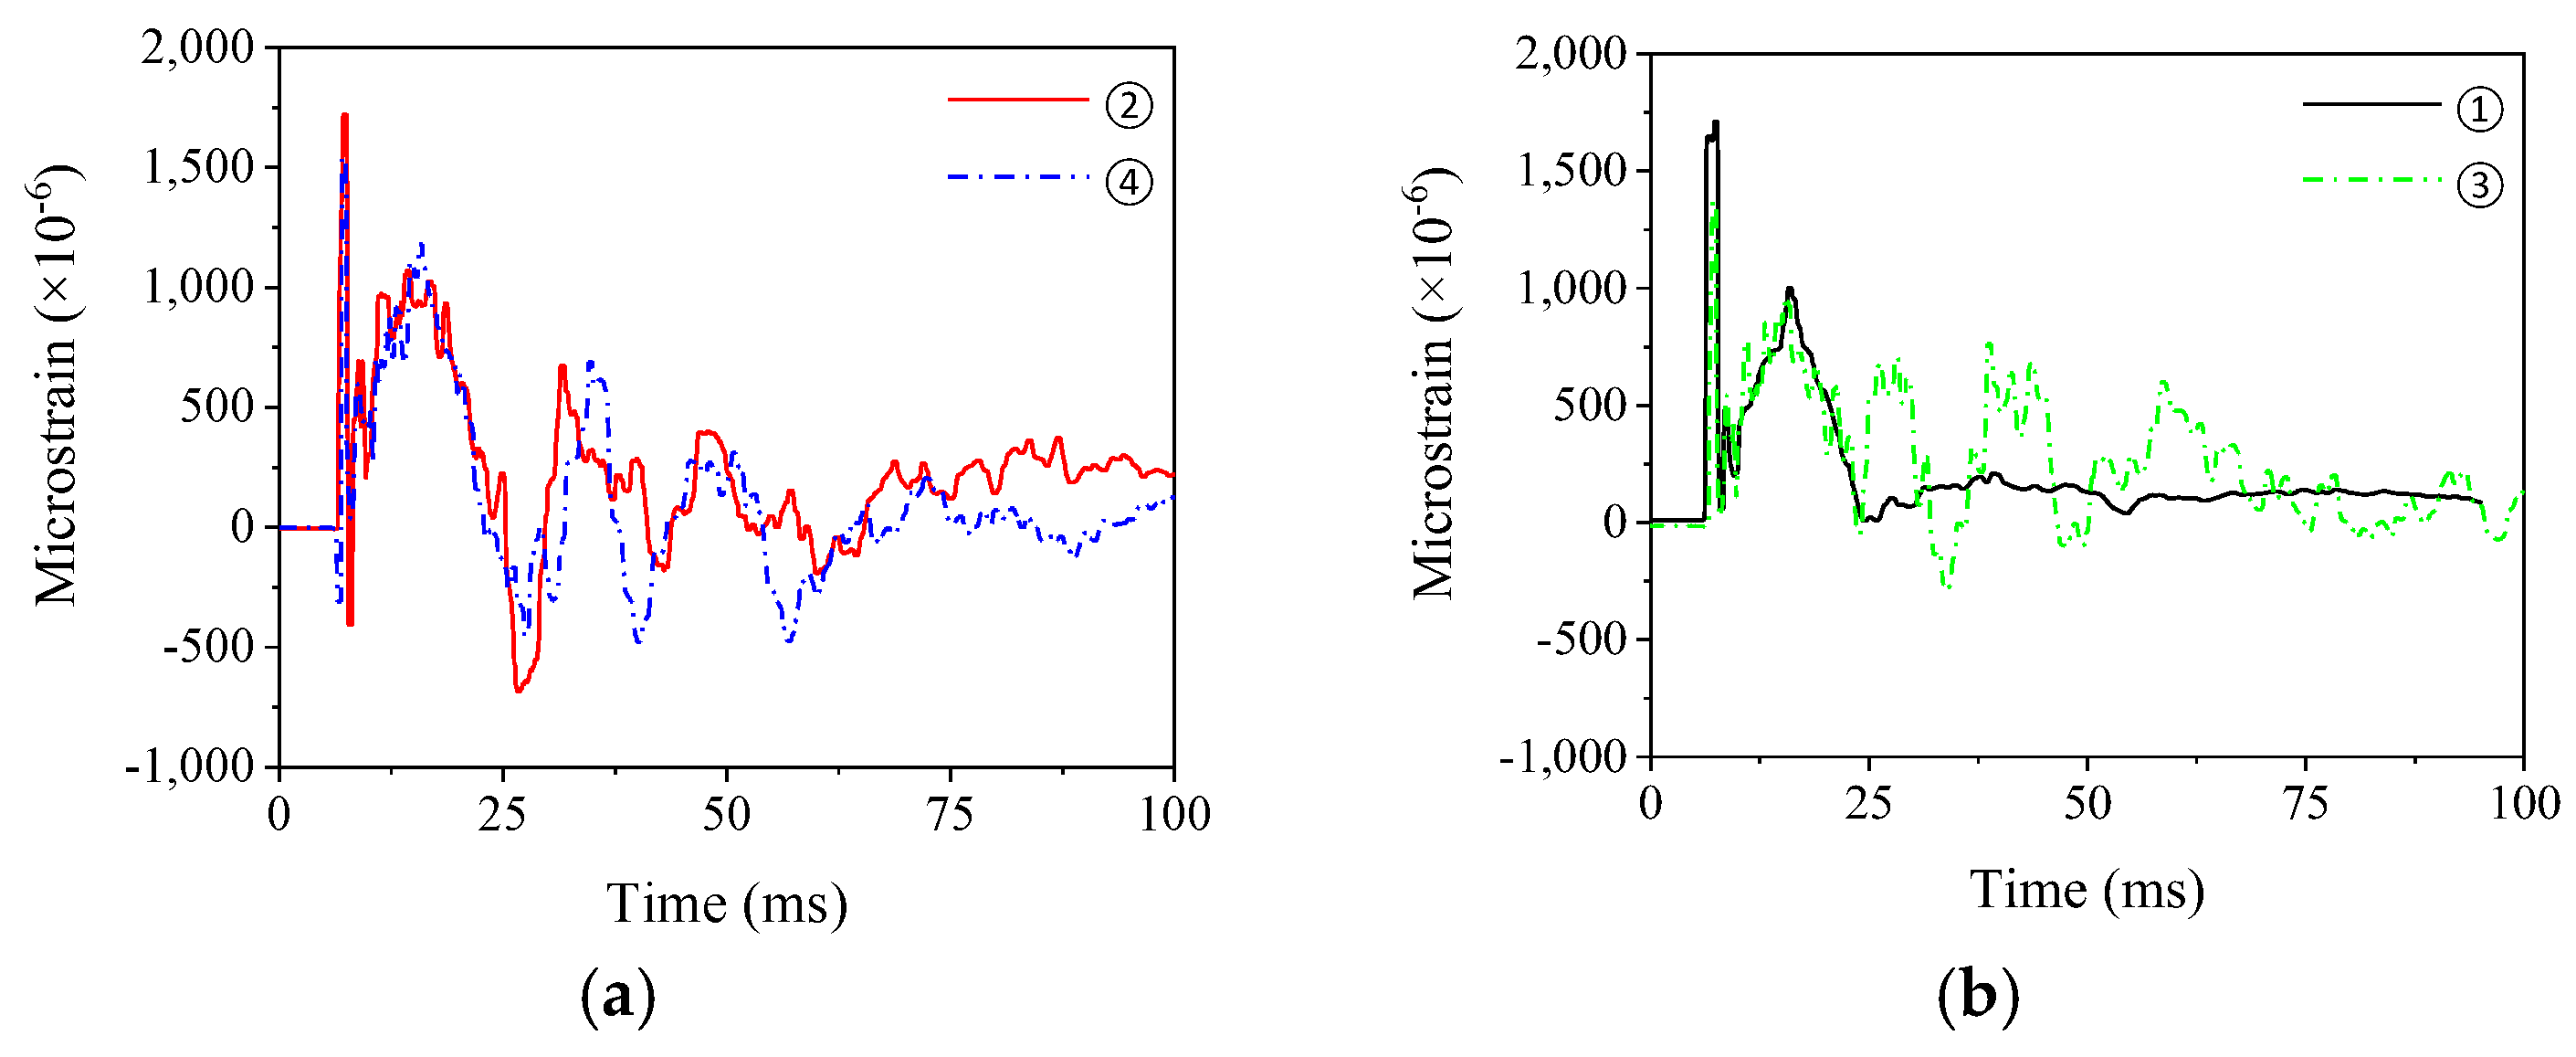
Changes in the steel plate strain in the mid−span and quarter−point regions are shown in
Figure 17a. Close to the edge of the support, region ② is where the steel plate strain gauge is situated, and region ④ is where the steel plate and concrete are initially peeled off.
Figure 17b shows the various strain fluctuations in the steel plate in the two distinct sections. Because each steel plate strain response is identical to that of the steel bar, which is mainly caused by the total deflection of the beam body, the strain response to each steel plate strain–time history curve begins almost immediately at the start of the impact. The strain of each steel plate increases rapidly after the response and soon reaches the peak tensile strain. Then, except for the strain of the steel plate strain gauge ① close to the support, the other three strains all produce obvious oscillating segments. This is because the steel plate close to the support has not been peeled off, and the steel plate is peeled off due to the concrete cohesion phenomenon in the section where the steel plate strain gauges ② are located, and the steel plate has a relatively complex stress value at this stage. Finally, with the end of the overall failure of the test beam, the four strains are stable and tend to zero. This shows that the elastic and recoverable deformation of the steel plate mainly occur, and the impact load affects the strain of the steel plate in the early stage. In contrast, the impact load does not cause a significant residual strain on the steel plate at the later stage and, instead, mainly impacts the concrete and steel rebar.
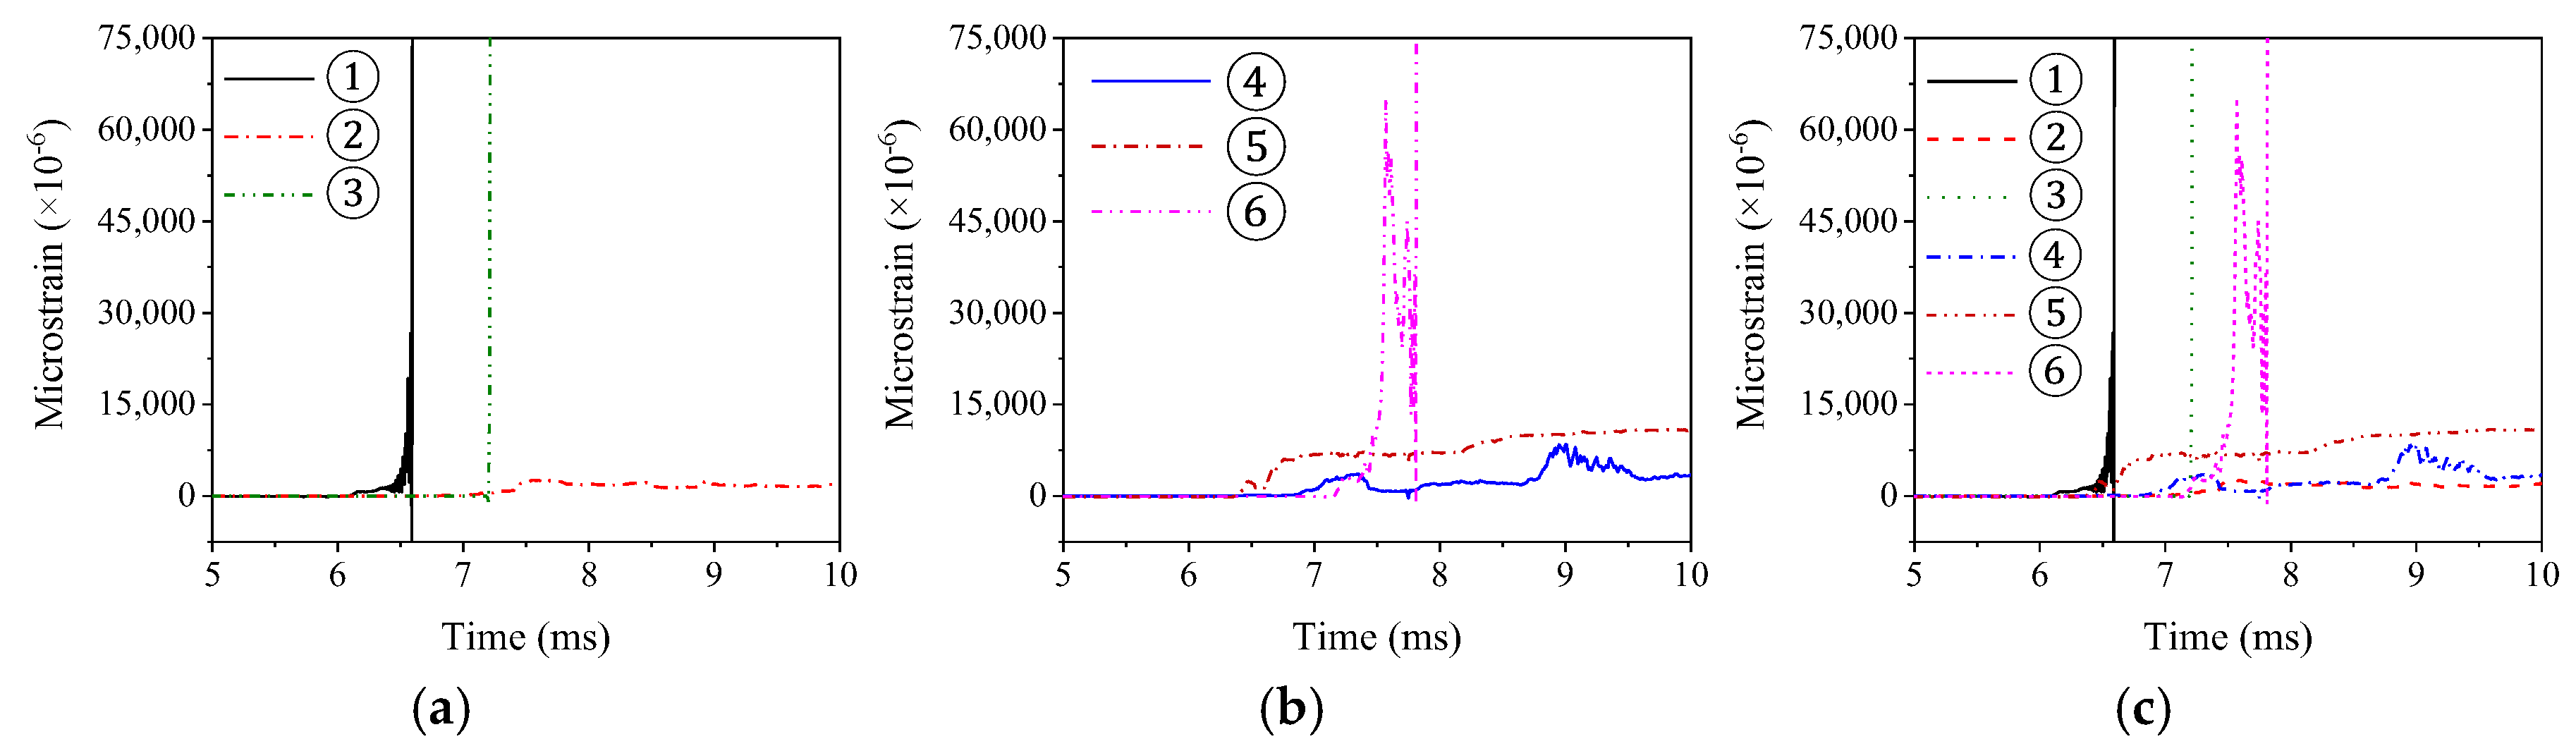
Figure 18a depicts the variations in concrete strain in the mid−span section. The fact that the concrete strain gauges ① at the top of the beam, ② at the beam’s end, and ③ at the beam’s bottom, in that order, indicate that the stress wave moves from the top to bottom along the height of the beam. The strain of the concrete strain gauge ① at the top of the beam increases rapidly after the response, and after reaching the peak value of the tensile strain, there is a “cliff−jumping” decrease and it rapidly achieves the ultimate compressive strain. The concrete in the compression zone is caused by lateral expansion and extrusion. The concrete at the top of the test beam is crushed and destroyed due to the deflection and distortion of the beam. Subsequently, the strain of the beam−web concrete strain gauge ② begins to respond and stabilize after gradually increasing to the peak tensile strain. During the strain response process of the beam web, the strain of the concrete strain gauge ③ at the bottom of the beam rapidly increases to the ultimate tensile strain value, indicating that the transfer of the stress wave to the bottom of the mid−span beam causes the concrete in the tension zone to crack and quickly stop working.
The concrete strain variations are shown in
Figure 18b for the quarter−point section. The strain response times of concrete strain gauges ④ and ⑤ are almost the same, while the strain response of concrete strain gauges ⑥ has a lag, which indicates that the time−consumption of various transmission paths of stress waves in the beam is quite different. The stress wave that is transmitted to the concrete strain gauge must first travel to the bottom of the beam along the height direction before being transmitted horizontally to both sides. The stress wave that propagates along the length of the test beam is the fastest among these. At the top of the beam, the concrete is in tension mode at the start of the impact and reaches the peak tensile strain after a slight shock. The concrete at the top of the test beam is under tension because, throughout the impact process, the stress wave is transferred to both sides, and the negative bending moment area gradually travels to the quarter−point. The tensile strain of the beam web increases gradually after the response and increases rapidly to the maximum tensile strain after experiencing the first wave peak, and finally stabilizes at a lower strain value. The beam bottom strain increases rapidly after the response, decreases rapidly after reaching the peak tensile strain, and turns into compressive strain, indicating that the test beam’s failure modem strengthened with bonded steel is relatively complex at the quarter−point. When the beam is deflected, the bottom of the test beam is in tension, and with the tension of the steel plate, the cohesive failure of the concrete at the quarter−point occurs, and the concrete in this section is compressed.
The overall variations in the concrete strain are depicted in
Figure 18c. The stress wave transmission has a substantial impact on the strain response of the concrete material, as seen by the wide variations in the strain signal’s first response time. The stress wave has the fastest oblique transmission speed, while the transmissions along with the height and horizontal directions are relatively slow. Compared with
Figure 16c, the response of the stress waves to concrete is more significant than that of the steel rebars. It can be seen in
Figure 18c that the damage to the concrete at the mid−span section is more severe than that at the quarter−point. The beam top and bottom of the mid−span section have the most damage, while the beam web and beam top of the quarter−point section are more seriously damaged. This is because the top failure of the mid−span beam mainly occurs at the local damage stage of the impact and is significantly affected by the inertial force effect. However, the mid−span beam bottom and the beam web and beam bottom of the quarter−point section mainly occur in the overall failure stage of the impact. Both the overall flexural deformation of the test beam and the peeling of the steel plate have a significant impact on the peeling and cohesiveness of the concrete cover.
Through the abovementioned analysis, it is not difficult to conclude the following load transfer law: the impact load acts on the middle part of the beam, generates bending moment and shear force, and causes the beam to undergo bending deformation, and the impact force is propagated in the form of a stress wave along the direction of the beam height and length, which results in the beam’s local and overall response. Under the impact of the test beam, the positive moment is immediately generated in the span, and the negative−moment appears on both sides of the span. With the continuation of the impact process, the positive−moment region in the span becomes larger, and the negative−moment region gradually moves to the quadrature point, and when the impact force is attenuated, the negative−moment region moves to the support and finally disappears, and the beam is globally in the positive−moment region, and when the shear force reaches the shear strength of the concrete in the process, the diagonal cross−section of the beam undergoes shear damage, resulting in diagonal cracks. A diagonal crack is produced. When the bending moment reaches the flexural strength of the concrete, bending damage occurs in the normal section of the beam, producing vertical cracks. When the diagonal and vertical cracks intersect, the beam undergoes combined bending and shear damage, resulting in a reduction in the beam’s load−bearing capacity.
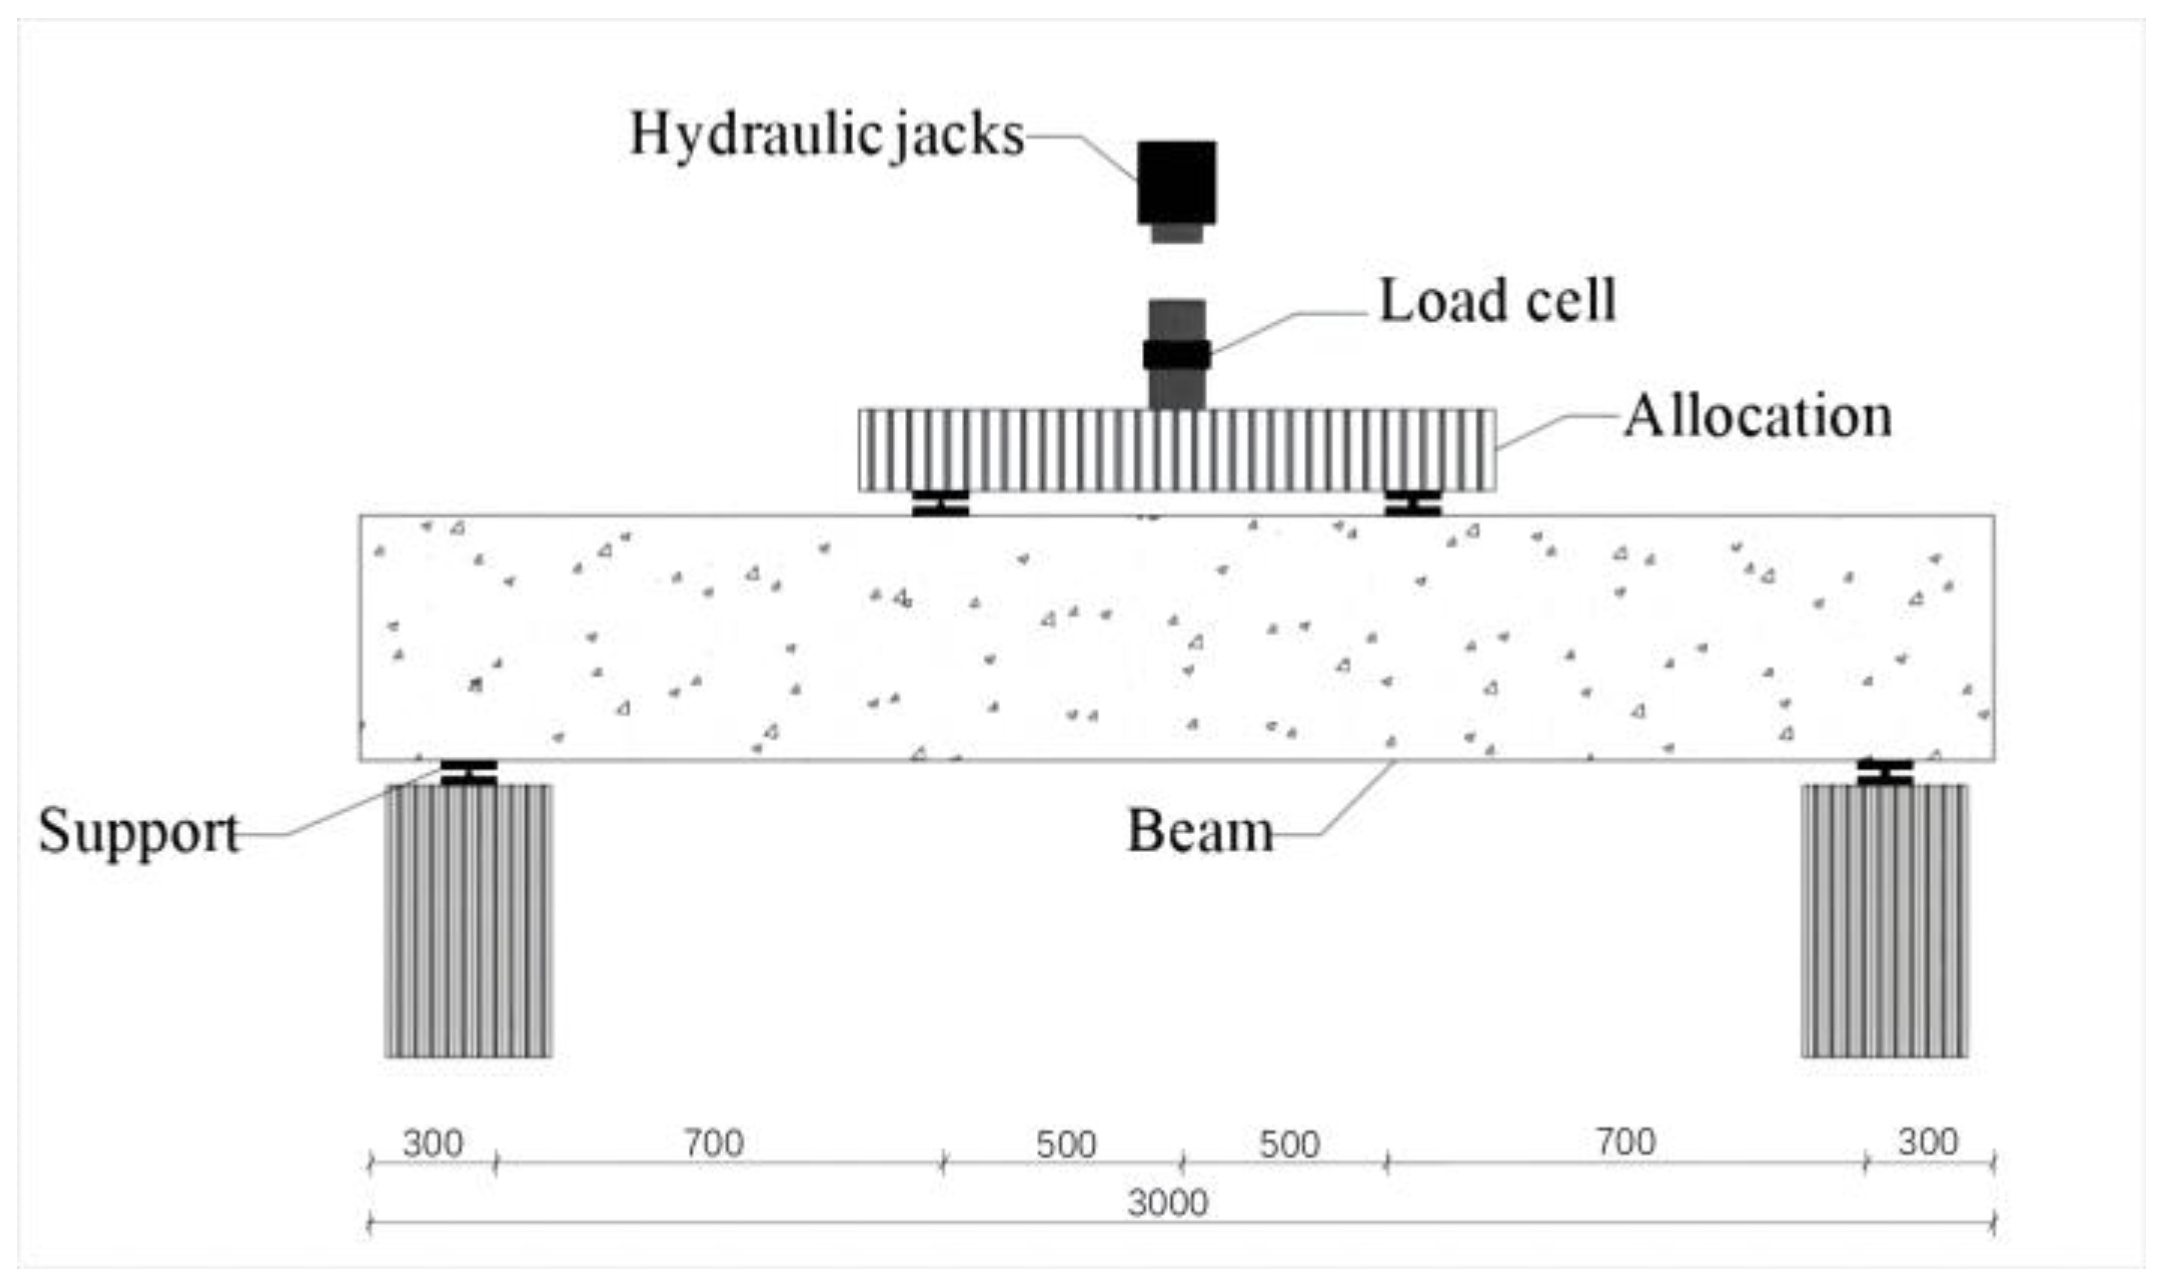
3.7. Residual Flexural Bearing Capacity
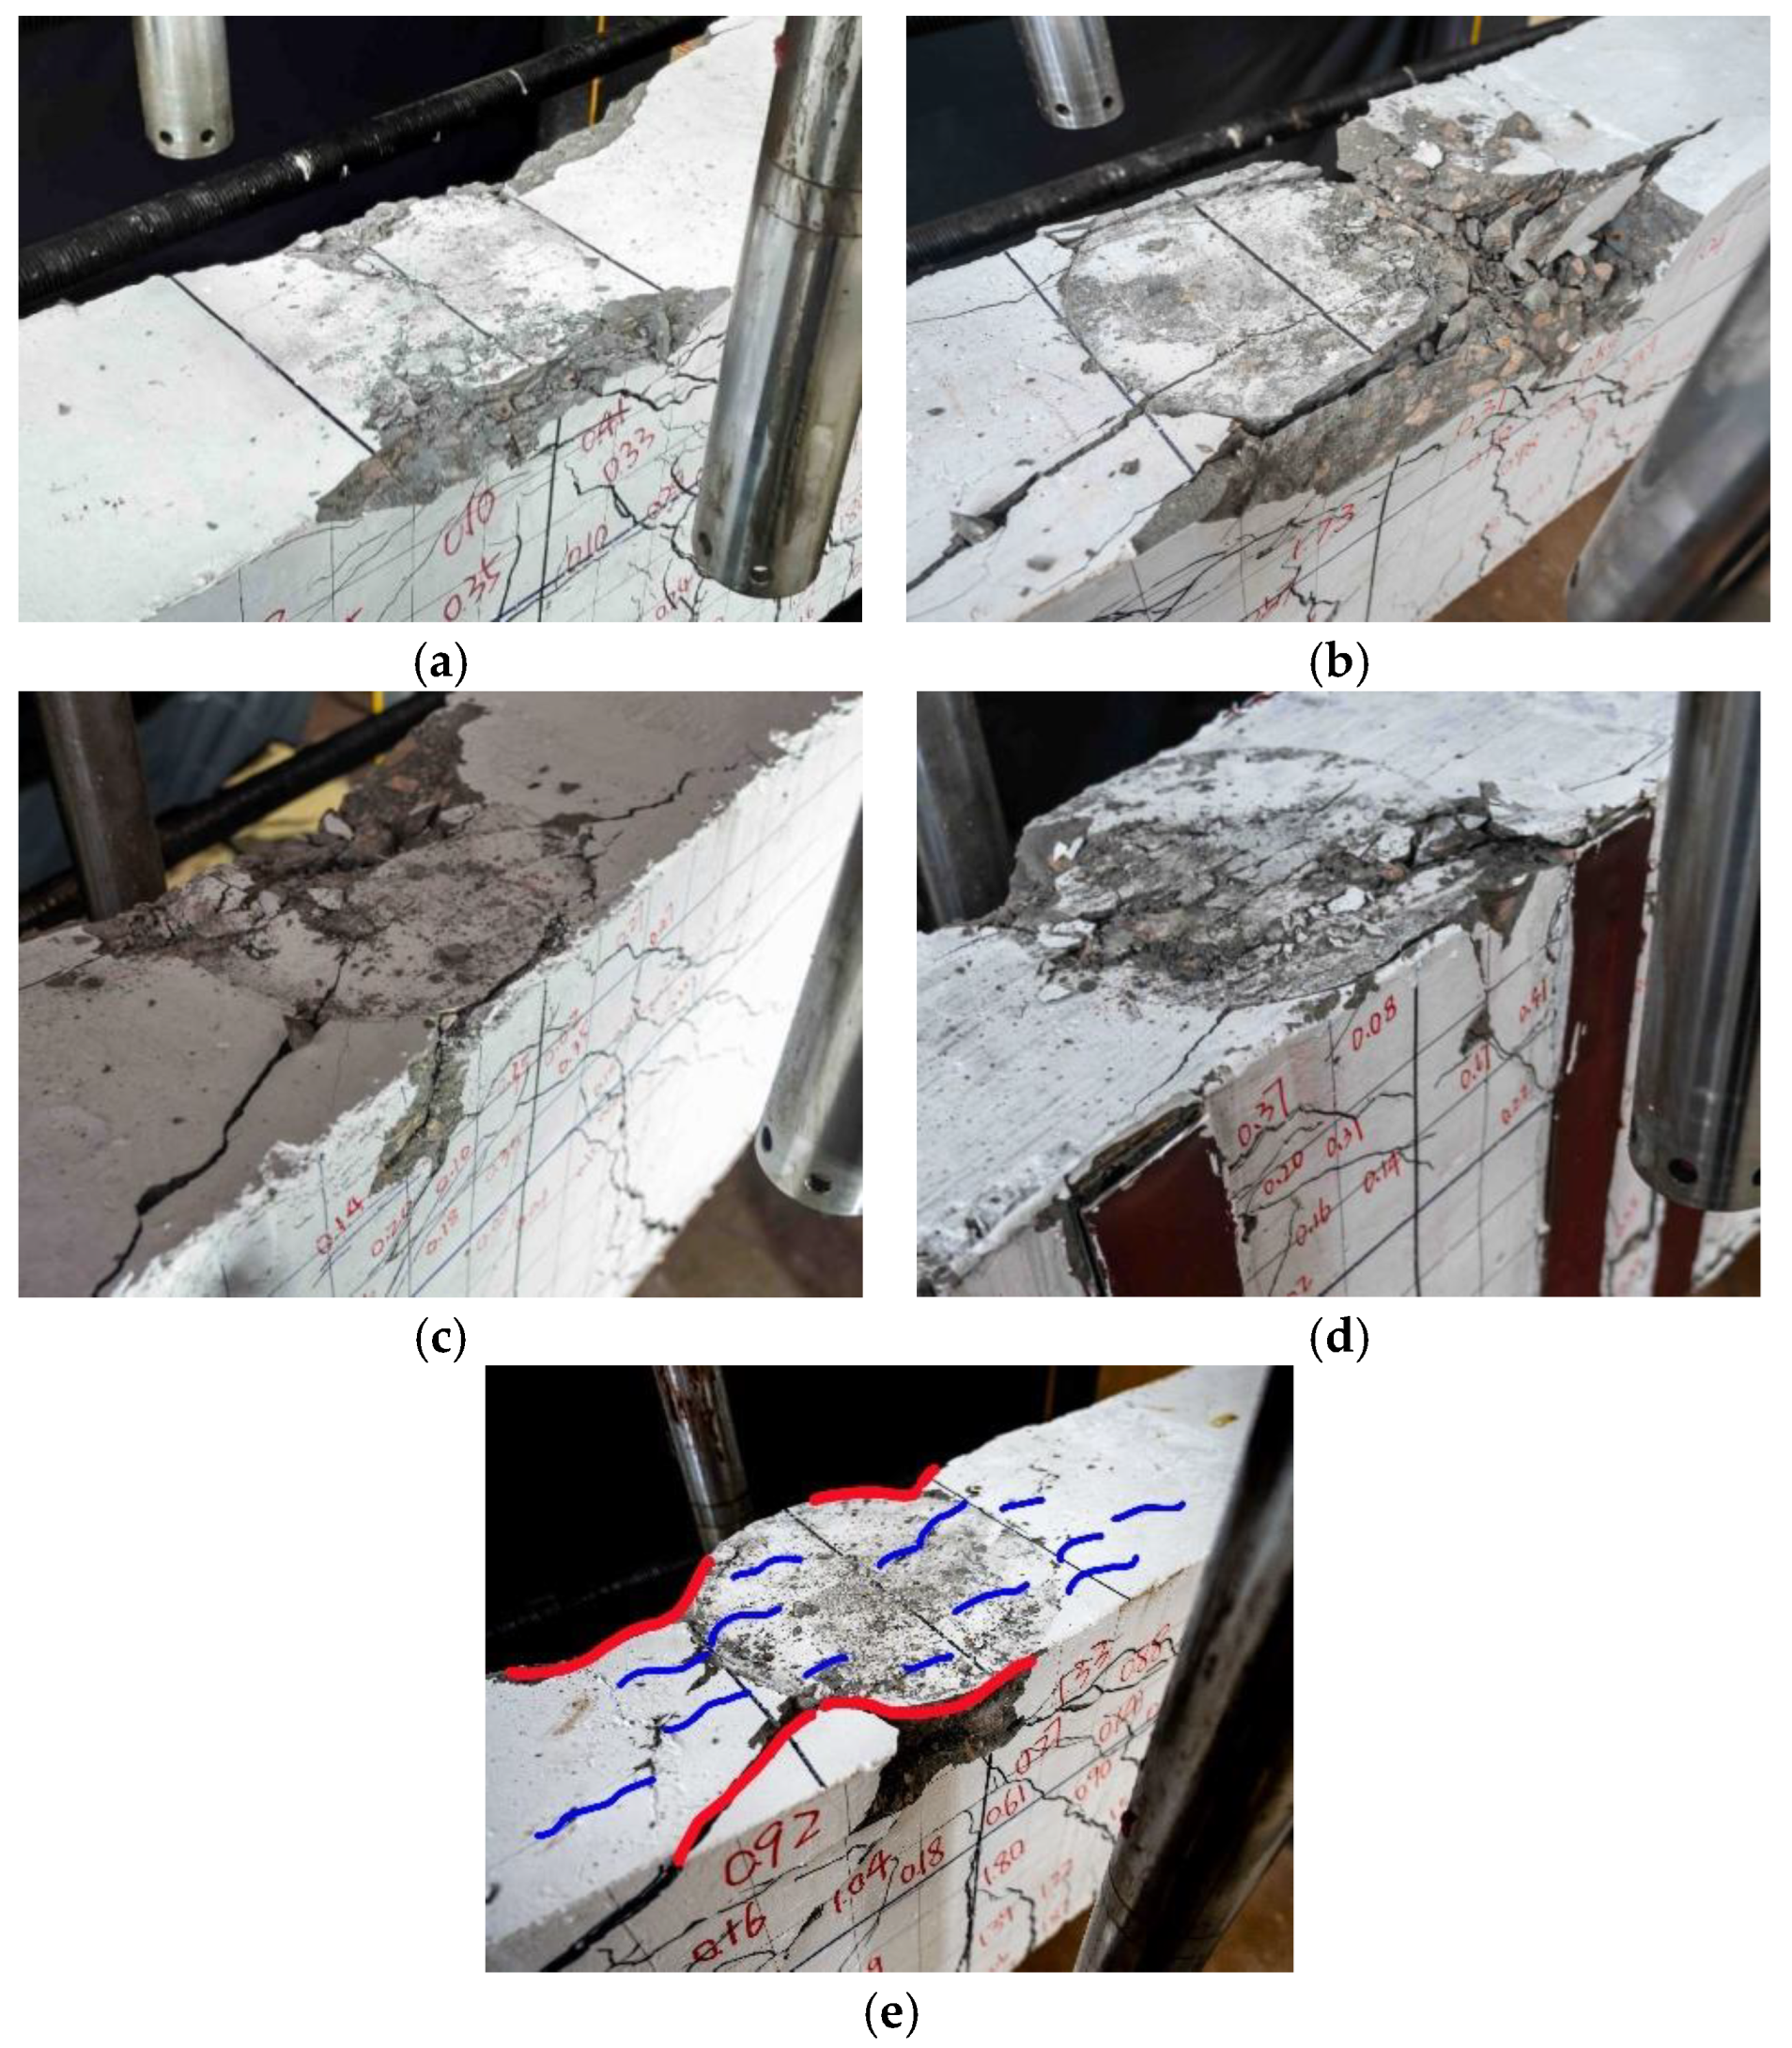
To further study the residual flexural bearing capacity of partially precast concrete beams strengthened with bonded steel plates after an impact load, this section addresses the residual flexural bearing capacity tests conducted on four test beams to obtain their failure modes and residual bearing capacities. After the residual flexural bearing capacity tests, the overall failure modes of partially precast concrete beams with bonded steel plates are shown in
Figure 19, and the local failure modes are shown in
Figure 20.
Table 4 is a summary table of each test beam’s residual flexural bearing capacity. It can be seen that the residual flexural bearing capacity of the B1 test beam is 37.1 kN·m higher than that of A1, and the residual flexural bearing capacity of the B2 test beam is 8.8 kN·m higher than that of B1. With the increase in the thickness of the bonded steel, the residual flexural bearing capacity of the test beam increases significantly because the overall damage to the test beam strengthened with the bonded steel is reduced following the drop weight impact test. The test beam’s bearing capacity also increases as a result of the bottom steel plate’s restraint. Comparing the residual flexural bearing capacity values of B1 and B3 after applying the U−shaped steel plate hoop, the test beam had a higher residual flexural bearing capacity, and the lifting effect was better than that of increasing the thickness of the steel plate.


