Article

Alternative Fiber-Based Paperboard Adhesion Evaluation with T- and Y-Peel Testing

Pulp and Paper Institute, 1000 Ljubljana, Slovenia
*
Author to whom correspondence should be addressed.
Appl. Sci. 2023, 13(17), 9779; https://doi.org/10.3390/app13179779
Submission received: 1 August 2023 / Revised: 18 August 2023 / Accepted: 25 August 2023 / Published: 29 August 2023
(This article belongs to the Section Materials Science and Engineering)

Abstract

:
Due to increased pressure on the availability of wood biomass in the EU and the regulatory attempts to lower CO2 values, where wood-based biomass plays a crucial role in carbon sequestration, the use of cellulose derived from alternative sources is gaining increased interest in the pulp and paper industry as well as in other industries. The processing properties of alternative fiber-based packaging need to be checked in current processing operations with other types of materials and recycling workflows. For example, in the production of folding boxes, after printing other converting properties such as glueability are also of great importance. The adhesive absorption and bonding strength of materials are important as adhesive joints of packaging can interfere with the protective function. In the presented research, three different paperboards produced on a pilot scale from alternative raw material sources were tested. Two paperboards were produced from the alien invasive plants Japanese knotweed and black locust, and one from residual sawdust. The basic paperboard properties were tested regarding paperboard porosity, roughness, z-directional tensile strength, and dynamical behavior regarding liquid interaction (contact angle and liquid penetration dynamic), as water-based adhesives were used in the research. For adhesive joint strength testing, Y- and T-peel adhesion testing was performed on the joint paperboard samples, as still there is no fully standardized method for the evaluation of such fiber-based material properties. The results indicate differences in the penetration dynamics of liquids. This parameter had the highest influence on the peel adhesion strength, while porosity, roughness, and dynamic contact angle were not so significant. Regarding the two adhesive joint tests, the differences in separate materials regarding peel adhesion curves show similar results. However, the Y-peel maximum force values are higher due to the testing setup (in comparison to the T-peel test). The paperboards made from invasive plants showed adhesive joint failures which are more suitable for tamper-proof packaging due to their low surface strength and crack propagation into the fiber structure.

1. Introduction

The significance of adhesive joints in packaging extends throughout various stages of the packaging lifecycle, encompassing conversion, transportation, storage, shelf exposure, and end-of-life operations. In this dynamic cycle, adhesive joints endure persistent loads stemming from environmental factors such as external forces from adjacent packaging units, dynamic stresses from machinery, and climatic fluctuations including temperature and relative humidity variations.
The principal determinant of effective adhesive bonding for fiber-based packaging products is consistently the attainment of complete fiber tear upon separation of the adhesive joint. Traditionally, the assessment of mechanical strength in the converting industry involves visual inspection of fracture surfaces subsequent to manual peeling. An adhesive joint is acceptable if over half of the affected fibers remain attached to the fractured adhesive surface. Failure to achieve fiber tear along the adhesive joint signifies a deficiency in packaging conversion success. However, this technique relies heavily on subjectivity, relying on individual expertise and experience [1].
According to Shires [2], this method can lead to misinterpretation of adhesive bond performance in scenarios where (a) the fiber structure’s strength falls short of application demands; (b) failure does not involve fiber tear, yet the strength exceeds application requirements; (c) the bond’s long-term response to stress differs from its short-term behavior, such as the occurrence of creep effects.
Adhesive bonding can succumb to three distinct failure mechanisms: adhesive failure, cohesive failure, or substrate failure. Adhesive failure primarily arises from inadequate adhesive penetration into the surface, while substrate failure pertains to the internal bonding of the substrate (in the case of paper packaging, the interlocking of fibers and/or additives/coatings). Cohesive failure relates to inadequate cohesive forces within the adhesive or coating layer itself.
The process of adhesive bonding in paper-based materials can be divided into three phases [3]. The initial phase involves pressure-regulated adhesive penetration into the paper structure, influenced by factors such as surface pore structure, liquid rheology, and other material properties. In the subsequent phase, the applied adhesive layer undergoes dewatering (affected mostly by paper surface sizing), and in the final phase, the adhesive solidifies and sets through processes involving penetration, evaporation, and/or curing reactions.
In a recent investigation by Dohr and Hirn [4], diverse paper properties affecting the adhesive strength of starch bonding were explored through measurements of surface roughness, wettability, and glue penetration. Their findings indicated that macro-scale roughness had limited influence, with the primary parameters affecting the adhesive strength being fiber wetting and glue penetration into the fibers. This aligns with the research conducted by Bardak et al. [5], who examined adhesive joints in decor papers. The adhesive exhibited minimal impact on the mechanical properties of the paper, whereas significant variations were noted based on the raw paper’s basis weight (grammage). Additional paper attributes such as porosity and surface energy were found to influence adhesive penetration [6].
All these studies were performed using commercially available softwood or hardwood pulp papers, while no previous studies were conducted on alternative fiber papers. Alternative fiber papers have been in focus throughout the research and industry community due to the predicted over-use of tree-based papers (even with the high recycling rates). In addition to lowering the demand for wood-type cellulose, which takes several years to grow, the use of alternative fibers (derived from non-woody biomass) helps carbon sequestration strategies due to their quick renewing. An overview of the non-wood fibers for papermaking can be found in the research of Abd El-Sayed et al. [7]. One of the under-utilized cellulose sources, also for packaging papers, are the so-called invasive plants. Invasive plants are non-native in an ecosystem, where their spreading can cause economic and environmental harm to the local environments. Furthermore, an important factor with invasive plants is the preservation of the local biodiversity, as these invasive plants tend to eradicate the local species. Based on the data obtained from the European Environmental Agency (EEA) there are around 10,000 alien species which endanger biodiversity in the EU (European Union). In the agency’s report on the impact of these species in the EU, Japanese knotweed is classified as a negative species due to inhibiting the growth of woody seedlings and shading out other plants, which results in a delayed succession. Furthermore, direct economic impacts were reported in the EEA report, as they may profoundly change ecosystem functioning by altering species composition, physical habitat components, nutrient cycling, primary production, and by damaging the flood defense structures. In Slovenia, Japanese knotweed can be found in all kinds of habitats, with very dense structures along riverbeds. There is no exact data on the surfaces covered in the whole of the EU but, for example, based on the data in the UK, 70% of land had some trace of Japanese knotweed, and the socio-economic cost is around GBP 165.6 million per annum in the UK alone [8].
Its quick replenishment and spreading can be made useful if appropriate utilization can be organized, and recently alternative papers made from invasive plants have been found to be good materials for packaging [9,10] as well as for printing [11,12,13,14].
While there are several ISO and ASTM standards regarding the measurement of peel adhesion on materials, a specific standard for folding boxes made of fiber-based materials is non-existent. Some studies report the use of experimental methods where the intrinsic strength of an adhesive joint between solids can be determined and are based on experiment—the theory of contact mechanics [15]. The research of Gent and Kinloch [16] discussed assumed elastic deformation of the substrate material forming the interface, and this type of problem was subsequently studied in more detail by other authors. Gent and Hamed [17] reported that the energy expended in the substrate when it undergoes plastic deformation can make a major contribution to the total measured peel force. They observed that the extent of such plastic energy was governed by the adhesion strength relative to the thickness and yield stress of the substrate. These forces and deformations in the adhesive joints are applied through the measurement of the peel strengths of joints. A recent comprehensive overview of the different peel tests has been published by Barlett et al. [18]. The modified methods of so-called T-peel (ISO 11339 [19] and ASTM D1876 [20]) are used instead. There are some specially developed methods, such as the Y-peel presented in the works by Korin et al. [1], which give an objective result from the force–elongation curve. This method was specifically developed for cardboard packaging which deals with bonding two semi-rigid materials. The Y-peel test is a redesign of the constrained T-peel test. A non-standardized method for packaging adhesive joint testing is the angle peel method [21].
The peel angle always affects the peel forces. Most measurements are performed at a peel angle of 90 or 180 degrees. All peel adhesion curves have broadly three regions: the initial increase, the transitional decline, and the steady-state propagation regions. This test also enables the peak forces to be derived, as the force required to initiate the peeling.
The objective of the presented research is to test the influence of the material properties of three different papers produced from the alien invasive plants Japanese knotweed and black locust, and from sawdust residual paperboard combinations on the adhesive joint strengths. The testing of the aforementioned materials is carried out using two methods (Y- and T-peel testing), where one is proprietary and the other is a standardized method adjusted to fiber-based packaging. The interaction of the basic material properties of invasive plant papers with the specifics of the peel adhesion testing mechanics will give insights into the development of standardized paper-based packaging testing methods for future research with alternative materials.

2. Materials and Methods

2.1. Paperboard Samples

For the presented research, three different paperboards (that can be used for packaging production) made of alternative fiber sources were produced: (1) JK—240 g/m2 paperboard made of the invasive plant Japanese knotweed’s fibers (Reynoutria japonica); (2) SD—240 g/m2 paperboard made of residual sawdust; and (3) BL—240 g/m2 paperboard made of black locust fibers (Robinia pseudoacacia), an invasive alien plant harvested or collected in Slovenia.
Japanese knotweed and black locust plants were firstly harvested, dried, and cut into small pieces. After grinding them into 0.5 mm particles, the chemical analyses were performed. The ash content (TAPPI 211 method), hexane and ethanol extractives (TAPPI 204), cellulose (Kürschner. Hoffer method), hemicellulose (chlorite method), and lignin (TAPPI 222) were determined prior to further preparation [22]. The results of the analyses are presented in Table 1.
After chemical analysis, the delignification process of biomass was performed using the Kraft procedure. The biomass was treated with 50% NaOH. The reaction temperature was 160 °C and delignification time 3 h at constant mixing. After delignification, the pulp was separated from the black liquor, screened, and cleaned.
The JK and BL fiber properties were analyzed using a Valmet FS5 fiber analyzer (Valmet, Espoo, Finland), which analyzes fibers based on automated image analysis (Table 2).
In the case of the SD sample, sawdust was incorporated as a filler into the paperboard structure produced from commercially available wood-based Kraft cellulose fibers.
The paperboard samples were machine-produced on a pilot paper machine (Pulp and Paper Institute, Slovenia) which works with a Fourdrinier principle, has a width of 60 cm, and has all the features of an industrial machine regarding fiber bonding and paper production.
The pulp was prepared in a combination with commercially available Kraft wood-based cellulose fibers (Table 2). All papers had similar starch and surface sizing components, the freeness of the pulp was 25° SR for all samples, so the variability in the paperboard properties was mostly due to the fiber properties, filler content, paperboard formation, and porosity properties. Their properties are presented in Table 2; their appearance in Figure 1.

2.2. Paperboard Sample Characterization

Basic paperboard properties, which were also tested by other researchers and that can influence the adhesion properties, were first investigated. As the grammages were similar, these properties were believed to have a more important influence. The surface roughness and porosity were determined using the Bendtsen type of apparatus (Frank-PTI, Germany). The surface roughness was evaluated according to the ISO 8791-2:2013 [23] standard, while the porosity according to ISO 5636-3:2013 [24]. To determine the internal bond strength of paperboard, the z-directional tensile strength was measured according to the Tappi T 541 [25] method on a ZwickRoell (Ulm, Germany) multi-testing machine. The 900 N pressure with 6 s pressing time was used to determine the interfiber/filler bonding strength.
All testing samples were characterized regarding absorption and wetting capabilities, which influence the ability of the adhesive absorption and consequently the joint strength. The ability of the paperboard samples’ wetting was analyzed using contact angle measurements, which was determined using a 6 μL water drop using a Fibrodat 1100 (Fibro System AB, Stockholm, Sweden) dynamic contact angle tester. The dynamic contact angle of the water drop was measured and evaluated in the first 60 s. In addition to that, the porosity of the samples was determined using the penetration dynamic analyzer Emtec PDA.C 02 (Emtec, Leipzig, Germany). The porosity measurements were performed using water and 15% wt. isopropyl alcohol (IPA) testing liquid and the dynamic absorption curves were scanned. This measurement enables distinguishing liquid penetration based on an ultrasound measurement of the dynamics of the test liquids. This enables more precise determination of the penetration into the fiber structure compared to the airflow-based measurement systems, which measure the average air leak quantity.

2.3. Adhesion Strength Testing

The testing samples were prepared according to the modified ASTM D1876-08 standard for the T-peel testing and glued together with water-based adhesive EUKALIN 6550-VL-80 (Eukalin, Eschweiler, Germany) with a Brookfield viscosity of 1000 mPas. The adhesive was applied evenly on the surface with a roller over the mask (the quantity of adhesive applied was 0.5 g per testing sample area (2.5 × 24 cm)) and two paperboard samples were pressed together to provide good adhesion. To ensure an even pressure on the whole surface, the samples were pressed with a standardized FINAT 2 kg roller. Before further testing, all prepared samples were conditioned in accordance with the ISO 187 standard.
Testing of the T-peel and Y-peel was performed on a multi-testing machine (ZwickRoell, Ulm, Germany) using a 10 kN measuring head and adjusted specimen holders. The samples were clamped in two different geometries. Firstly, a well-known T-peel test was performed in accordance with the ASTM D1876 standard, where the unbonded part of the sample is clamped in a T position. Additionally, the Y-peel test was carried out with the same settings as the T-peel test, but with modified clamping geometry.
Additionally, after bonding the samples together, an SEM analysis of the joints after testing was performed using a Jeol JSM-6060 LV (Jeol, Tokio, Japan) scanning electron microscope.

3. Results and Discussion

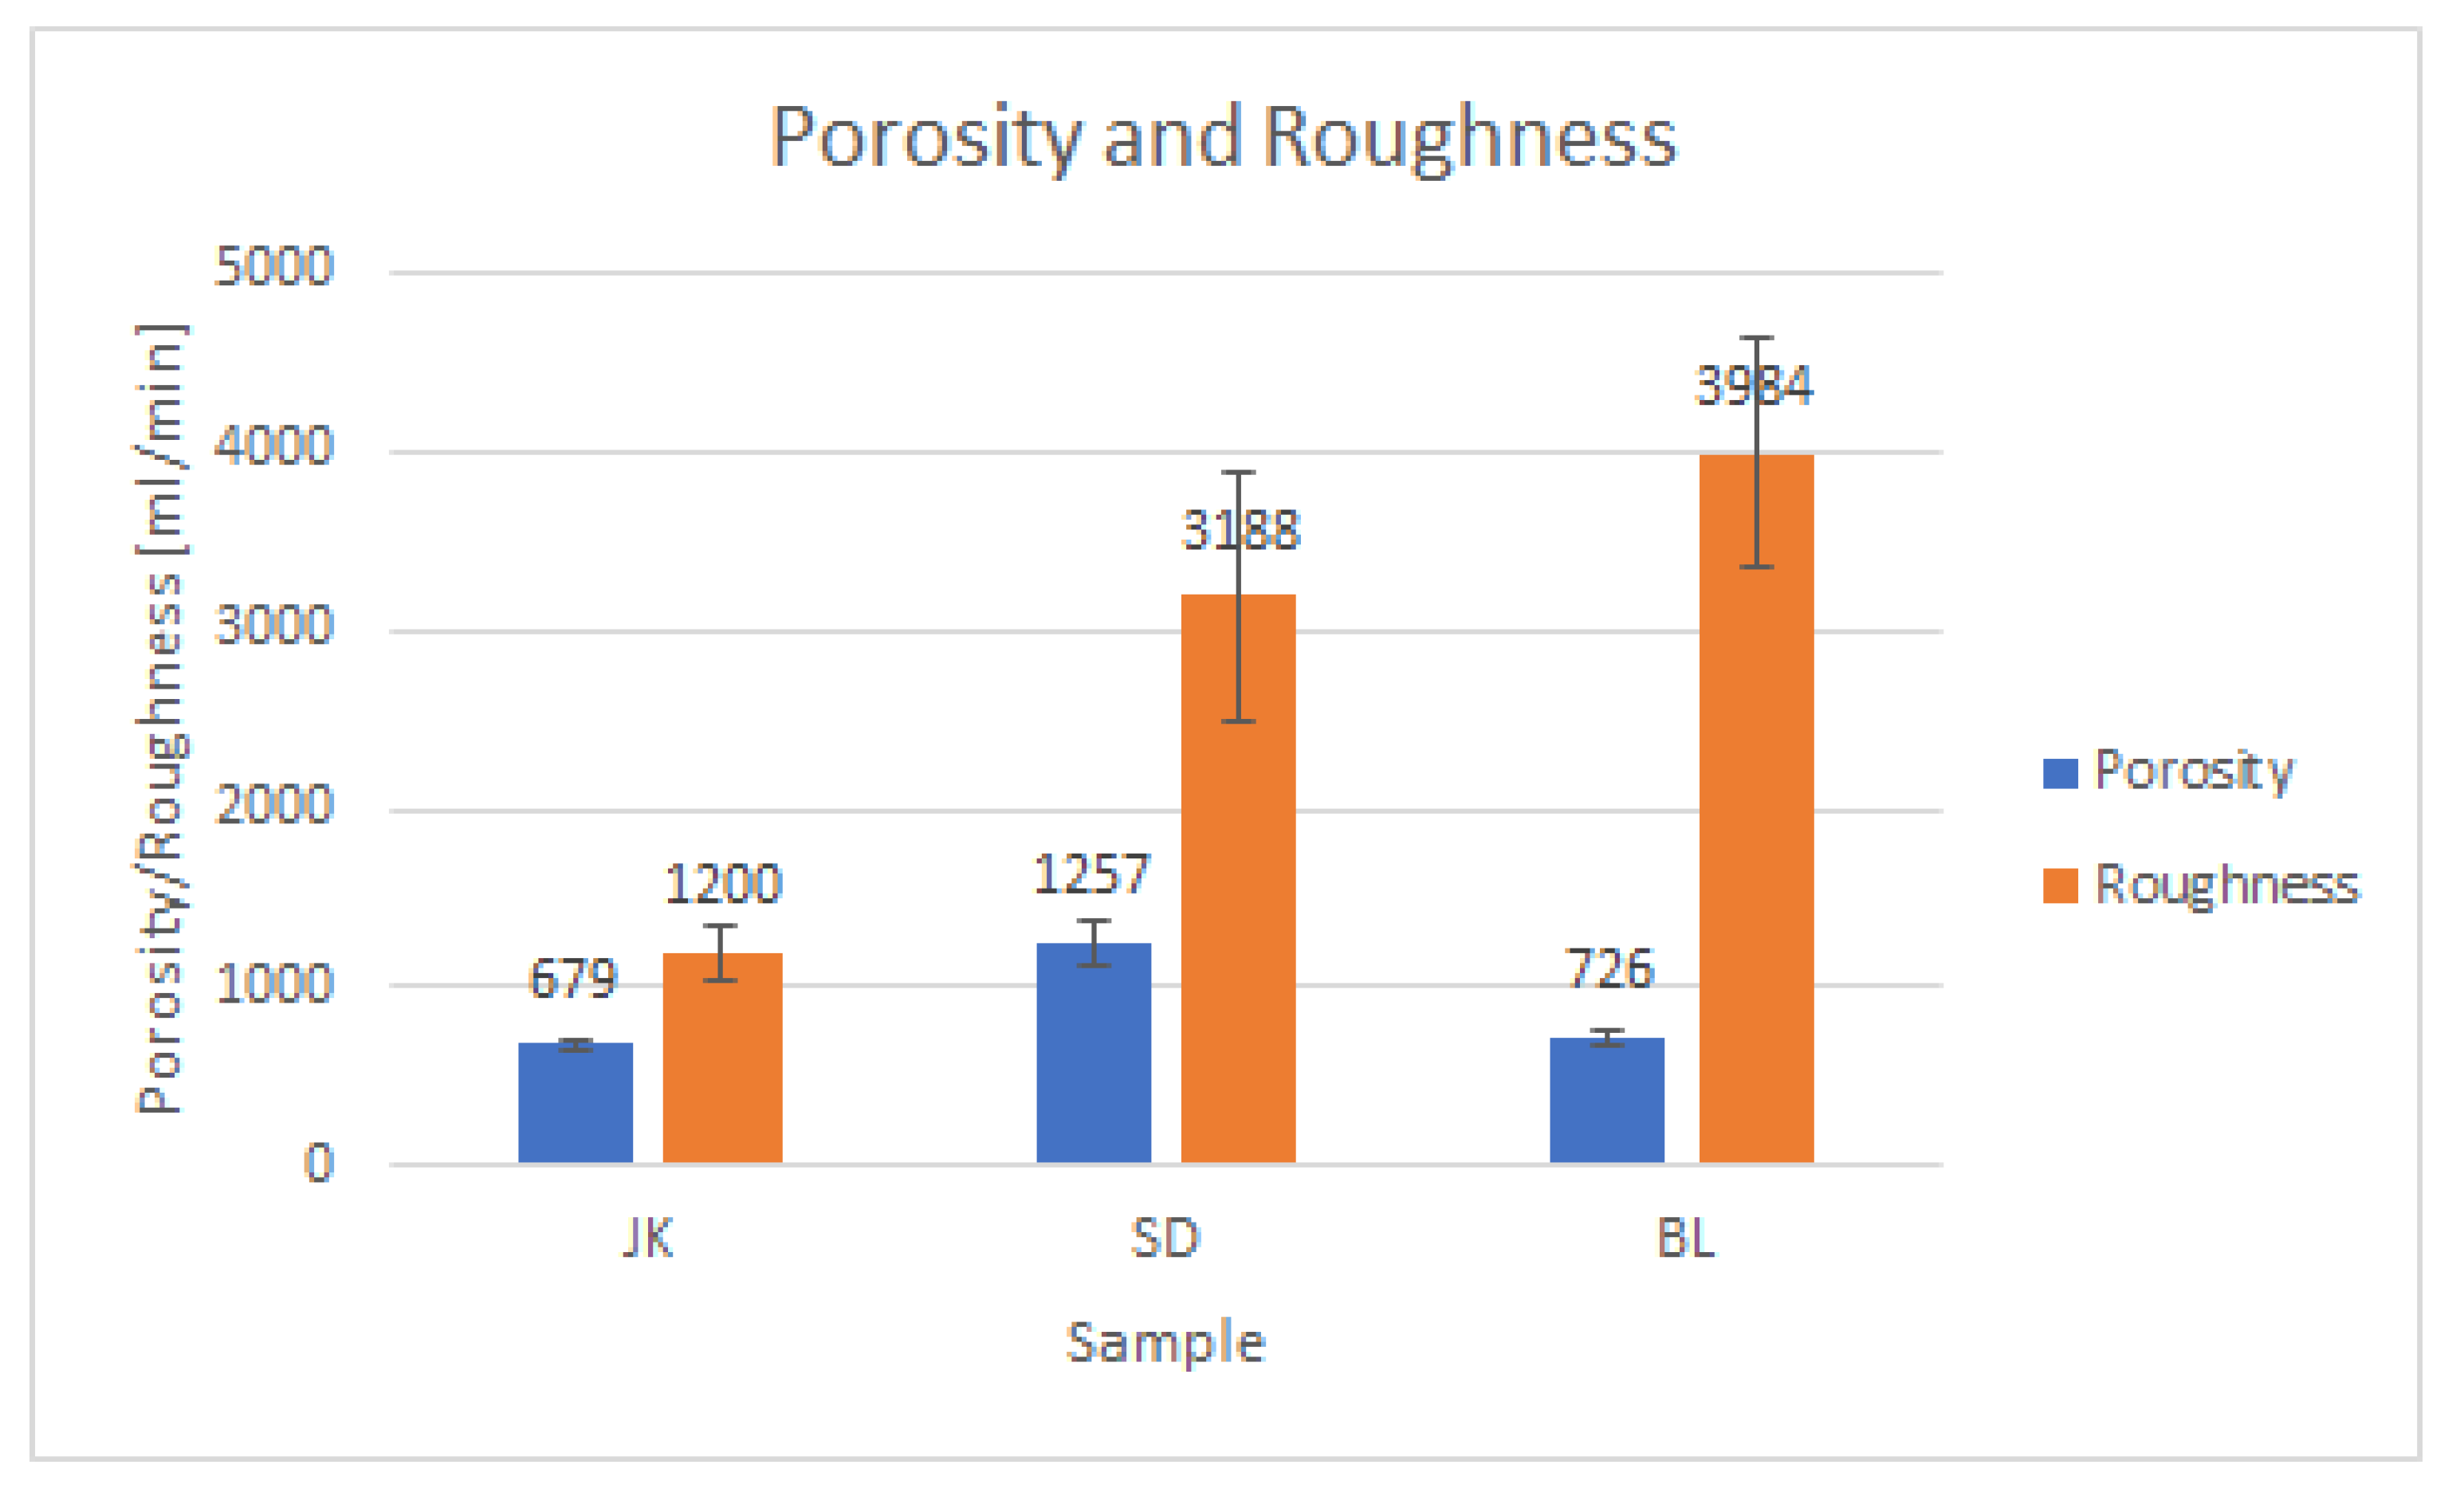
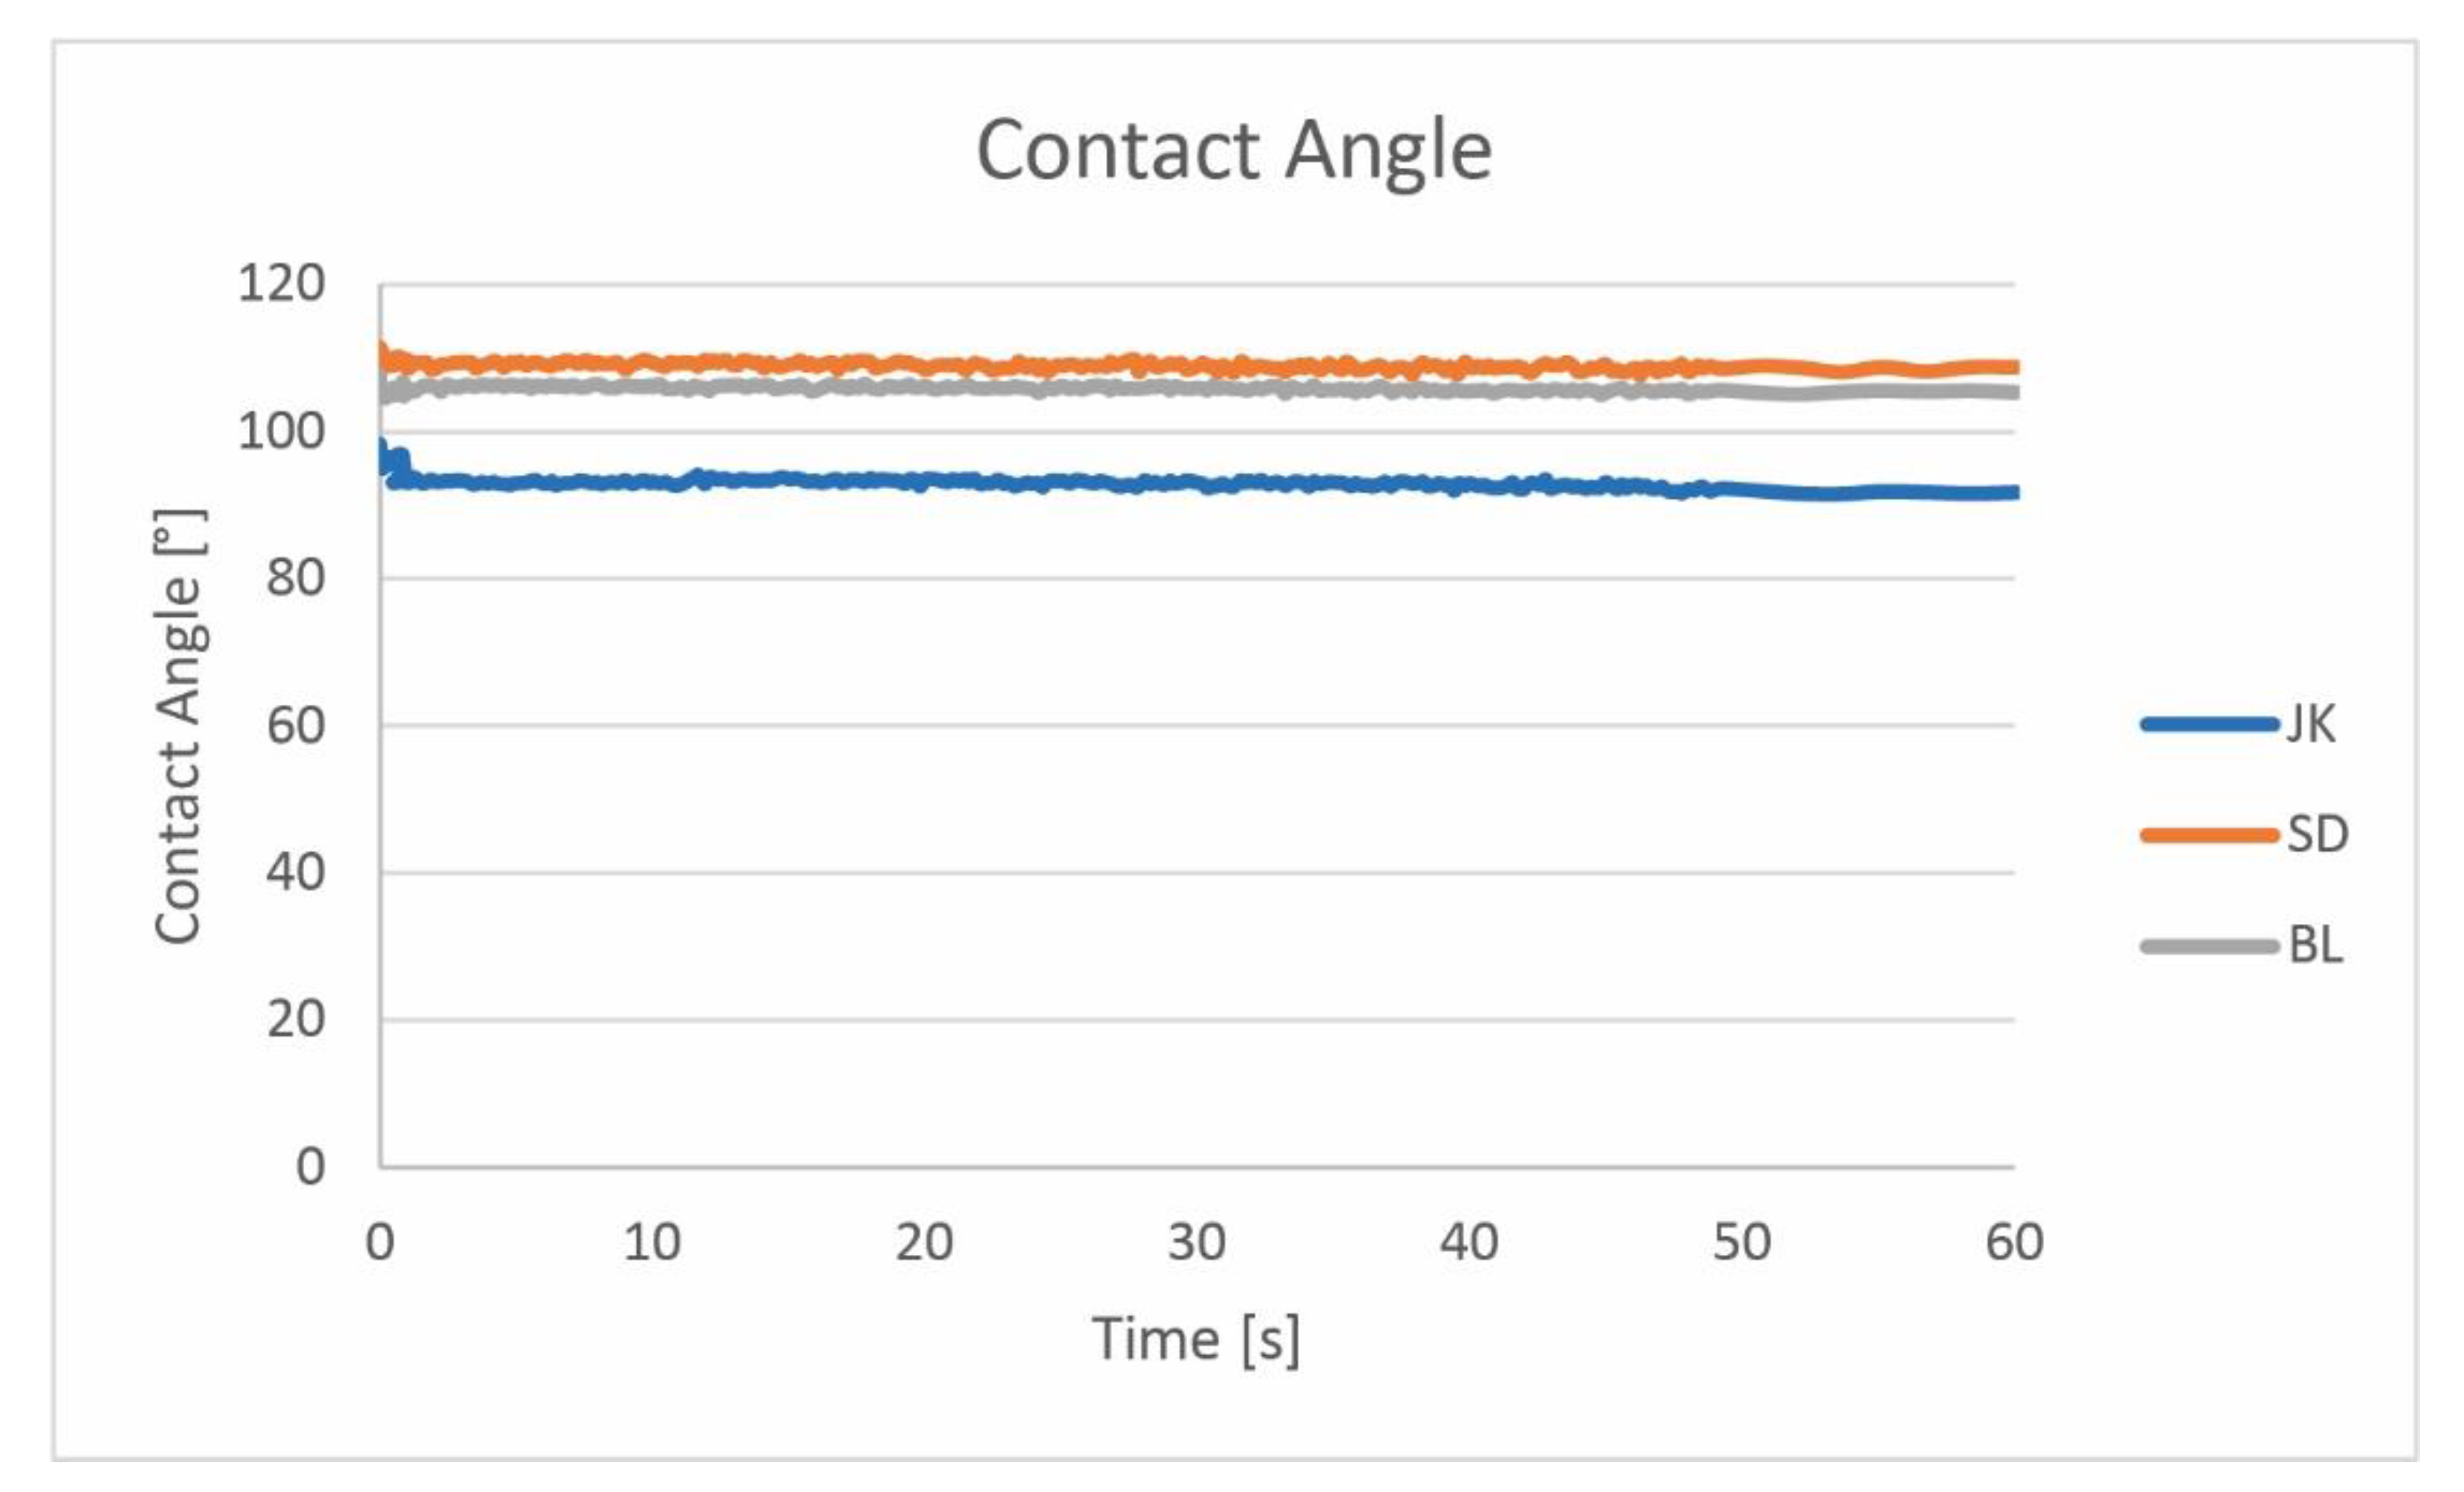
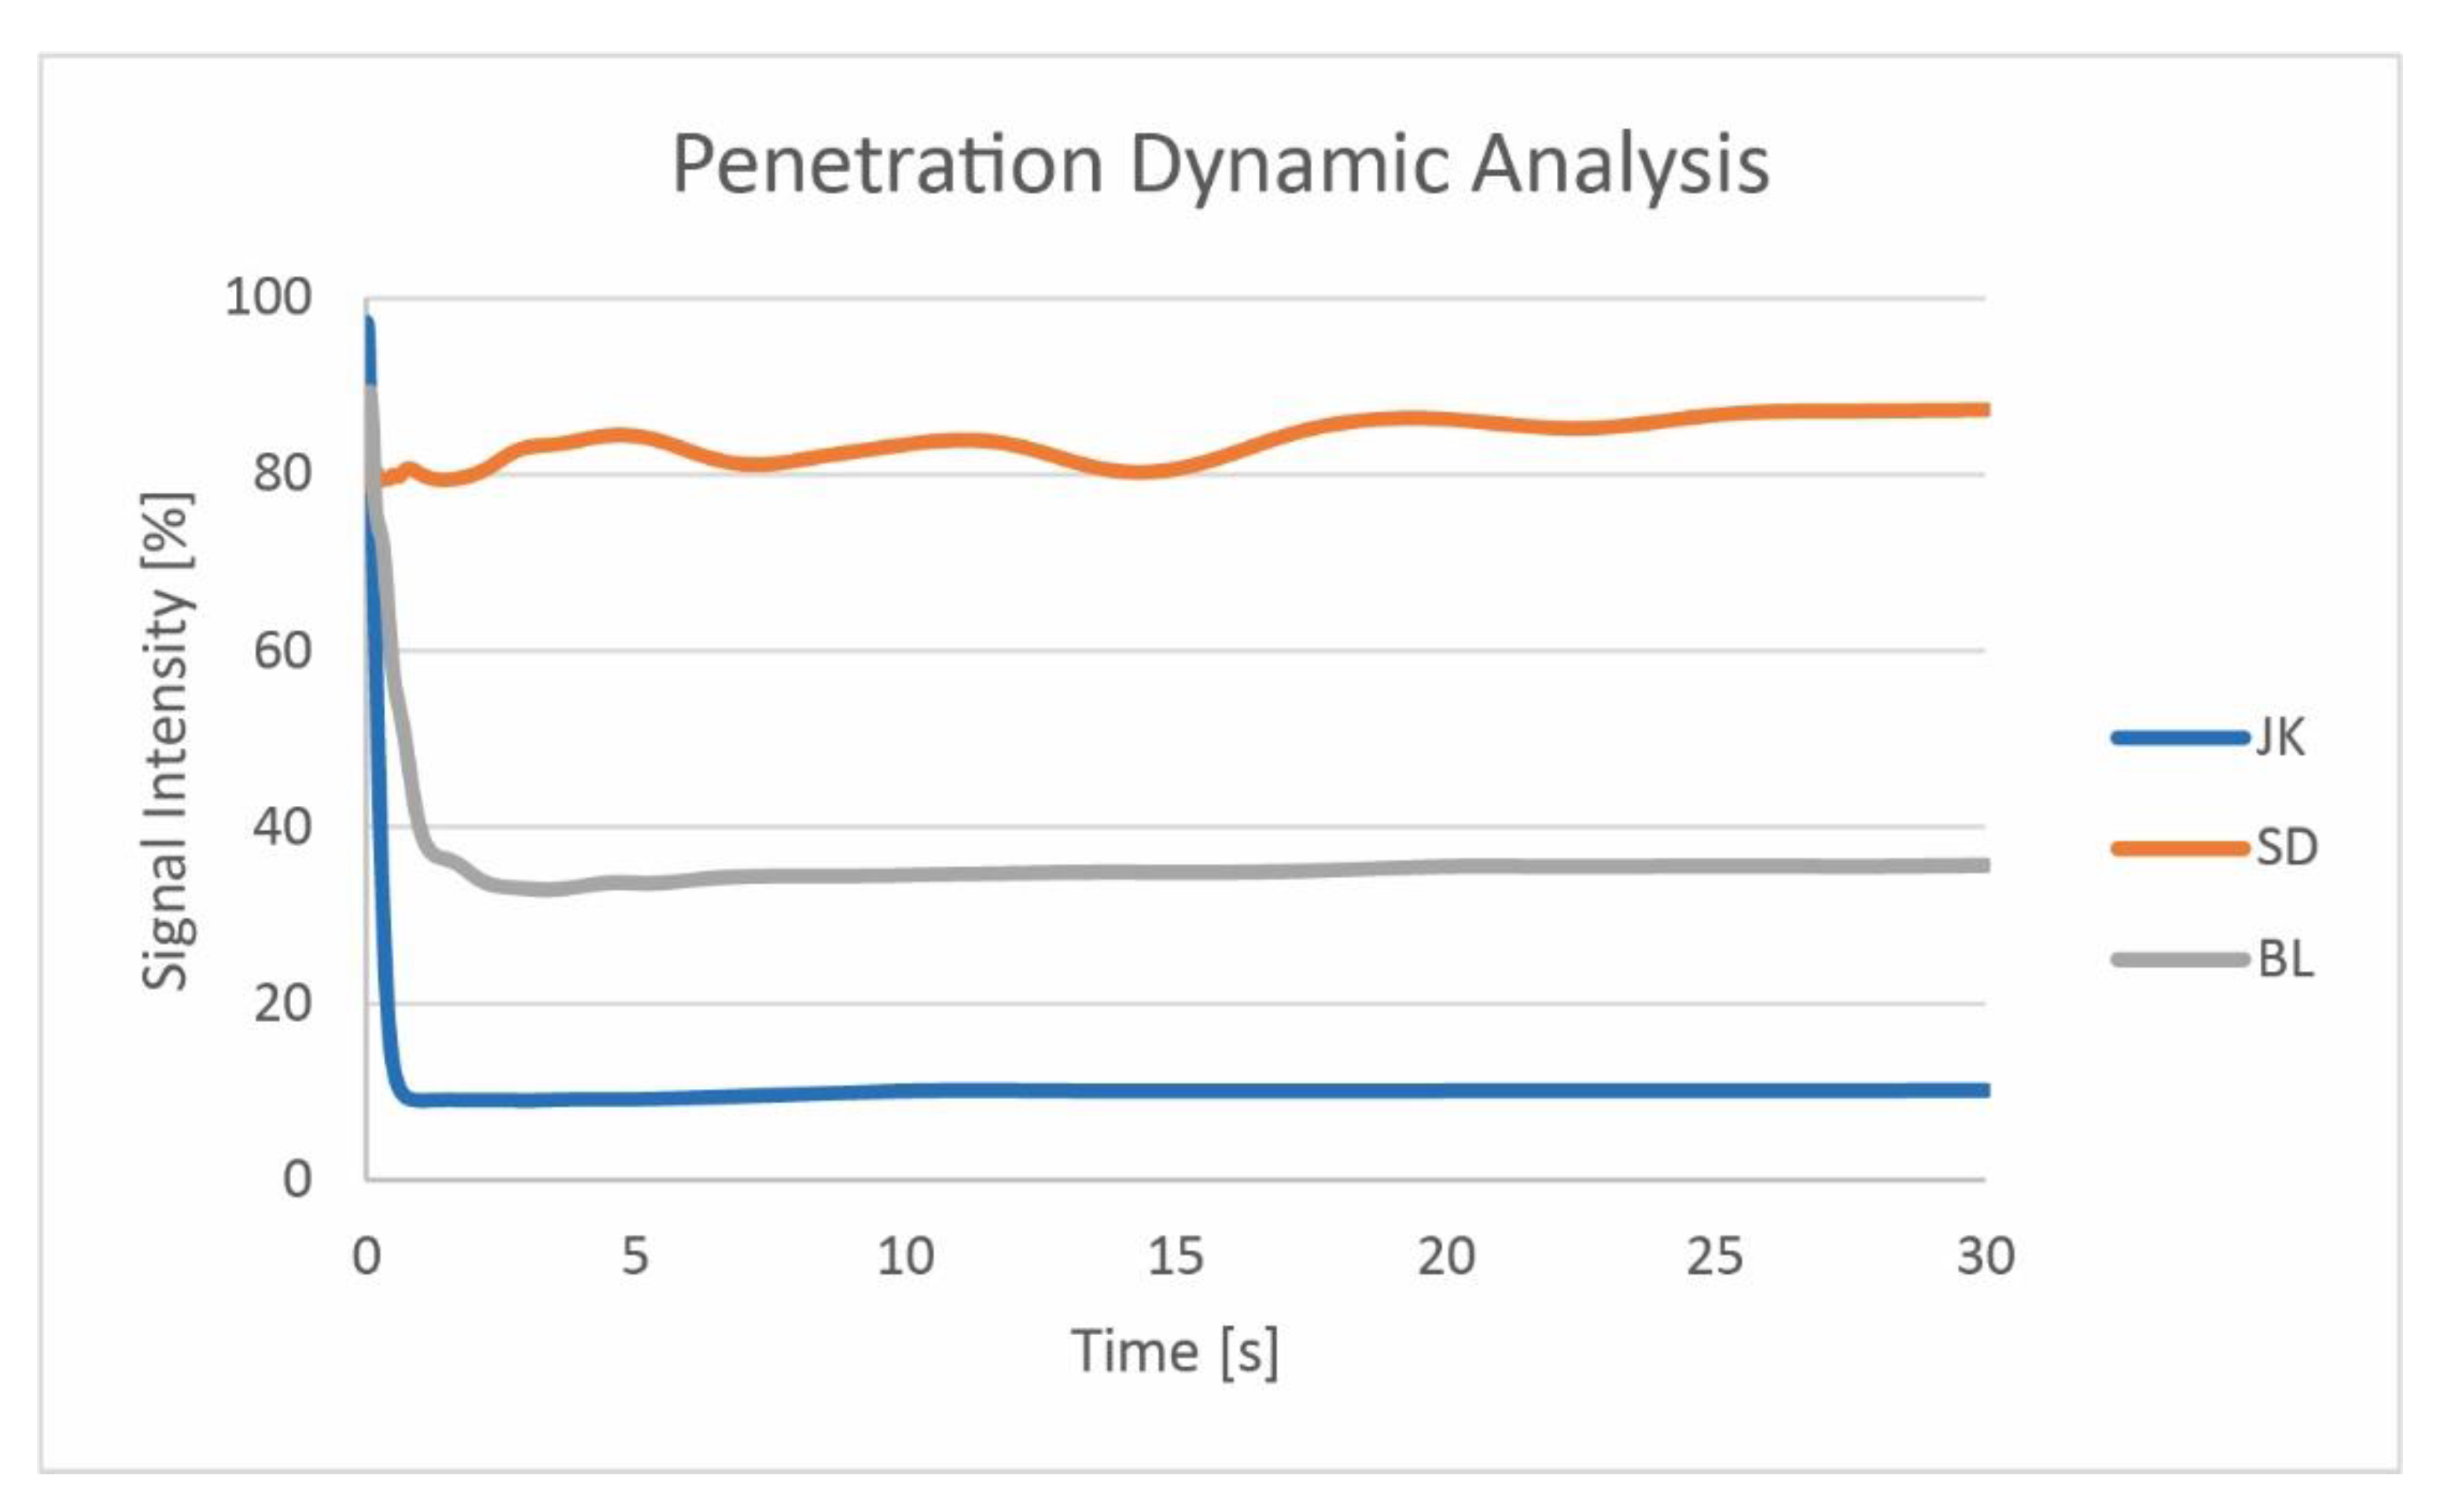
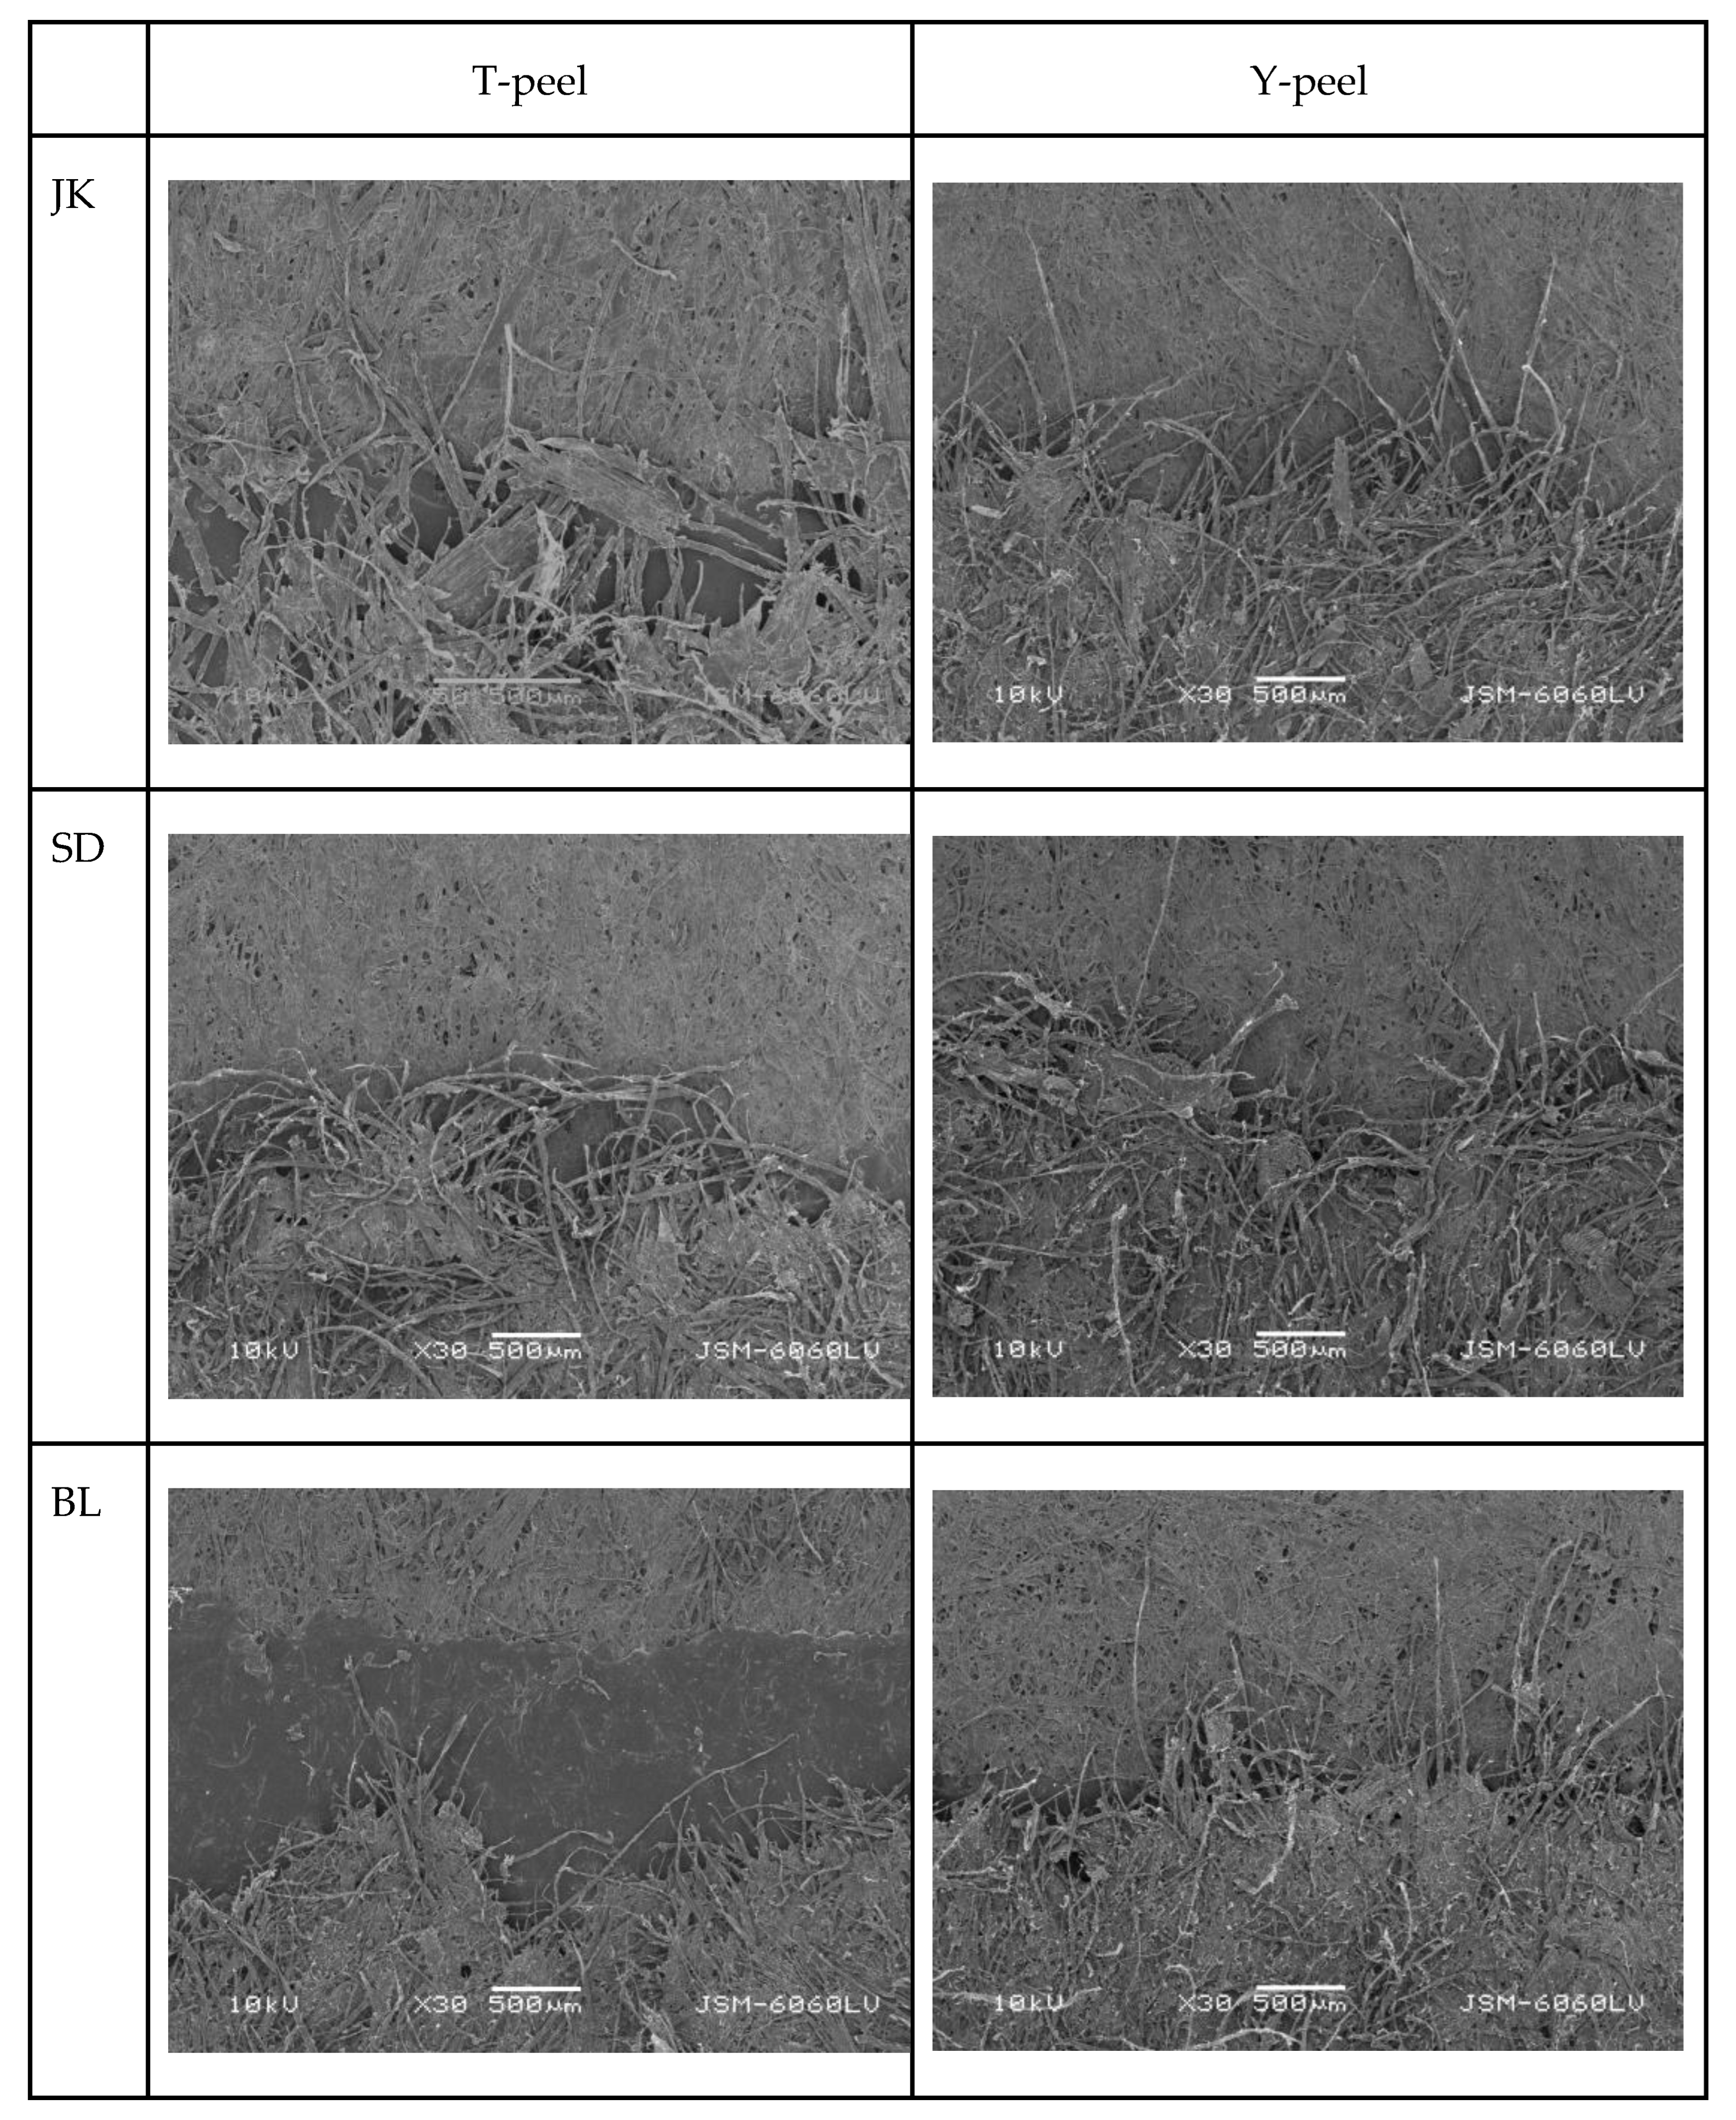
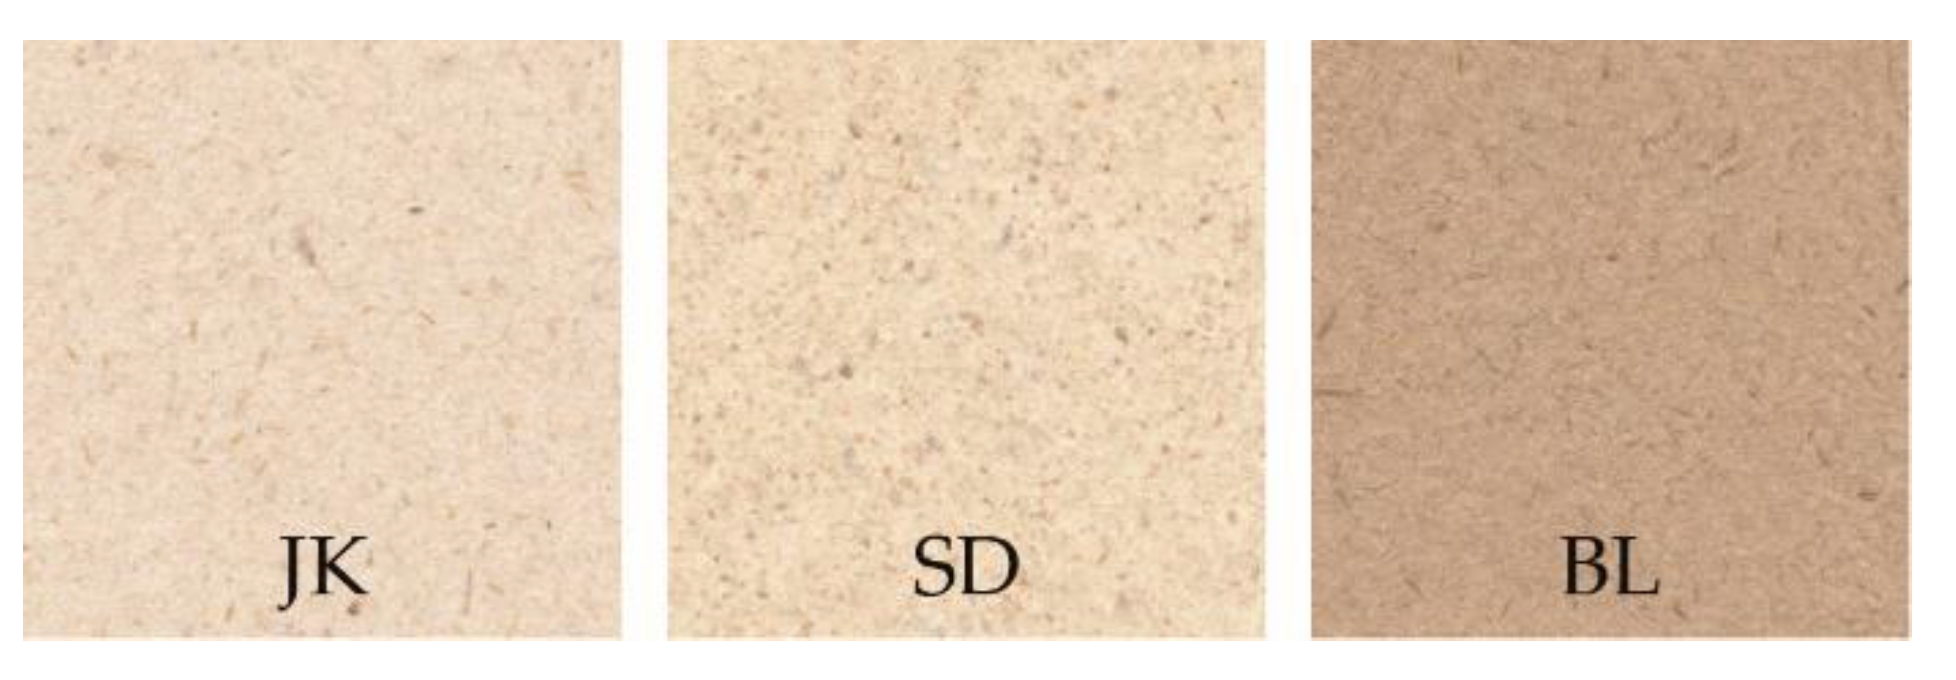
3.1. Paperboard Samples Characterization

Based on earlier research mentioned in the introductory part, the paperboard surface properties can influence the ability of adhesion and consequently the peel adhesion strength. In Figure 2, one can observe the measurement results for porosity (air method) and roughness expressed in mL/min. The largest roughness was measured for the black locust (BL) sample, with an average value of 3984 mL/min, while the lowest value was measured for the Japanese knotweed (JK) samples, with 1200 mL/min. The porosity values show a difference between the SD sample made with sawdust filler and the black locust sample, which indicates that the filler material left open the pore network. So the JK sample had the lowest porosity as well as roughness while the BL sample had low porosity and very high roughness.
As we used non-coated papers and no classic coating was used, the fillers were mixed in the bulk material before paper formation on the moving web. Interrupting the bonding between fibers, fillers in general tend to decrease the strength properties of papers. They also can increase the voids in the paper structure. The sawdust paper had the largest share of fillers, 25%, which had typical values of 0.2 to 2 mm, while the CaCO3 fillers typically range from 0.5 to 3 µm. As the calcium carbonate fillers have smaller sizes and content ratio to mass, this would create smaller intermittent voids and, thus, lower the porosity and roughness compared to larger size and higher sawdust filler content. During the paper production, the larger size sawdust particles have also larger possibilities of mechanical retention (entanglement with the fibers) and, thus, forming a denser surface and bulk structure. With air leak measurement, this applies according to the existing literature as the sawdust paper has the highest air porosity (Figure 2).
In contrast to porosity, the z-directional tensile strength gave slightly different trends in material properties. Z-directional tensile strength is a measure of the internal bond strength of paper or paperboard composites. It is particularly useful for measuring the internal bond strength of single-ply sheets such as the alternative fiber paperboards used in this research, which do not contain additional coatings. The results presented in Figure 3 show that the paperboard from black locust (BL) had the highest z-tensile strength with an average value of 436 kPa, and the lowest value was achieved for the sample made with sawdust (SD) filler. These differences indicate that during the fiber bonding and formation, the higher fiber content (less filler) increased the z-tensile strength, while the lower amount of fibers lowered the value for the SD sample (larger particles and larger air voids—lowering the number of hydrogen bonds between cellulose fibers and lowering overall the mechanical strength of the paper). Furthermore, the BL sample had somewhat longer fibers, which in general increase the tensile stiffness and strength (the z-tensile values were the highest for the high-fiber-content papers with the largest longer fiber ratio). These results also indicate a lower elastic region during the mechanical testing that can induce quicker ply cracking if forces during the peel testing are straining the vertical paperboard composition.
The surface interaction of the adhesive and paperboards was tested with contact angle measurements which are presented in Figure 4. The contact angle was nearly constant for all samples in the first 60 s, which is an extended time (in industrial converting of fibrous materials) where the adhesive/water and fiber matrix interact with each other. Due to high grammage and some surface sizing, the contact angle for all tested paperboards is high. The high dynamic angle implies that the cohesive forces associated with bulk water are greater than the forces associated with the interaction of water with the surface (stronger than the slow swelling of cellulosic fibers in the measured time).
The penetration of the glue into the paperboard surface is important for the adhesive process. The contact angle shows the physicochemical interaction with no additional force moving the liquid part of the adhesive onto the surface. Since the standard paper porosity testing (e.g., Bendtsen porosity) often does not provide sufficiently precise results (due to the two-sidedness and inhomogeneity of paper), the ultrasound testing of penetration dynamics was performed. This measurement presents the interaction between the surface and the testing liquid (water + IPA) and reveals the real pore structure. The measurement is based on sending an ultrasound signal through the working liquid onto the surface, inducing signal drop due to the interaction of the liquid and the tested surface. According to Figure 5, the most porous structure is observed with sample JK, while sample SD has the most closed, non-porous structure. The higher shoulder of the measurement curve shows that the surface is more dense and hydrophobic (Figure 5). So the higher amount of long fibers (no alternative fibers) and larger size of the hydrophobic sawdust particles in combination with the entrapped air bubbles formed a denser liquid/paperboard interface which was harder to penetrate with the ultrasonic “push”. These results show the fine nuances between air permeability and porosity and the measurement techniques used for specific applications.
Nevertheless, some researchers [2] claim that too high a penetration of the adhesive may cause some problems while there is too little adhesive left at the surface and the bonding is weaker than it should be. Regarding penetration dynamic analysis, where the capillary penetration is obvious for sample JK as well as for BL (the signal intensity drops instantly), the high penetration of the adhesive could be true for sample JK, which has an extremely porous structure and the penetration of the liquid occurs instantly.
Following the characterization of the influential factors relating to the utilized paperboards, Y- and T-peel tests were conducted. In the course of these tests, a uniaxial testing apparatus steadily withdraws the upper clamp while continuously recording the resultant forces and their corresponding prescribed deformations. As the upper clamp undergoes displacement, the Y-peel specimen experiences elongation, eventually culminating in the fracture of the adhesive joint within the Y-peel configuration. The Y-peel sample is affixed between pivot-mounted upper and two lower clamps, ensuring that the movement remains devoid of friction. The unconstrained motion of the free ends is prevented due to their secure fixation within the clamps [1].

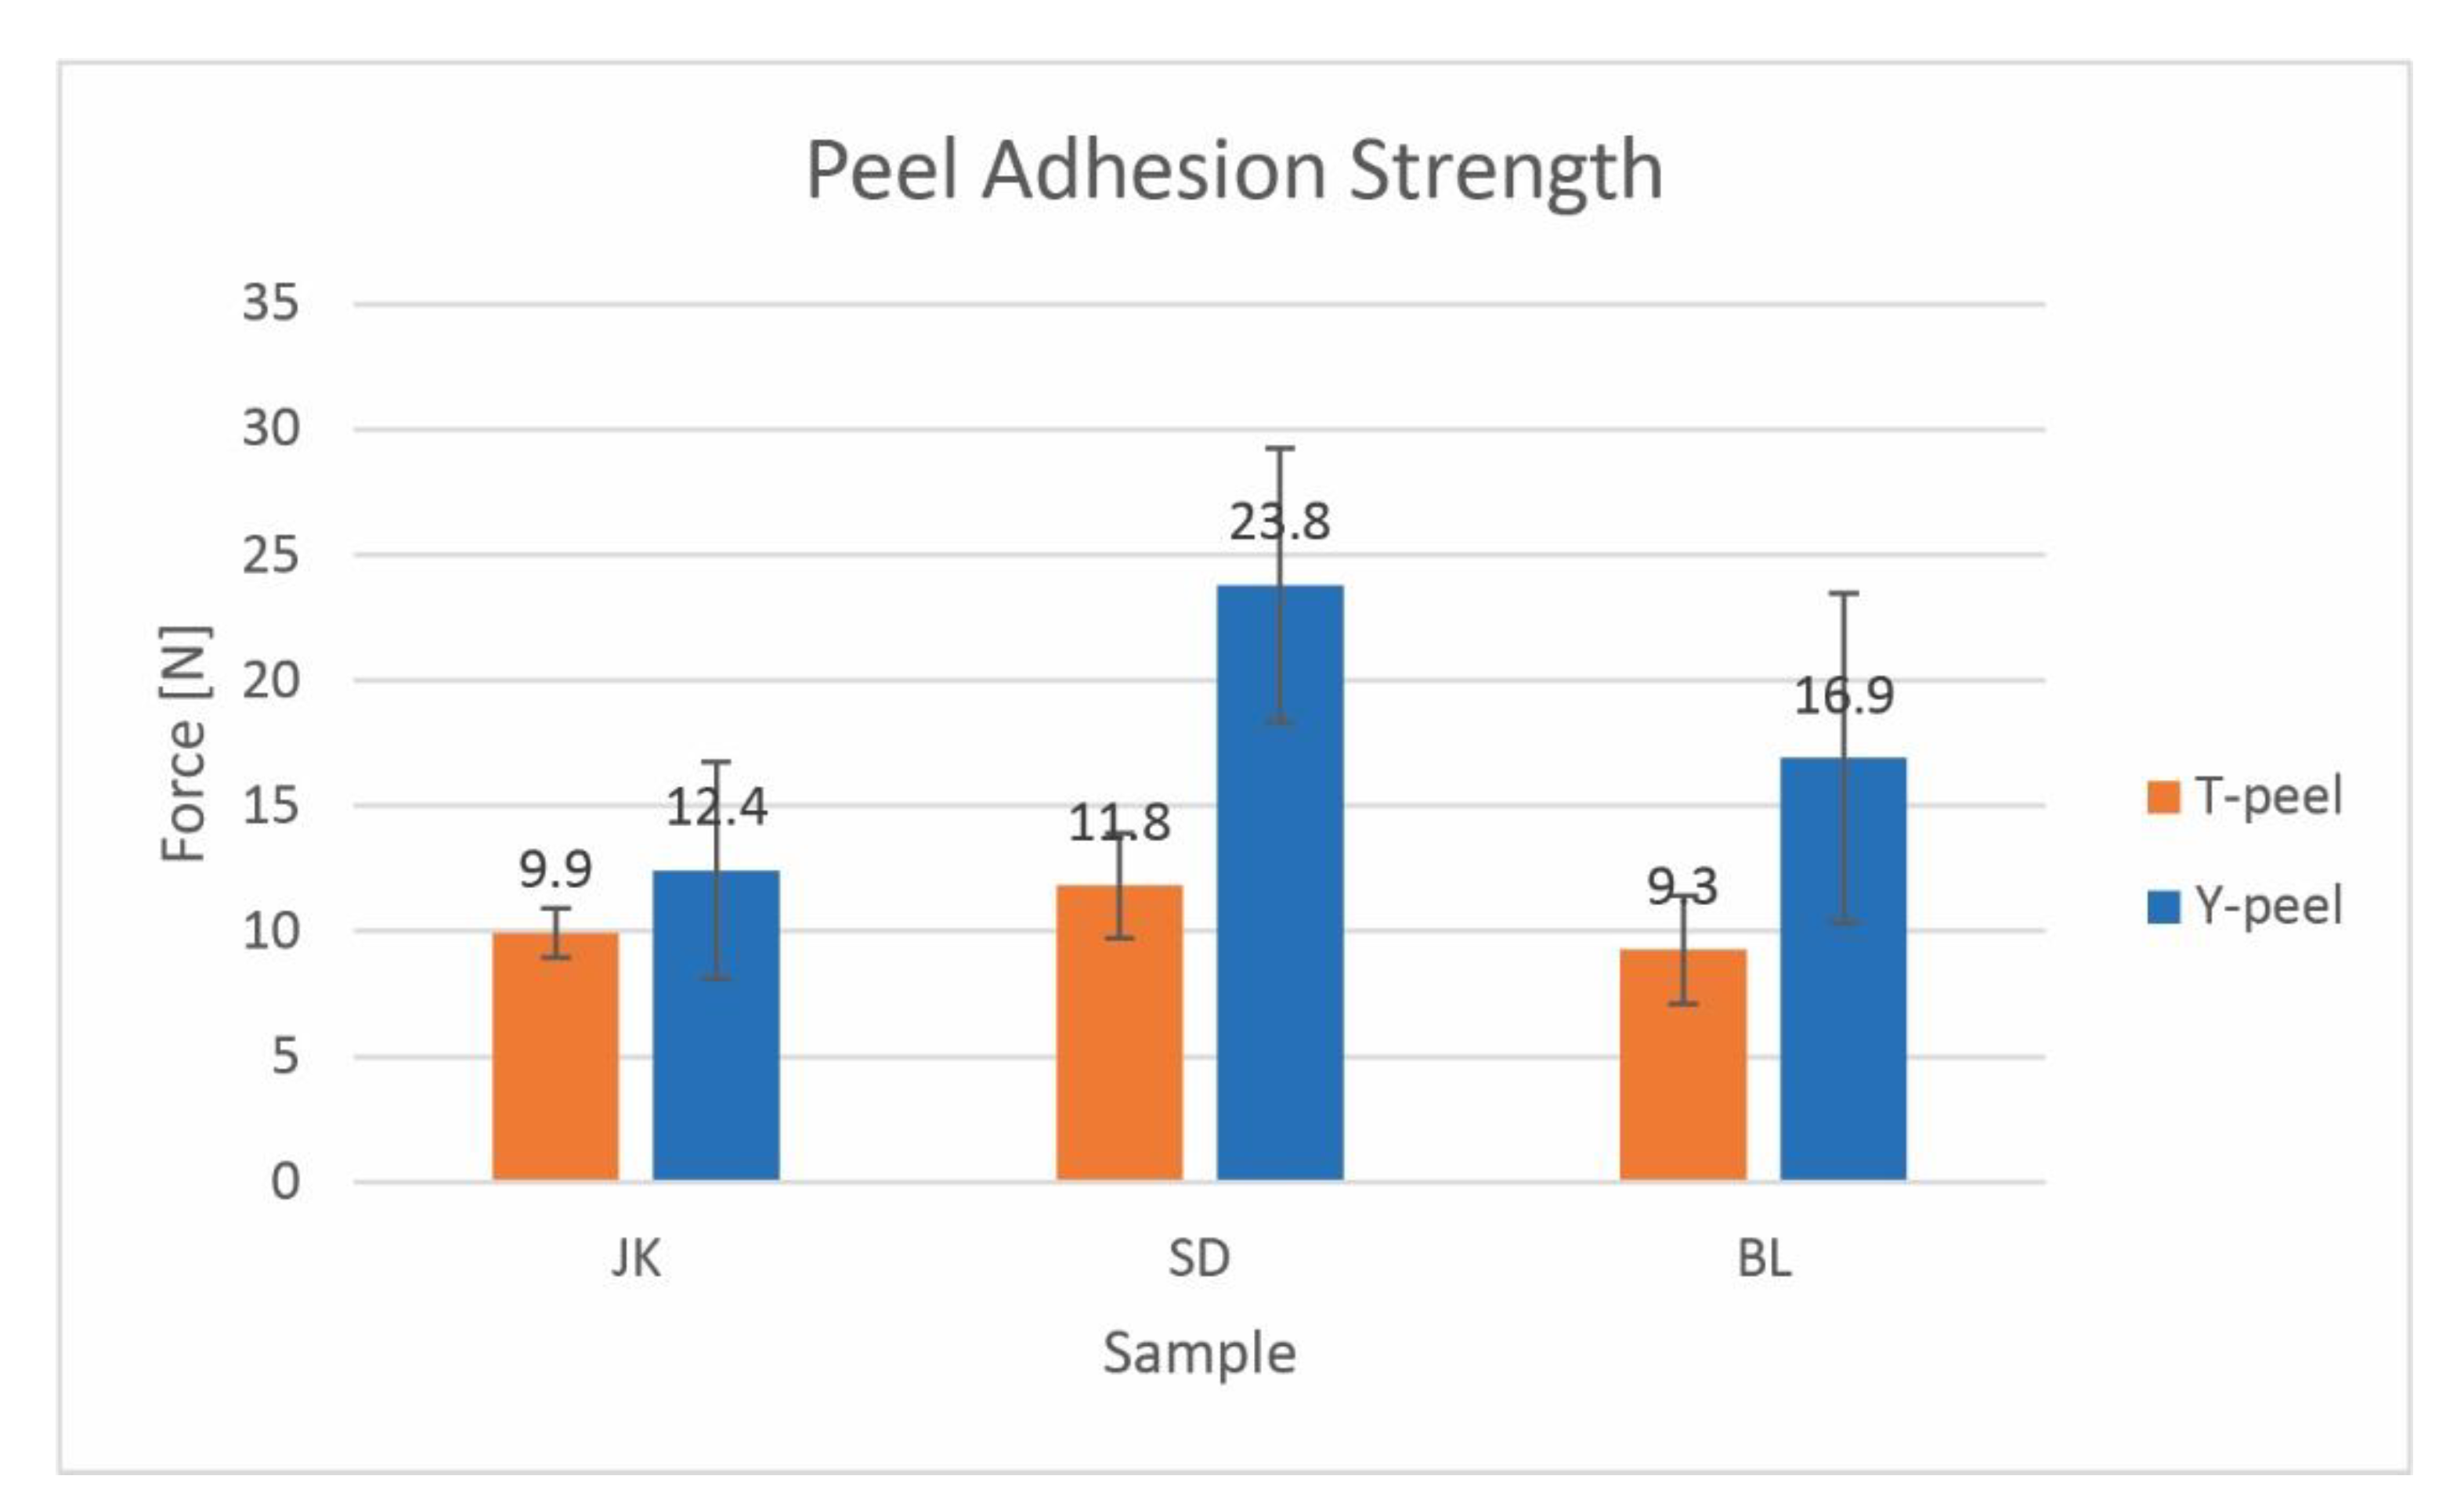
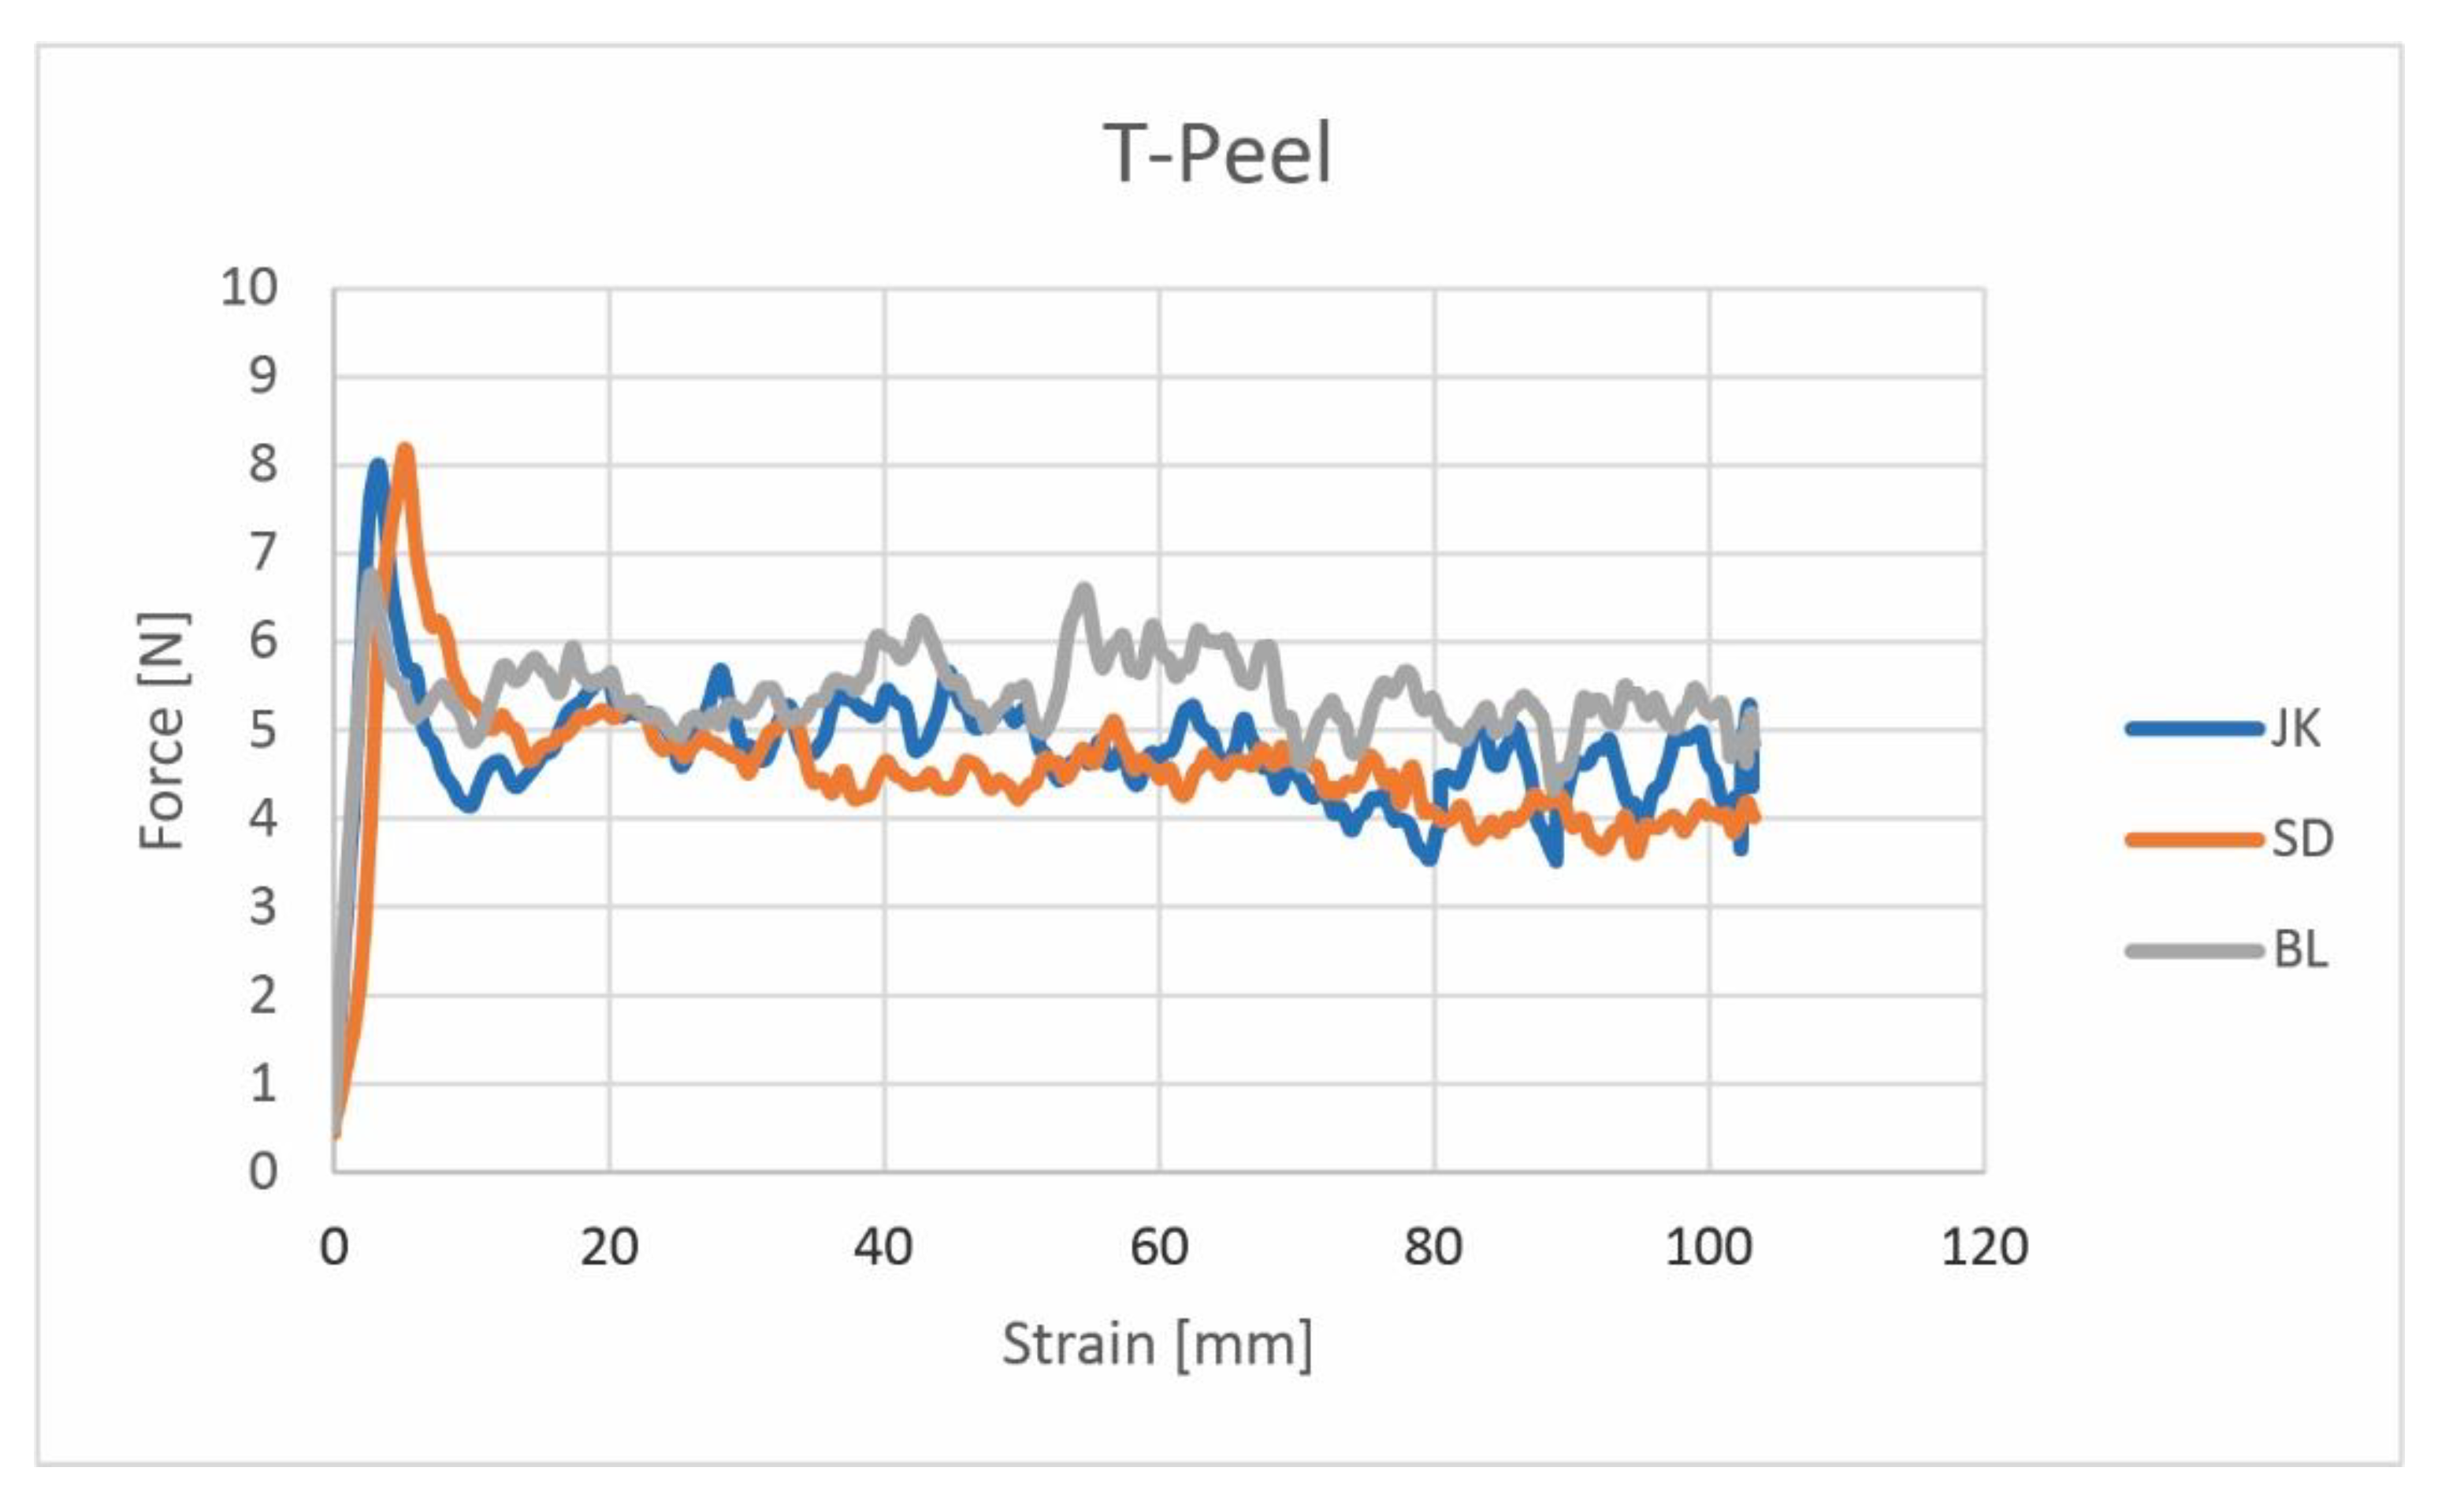
3.2. Adhesion Strength Testing

In Figure 6, the average maximum force of the peel adhesion strength for all three paperboards is presented. The trends are similar for both Y- and T-peel testing, where the SD sample had the largest maximum value for the Y-peel (23.8 N) and somewhat lower T-peel value of 11.8 N. While for the T-peel testing setup, there was no significant difference between the BL and JK samples (9.9 and 9.3, respectively), this difference was more pronounced in the Y-peel setup with values of 12.4 N for the JK sample and 16.9 N for the BL sample. This indicates that the setup can cause some differences in the maximum value due to the testing setup and force strains and angles used on the fiber materials, where the Y-peel value gives higher results as the tails of the samples are already under mechanical stress due to their fixation method.
The average strain mechanism of the samples for the two testing setups can be seen in Figure 7 and Figure 8. The force–elongation curves have to be separated into their elastic and dissipative (inelastic opening) parts, where the crack propagation begins and ends in the dissipative part of the force–elongation regime, and the fracture development depends on how the crack propagates after its initiation [1].
All three samples had the so-called mode M3 failure curve described in Korin et al. [1], on the other hand, they do not break completely within the specified maximum 3 mm displacement during testing. Several peaks are not uncommon, and they have a significant proportion of dissipative descending energy. The force is constant during the final part of the force–elongation curves. In fracture mode M3, the failure starts with small microcracks in the ascending part of the curve; the microcracks appear between the fiber matrix. In the descending part, a major crack has developed and this crack leads to final failure with fibers and the complete top part being torn off from the lower part of the paperboards without pulling the adhesive part. The strain curve for the Y-peel is shorter as the fracture happens often at the fixed part of the sample holder due to the low cohesion force of the basic paper materials in comparison with the cohesion force of the adhesive and fiber matrix. It has long been known that the tendency of a paper to delaminate in peeling can be very sensitive to the peeling direction, apparently reflecting whether the fiber ends are orientated up or down in the z-direction, which in turn is a function of the drag-to-rush ratio [26]. Comparing the Y- and T-peel adhesion strength test methods, the adhesive joint during the T-peel test is not fixed (is free to move), while during the Y-peel test the adhesive joint is fixed. During the Y-peel test, the sample is clamped with three points and the tester pulls the upper adhesive joint with constant speed. The sample stretches and, finally, the fracture of the sample happens. This is also the reason why the testing length (x-axis of Figure 7) is just a few millimeters.
To visually check the differences in adhesion and cohesion failures of the adhesive joints, scanning electron microscopy images were prepared. They are presented in Figure 9.
From the SEM images, it can be observed that the three paperboards had visually similar fiber tears at the beginning of the samples, where larger irregularities are observed for the T-peel testing. All three samples had larger border variations in the line and surface of the adhesive joint starting line. This indicates that there is a slight difference in the fiber matrix failure mechanisms due to different force strains on the materials by the two testing setup designs. While these differences are too small to be observed by standard T- and Y-peel testing, repeating these tests with speed variation in the peeling could be further studied.

4. Conclusions

Three paperboards made from invasive plants and industrial waste (sawdust) were tested as alternative paperboard materials for packaging production. From their basic properties, the penetration speed of the adhesive proved to produce the highest peel adhesion strength for the material in the SD sample with the lowest z-tensile strength value (due to less fiber and small sawdust particle–fiber cohesion force failure). We can conclude that due to the similar paperboard grammage and structure (no additional plies or coating) the longer time where the adhesive is retained on the paper surface can outweigh other paper properties. As the failures had a similar failure mechanism as other researchers have found, we can agree that by allowing a longer time for the adhesive to form a strong intermolecular bonding, the failure will be at the paper fiber matrix or plies as the cohesion forces are smaller. This is especially typical for shorter fiber materials such as the invasive plants (which have shorter fiber lengths than woody cellulose) and with a low elastic component due to less starches or sizing agents used (the polymer part which increases the elastic component of the materials). The testing setups showed similar results regarding the values, where Y-peel adhesion strength had somewhat higher maximum peek peel strength values, which does not always correlate with the fiber tear. The failure type of these paperboards (substrate failure) shows potential usefulness for tamper-proof papers where the paper surface is weak and porous and the mechanical failure (the crack) propagates into the paperboard fiber matrix structure and damages the paperboard itself. We can declare these failures as substrate-induced joint adhesion failures. As the paperboard packaging does not have a widespread unified testing method for joint adhesion testing, the Y-peel method proves to be useful, as it can more accurately show smaller differences than the T-peel test. To accurately measure the failure of the invasive plant type of paperboards in the future, finite element analysis will be conducted.

Author Contributions

Conceptualization, U.K., G.L. and I.K.; methodology, U.K., G.L. and I.K.; investigation, U.K., G.L. and I.K.; writing—original draft preparation, U.K., G.L. and I.K.; writing—review and editing, U.K., G.L. and I.K.; visualization, U.K., G.L. and I.K. All authors have read and agreed to the published version of the manuscript.

Funding

This research received no external funding.

Conflicts of Interest

The authors declare no conflict of interest.

References

  1. Korin, C.; Lestelius, M.; Tryding, J.; Hallbäck, N. Y-peel characterization of adhesively-bonded carton board: An objective method. J. Adhes. Sci. Technol. 2007, 21, 197–210. [Google Scholar] [CrossRef]
  2. Shires, D.A. Assuring successful bonding to carton boards. Packag. Technol. Sci. 1988, 1, 67–71. [Google Scholar] [CrossRef]
  3. emtec PDA Penetration Dynamics Analyzer. Available online: https://www.emtec-electronic.de/images/stories/infomaterial/04_PDA.C02_alle_Module/01_PDA_MST/02_Booklet/01_EN/emtec_PDA_Penetration_Dynamics_Analyzer_MST_booklet_en.pdf (accessed on 31 July 2023).
  4. Dohr, C.A.; Hirn, U. Influence of paper properties on adhesive strength of starch gluing. Nord. Pulp Pap. Res. J. 2022, 37, 120–129. [Google Scholar] [CrossRef]
  5. Bardak, S.; Sarı, B.; Nemli, G.; Kırcı, H.; Baharoğlu, M. The effect of decor paper properties and adhesive type on some properties of particleboard. Int. J. Adhes. Adhes. 2011, 31, 412–415. [Google Scholar] [CrossRef]
  6. Khlewee, M.; DeSisto, W.; Bousfield, D. Comparison of methods to characterize the penetration of hot melt adhesive into paper. Nord. Pulp Pap. Res. J. 2023, 38, 147–155. [Google Scholar] [CrossRef]
  7. Abd El-Sayed, E.S.; El-Sakhawy, M.; El-Sakhawy, M.A.-M. Non-wood fibers as raw material for pulp and paper industry. Nord. Pulp Pap. Res. J. 2020, 35, 215–230. [Google Scholar] [CrossRef]
  8. Williams, F.; Eschen, R.; Harris, A.S.; Djeddour, D.; Pratt, C.; Shaw, R.S.; Varia, S.; Lamontagne-Godwin, J.; Thomas, S.E.; Murphy, S.T. The economic cost of invasive non-native species on Great Britain. 2010, Volume 199. Available online: http://b3.net.nz/gerda/refs/429.pdf (accessed on 24 August 2023).
  9. Karlovits, I.; Kapun, T.; Lavrič, G.; Šinkovec, A. Invasive Plants as Paper and Packaging Raw Materials. In Invasive Plants: Ecological Impacts, Diversity and Management; Kuhns, G.R., Ed.; Nova Science Publishers: New York, NY, USA, 2021; pp. 1–42. [Google Scholar]
  10. Vrabic-Brodnjak, U.; Mozina, K. Invasive Alien Plant Species for Use in Paper and Packaging Materials. Fibers 2022, 10, 94. [Google Scholar] [CrossRef]
  11. Karlovits, I.; Lavrič, G.; Kavčič, U.; Zorić, V. Electrophotography toner adhesion on agro-industrial residue and invasive plant papers. J. Adhes. Sci. Technol. 2021, 35, 2636–2651. [Google Scholar] [CrossRef]
  12. Kavčič, U.; Karlovits, I. The Influence of Process Parameters of Disposable Invasive Plant Paper Screen-Printed Electrochemical Electrodes. Nord. Pulp Pap. Res. J. 2020. in print. [Google Scholar] [CrossRef]
  13. Karlovits, I.; Kavčič, U. Flexo printability of agro and invasive papers. Cellulose 2022, 29, 4613–4627. [Google Scholar] [CrossRef]
  14. Kavčič, U.; Karlovits, I.; Zule, J. Deinking of Screen-Printed Electrodes Printed on Invasive Plant-Based Paper. Sustainability 2020, 12, 1350. [Google Scholar] [CrossRef]
  15. Johnson, K.L.; Kendall, K.; Roberts, A.D. Surface energy and the contact of elastic solids. Proc. R. Soc. London. A Math. Phys. Sci. 1971, 324, 301–313. [Google Scholar] [CrossRef]
  16. Gent, A.N.; Kinloch, A.J. Adhesion of viscoelastic materials to rigid substrates. III. energy criterion for failure. J. Polym. Sci. Part A-2 Polym. Phys. 1971, 9, 659–668. [Google Scholar] [CrossRef]
  17. Gent, A.N.; Hamed, G.R. Peel mechanics for an elastic-plastic adherend. J. Appl. Polym. Sci. 1977, 21, 2817–2831. [Google Scholar] [CrossRef]
  18. Bartlett, M.D.; Case, S.W.; Kinloch, A.J.; Dillard, D.A. Peel tests for quantifying adhesion and toughness: A review. Prog. Mater. Sci. 2023, 137, 101086. [Google Scholar] [CrossRef]
  19. ISO 11339:2010; Adhesives—T-Peel Test for Flexible-to-Flexible Bonded Assemblies. ISO: Geneva, Switzerland, 2010; p. 6.
  20. ASTM D1876-08(2015)e1; Standard Test Method for Peel Resistance of Adhesives (T-Peel Test). ASTM: West Conshohocken, PA, USA, 2015. Available online: https://www.astm.org/d1876-08r15e01.html (accessed on 24 August 2023).
  21. Kinloch, A.J.; Lau, C.C.; Williams, J.G. The peeling of flexible laminates. Int. J. Fract. 1994, 66, 45–70. [Google Scholar] [CrossRef]
  22. Kapun, T.; Šinkovec, A.; Zule, J.; Skodlar, M.; Lavrič, G. Paper Products Made of Paper from Invasive Alient Plant Species. In Proceedings of the 1st International Conference on Circular Packaging, Ljubljana, Slovenia, 26–27 September 2019; pp. 197–204. [Google Scholar]
  23. ISO 8791-2:2013; Paper and Board—Determination of Roughness/Smoothness (Air Leak Methods)—Part 2: Bendtsen Method. ISO: Geneva, Switzerland, 2013.
  24. ISO 5636-3:2013; Paper and Board—Determination of Air Permeance (Medium Range)—Part 3: Bendtsen Method. ISO: Geneva, Switzerland, 2013.
  25. TAPPI Test Method T 541 om-21: Internal Bond Strength of Paperboard (z-Direction Tensile). TAPPI PRESS: Atlanta, GA, USA. Available online: https://imisrise.tappi.org/TAPPI/Products/01/T/0104T541.aspx (accessed on 24 August 2023).
  26. Niskanen, K.; Kajanto, I.; Pakarinen, P. Paper Structure. Paper Physics; Niskanen, K., Ed.; Fapet/Tappi Press: Finland, 1998. Ch. 1. Available online: https://imisrise.tappi.org/tappi/Products/02/FIN/0202FIN16-2.aspx (accessed on 24 August 2023).
Figure 1. The appearance of tested paperboards produced from alternative fibers: JK—Japanese knotweed, SD—sawdust, and BL—black locust samples.
Applsci 13 09779 g001
Figure 2. Porosity and roughness measurement of the used alternative paperboards: JK—Japanese knotweed, SD—sawdust, and BL—black locust samples.
Applsci 13 09779 g002
Figure 3. The results for the z-tensile strength of the tested paperboards: JK—Japanese knotweed, SD—sawdust, and BL—black locust samples.
Applsci 13 09779 g003
Figure 4. The dynamic contact angle of water droplets on the tested paperboards: JK—Japanese knotweed, SD—sawdust, and BL—black locust samples.
Applsci 13 09779 g004
Figure 5. The liquid (water + IPA) penetration dynamics analysis: JK—Japanese knotweed, SD—sawdust, and BL—black locust samples.
Applsci 13 09779 g005
Figure 6. The maximum force value for peel adhesion strength (Y- and T-peel testing setup): JK—Japanese knotweed, SD—sawdust, and BL—black locust samples.
Applsci 13 09779 g006
Figure 7. Y-peel force elongation results for all three paperboard samples: JK—Japanese knotweed, SD—sawdust, and BL—black locust samples.
Applsci 13 09779 g007
Figure 8. T peel force elongation results for all three paperboard samples: JK—Japanese knotweed, SD—sawdust, and BL—black locust samples.
Applsci 13 09779 g008
Figure 9. SEM images of Y- and T-peel samples: JK—Japanese knotweed, SD—sawdust, and BL—black locust samples.
Applsci 13 09779 g009
Table 1. Chemical analyses of Japanese knotweed (JK) and black locust (BL) [22].
Alternative FiberJKBL
Chemical structure *Ash (%)2.50.3
Hexane extractives (%)0.40.3
Ethanol extractives (%)1.14.7
Cellulose (%)3541
Hemicellulose (%)36.634.7
Lignin (%)26.821.9
* The chemical structure may vary depending on seasonal and location influences.
Table 2. The primary material properties of the invasive and agro-based papers: JK—Japanese knotweed, SD—sawdust, and BL—black locust samples.
Alternative
Fiber Sample
JKSDBL
Alternative fiber
properties
Fiber length (mm)0.775/0.963
Fiber width (µm)18.66/13.77
Paperboard propertiesHardwood pulp (%)302530
Softwood pulp (%)307530
Alternative fibers (%)40/40
Cationic starch (%)111
Fillers (%)10 (CaCO3)25 (sawdust)10 (CaCO3)
Surface sizing (%)333.5
Disclaimer/Publisher’s Note: The statements, opinions and data contained in all publications are solely those of the individual author(s) and contributor(s) and not of MDPI and/or the editor(s). MDPI and/or the editor(s) disclaim responsibility for any injury to people or property resulting from any ideas, methods, instructions or products referred to in the content.

