Article

Field Testing and Numerical Simulation of the Effectiveness of Trench Isolation for Reducing Vibration Due to Dynamic Compaction

1
College of Civil Engineering, Tongji University, Shanghai 200092, China
2
Anhui Changjiang LNG Co., Ltd., Wuhu 241000, China
*
Author to whom correspondence should be addressed.
Appl. Sci. 2023, 13(17), 9744; https://doi.org/10.3390/app13179744
Submission received: 6 July 2023 / Revised: 31 July 2023 / Accepted: 8 August 2023 / Published: 28 August 2023

Abstract

:

Featured Application

The study provides effective guidance for designing isolation trenches in similar dynamic compaction processes, emphasizing the importance of considering spatial attenuation characteristics and selecting appropriate trench depths and locations.

Abstract

Dynamic compaction is a widely used method to strengthen the foundation, which can cause significant impacts on surrounding structures, making vibration control measures necessary. This study investigates the effectiveness of isolation trenches in reducing ground vibration caused by dynamic compaction in a typical multi-layered alluvial soil foundation adjacent to the Yangtze River. A combination of field testing and numerical simulation was employed to evaluate the vibration isolation effect of trenches at different depths and locations. The results show that trenches have a significant vibration isolation effect on the side away from the tamping point, but they can have an amplifying effect between the trench and tamping point. The effectiveness of the isolation trenches increases with deeper trenches and distance from the tamping point, but the amplification effect decreases with increasing depth. Therefore, when employing trenches, reinforcement measures must be adopted, and a suitable trench depth should be selected. The closer the isolation trench to the dike, the better the protection will be. The study provides effective guidance for designing isolation trenches in similar dynamic compaction processes, emphasizing the importance of considering spatial attenuation characteristics and selecting appropriate trench depths and locations.

1. Introduction

The scarcity of land resources constrains the further development of cities. To obtain more land for engineering construction, it is often necessary to improve land with poor geological conditions. Dynamic compaction (DC) is a foundation treatment technique that is used to improve the soil properties of land with poor geotechnical properties. It involves dropping a large mass of weight from a significant height onto the ground in a free-fall manner. The impact of the weight causes the soil to compress and become denser, thereby improving its strength, and reducing the potential for subsequent settlement [1,2,3,4]. Due to its low cost, fast construction, simple operation, significant reinforcement effect, and wide applicability, dynamic compaction has been widely used to treat a variety of soil types, including sandy soils, soft clays, and loose gravel [5,6,7,8,9,10,11,12,13,14].
Since Menard and Broise [1] first proposed the DC method in the 1970s, many researchers have investigated the ground vibrations induced by DC from various perspectives, such as the mechanism of ground improvement and influencing factors, evaluation of reinforcement performance, monitoring of the compaction process, and the impact of vibrations on surrounding areas. Regarding the mechanism of ground improvement and influencing factors, Wu et al. [15] studied the compaction behavior of soil aggregate mixed ground and divided the soil into three zones based on the distribution of stress waves, namely an impact strengthened zone, a plastic stress wave strengthened zone, and an elastic zone in which the strength of the soil is not reinforced. Jia et al. [16] elucidated the mechanism of loose granular soil reinforcement from the particle scale. Chen et al. [17] conducted experiments to investigate the crushing effect of gravel soil during DC and proposed a constitutive model applicable to calculating the behavior of gravel soil. Zhou et al. [18] proposed a dynamic fluid–solid coupled finite element method (FEM) combined with the soil cap yield hardening model to analyze the improvement of saturated ground under dynamic compaction. The results showed that lowering the groundwater level was more important than increasing the soil permeability for ground improvement. Jia et al. [19] investigated the effect of groundwater level on DC and found that overall ground improvement was the result of compaction and liquefaction combined densification, with the depth of groundwater controlling the relative contributions of these two mechanisms. Mei et al. [20] studied the compaction process of loess through field tests and numerical simulations and found that the effective improvement depth could be estimated well using the modified Menard formula and that the ramming energy was the most important factor affecting ground compaction. In terms of evaluating the reinforcement performance, Wang et al. [21] developed a method for estimating the deformation performance of granular soil induced by DC by investigating the factors influencing ground deformation. Wei et al. [22] evaluated the reinforcement performance of high energy DC. Yao et al. [23] proposed a scheme for predicting soil behavior after compaction by considering factors such as ramming energy, times, spacing between tamping points, and compaction sequence during multi-point compaction. Zhang et al. [24] simulated the DC of a stone-pile yard based on the material point method, established an approximate formula for the effective improvement range of dynamic compaction, and proposed appropriate tamping point spacing through multi-point compaction simulation. Li et al. [25] conducted extensive DC model tests with energy levels, drop distances, masses, and diameters of falling weight as variables, and point out that the combination of the tamping impulse and falling weight diameter is appropriate as the control standard of the final cumulative settlement. As for monitoring the consolidation process, Zhang et al. [26] developed an intelligent monitoring method for the number of compaction cycles during DC construction based on machine vision and pattern recognition. Despite the extensive research on the mechanism of ground improvement and evaluation of reinforcement performance, there are relatively few studies on controlling the ground vibrations induced by DC to minimize their impact on the surrounding environment. As engineering construction increasingly focuses on minimizing the environmental impact, further research in this area is needed.
Dynamic compaction can generate a series of waves in the soil, such as shock waves, stress waves, and vibration waves. These waves propagate underground and on the surface, which may cause vibrations in nearby structures and pipelines, deformation of surrounding foundations, and even cracking and collapse of structures. Two measures were commonly employed in engineering practice to mitigate the vibrations. One is to move the vibration source away from important structures, while the other is to install vibration reduction facilities between the vibration source and the structures, which restrict the vibration from reaching the structure within the allowable range. The former measure involved studying the propagation attenuation law of vibrations on the ground to determine the allowable distance. Wu et al. [27] investigated the propagation law of waves caused by DC in a full stone foundation and found that the ground vibration response continuously decreases as the distance from the vibration source increases. Moreover, based on extensive measured data of the tamping waves, Tan et al. [28] discovered that the attenuation of ground vibration with horizontal distance follows a negative power relationship. An isolation trench is one of the most common, economical, and convenient vibration reduction facilities. Its vibration isolation effect is mainly achieved through the reserved fissure between the vibration source and the protected object. This fissure surface is perpendicular to the ground surface and becomes a barrier for the vibration wave. The propagation characteristics of the waves mainly depend on the characteristic wave impedance of the medium. When the vibration wave reaches the interface of different media, due to the different wave impedances, the vibration wave will be reflected and transmitted. In particular, when the wave reaches a free surface, there is no transmission, so the vibration of the soil behind the trench is reduced [29]. Hwang and Tu [30] conducted vibration tests of DC with vibration isolation trenches that had a width of 1 m and a depth of 3 m to investigate their isolation effect. However, despite the use of these trenches, no significant isolation effect was observed, possibly due to their shallow design. Comina and Foti [31] indicated that the majority of ground vibration energy propagates in the form of Rayleigh waves. Through case tests, they provided evidence that the isolation effect is correlated with the wavelength of Rayleigh waves when the dominant frequency is identified. Shrivastava and Rao [32] and Bose et al. [33] reported that under pulse loads, the isolation effect of the isolation trench is practically unrelated to the width of the trench, while the isolation efficiency of empty trenches exceeds that of trenches filled with concrete. Wang et al. [34] evaluated the safety of underground oil pipelines and discovered that empty trenches exhibit significant isolation effects on vertical and horizontal vibrations, with the isolation effect increasing with trench depth. Ramaswamy et al. [35] explored seismic control and found that periodic barriers exhibit better isolation effects on longitudinal and transverse waves than empty trenches, with higher isolation efficiency observed when closer to the vibration source.
In summary, on the one hand, research on the vibration control of DC has mainly focused on the vibration response of the soil behind the trench and has not addressed the vibration control of structures, especially large structures such as dikes. On the other hand, these studies have rarely treated the foundation as a multi-layered soil structure, which does not reflect reality. Based on the limitations of previous studies, this study employs a combination of field testing and numerical simulation to investigate the spatial attenuation characteristics of the ground vibration response caused by the waves of DC in a typical multi-layered alluvial soil foundation adjacent to the Yangtze River.
This study takes into account the multi-layered structure and material nonlinearity of the soil and evaluates the vibration isolation effect of different depths and locations of isolation trenches through a controlled experiment at a fixed distance between the vibration source and the protected object. The findings of this study provide effective guidance for the design of isolation trenches used in vibration control in similar processes of DC. The remainder of this paper is organized as follows: Section 2 introduce the site conditions and experimental arrangement, respectively. Section 3 analyzes and discusses the results of the field experiment. Section 4 describes the numerical simulation of the site and analyzes the simulation results in light of the field experiment. Finally, Section 5 summarizes the study’s main findings.

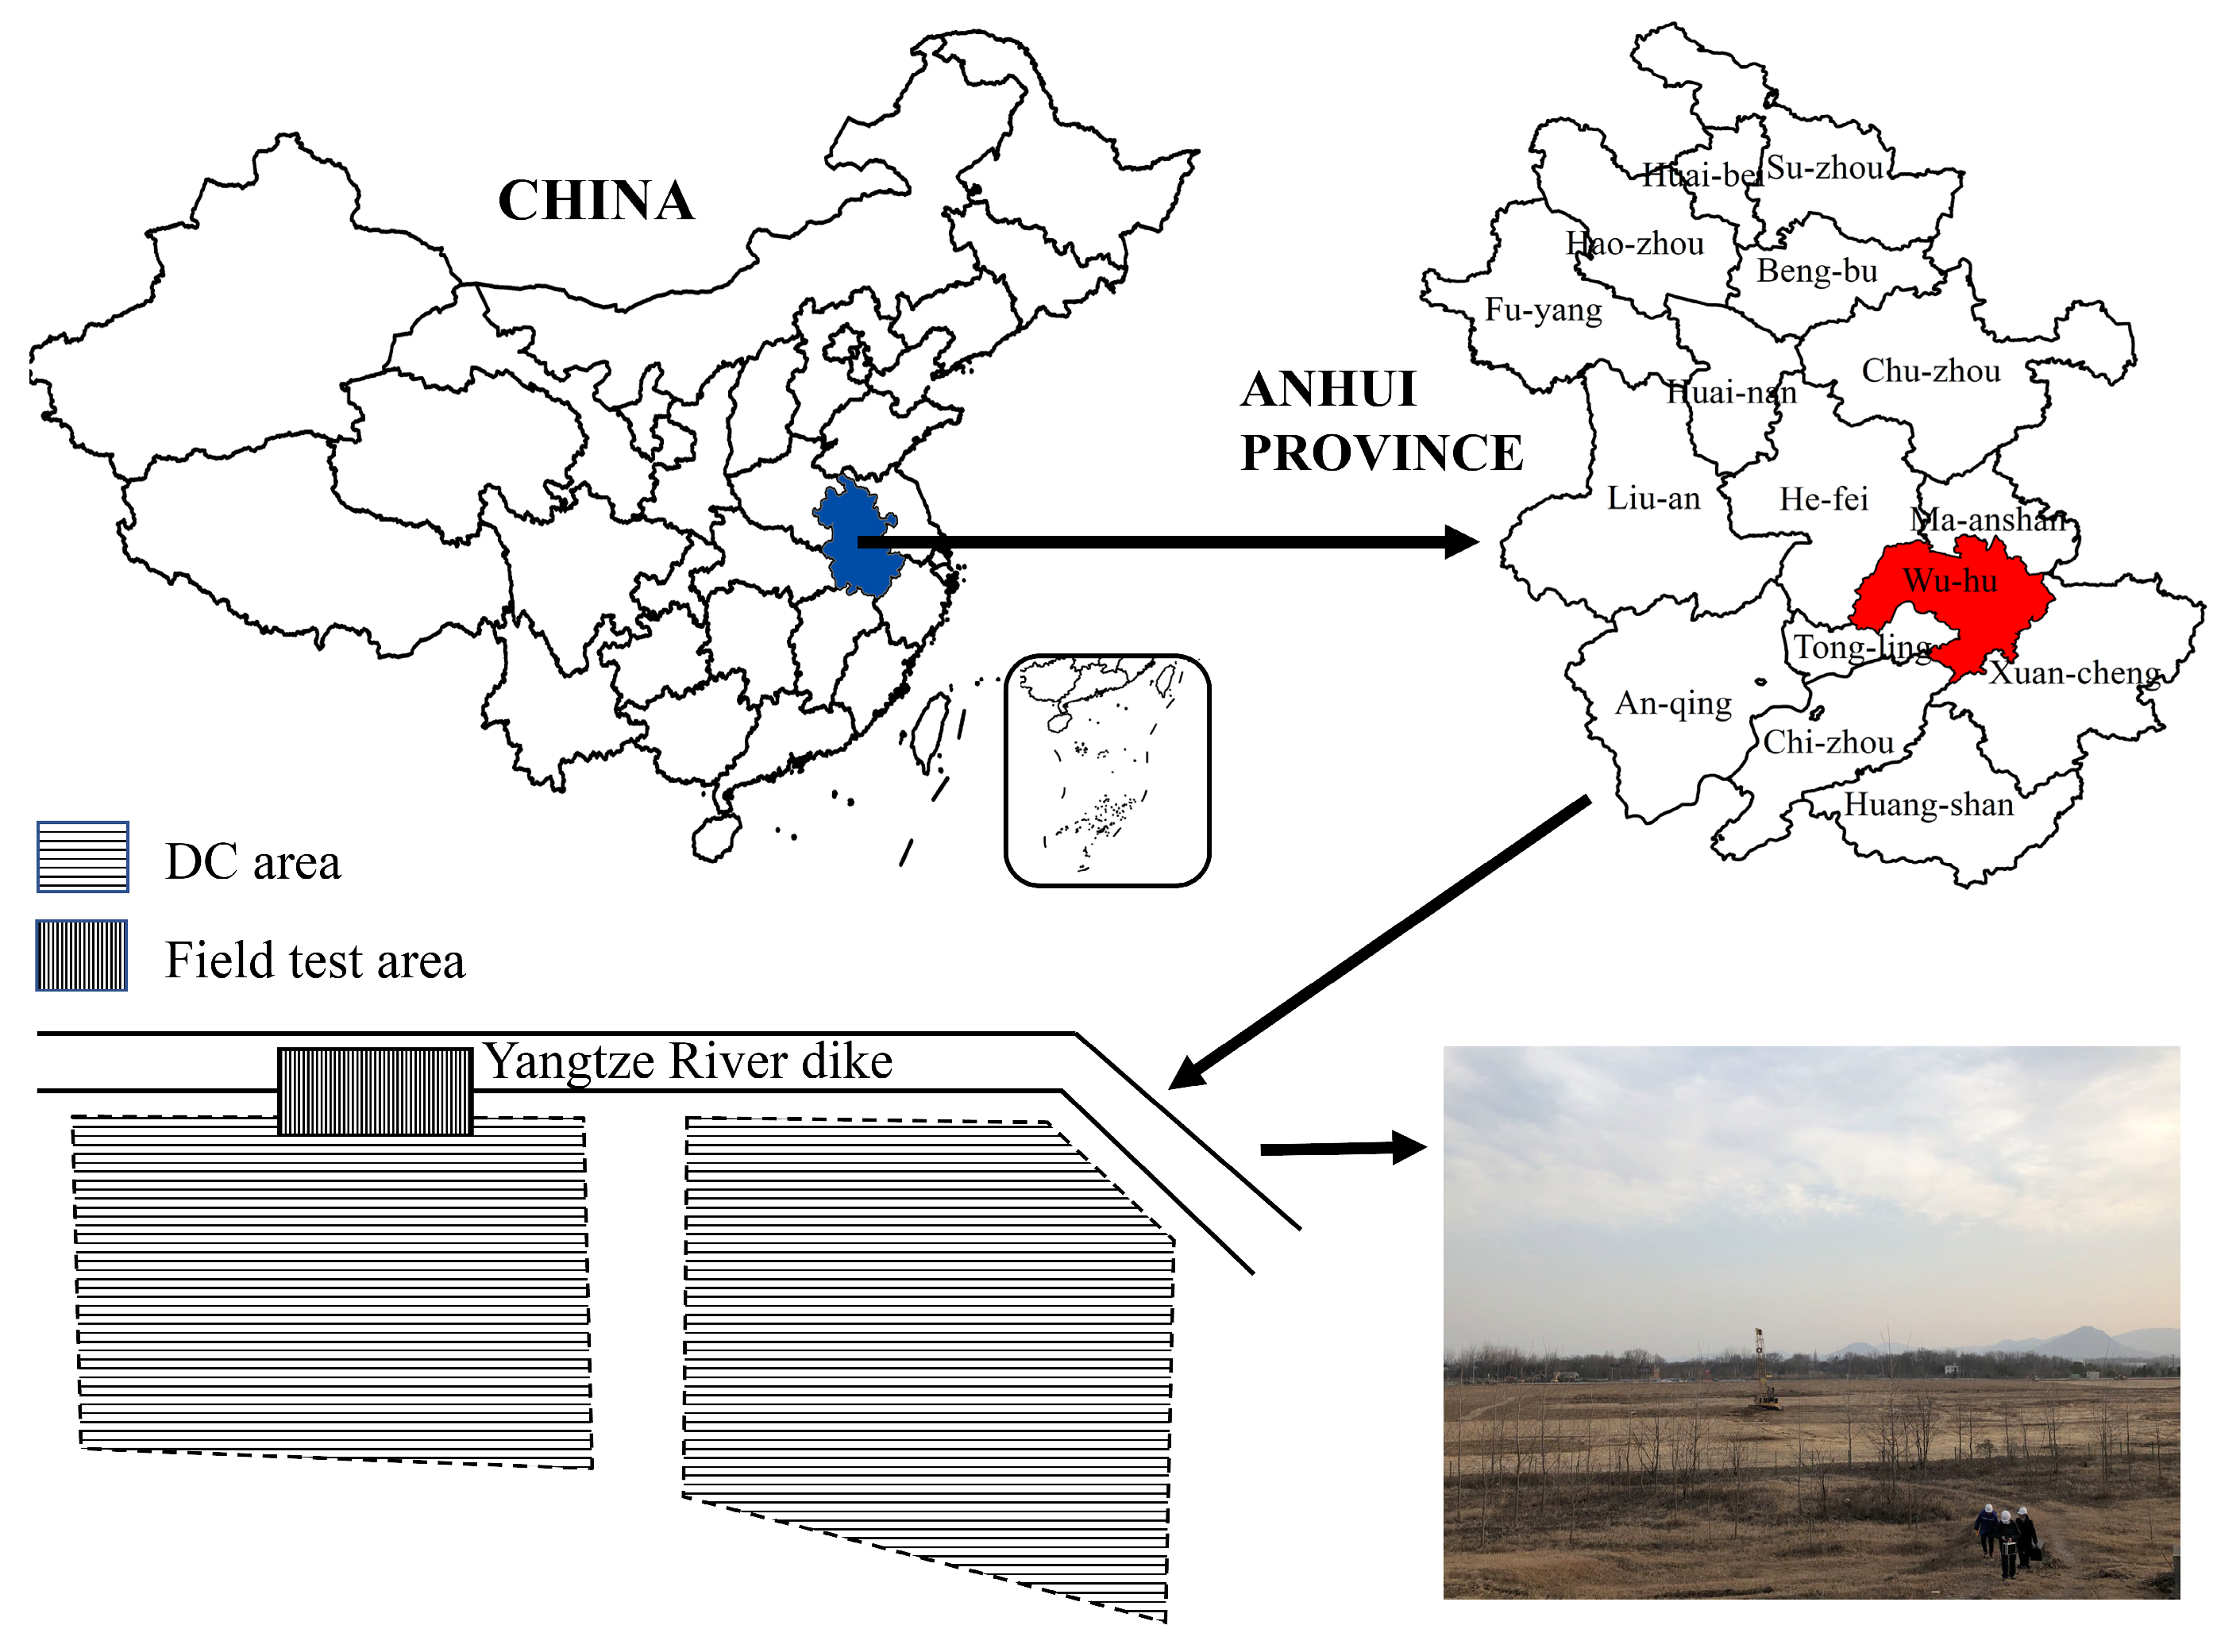
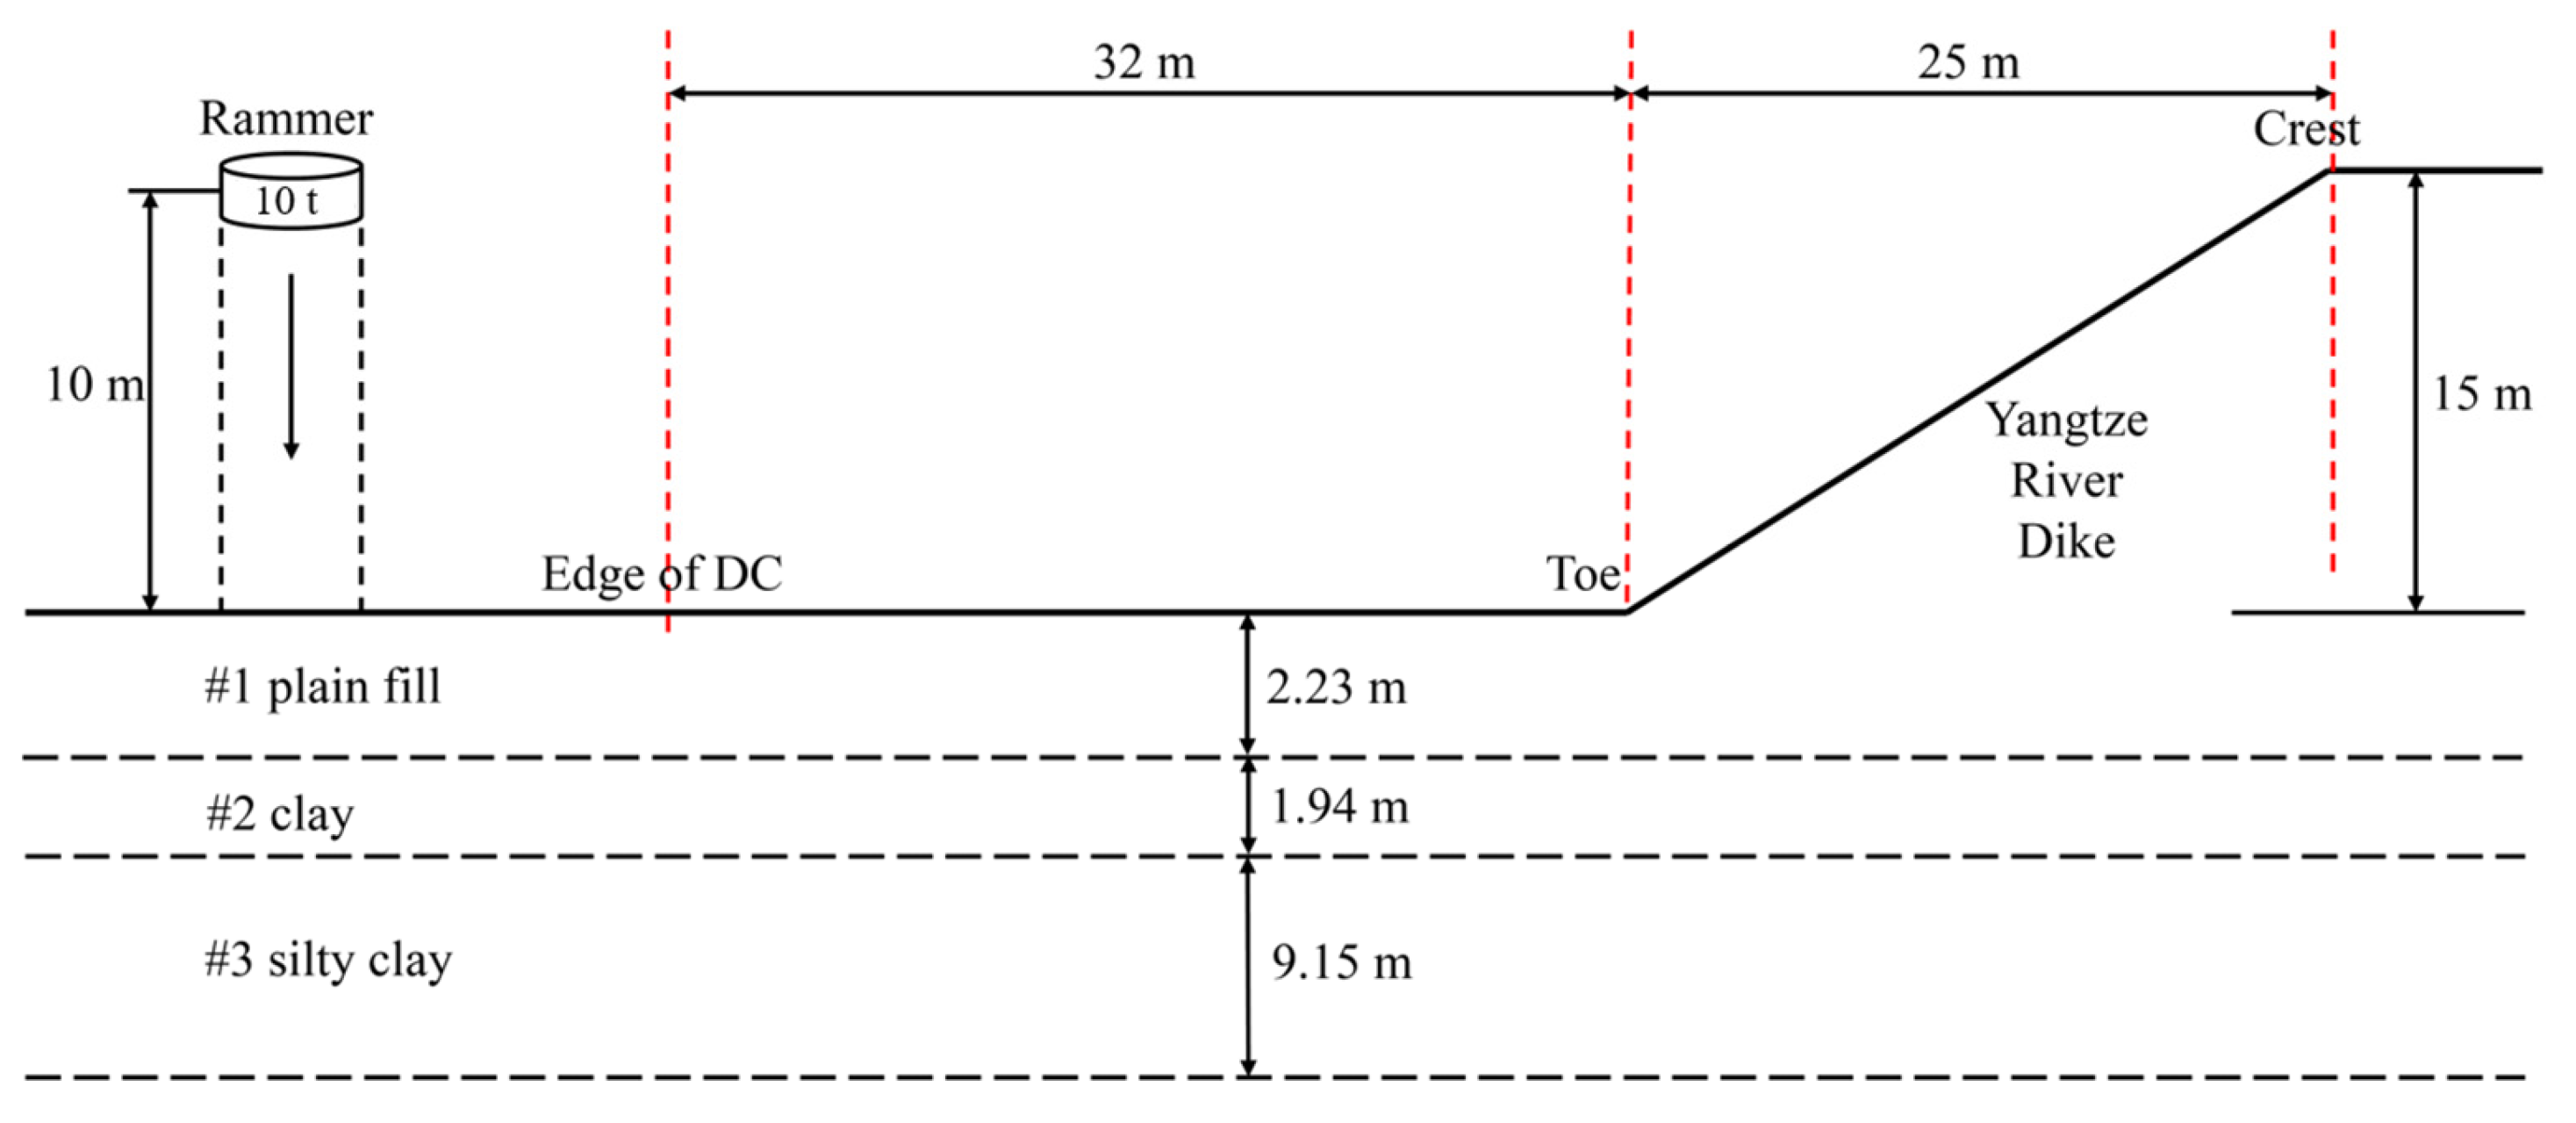
2. Description of the Project and Ground Conditions

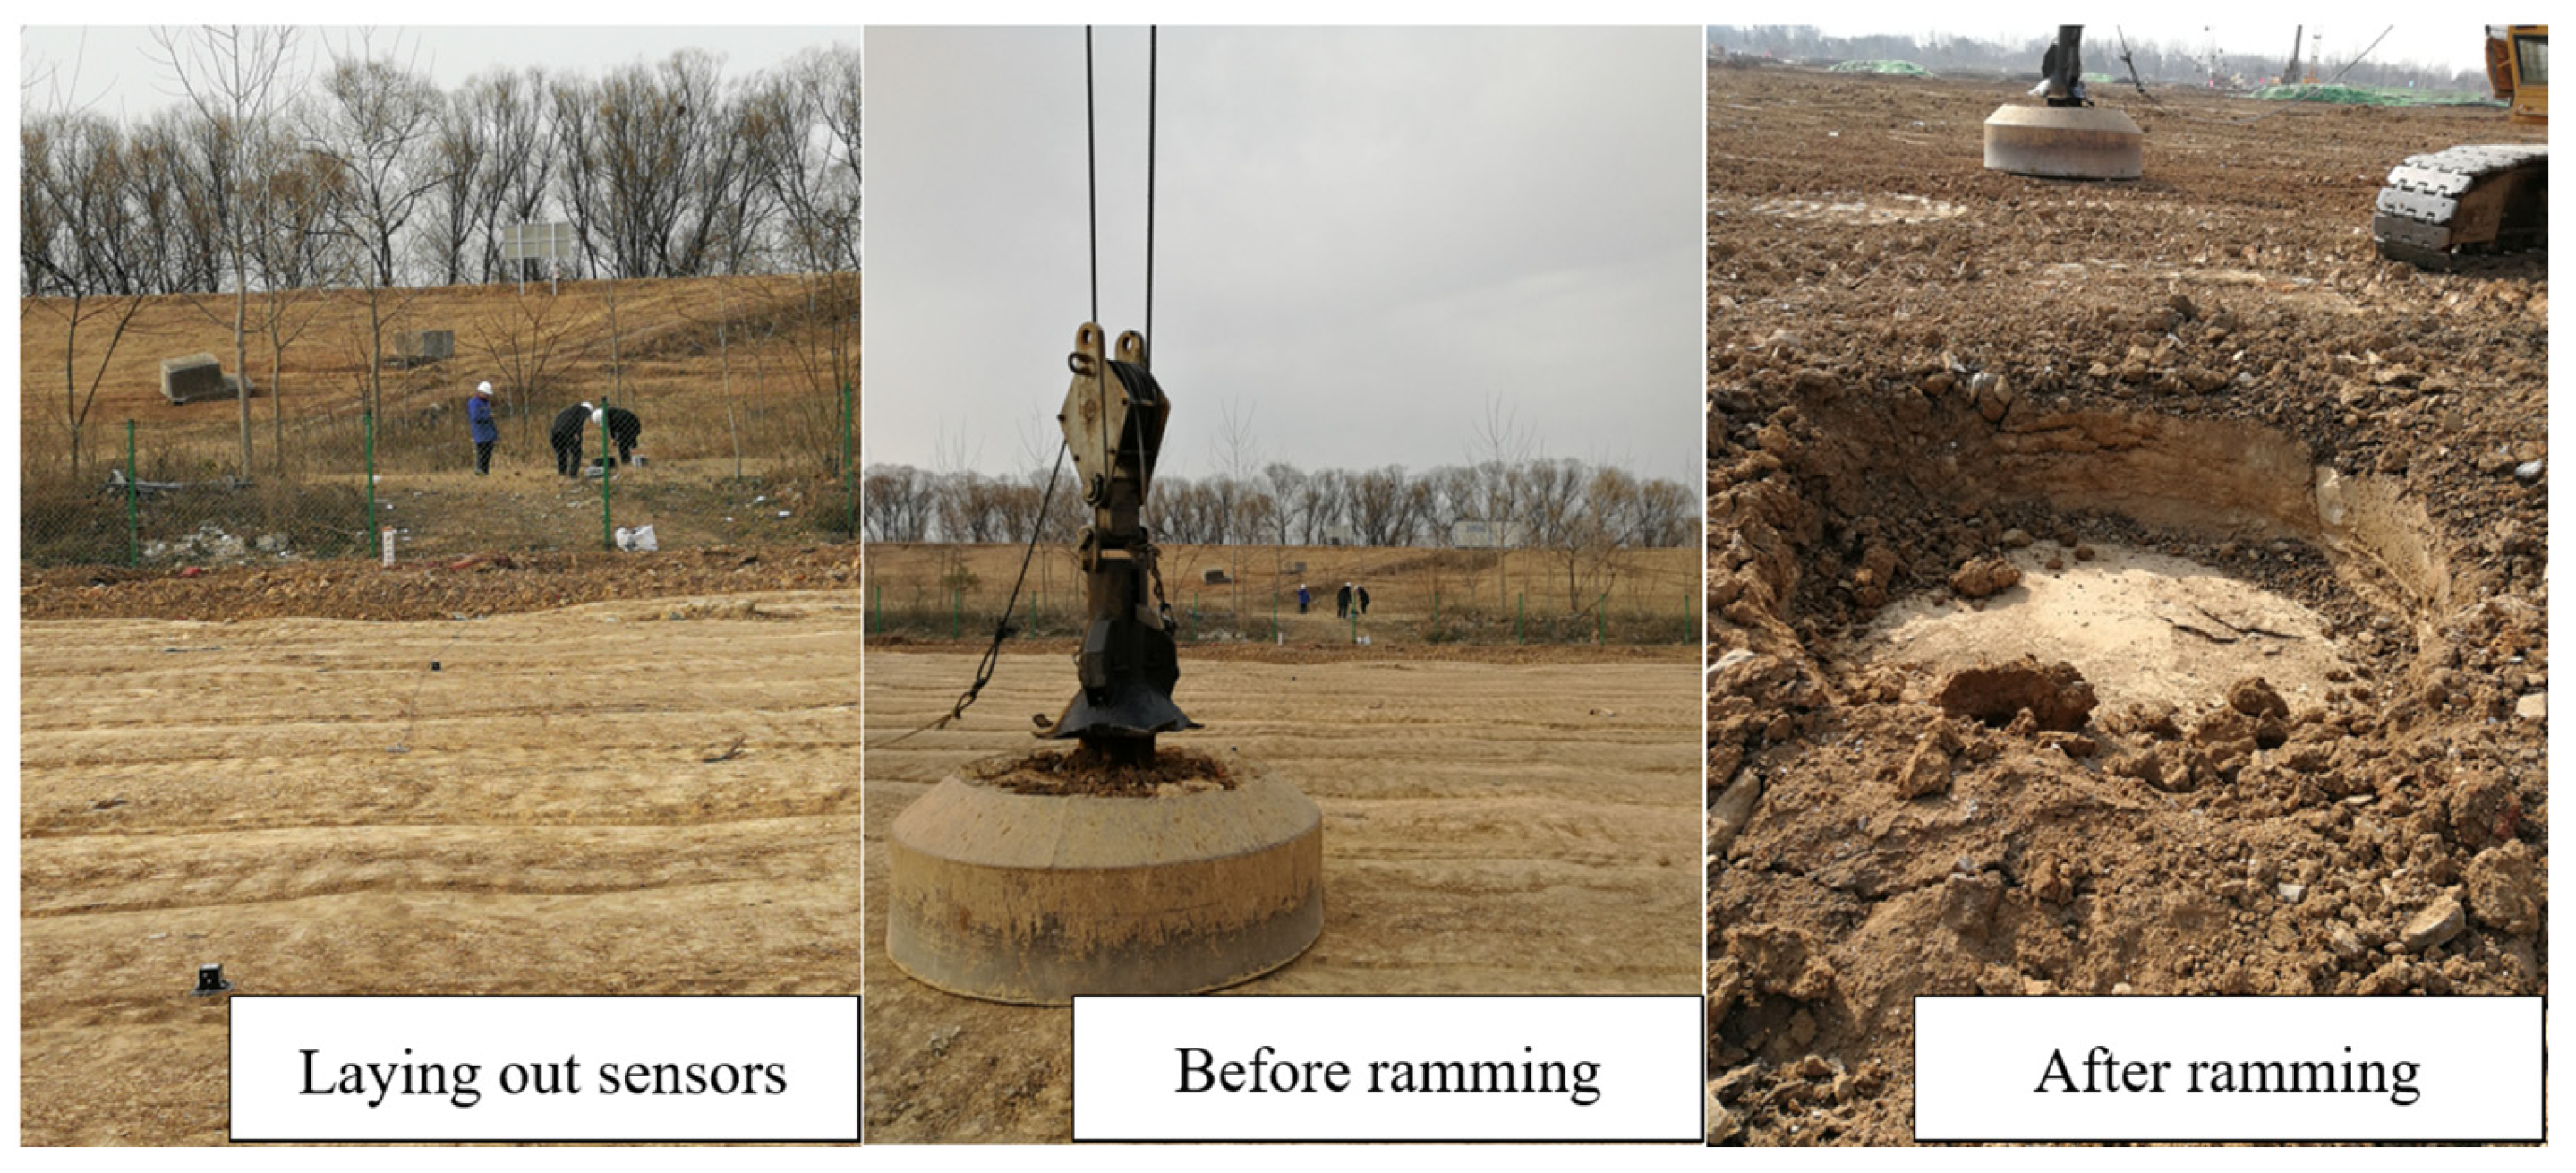
2.1. Field Test Conditions

The test site is located in a ground treatment field of a natural gas foundation treatment project near the Yangtze River dike in Wuhu City, China. Figure 1 and Figure 2 show the layout of the field test site. Figure 3 shows a profile of the dynamic compaction test. The terrain of the test site is fairly flat, with a surface elevation of approximately 7 m. The surface is backfilled with sandy fill with an average thickness of 2.23 m, and the soil structure from top to bottom mainly includes clay with an average thickness of 1.94 m and silty clay with a thickness of 9.15 m. Based on the geotechnical test data, in-situ test data, and local construction experience, the mechanical parameters of each layer of the foundation soil are shown in Table 1. The dynamic compaction test is carried out using a 1000 kN·m energy level and a 2.5 m diameter rammer with a weight of 10 t and a drop height of 10 m. The vibration acceleration and velocity along different measurement lines within each zone are recorded. Three sets of signals are collected for each case.

2.2. Dynamic Compaction Vibration Monitoring

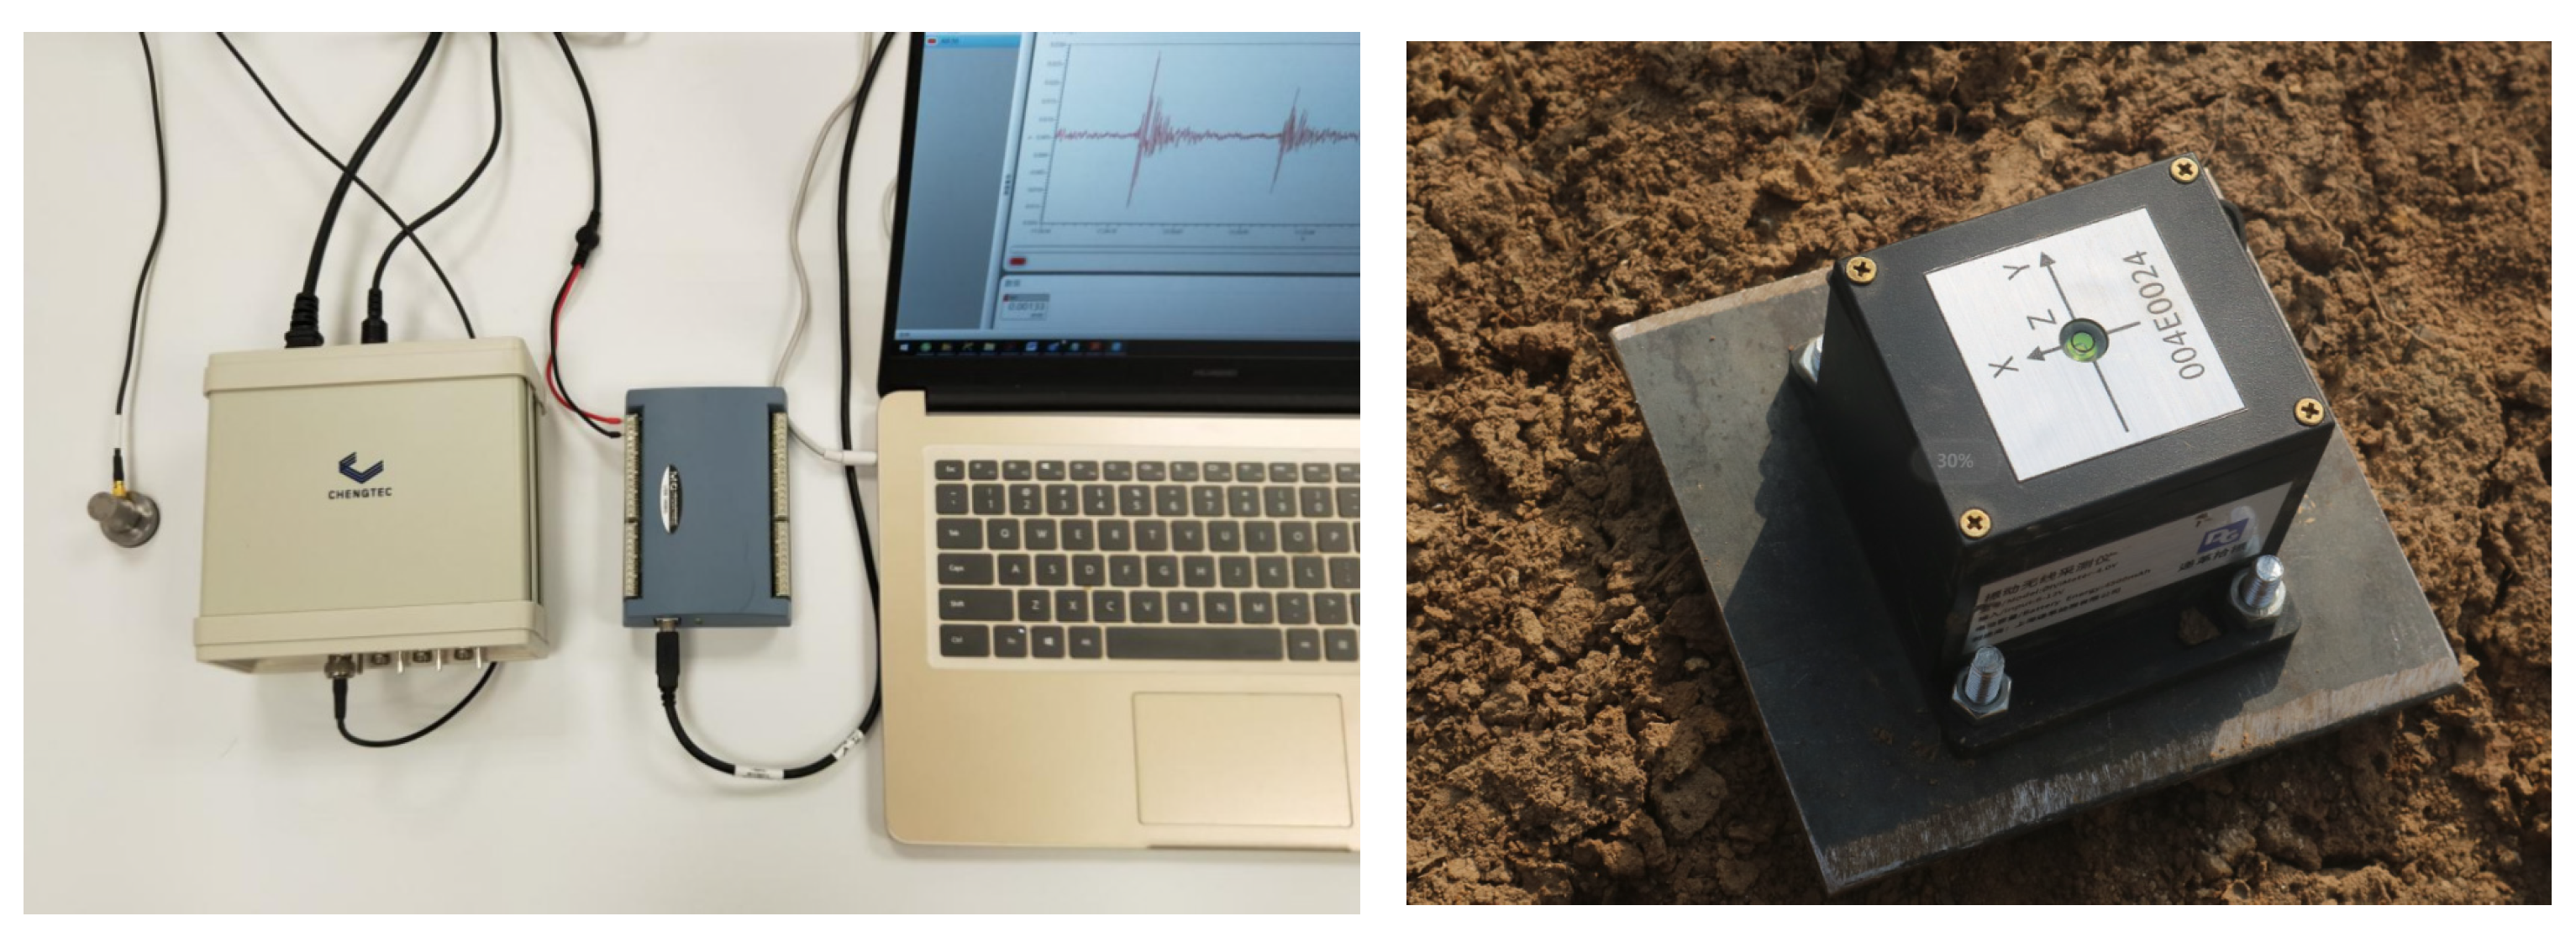
2.2.1. Equipment for Vibration Measurement

The main instruments used in this test include high-precision acceleration sensors (unidirectional and triaxial), a 12-channel constant current adapter CT5204, a data acquisition unit, and an analysis system DAQami. The vibration measurement system consists of sensors, vibration meters, computers, cables, etc. Figure 4 shows the monitoring system and sensors. The parameters of the vibration meter are shown in Table 2. The frequency range of the sensor is wide, spanning from 1 Hz to as high as 100,000 Hz. It is powered by direct current (DC) with a voltage of ±24 V and a constant current of 2 mA. The sensor exhibits a very high accuracy, less than 1%. Additionally, it operates on alternating current (AC) with a stable voltage of 220 V.

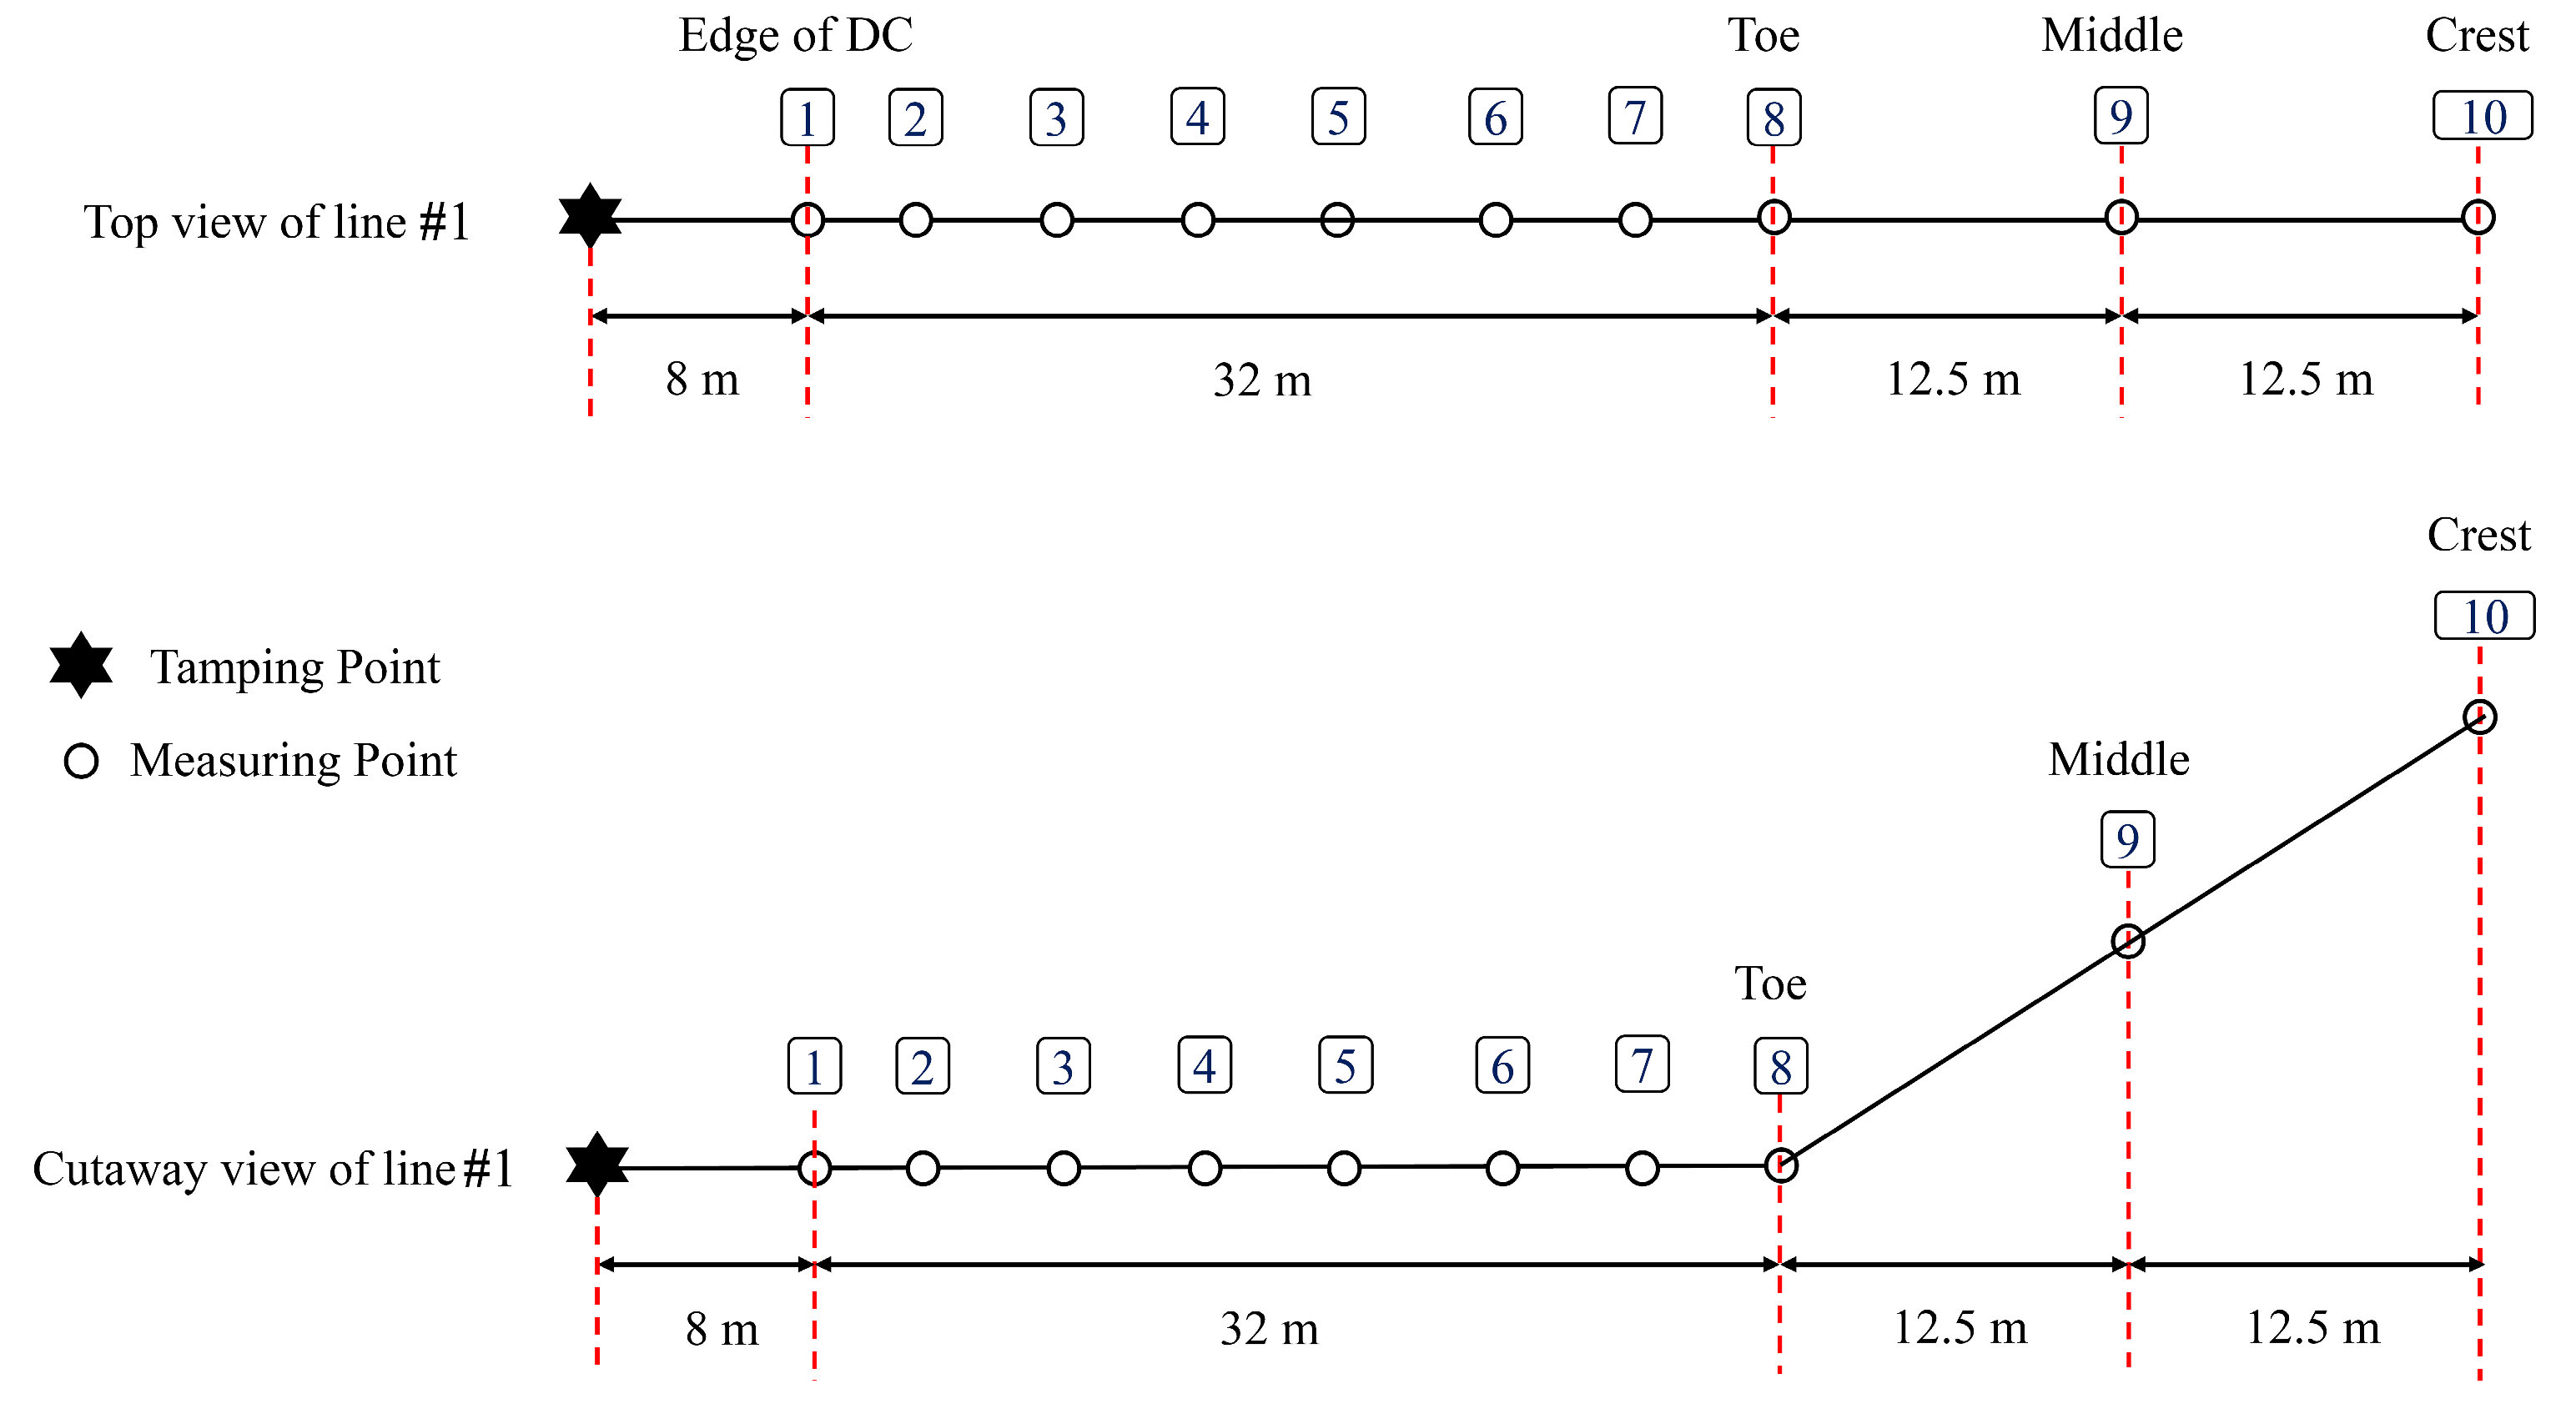
2.2.2. Arrangement of Measuring Points

The purpose of the layout without the isolation trench is to measure ground vibration at different distances from the impact point under standard compaction energy and to serve as a control group with the layout of the vibration isolation trench. Table 3 shows the horizontal distance between the tamping and measuring point. Figure 5 shows the layout of the measurement, and the positions of the sensors were determined according to the rule of being denser closer to the impact point. At the same time, to measure the response of the dike, three-axis acceleration sensors were installed at the toe, middle, and crest of the dike. The impact point was hit three times, and the time–domain curve data of the vibration acceleration caused by strong compaction at each measurement point was detected and collected.
The layout with the isolation trench was designed to investigate the effects of the vibration isolation trench on the ground vibration induced by strong compaction and the isolation effect on the dike. Figure 6 shows the profile layout of the measurement. Trenches, as shown in Figure 7, with a length of 16 m, a width of 1 m, and a depth of 1 m, were set up at a distance of 10 m from the compaction point along the #2 measuring line. The sensor layout followed the same principle of arranging them from dense to sparse, and the distance between the trench and the adjacent two sensors was 2 m. In theory, the closer to the isolation trench, the more obvious the isolation effect, but the soil near the isolation trench is prone to collapse, which may cause damage to the foundation. Therefore, installing sensors too close to the isolation trench can lead to invalid measurement results.

3. Field Test Results and Analysis

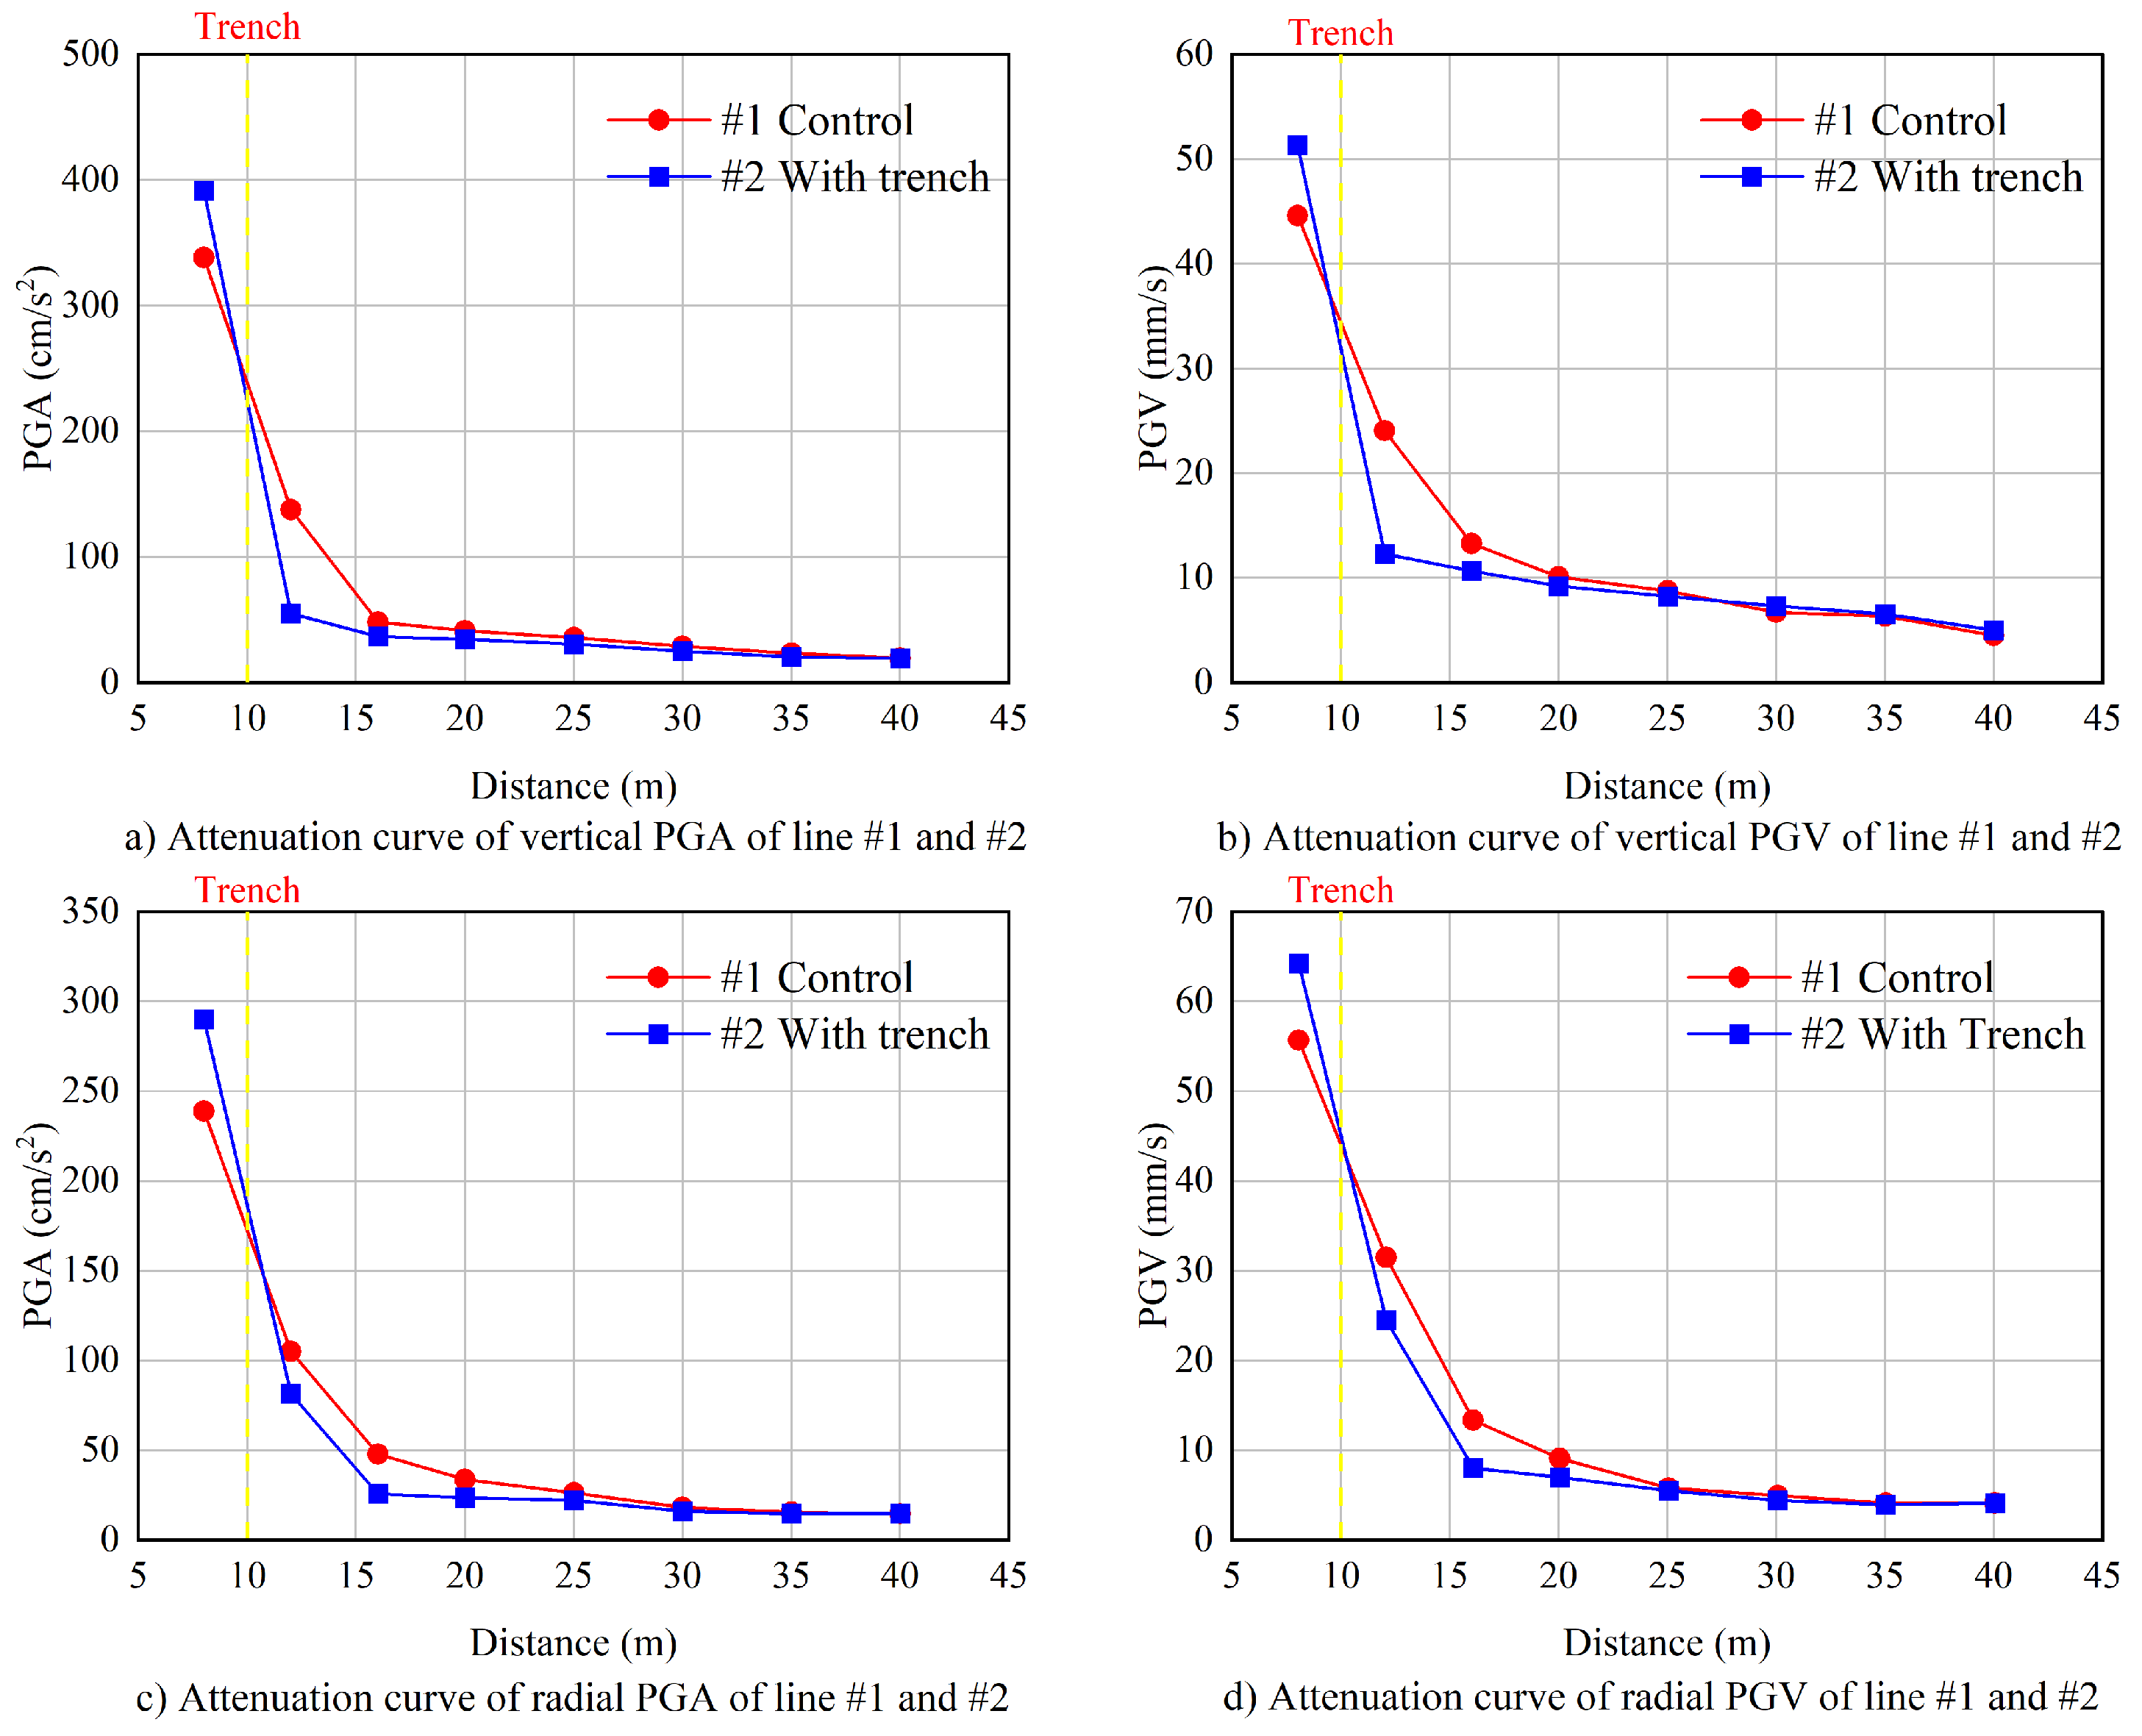
3.1. Effect of the Vibration Isolation Trench on Ground Vibration

Figure 8a,b show the attenuation curves of the peak acceleration and peak velocity in the vertical direction at each test point at the #1 and #2 measurement lines, respectively. No vibration isolation trench was set on survey line #1. The vertical peak value of acceleration and velocity at 8 m away from the tamping point were 338.02 cm/s2 and 44.68 mm/s, respectively, while they were 138.12 cm/s2 and 24.15 mm/s at a distance of 12 m. The attenuation amplitude is 59% and 46%, respectively, for the non-vibration isolation trench case. A vibration isolation trench with a length of 16 m, a width of 1 m, and a depth of 1 m is set at 10 m away from the tamping point for survey line 2. The vertical peak value of acceleration and velocity at 8 m from the tamping point were 390.09 cm/s2 and 51.3 mm/s, respectively, while they were 55.61 cm/s2 and 12.34 mm/s at a distance of 12 m, which is on the other side of the trench. The attenuation amplitude is 86% and 76%, respectively, for the case with the vibration isolation trench, which achieves an approximately 30% improvement effect. The results indicated that the vibration isolation trench has a significant weakening effect on the vertical vibration caused by dynamic compaction.
Figure 8c shows the attenuation curves of the horizontal radial peak acceleration of survey line #1 and line #2, and Figure 8d shows the velocity attenuation curves. No vibration isolation trench was set on survey line #1. The horizontal radial peak value of acceleration and velocity at 8 m away from the tamping point were 238.75 cm/s2 and 55.63 mm/s, respectively, while they were 105.48 cm/s2 and 31.41 mm/s at a distance of 12 m. The attenuation amplitude is 56% and 44%, respectively, for the non-vibration isolation trench case. The horizontal radial peak value of acceleration and velocity at 8 m from the tamping point were 290.23 cm/s2 and 64.29 mm/s, respectively, while they were 81.71 cm/s2 and 24.60 mm/s at 12 m on line #2. The peak value decreased by 72% and 62% after propagating through the trench. The vibration isolation trench increases the attenuation effect by 16% and 18%, respectively.
The above results found that the vibration isolation trench has an obvious isolation effect on the side far from the tamping point in dynamic compaction construction. The closer to the trench, the more obvious the isolation effect is. With the increase in the distance from the trench, the isolation effect of the vibration isolation trench gradually weakens. In this test, when the tamping distance is greater than 25 m, the vibration isolation effect can be almost ignored. Additionally, by comparing the PGA and PGV with and without the vibration isolation trench at 8 m, the vibration wave of the soil in front of the trench is strengthened due to the reflection of the vibration wave, which may cause damage to the trench structure.

3.2. Analysis of the Dynamic Response of the Dike under Dynamic Compaction

The dynamic load will cause complicated deformation of the interior structure. The dynamic response of the dike under different working conditions will be introduced in this section. There is no vibration isolation trench set on survey line #1, while a trench with a 1 m depth and 1 m width is set 10 m away from the tamping point on survey line #2. The peak acceleration and peak velocity summaries, along with the differences between line #1 and #2, are listed in Table 4 and Table 5.
The toe of the Yangtze River dike is most affected by the dynamic compaction vibration, with a maximum horizontal radial acceleration of 13.8 cm/s2 and a velocity of 4.9 mm/s. The vibration effect gradually weakened with the increase in the tamping distance and the height of the dike, and the peak acceleration and velocity decrease to the minimum at the dike top. Since the maximum horizontal vibration acceleration of the Yangtze River dike is less than 45 cm/s2 and the maximum vibration speed is less than 50 mm/s, it can be considered that the impact of dynamic compaction vibration on the Yangtze River dike under 1000 kN·m compaction energy is within the safe range and will not cause damage to the Yangtze River dike.
According to the measurement results and statistics, the peak acceleration and velocity amplitudes in different directions on survey line #1 are almost the same as those on line #2, which proves that the vibration isolation trench set in this test had no obvious isolation effect on the Yangtze River dike caused by dynamic compaction. Several factors may lead to the poor isolation effect of the trench, such as the depth of the trench being too shallow, the distance to the dike being too far, the vibration of the Yangtze River dike being relatively small, and so on. The influence of the above factors on the vibration effect of the Yangtze River dike caused by dynamic compaction will be further explored by using the finite element numerical simulation method in the subsequent chapters.

4. Numerical Modeling

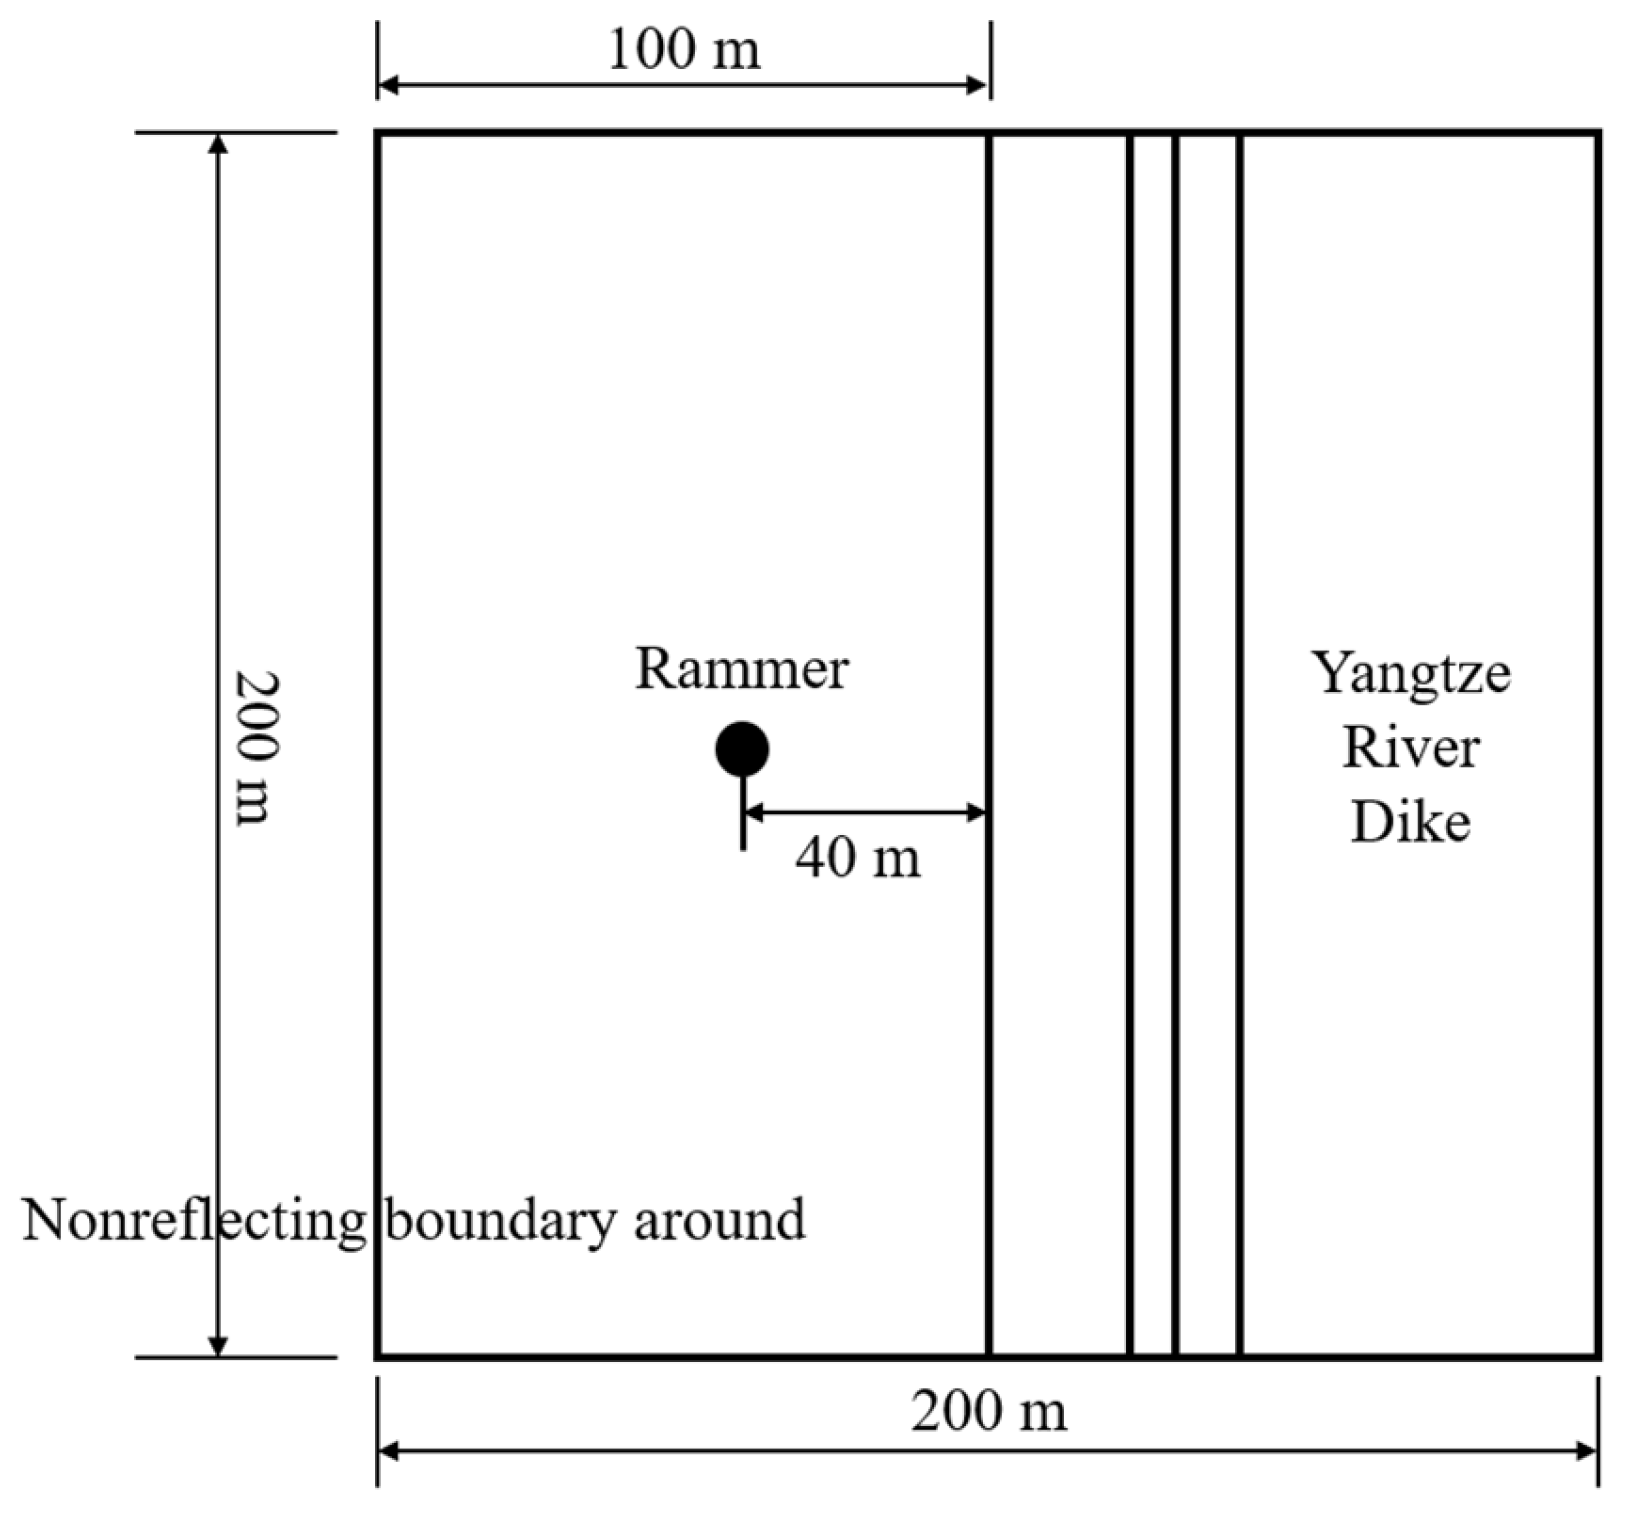
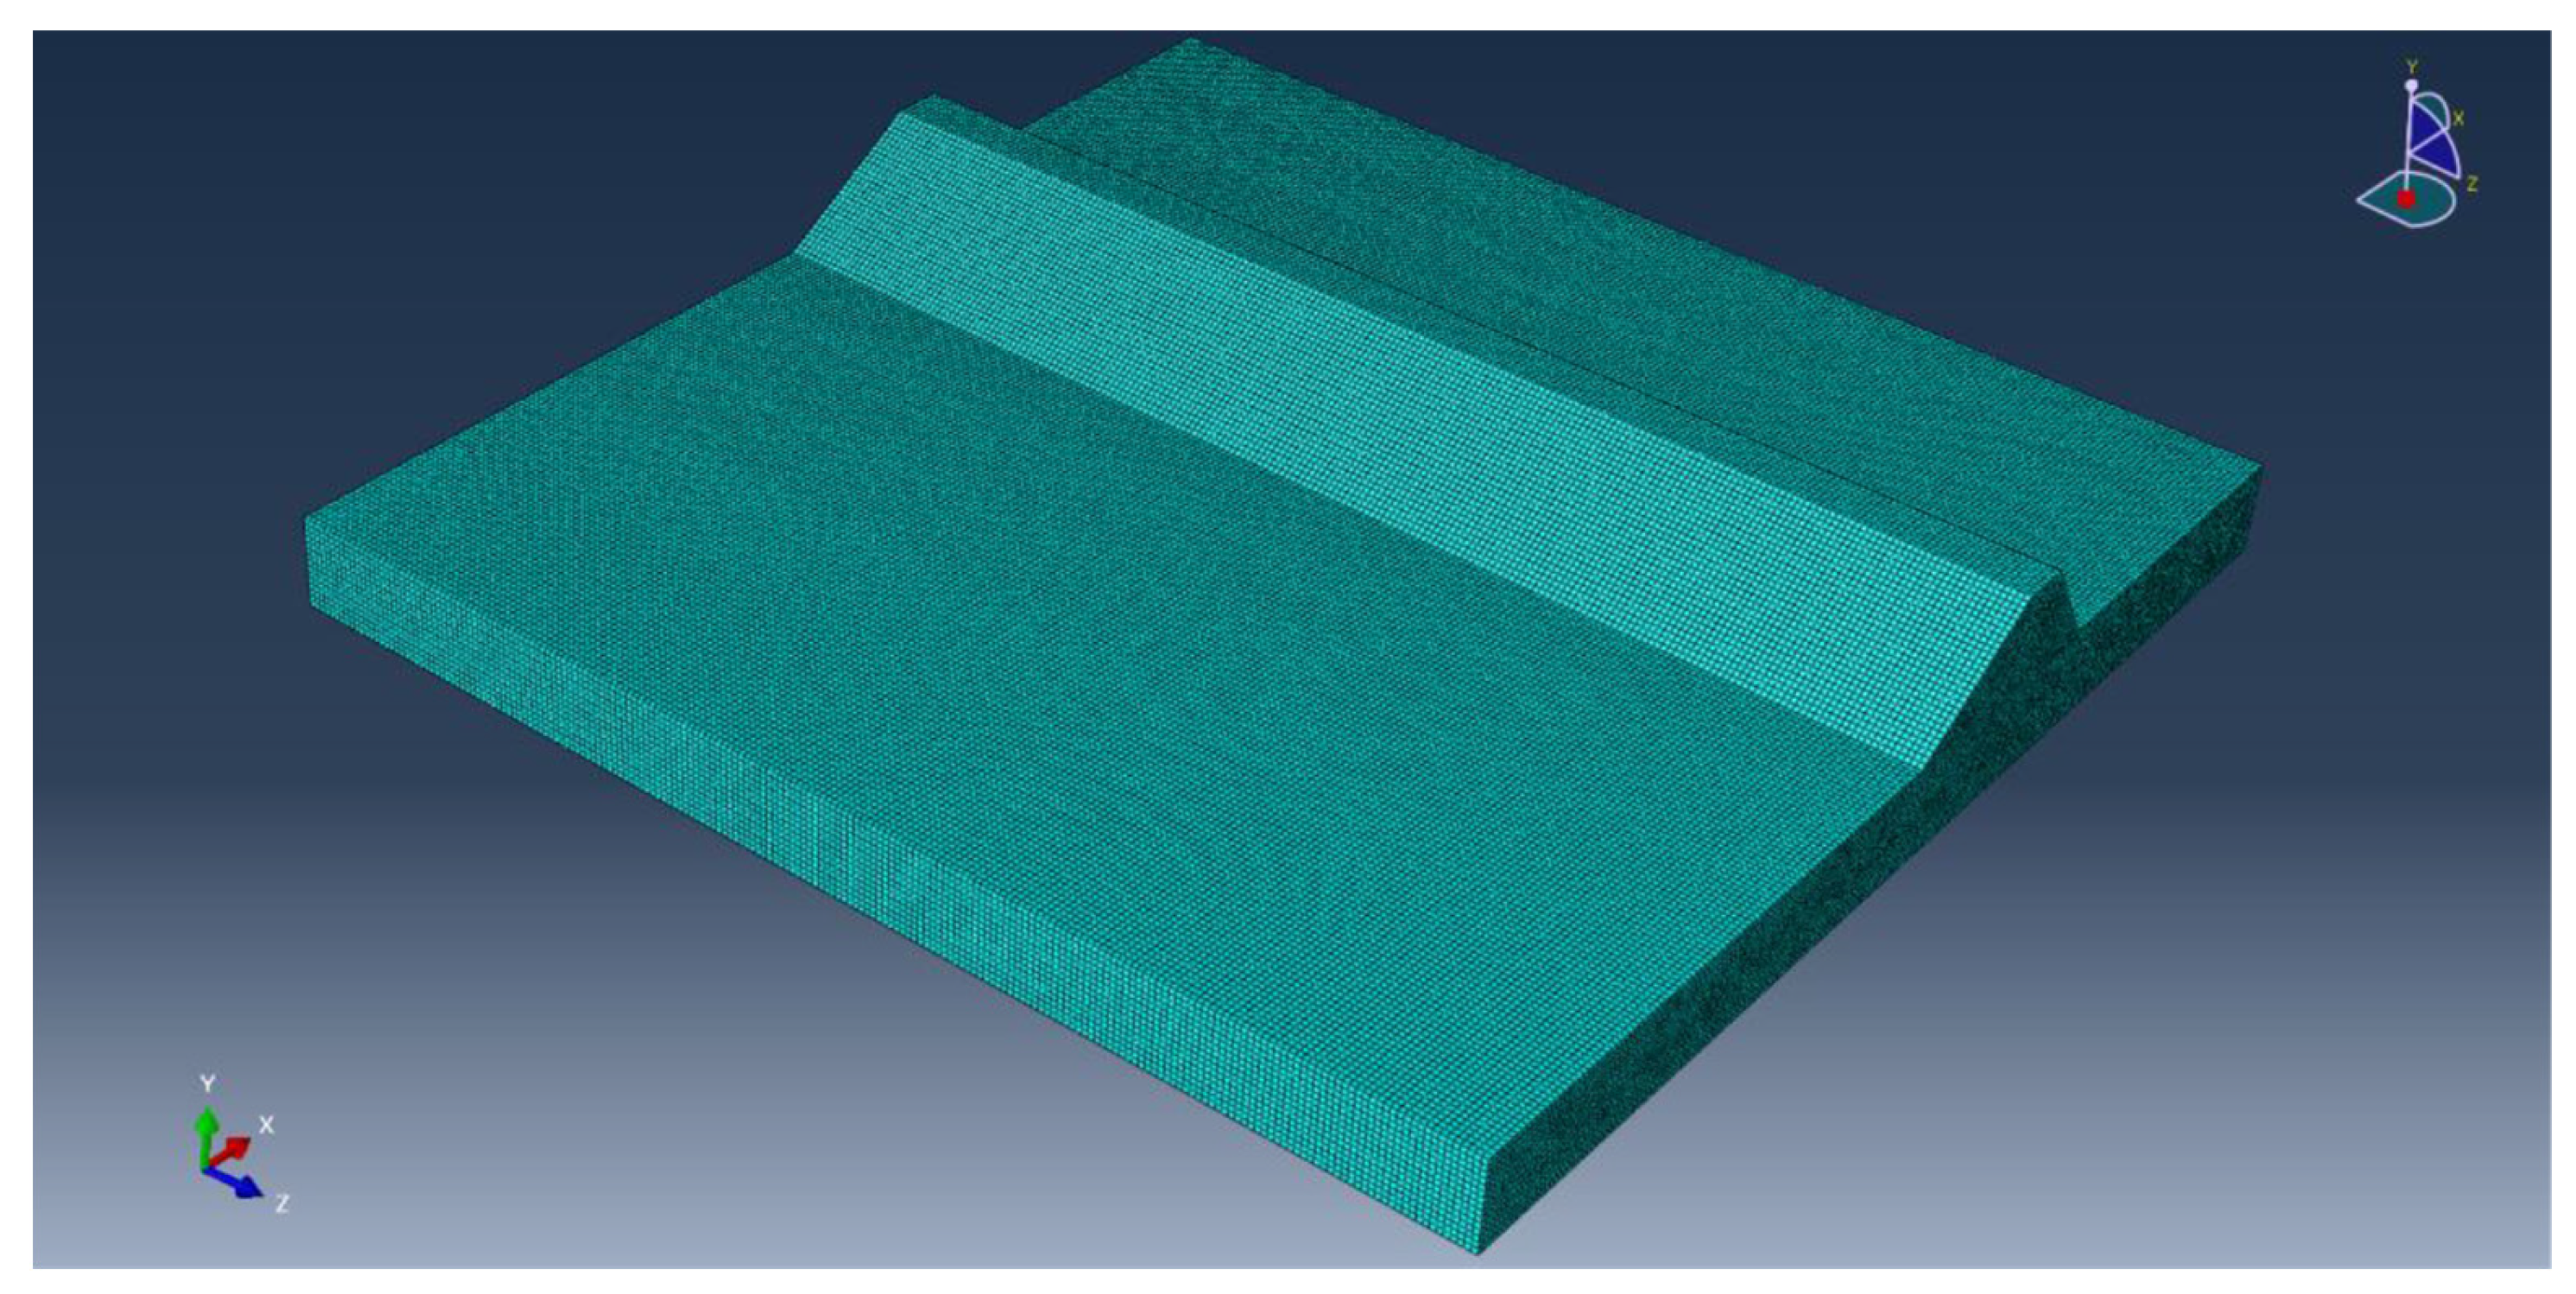
4.1. Numerical Models

The ABAQUS 6.14 finite element software was employed to analyze the vibration damping behavior of the vibration isolation trench on dynamic compaction. The Mohr–Coulomb criterion was utilized in the model to capture the nonlinearity of the soil. Although some more complex soil constitutive models, such as the modified cam clay model (MCC) [36] and the model for structured soils (MSS) [37], are considered more suitable for soils under dynamic loads, they require more complex experiments to obtain the relevant parameters. Moreover, in existing research, such as Mei et al., the Mohr–Coulomb yield criterion has been used to simulate the dynamic compaction process and yielded satisfactory results. Therefore, using the simpler Mohr–Coulomb criterion is sufficient and applicable for the scope of this study. The Shear expansion angle is set to 0. Table 6 presented the other main parameters required for it, which were obtained from field investigation.

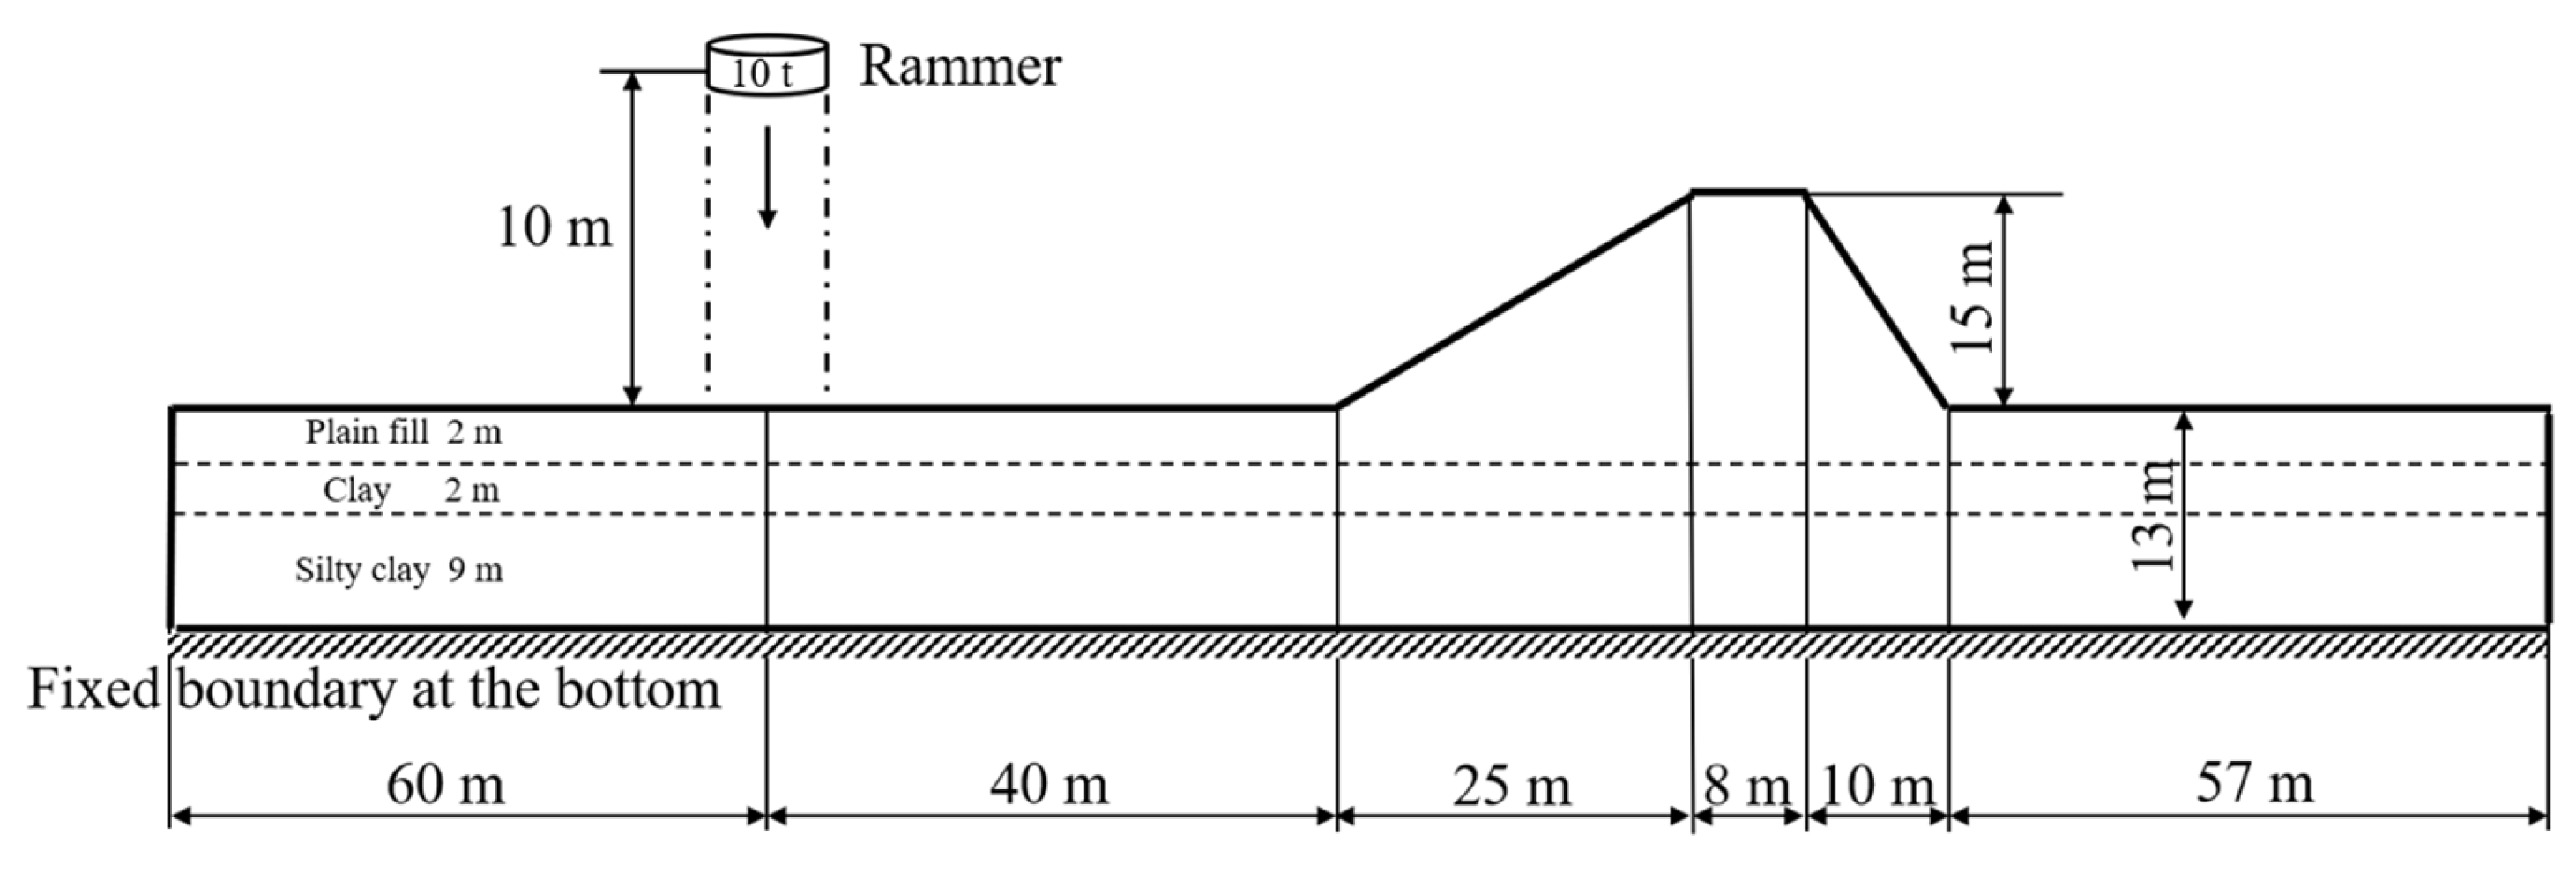
4.2. Geometric Model and Parameters

To facilitate this study, several simplifications were adopted in the model. The hypotheses are as follows:
  • The soil was treated as a layered and homogeneous medium, and certain factors such as groundwater level were not taken into account.
  • The deformation of the rammer during the dynamic compaction process was disregarded.
  • The geostatic stress and deformation were not measured, as the primary focus of this study was on the dynamic response of the Yangtze River dike under dynamic compaction.
  • A completely fixed boundary condition was assumed at the bottom boundaries, while the peripheral area of the foundation model was assumed to satisfy an infinite element boundary condition by using nonreflecting boundary.
The dimensions of the numerical models were deliberately specified to measure 200 m in length, 200 m in width, and 13 m in height. The slope of the Yangtze River dike was simulated with a width of 25 m and a height of 15 m, and the location of the dynamic compaction treatment was set at a distance of 40 m from the toe of the dike. The adoption of a large-sized model was aimed at minimizing the disturbance of vibration waves in the boundaries of the model, thereby enhancing the accuracy of the simulation results. Top view and sectional illustrations of the model are presented in Figure 9 and Figure 10, respectively.
The relationship between the length of the element size and the wavelength is illustrated in Equation (1), where Δx represents the maximum size of the element and λT denotes the wavelength corresponding to the cutoff frequency of interest. As Rayleigh waves generated by dynamic compaction typically have a wavelength larger than 12 m, the element size was set at 0.5 m. The element type used is C3D8R, which is a solid element employing reduced integration technique. The total number of elements is 4,772,986 for the foundation soil. The loading process consists of two steps: the first step involves establishing the geostress equilibrium, and the second step is the actual loading. The time integration algorithm used is an implicit integration method. The damping ratio is set to 5%. To ensure accurate results, a time step of less than 0.01 s is recommended for dynamic compaction vibration analysis. In this study, a time step of 0.005 s was used. Figure 11 shows the mesh of the numerical model.
Δ x 1 6 ~ 1 12 λ T    
Currently, scholars usually use two methods to simulate the impact of dynamic compaction on soils in finite element models: one is a simplified model that approximates the stress process between the compaction hammer and soil as a triangle or sinusoidal waveform; the other treats the hammer as a rigid body that makes contact with the soil surface at a certain velocity. This study chooses the latter method because it better aligns with practical applications. Specifically, the compaction hammer’s velocity upon contacting the soil is determined based on its fall distance, and the type of contact between the hammer and soil is established. With a single compaction stroke energy of 1000 kN·m, a hammer weight of 10 tons, a hammer diameter of 2.5 m, and a fall distance of 10 m, the initial velocity of the compaction hammer in contact with the soil was calculated to be 10√2 m/s. The contact between the rammer and soil was set as frictional contact, and the coefficients of static and dynamic friction were set to 0.1. After evaluating the results of a number of field tests in another study [27], the simulation time was set at 1 s.

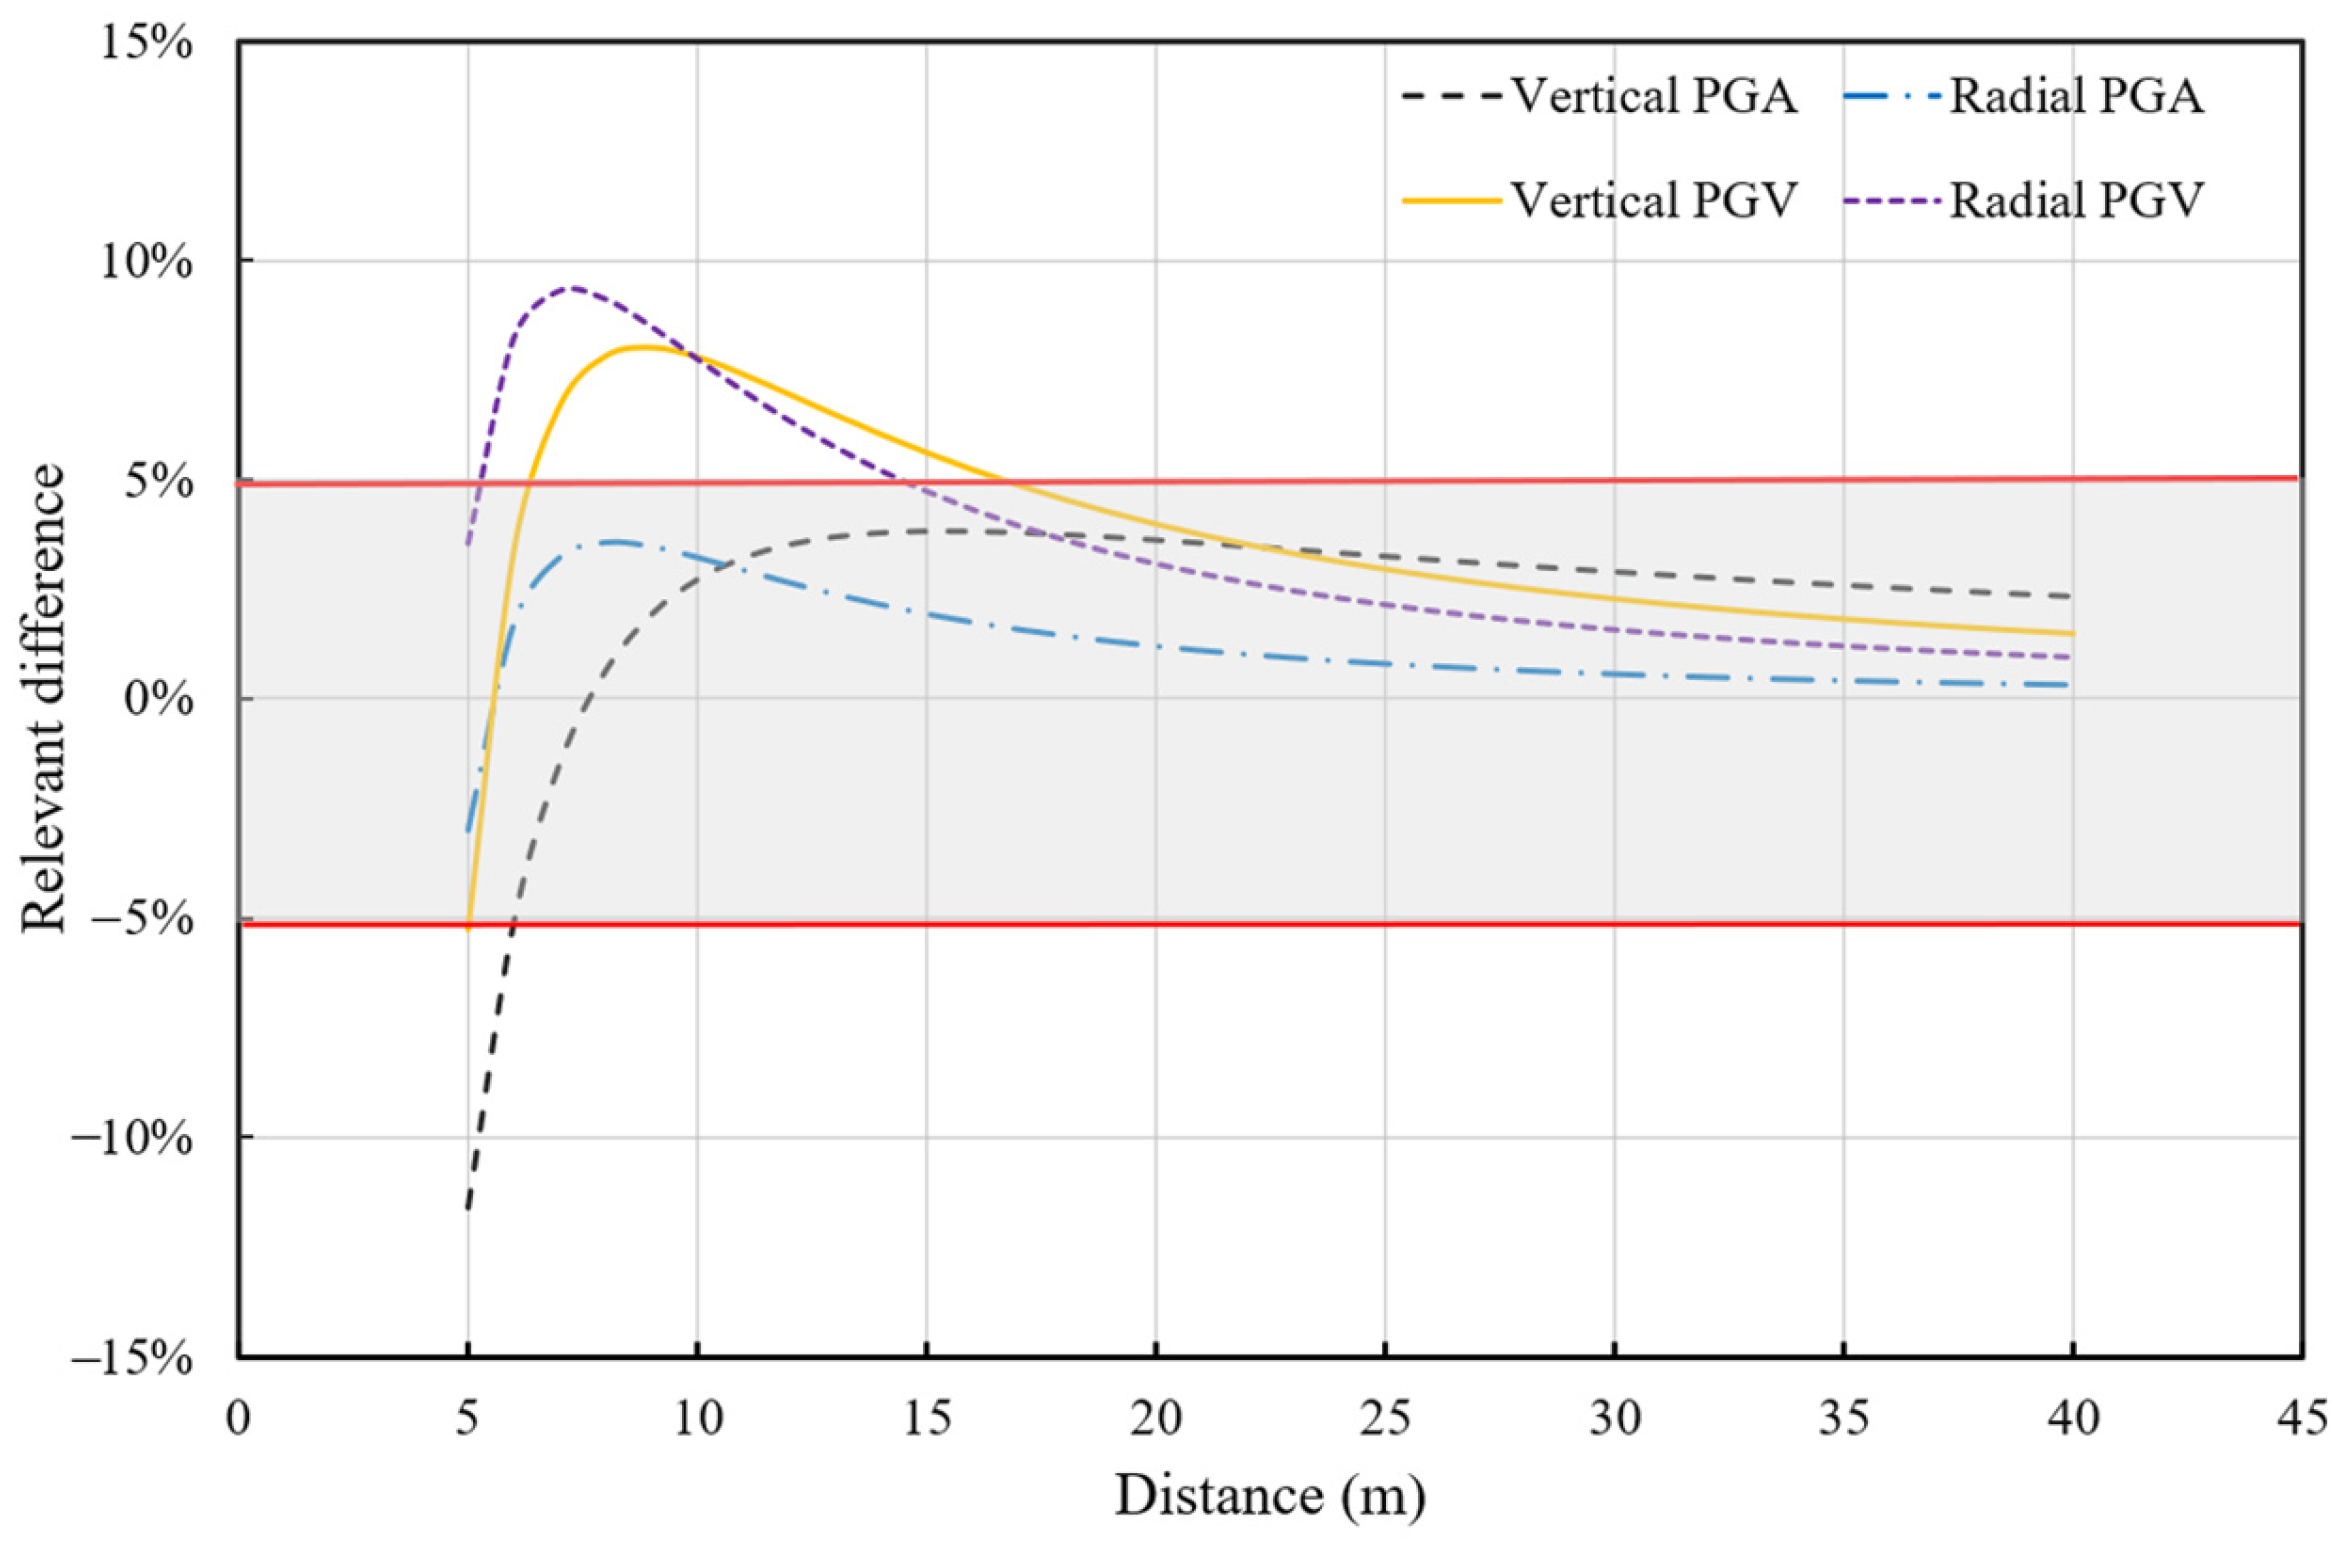
4.3. Validation of the Numerical Model

Figure 12 illustrated the vertical vibration acceleration contour map of the dynamic compaction site obtained by finite element analysis at different times. It can be observed that at 0.2 s, the dynamic compaction has caused vibration in the soil within a radius of 20 m, and at 0.5 s, the toe of the dike is also affected and vibrates, followed by the propagation of the vibration wave to the top of the dike. Therefore, the required signals for the study would be collected within the simulation time, including the PGA at the top of the dike. The energy propagation of the dynamic compaction wave weakens with the distance from the compaction point, and the surface vibration acceleration of the soil gradually decreases with the distance from the compaction point. These are consistent with the performance of the field tests, and quantitative validation is described in the following paragraphs.
The validity of numerical simulation results was assessed by comparing them with on-site detection data. In the simulation, detection points were established every 5 m along the perpendicular line from the compacted point to the dike. Tan et al. [28] found the distance decay effect of the peak ground acceleration by summarizing a large amount of dynamic compaction field data. The vibration decay law can be fitted by the following negative exponential power function, as expressed in Equation (2).
a   o r   v = k r β
where β is the attenuation coefficient, k is the equivalency coefficient, a is the peak vibration acceleration (cm/s2) of the measuring point, v is the peak vibration velocity (mm/s) of the measuring point, and r is the horizontal distance from the tamping point to measuring point. Table 7 displays the values of fitted functions’ parameters. Figure 13 displayed the comparison between numerical simulation results and field measurements. In order to quantify the difference between the numerical simulation and field test results, the relative difference between the fitted curves was calculated by Equation (3) and the results are displayed in Figure 14.
D r = F r M r / F 5 × 100 %
where F r is the fitted function of field test results, M r is the fitted function of simulation results, D r is the relevant difference between numerical simulation fitted curve and field test fitted curve, and r is the horizontal distance from the tamping point to measuring point. As observed in Figure 13, the numerical simulation performed by ABAQUS can accurately simulate the propagation characteristics of dynamic compaction vibration effects on the soil surface and reflect the attenuation laws of PGA and PGV in both the vertical and horizontal directions. The attenuation laws were characterized by negative power function curves, which are in close agreement with the field measurement results. As shown in Figure 14, the majority of the relevant differences are within 10%. However, there are still some discrepancies between the numerical calculations and the field measurements, especially for PGVs between 5 and 15 m. This is mainly due to the fact that the propagation of vibration acceleration and velocity on the surface is significantly affected by the geological conditions of the site. Although the numerical simulation used the same soil mechanics parameters as the field, the soil was simplified as layered homogeneous materials in the analysis, while the field site is complex with uneven soil distribution and uneven surface. In non-uniform soil layers, the dynamic compaction waves will undergo a large amount of reflection, dissipation, and refraction, leading to a faster attenuation rate than the ideal case, resulting in an overestimation of the numerical simulation results. However, these differences do not affect the study of the phenomenon and the laws involved.

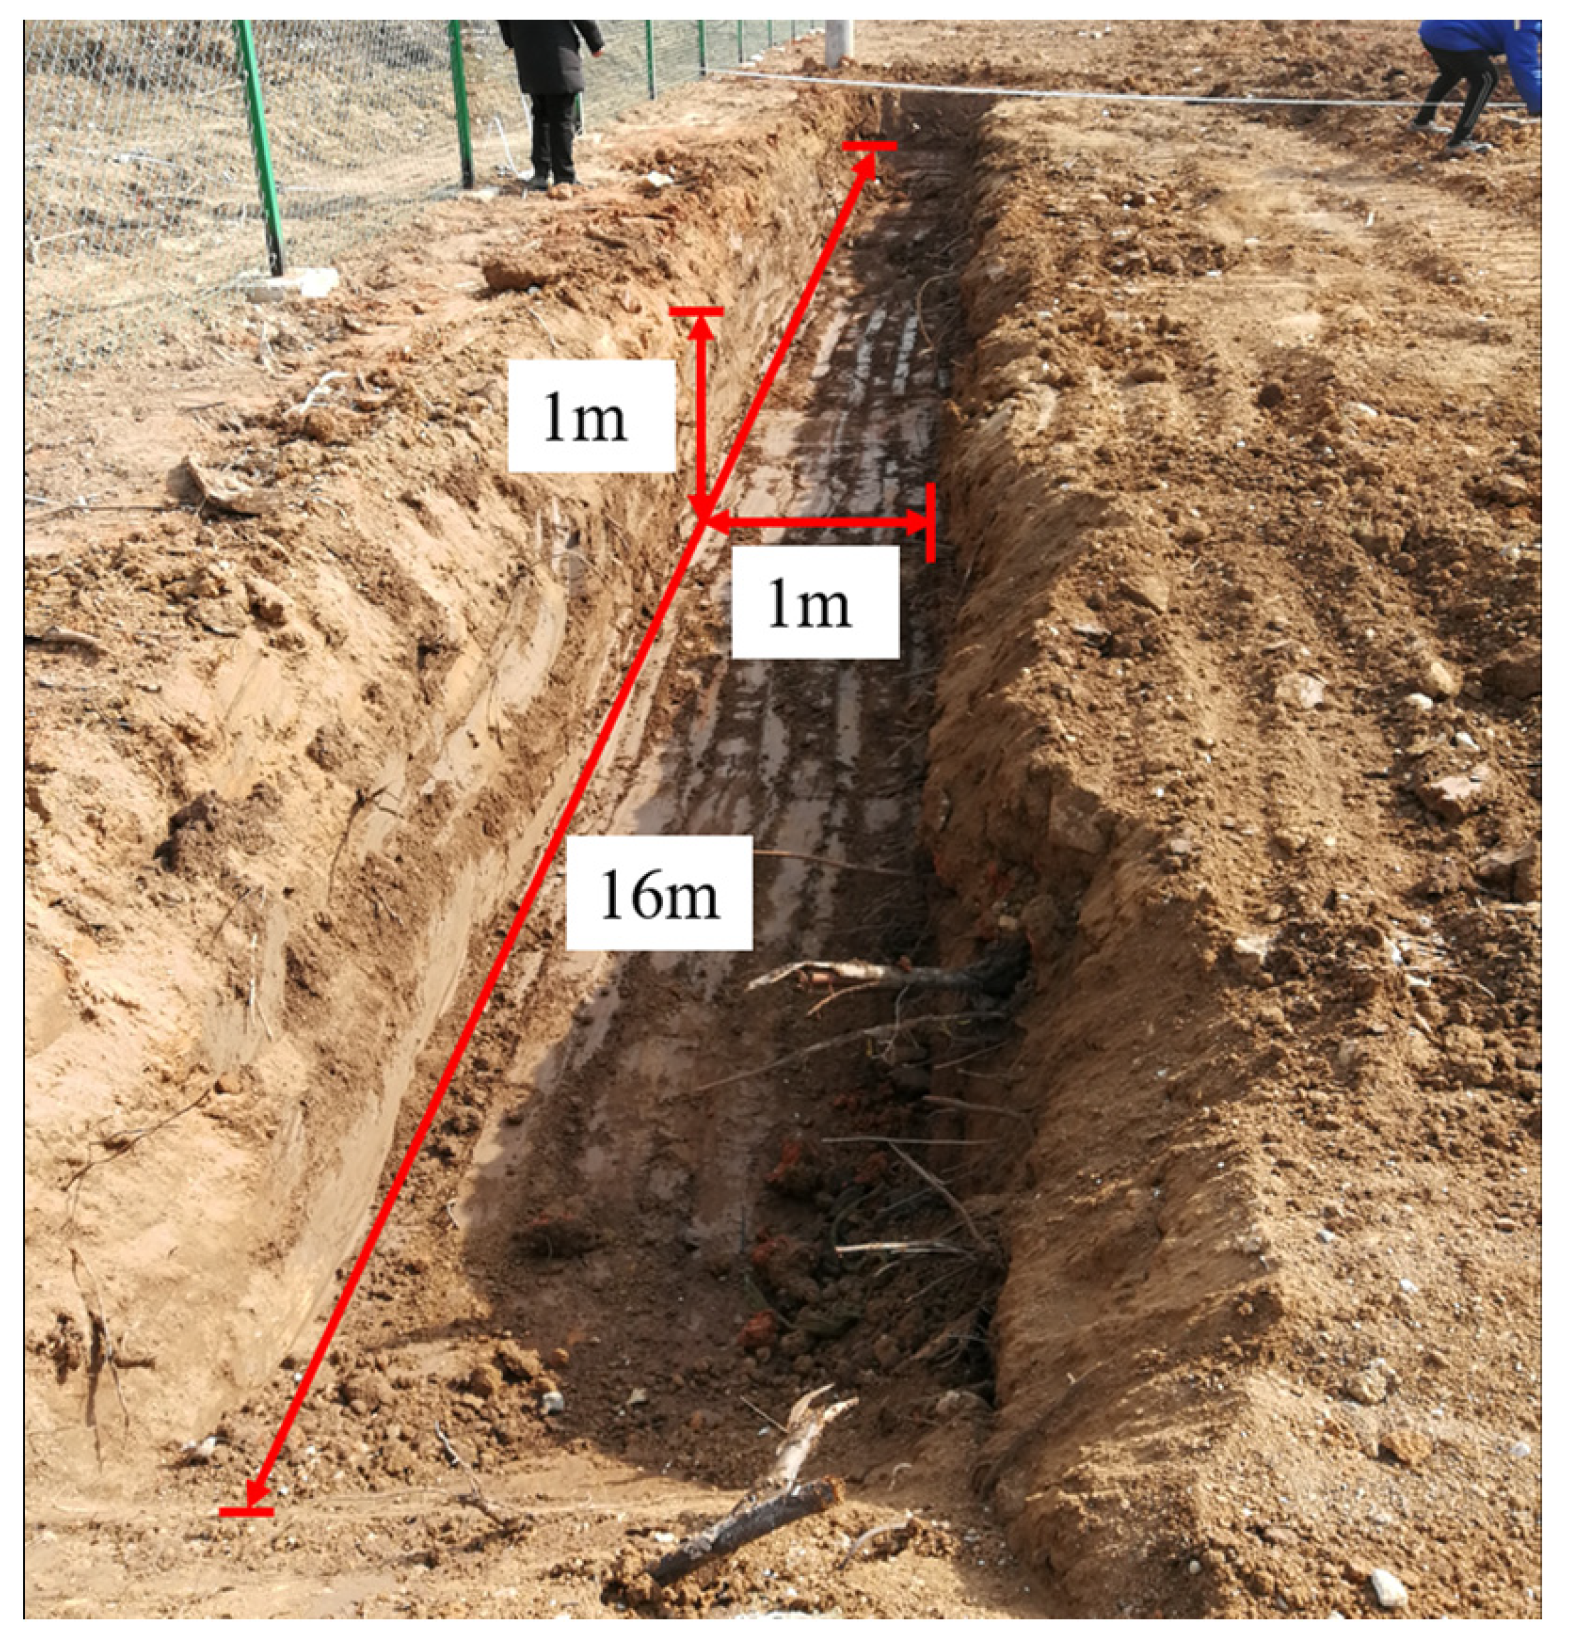
4.4. Arrangement of the Vibration Isolation Trench

It is worth noting that the location and depth of isolation trenches have a significant influence on their vibration isolation effectiveness. To investigate the impact of these parameters on vibration attenuation, seven models were established. The material parameters of the soil and the Yangtze River dike were consistent across all models. Additionally, the distance between the compaction point and the toe of the dike was reduced to 25 m, and a U-shaped trench design was employed for the isolation trench. Further details on the specific parameters for each model’s isolation trench can be found in Table 8. The 2#, 3#, 4#, and 5# measuring lines were used to study the influence t of isolation trench depth, while the 4#, 6#, and 7# measuring lines were used to study the influence of isolation trench position.

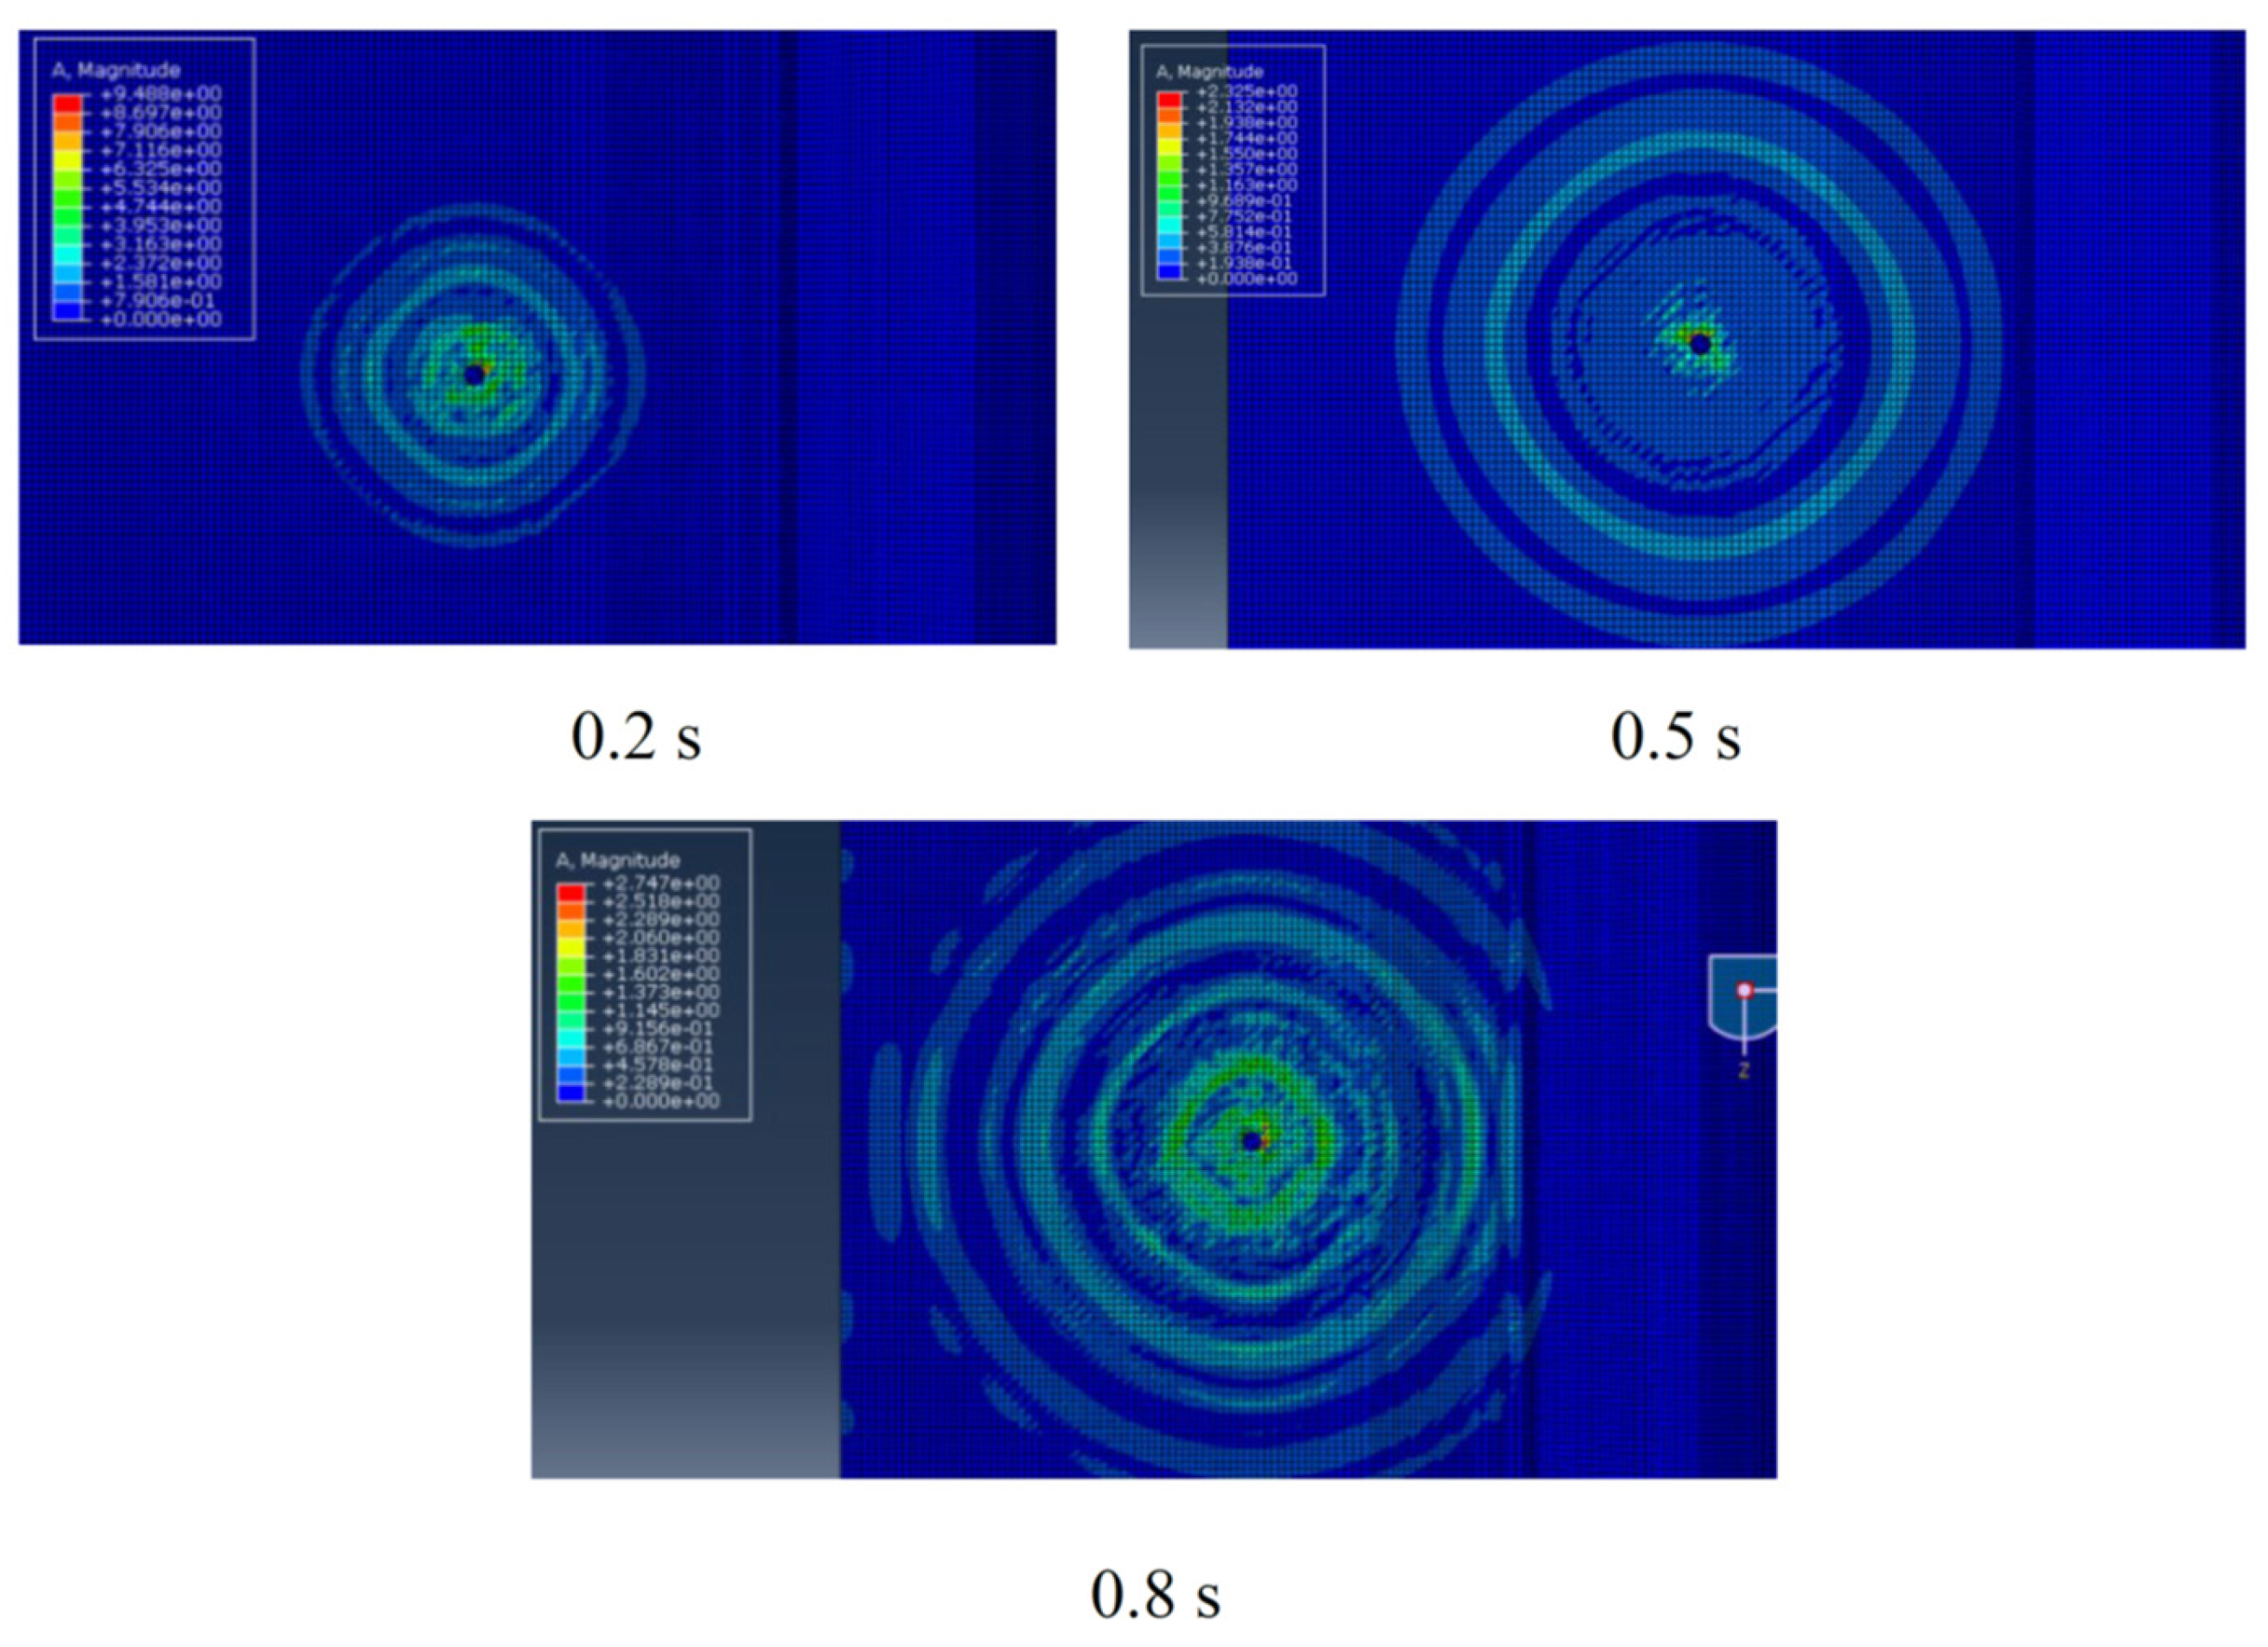
4.5. Simulation Results and Analysis

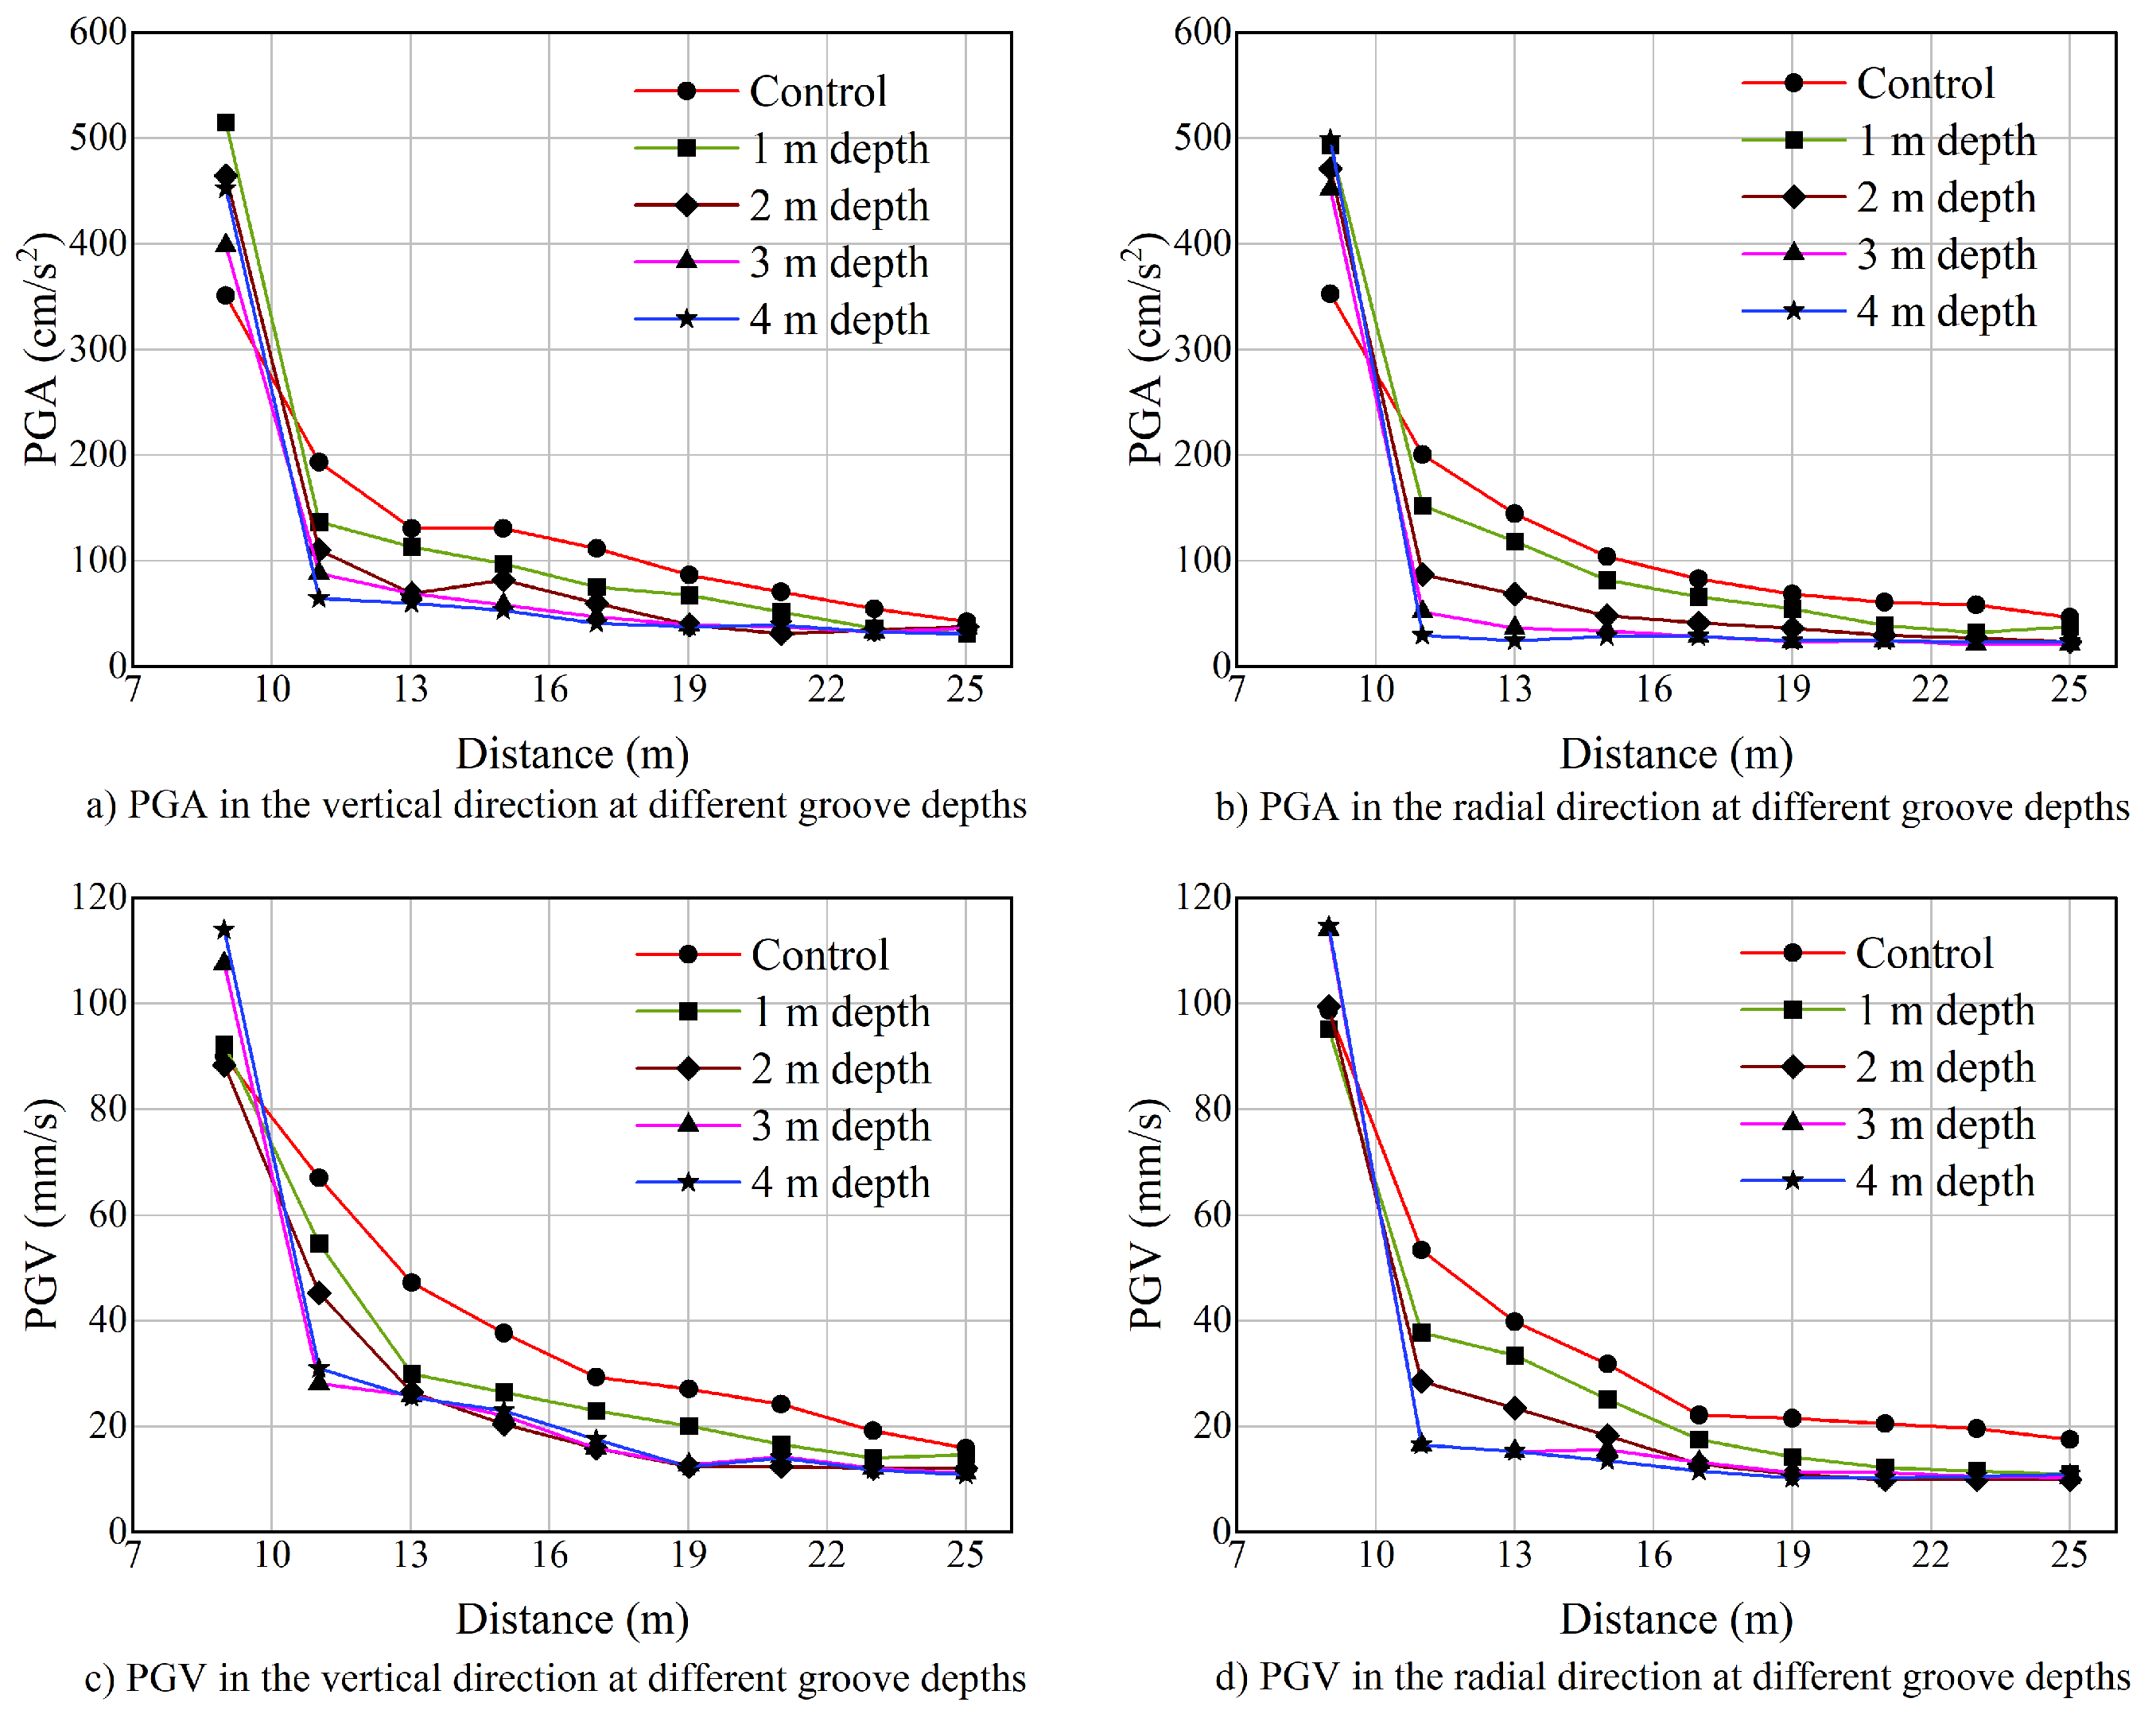
4.5.1. Effect of the Depth of the Vibration Isolation Trench

Figure 15 shows the trends of PGA and PGV with measurement distance under different depths of isolation trenches. The analysis of soil response behind the isolation trench show that the depth of the isolation trench has a significant effect on its isolation effectiveness. As the depth of the isolation trench increases, the attenuation of PGV and PGA in all directions also increases, indicating that the isolation effect of the isolation trench becomes more significant. The isolation effect changes significantly when the depth of the isolation trench increases from 1 m to 3 m. However, when the depth of the isolation trench increases from 3 m to 4 m, the isolation effect hardly changes. These results indicate that there is a critical depth for the isolation trench. When the depth of the isolation trench is less than the critical value, increasing the depth of the isolation trench significantly improves the isolation effect. When the depth of the isolation trench is greater than the critical value, increasing the depth of the isolation trench does not significantly improve the isolation effect but increases maintenance costs. Therefore, the depth of isolation trenches should be selected reasonably in the engineering design. Based on this, the reasonable depth of the isolation trench under the working conditions of this study is 3 m.

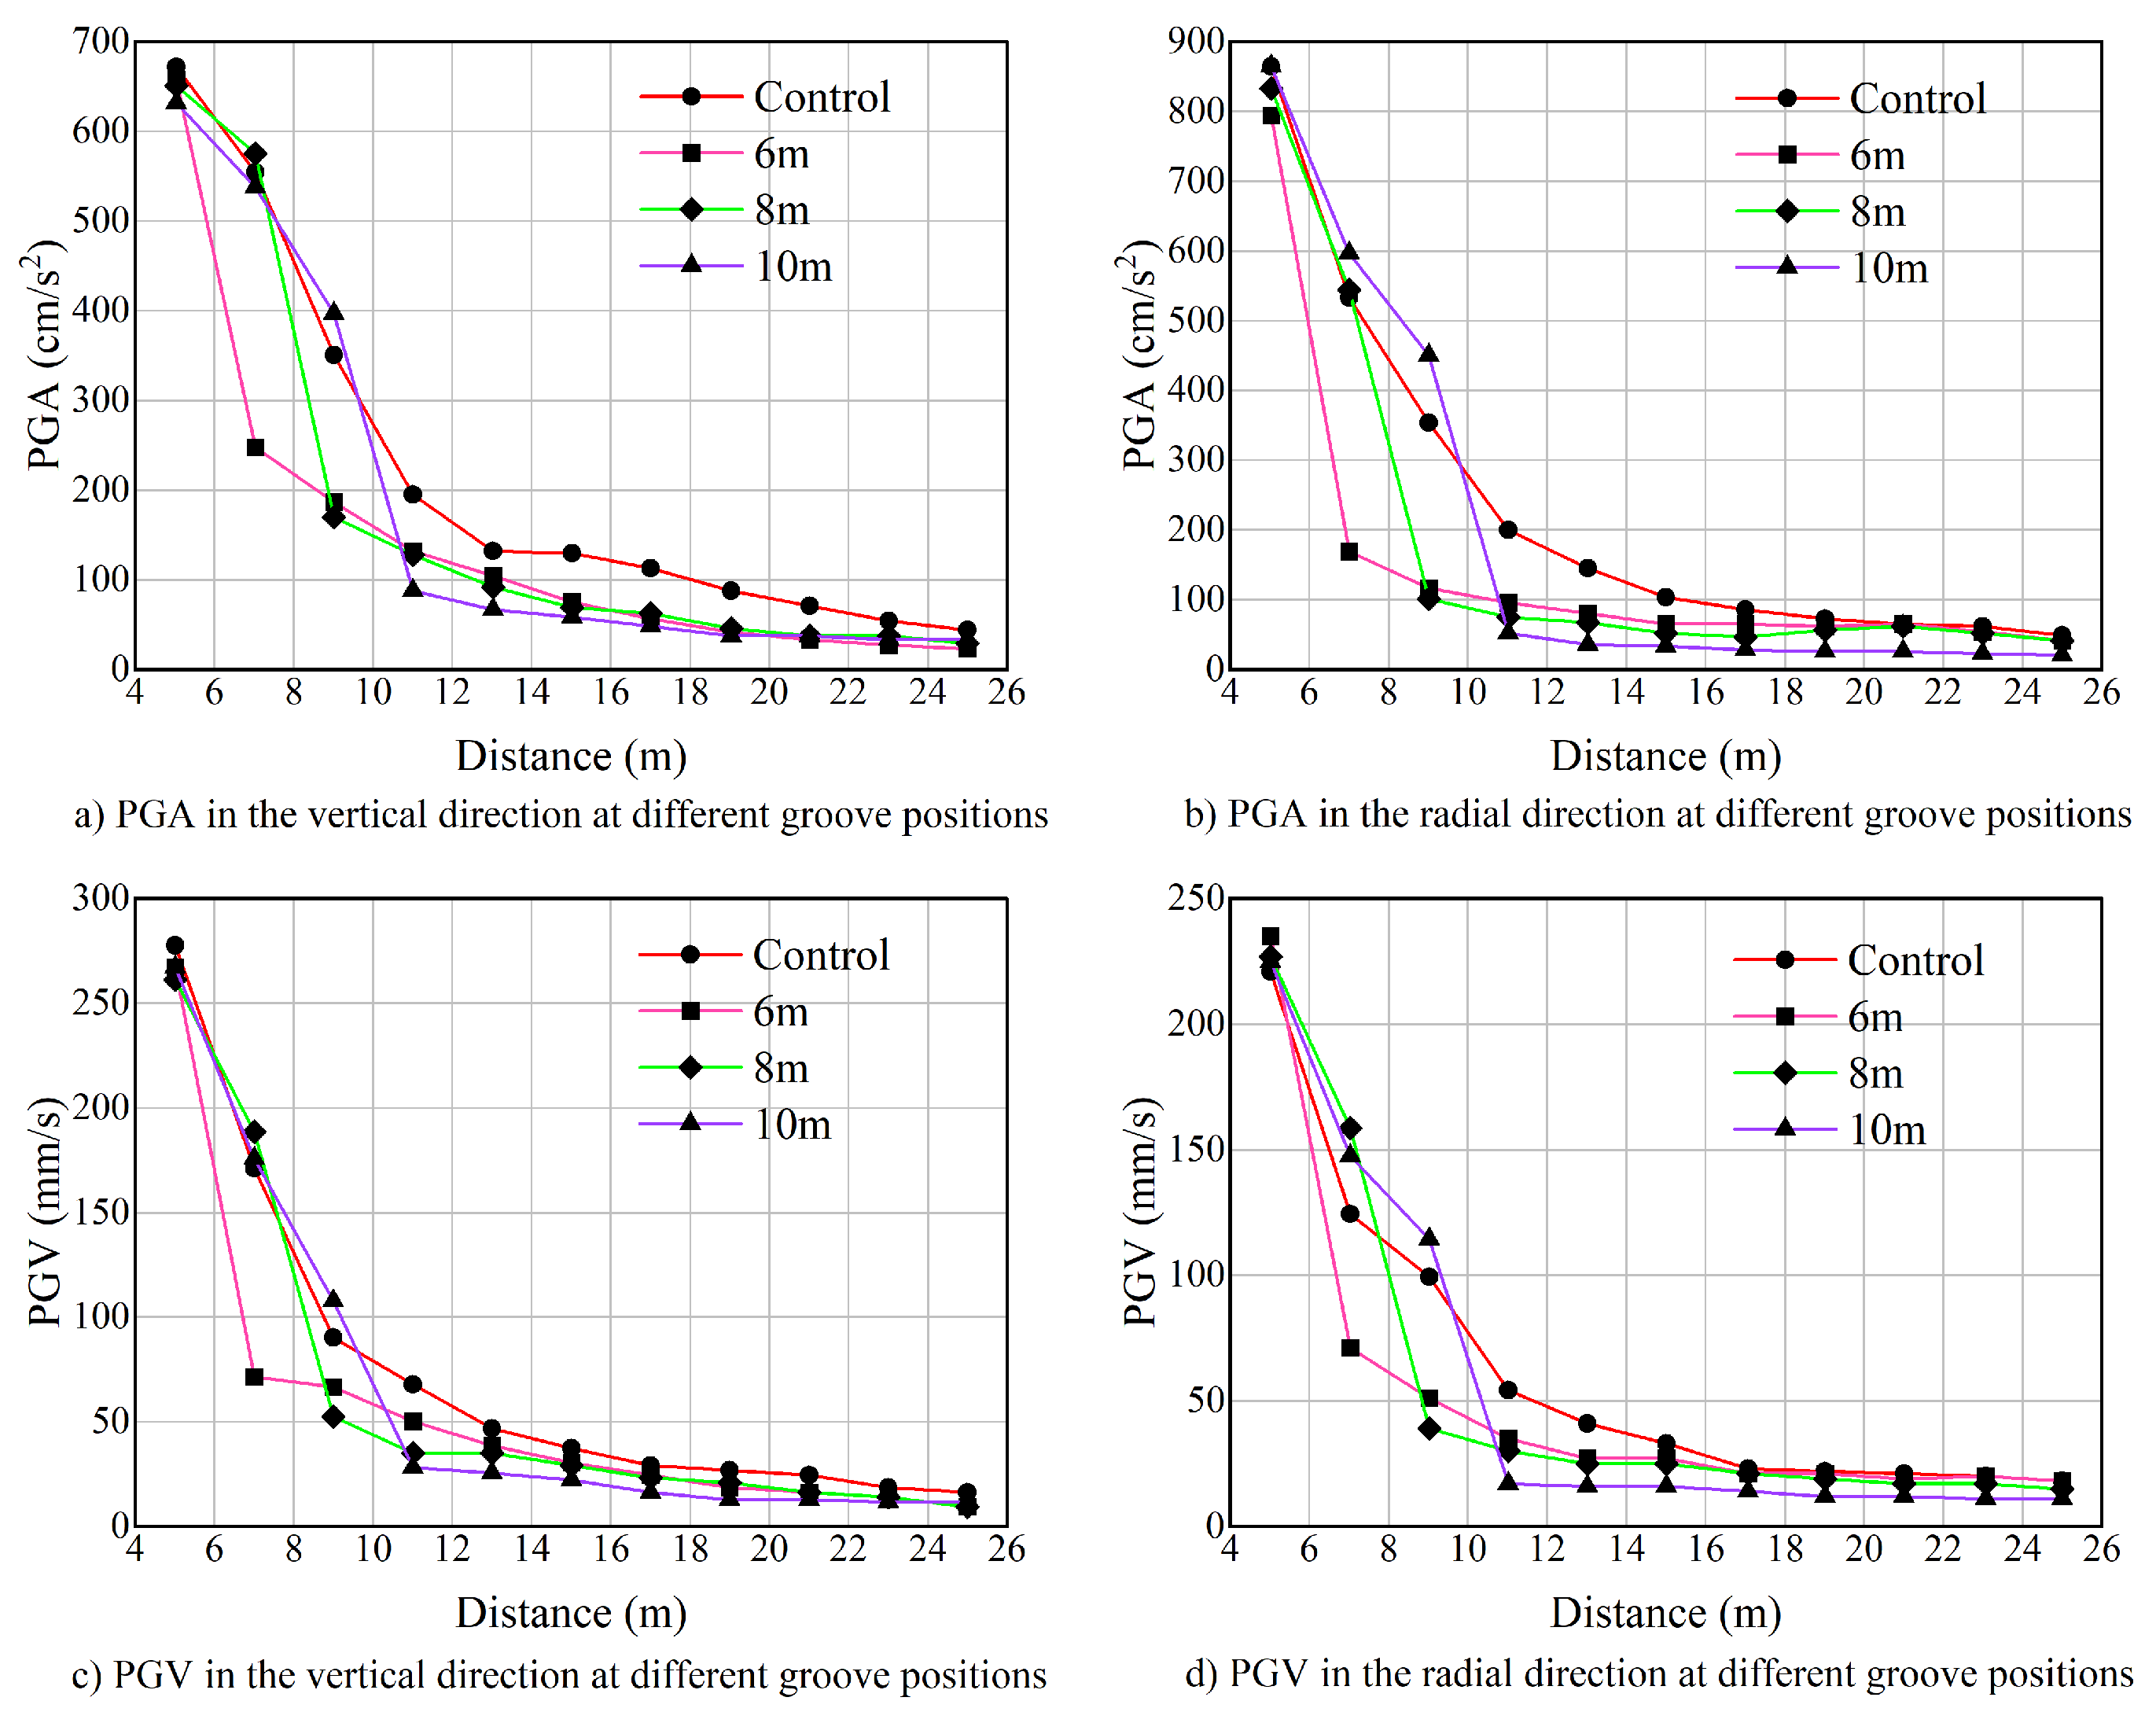
4.5.2. Effect of the Position of the Vibration Isolation Trench

Figure 16 shows the variations of PGA and PGV with the measurement distance for the isolation trench located at different positions. The results revealed that the isolation trench in all positions has a significant isolation effect on the soil immediately behind it. For instance, in the vertical direction of PGA, the model of the isolation trench located 6 m away from the impact point of the soil produces the lowest vibration response for the soil located at 7 m away. Similarly, the model of the isolation trench located 8 m away produces the lowest vibration response for the soil located at 9 m away, while the model of the isolation trench located 10 m away produces the lowest vibration response for the soil located at 11 m away or beyond. The same trend is observed for other directions of PGA and PGV, indicating that the closer the isolation trench is to the soil that needs vibration reduction, the better the vibration reduction effect. Therefore, in practical engineering, to achieve the best isolation effect of the isolation trench, it is recommended to increase the distance between the impact point and the isolation trench and reduce the distance between the vibration source and the isolation trench. Thus, in the case discussed in this paper, the isolation trench should be placed as close to the Yangtze River dike as possible while ensuring the stability of the dike structure.

5. Conclusions

This paper takes a natural gas foundation treatment project in Wuhu as an engineering example and designs on-site vibration control tests. A corresponding numerical model is established using ABAQUS finite element analysis software for mutual verification. The isolation effect of the isolation trench and the influence of the depth and position of the trench on its isolation effect are analyzed, and the following conclusions are drawn:
  • The similarity between the field test results and the simulation results confirmed the effectiveness of using the Mohr–Coulomb criterion to establish a multi-layer homogeneous medium model in ABAQUS and simulating the excitation of DC on actual soil by setting the impact velocity and contact type of the mass block. Moreover, the application of this model in the study of the isolation trench performance is also reliable.
  • The field test results indicate that the isolation trench has a significant isolation effect on the soil behind it. As the distance between the soil and the isolation trench increases, the isolation effect becomes weaker. However, the isolation trench has an amplifying effect on the vibration of the soil in front of the trench, so this part of the soil is more likely to be damaged in DC. Therefore, some reinforcement measures need to be adopted, such as supporting structures.
  • In the simulation results, when the depth of the isolation trench increases from 1 m to 3 m, the isolation effect of the trench increases significantly, and the deeper the trench, the better the isolation effect. When the depth of the isolation trench increases from 3 m to 4 m, the isolation effect does not change significantly.
  • The closer the isolation trench is to the vibration reduction object, the more obvious the isolation effect. In actual engineering, to achieve the best isolation effect of the isolation trench, the distance between the compaction points and the isolation trench should be increased as much as possible on the premise of ensuring that the isolation trench will not affect the stability of the object itself, and the distance between the object that needs to be vibration reduced and the isolation trench should be reduced.

Author Contributions

Conceptualization, T.P.; Funding acquisition, Y.Z.; Investigation, X.L., T.P., G.L., L.S. and X.X.; Methodology, X.L., T.P. and X.X.; Project administration, G.L. and L.S.; Supervision, Y.Z.; Writing—original draft, X.L. and D.C.; Writing—review and editing, T.P. All authors have read and agreed to the published version of the manuscript.

Funding

The authors would like to express their sincere gratitude for the financial support provided by the 173 Key Basic Research Project of the National Natural Science Foundation of China.

Institutional Review Board Statement

Not applicable.

Informed Consent Statement

Not applicable.

Data Availability Statement

The data used to support the findings of this study are included within the article.

Conflicts of Interest

The authors declare no conflict of interest.

References

  1. Menard, L.; Broise, Y. Theoretical and practical aspect of dynamic consolidation. Geotechnique 1975, 25, 3–18. [Google Scholar] [CrossRef]
  2. Mayne, P.W.; Jones, J.S.; Dumas, J.C. Ground response to dynamic compaction. J. Geotech. Eng. 1984, 110, 757–774. [Google Scholar] [CrossRef]
  3. Thilakasiri, H.S.; Gunaratne, M.; Mullins, G.; Stinnette, P.; Jory, B. Investigation of impact stresses induced in laboratory dynamic compaction of soft soils. Int. J. Numer. Anal. Methods Geomech. 1996, 20, 753–767. [Google Scholar] [CrossRef]
  4. Charles, J.A. Ground improvement: The interaction of engineering science and experience-based technology. Geotechnique 2002, 52, 527–532. [Google Scholar] [CrossRef]
  5. Lutenegger, A.J. Dynamic compaction in friable loess. J. Geotech. Eng. 1986, 112, 663–667. [Google Scholar] [CrossRef]
  6. Poran, C.J.; Rodriguez, J.A. Design of dynamic compaction. Can. Geotech. J. 1992, 29, 796–802. [Google Scholar] [CrossRef]
  7. Zhang, J.; Liu, J. Dynamic stress response law and construction parameters study of rockfill embankment under dynamic compaction. J. Railw. Sci. Eng. 2020, 17, 95–101. [Google Scholar]
  8. Moon, J.S.; Jung, H.S.; Lee, S.; Kang, S.T. Ground Improvement Using Dynamic Compaction in Sabkha Deposit. Appl. Sci. 2019, 9, 2506. [Google Scholar] [CrossRef]
  9. Hu, R.; Shi, W.; Shui, W.; Yan, X. Experimental study on mechanical behavior of negative skin friction on piles in high filled embankment after dynamic compaction. Jianzhu Jiegou Xuebao/J. Build. Struct. 2020, 41, 160–169. [Google Scholar]
  10. Qin, G.; Ting, G. Model experimental research on high-filled subgrade reinforced by geogrid under dynamic compaction. In Proceedings of the 4th International Symposium on Power Electronics and Control Engineering (ISPECE 2021), Nanchang, China, 16–19 September 2021; pp. 332–336. [Google Scholar]
  11. Shifan, Q.; Ping, X.; Tong, Q.; Xiao, S. A Field Study of Dynamic Compaction in the Construction of a Stone-Filled Embankment. J. Test. Eval. 2021, 49, 3859–3868. [Google Scholar]
  12. Qi, H.; Yang, C.; Hu, C.; Rong, Y.; Yao, Z.; Jiang, H.; Yao, K.; Chen, L.; Li, H.; Teng, X. Analysis on improvement effect of subgrade by dynamic compaction. Arab. J. Geosci. 2021, 14, 2281. [Google Scholar] [CrossRef]
  13. Cai, J.; Zhang, J.; Du, G.; Xia, H. Application of the Dynamic Compaction Method for Ground Improvement of Collapsible Loess in Qinhai. Tek. Dergi/Tech. J. Turk. Chamb. Civ. Eng. 2022, 33, 11455–11472. [Google Scholar] [CrossRef]
  14. Dobrescu, C.F. The Dynamic Compaction Regime of the Discretely Variable Viscoelastic Soil Parameters During the Work Process. In Proceedings of the 16th International Conference on Acoustic and Vibration of Mechanical Structure, AVMS 2021, Timisoara, Romania, 28–29 May 2021; Springer: Cham, Switzerland, 2022; pp. 254–259. [Google Scholar]
  15. Wu, S.; Wei, Y.; Zhang, Y.; Cai, H.; Du, J.; Wang, D.; Yan, J.; Xiao, J. Dynamic compaction of a thick soil-stone fill: Dynamic response and strengthening mechanisms. Soil Dyn. Earthq. Eng. 2020, 129, 105944. [Google Scholar] [CrossRef]
  16. Jia, M.; Yang, Y.; Liu, B.; Wu, S. Densification mechanism of granular soil under dynamic compaction of proceeding impacts. Granul. Matter 2021, 23, 72. [Google Scholar] [CrossRef]
  17. Chen, L.; Qiao, L.; Li, Q. Study on dynamic compaction characteristics of gravelly soils with crushing effect. Soil Dyn. Earthq. Eng. 2019, 120, 158–169. [Google Scholar] [CrossRef]
  18. Zhou, C.; Jiang, H.; Yao, Z.; Li, H.; Yang, C.; Chen, L.; Geng, X. Evaluation of dynamic compaction to improve saturated foundation based on the fluid-solid coupled method with soil cap model. Comput. Geotech. 2020, 125, 103686. [Google Scholar] [CrossRef]
  19. Jia, M.; Cheng, J.; Liu, B.; Ma, G. Model tests of the influence of ground water level on dynamic compaction. Bull. Eng. Geol. Environ. 2021, 80, 3065–3078. [Google Scholar] [CrossRef]
  20. Mei, Y.; Zhang, S.; Hu, C.; Wang, X.; Yuan, Y.; Zhao, L.; Zhou, D. Field test study on dynamic compaction in treatment of a deep collapsible loess foundation. Bull. Eng. Geol. Environ. 2021, 80, 8059–8073. [Google Scholar] [CrossRef]
  21. Wang, W.; Wu, Y.; Wu, H.; Yang, C.; Feng, Q. Numerical analysis of dynamic compaction using FEM-SPH coupling method. Soil Dyn. Earthq. Eng. 2021, 140, 106420. [Google Scholar] [CrossRef]
  22. Wei, Y.; Yang, Y.; Wang, J.; Liu, H.; Li, J.; Jie, Y. Performance evaluation of high energy dynamic compaction on soil-rock mixture geomaterials based on field test. Case Stud. Constr. Mater. 2023, 18, e01734. [Google Scholar] [CrossRef]
  23. Yao, Z.; Zhou, C.; Lin, Q.; Yao, K.; Satchithananthan, U.; Lee, F.H.; Tang, A.M.; Jiang, H.; Pan, Y.; Wang, S. Effect of dynamic compaction by multi-point tamping on the densification of sandy soil. Comput. Geotech. 2022, 151, 104949. [Google Scholar] [CrossRef]
  24. Zhang, R.; Sun, Y.; Song, E. Simulation of dynamic compaction and analysis of its efficiency with the material point method. Comput. Geotech. 2019, 116, 103218. [Google Scholar] [CrossRef]
  25. Li, P.; Sun, J.; Ge, X.; Zhang, M.; Wang, J. Parameters of dynamic compaction based on model test. Soil Dyn. Earthq. Eng. 2023, 168, 107853. [Google Scholar] [CrossRef]
  26. Zhang, H.; Jin, Y.; Liu, Q.; Zhao, Y.; Gao, Q. Intelligent monitoring method for tamping times during dynamic compaction construction using machine vision and pattern recognition. Measurement 2022, 193, 110835. [Google Scholar] [CrossRef]
  27. Wu, J.; Ma, L.; Shi, J.; Sun, Y.; Ke, J.; Wang, D. Investigation of Ground Vibration of Full-Stone Foundation under Dynamic Compaction. Shock Vib. 2019, 2019, 2631797. [Google Scholar] [CrossRef]
  28. Tan, H.; Sun, J.; Qi, S. The study of the dynamic compaction vibration attenuation. Geotech. Investig. Surv. 2001, 5, 11–14. [Google Scholar]
  29. Zheng, S.; Yao, Y.; Zeng, X. Vibration-isolating Effect of Vibration-isolating Slot in Project Site. Blasting 2008, 25, 103–106. [Google Scholar]
  30. Hwang, J.H.; Tu, T.Y. Ground vibration due to dynamic compaction. Soil Dyn. Earthq. Eng. 2006, 26, 337–346. [Google Scholar] [CrossRef]
  31. Comina, C.; Foti, S. Surface wave tests for vibration mitigation studies. J. Geotech. Geoenviron. Eng. 2007, 133, 1320–1324. [Google Scholar] [CrossRef]
  32. Shrivastava, R.K.; Rao, N. Response of soil media due to impulse loads and isolation using trenches. Soil Dyn. Earthq. Eng. 2002, 22, 695–702. [Google Scholar] [CrossRef]
  33. Bose, T.; Choudhury, D.; Sprengel, J.; Ziegler, M. Efficiency of Open and Infill Trenches in Mitigating Ground-Borne Vibrations. J. Geotech. Geoenviron. Eng. 2018, 144, 04018048. [Google Scholar] [CrossRef]
  34. Wang, G.; Yin, Y.; Wang, J. Vibration safety evaluation and vibration isolation control measures for buried oil pipelines under dynamic compaction: A case study. Soil Dyn. Earthq. Eng. 2023, 167, 107783. [Google Scholar] [CrossRef]
  35. Ramaswamy, N.; Joshi, B.; Wang, J.; Li, X.; Menq, F.Y.; Shan, X.; Nakshatrala, K.B.; Stokoe, K.H.; Mo, Y.L. Experimental study of passive seismic vibration isolation by trench-type periodic barrier. Eng. Struct. 2023, 276, 115308. [Google Scholar] [CrossRef]
  36. Kavvadas, M.; Amorosi, A. A constitutive model for structured soils. Géotechnique 2000, 50, 263–273. [Google Scholar] [CrossRef]
  37. Savvides, A.A.; Papadrakakis, M. A probabilistic assessment for porous consolidation of clays. SN Appl. Sci. 2021, 659, 2115. [Google Scholar] [CrossRef]
Figure 1. The layout of the field test site.
Applsci 13 09744 g001
Figure 2. The site photos of the field test.
Applsci 13 09744 g002
Figure 3. The cutaway view of the field test.
Applsci 13 09744 g003
Figure 4. The monitoring system and sensors.
Applsci 13 09744 g004
Figure 5. The layout of the measurements without the isolation trench.
Applsci 13 09744 g005
Figure 6. The layout of the measurements with the isolation trench.
Applsci 13 09744 g006
Figure 7. The size of the isolation trench.
Applsci 13 09744 g007
Figure 8. Attenuation curve of PGA and PGV of survey line #1 and #2.
Applsci 13 09744 g008
Figure 9. The top view of the numerical model.
Applsci 13 09744 g009
Figure 10. The cutaway view of the numerical model.
Applsci 13 09744 g010
Figure 11. Mesh generation of the numerical model.
Applsci 13 09744 g011
Figure 12. The vertical vibration acceleration propagation in the dynamic compaction site at different times.
Applsci 13 09744 g012
Figure 13. Curve comparison between numerical simulation results and field test data.
Applsci 13 09744 g013
Figure 14. Relevant difference between numerical simulation fitted curve and field test fitted curve.
Applsci 13 09744 g014
Figure 15. Attenuation trend of PGA and PGV with the measuring distance at different isolation trench depths.
Applsci 13 09744 g015
Figure 16. Attenuation trend of PGA and PGV with the measuring distance at different isolation trench positions.
Applsci 13 09744 g016
Table 1. Recommended values for the allowable bearing capacity and compression modulus of foundation soil.
Soil LayerThickness
(m)
The Allowable Bearing Capacity fak (kPa)Compressive Modulus (MPa)
#1 plain fill2.23Not suitable for direct use as a natural foundation-
#2 clay1.94100~1202.83
#3 silty clay9.1550~702.86
Table 2. The parameters of the vibration meter.
ParametersValues
Frequency (Hz)1–100 k
Power supplyCC: ±24 V/2 mA
Accuracy<1%
VoltageAC: 220 V
Table 3. The horizontal distance between tamping and measuring points on the survey lines.
No.The Horizontal Distance between Tamping and Measuring Point (m)
12345678910
#181216202530354052.565
#281216202530354052.565
Table 4. Summary of peak ground acceleration (cm/s2) of the Yangtze River on survey line #1 and #2.
Survey LinePart of the DikeHorizontal RadialHorizontal TangentialVertical
#1Toe13.759.5119.89
Middle11.839.4715.61
Crest5.674.2410.32
#2Toe16.543.8118.81
Middle14.023.4816.61
Crest7.623.1210.98
#2 − #1Toe2.79−5.7−1.08
Middle2.19−5.991
Crest1.95−1.120.66
Table 5. Summary of peak ground velocity (mm/s) of the Yangtze River on survey line #1 and #2.
Survey LinePart of the DikeHorizontal RadialHorizontal TangentialVertical
#1Toe3.642.154.85
Middle2.592.073.78
Crest1.131.143.18
#2Toe3.380.944.82
Middle2.750.834.49
Crest1.830.734.13
#2 − #1Toe−0.26−1.21−0.03
Middle0.16−1.240.71
Crest0.7−0.410.95
Table 6. Physical and mechanical properties of the soils in the field test site.
No.Soil LayerLayer Thickness (m)Density (kg/m3)Poisson’s Ratio
Internal
Friction
Angle (o)
Cohesion (kPa)Young’s
Modulus (MPa)
1plain fill21.9 × 1030.3515.05.12
2clay21.87 × 1030.3015.610.33
3silty clay91.85 × 1030.3017.49.23
4Yangtze River Dike-2 × 1030.2520.129.85
Table 7. The parameter values of fitted function.
ValueField TestModeling
PGAPGVPGAPGV
VerticalRadialVerticalRadialVerticalRadialVerticalRadial
k4704.665,887.17677.312,192.62222.933,328.72229.74848.6
β 1.6182.7482.4842.5881.2502.3481.7591.988
R 2 *0.9770.9980.9880.9960.9940.9970.9850.987
* R stands for correlation coefficient.
Table 8. Summary of operational parameters in the simulation.
Model No.Distance from Tamping PointDepth of Vibration Isolation TrenchWidth of Vibration Isolation Trench
1# (Control)Without vibration isolation trench
2#10 m1 m1 m
3#10 m2 m1 m
4#10 m3 m1 m
5#10 m4 m1 m
6#6 m3 m1 m
7#8 m3 m1 m
Disclaimer/Publisher’s Note: The statements, opinions and data contained in all publications are solely those of the individual author(s) and contributor(s) and not of MDPI and/or the editor(s). MDPI and/or the editor(s) disclaim responsibility for any injury to people or property resulting from any ideas, methods, instructions or products referred to in the content.

