1. Introduction
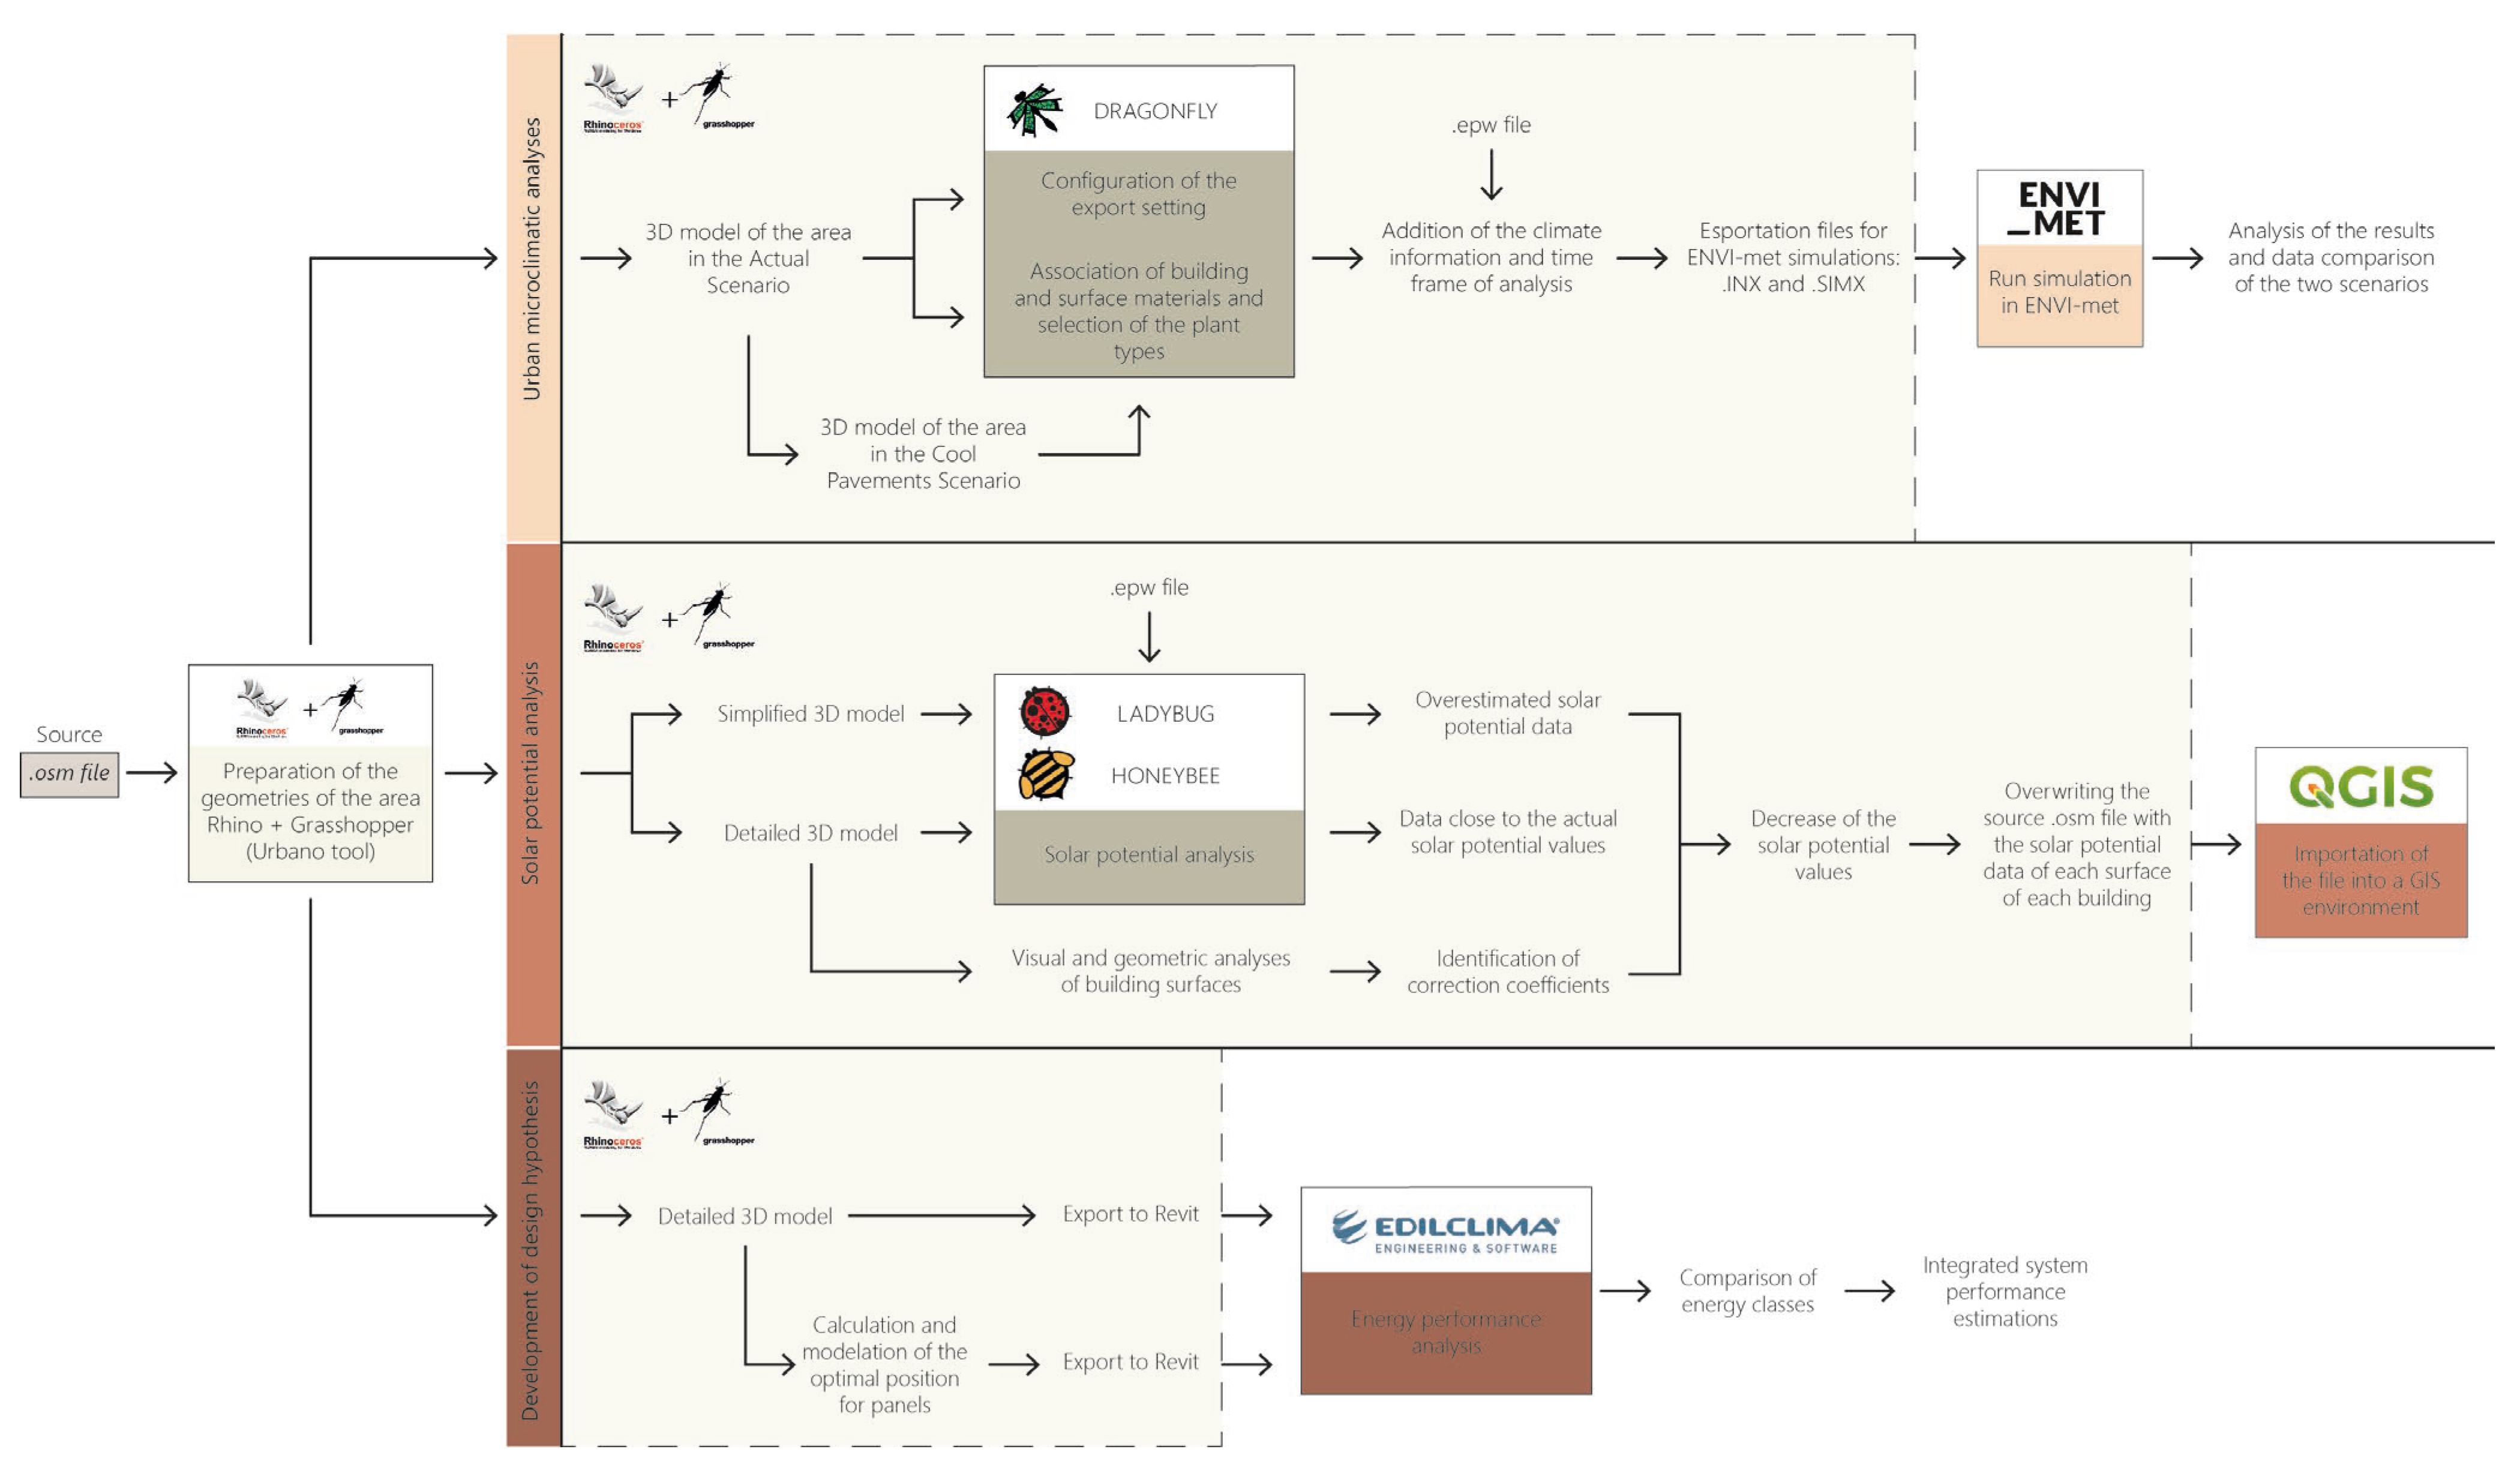
This study’s aims were to conduct an extensive analysis applied to a case study, examining it from various sustainability and efficiency aspects. To develop an effective methodology, this process was structured by following three different phases applied to a specific case study. The goal was to firstly gain a complete overview of the current situation and then hypothesize subsequent interventions. During the first phase of the process, it was essential to introduce the topic of the urban heat island phenomenon, highlighting the significant importance of mitigative interventions that could be implemented at the urban scale. These interventions were evaluated after conducting microclimatic analyses [
1]. The next step involved the detailed evaluation of studies on solar potential. This evaluation aimed to design interventions that can improve the energy response of entire urban areas [
2]. On the other hand, the last part involved an advanced design phase that considered the placement of photovoltaic panels on the facades of existing buildings. The three different phases required the use of various tools and software for internal implementation to achieve the desired results. Our study utilized the following software and procedures, and in the subsequent chapters, their functionality will be explained (
Figure 1).
The initial focus of this paper was to analyze the urban heat island (UHI) phenomenon by investigating both its causes and the various potential mitigation solutions [
3]. This phenomenon is specifically defined as a thermal anomaly that occurs in urbanized areas, where the temperatures inside the city are higher than those present in rural areas [
4]. It represents one of the most studied phenomena related to climate change and depends on five main parameters: the scarcity of green and permeable areas; the climate and weather conditions related to geographical location; the radiative and thermal properties of urban materials; the urban geometries; and the anthropogenic heat [
5,
6]. Among the most significant causes, there can be found alterations introduced by human intervention and land use. The transformation of existing soil and vegetation into impermeable surfaces, characterized by an increased density, promotes a buildup of heat caused by the reflection of incident solar radiation [
7,
8]. In this scenario, one of the most important functions of green areas inside urban environments is to screen solar radiation that is neither stored nor reflected, thereby reducing air temperature through evapotranspiration [
9]. This highlights the great importance of the presence of green areas and trees. During the summer period, the full extent of the UHI phenomenon is experienced, creating an uncomfortable microclimate in urban areas [
10]. The pavement absorbs solar radiation, stores the energy underground, and releases it through convection and infrared radiation to the surrounding environment at night, hindering cooling [
11]. There are several mitigation strategies for this phenomenon, and one of the most effective solutions, in addition to introducing greenery and water surfaces, is the replacement of existing pavements with cool pavements [
12,
13] (
Figure 2). These materials enable the maintenance of lower surface temperatures by absorbing and storing reduced amounts of solar radiation or enhancing water evaporation [
14,
15]. A combination of reflective and evaporative pavements can potentially improve human thermal comfort conditions, since lower air temperatures aid in mitigating the UHI effect [
16,
17].
With these assumptions, one of the primary purposes was to analyze the influence of the existing pavement materials on environmental and climatic conditions and their contribution to the generation of the urban heat island phenomenon. This analysis aimed to evaluate any potential benefits associated with the subsequent introduction of new pavements with more innovative characteristics, such as whitetopping, colored asphalt, permeable concrete, and permeable interlocking concrete blocks [
18].
2. Case Study Identification
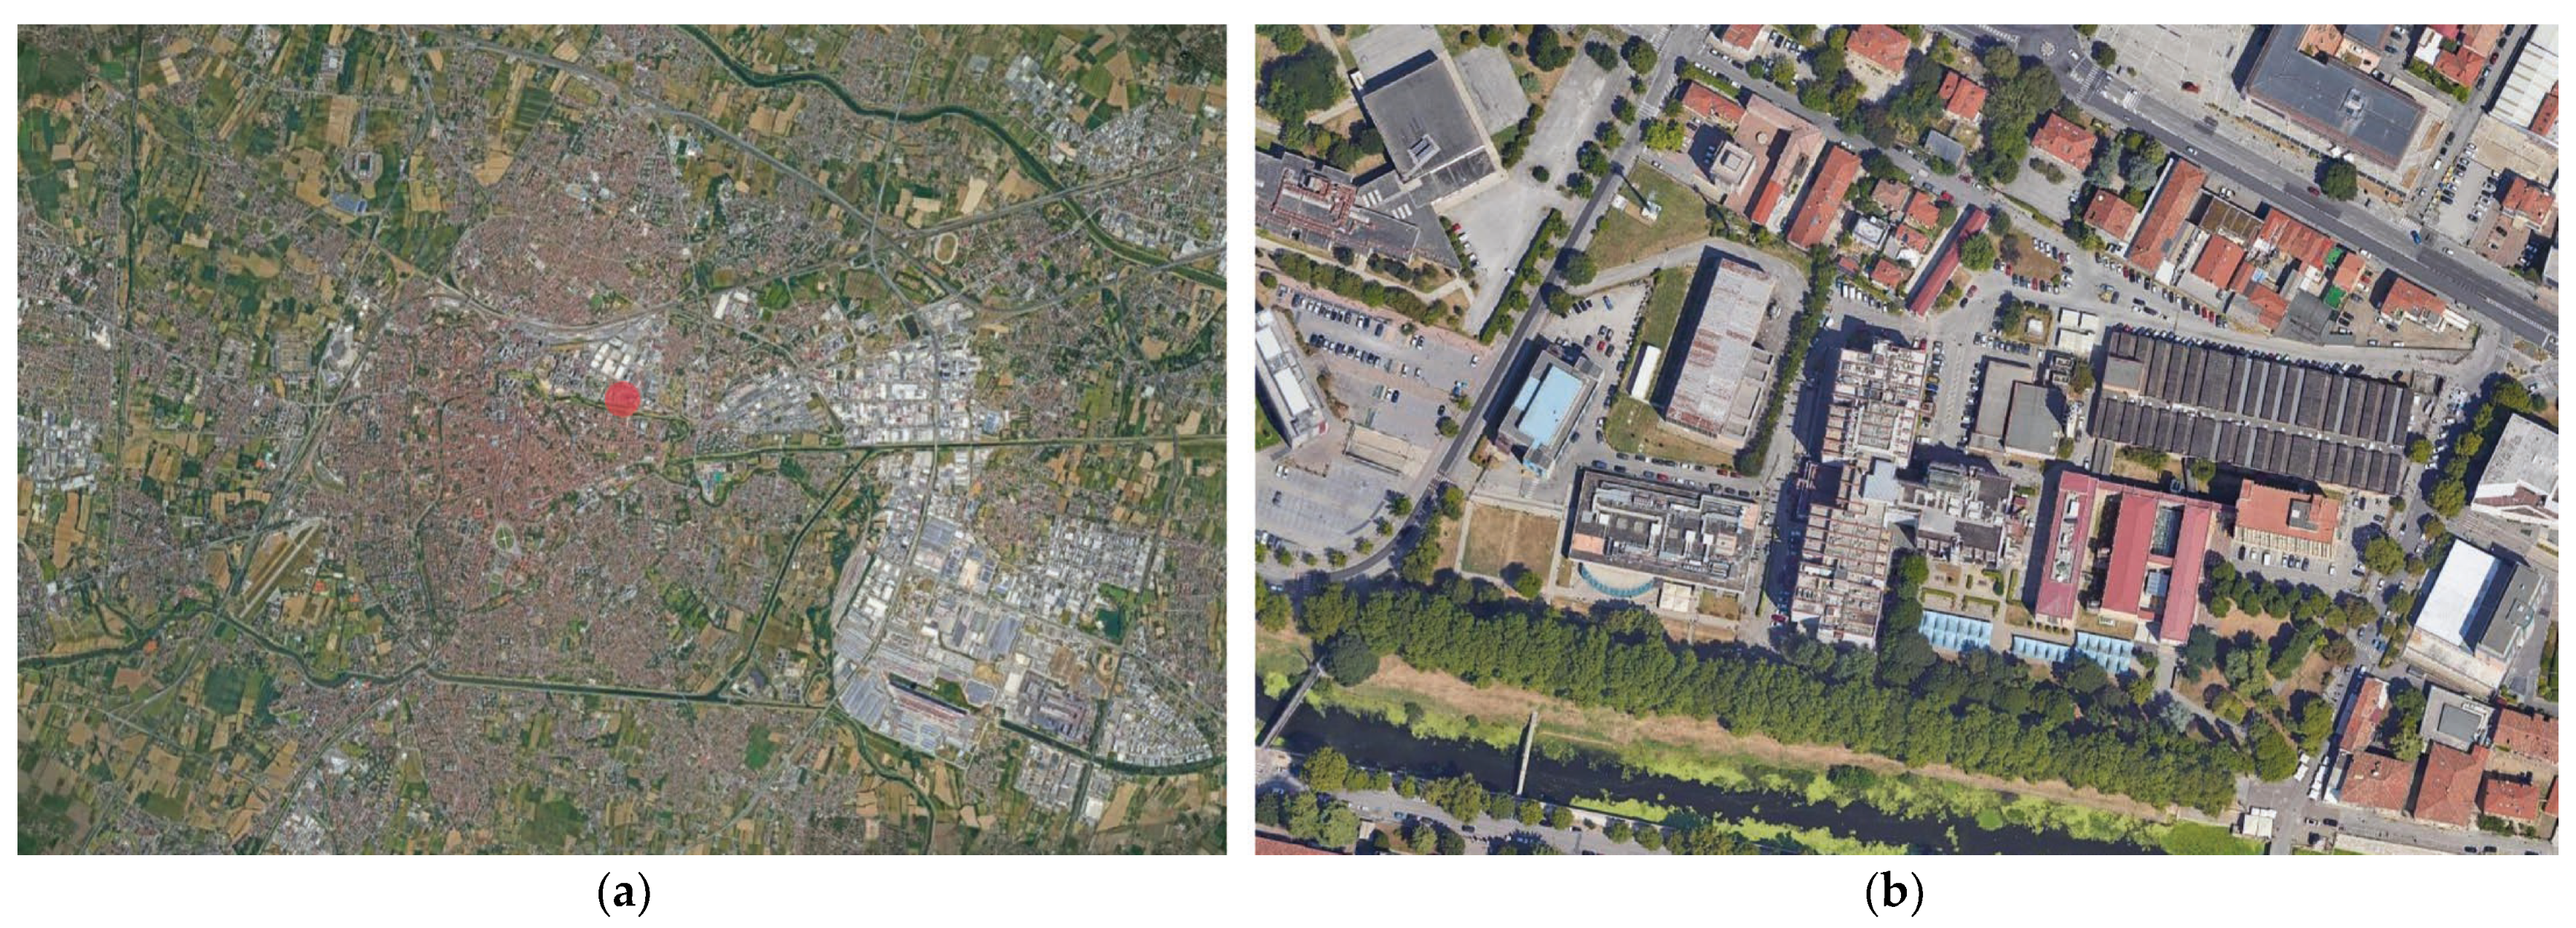
It was necessary to analyze, firstly, the main characteristics of the selected case study area, where the methodology was developed and tested. It is, specifically, the Piovego North University area (
Figure 3). It is located in Padua, a city in the Veneto region, in the northeast part of Italy.
Due to the phenomenon of global warming and climate change, temperatures are changing, altering climate maps, and bringing local temperatures and conditions closer to a climate characterized by heavy autumn rains and moderate summer drought, with very hot summers and warm winters [
19]. The selected area belongs to the University of Padua and covers a significant surface area of approximately 50.000 m
2. The area mainly consists of buildings used for student classrooms, laboratories, offices, and the university canteen, with outdoor spaces. To ensure reliable simulations of the initial condition, it is crucial to have a clear idea of the condition of the existing materials, collecting data regarding their composition, their wear degree, and their mutations compared to new material, as these are fundamental input data. Therefore, we directly conducted in situ extraction of eight core samples to later subject the existing materials to laboratory tests, analyzing their chemical composition and physical behavior. The core samples were extracted according to the different types of materials identified during a survey.
This area was chosen because it is representative and can reflect many characteristics of urban environments. This is a complex that has structural conformations that are quite common in the area, and in Italy in general, for agglomerates that serve the same function. This allows for comparable results for similar structures, and not only the study area.
Within the area, 76% of the surfaces resulted to be impermeable; 33% belonged to the building roofs, and 43% had conventional materials known for their heat retention properties, such as asphalt and concrete. The remaining 24% of the area was covered by green surfaces (
Figure 4). For the subsequent analyses, it is essential to highlight data on the extension of these green areas, including the specific location of trees and information about their main characteristics.
3. Microclimatic Analysis
After the surveying phase of the current conditions of urban surfaces and climate conditions, some large-scale microclimatic analyses were conducted to examine how different existing materials may affect surface and air temperatures, as well as perceived human thermal comfort [
20,
21]. For this purpose, a numerical model was built using ENVI-met software [
22], which allows for the simulation of various microclimatic scenarios. The software was chosen because it is based specifically on the calculation of both thermodynamic processes occurring at the ground surface, roofs, and walls of buildings, and fluid dynamic characteristics, including airflow and turbulence, allowing the simulation of the wind flow around structures and the determination of complex micro-scale thermal interactions within urban environments [
23,
24,
25,
26]. The microclimatic conditions were analyzed for July 24th, representing a typical hot condition in Padova.
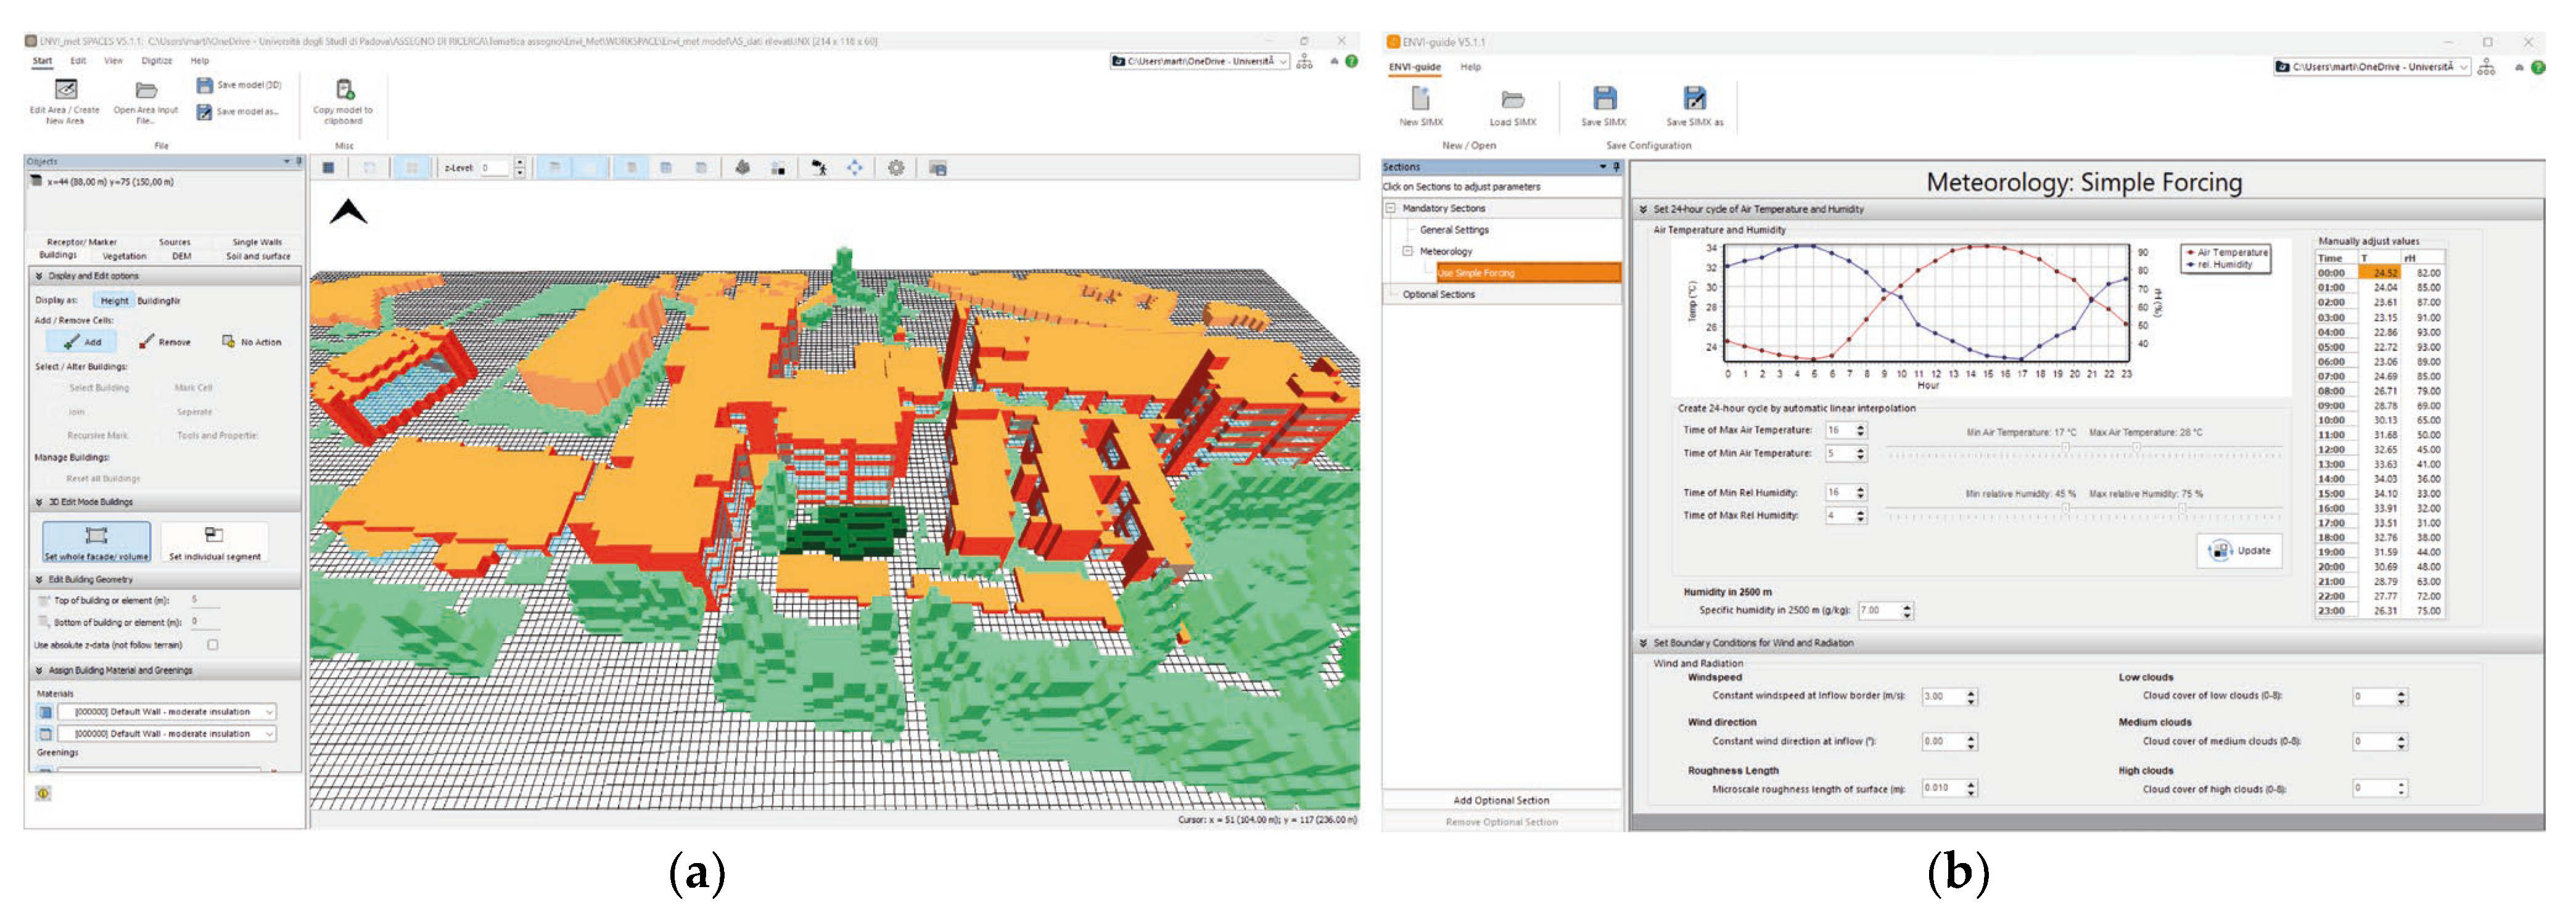
The procedure of the model creation, analyzed with ENVI-met, started from an .osm file of the target area. This specific file, directly exported from OpenStreetMap [
27], permits the creation of a 3D model based on spatial data, using mainly Grasshopper integrated with the Urbano tool. This initial file expedited the creation of a detailed model, where the building heights were adjusted, and the green and paved surfaces were subdivided according to the different typologies. Through the components of Dragonfly tool, it was then possible to assign appropriate materials from the ENVI-met library to all surfaces and volumes, which could be modified as needed. Dragonfly, in fact, permits the connection between the two different work environments, Grasshopper and ENVI-met. At this stage, the model was connected to an .epw file [
28], which represents a kind of database in which all the climatic information, measured by satellite sensing stations, is recorded for each station in the world. This file also includes georeferencing data for the model. This is a file that can be downloaded online from several collections by selecting the necessary reference station, and in the case described, the collection provided directly by Ladybug was used. After connecting the 3D model with the climate information belonging to the actual location of the area, the exportation of a readable model for the simulation environment resulted in two files. The first one contains the purely geometric and physical information of the model, in .INX format, and a second file contains all the climatic and environmental information selected for the analysis (
Figure 5).
These two files were of fundamental importance for the subsequent simulations conducted using the ENVI-met software. In the first image (
Figure 5a), the model is read in the Space section, and in the picture beside it (
Figure 5b), the data are read in the ENVI-guide section of the software. Using the ENVI-core section represents the following step. This, in fact, permits the integration of the two previous parts described, analyzing each voxel of the model together with the integrated information.
The key findings from the simulations are summarized as follows. Two simulation scenarios were performed: the first corresponded to the actual situation in the area (AS), whereas the second involved the replacement of pavements to mitigate their thermal response to the local climatic conditions (CPS).
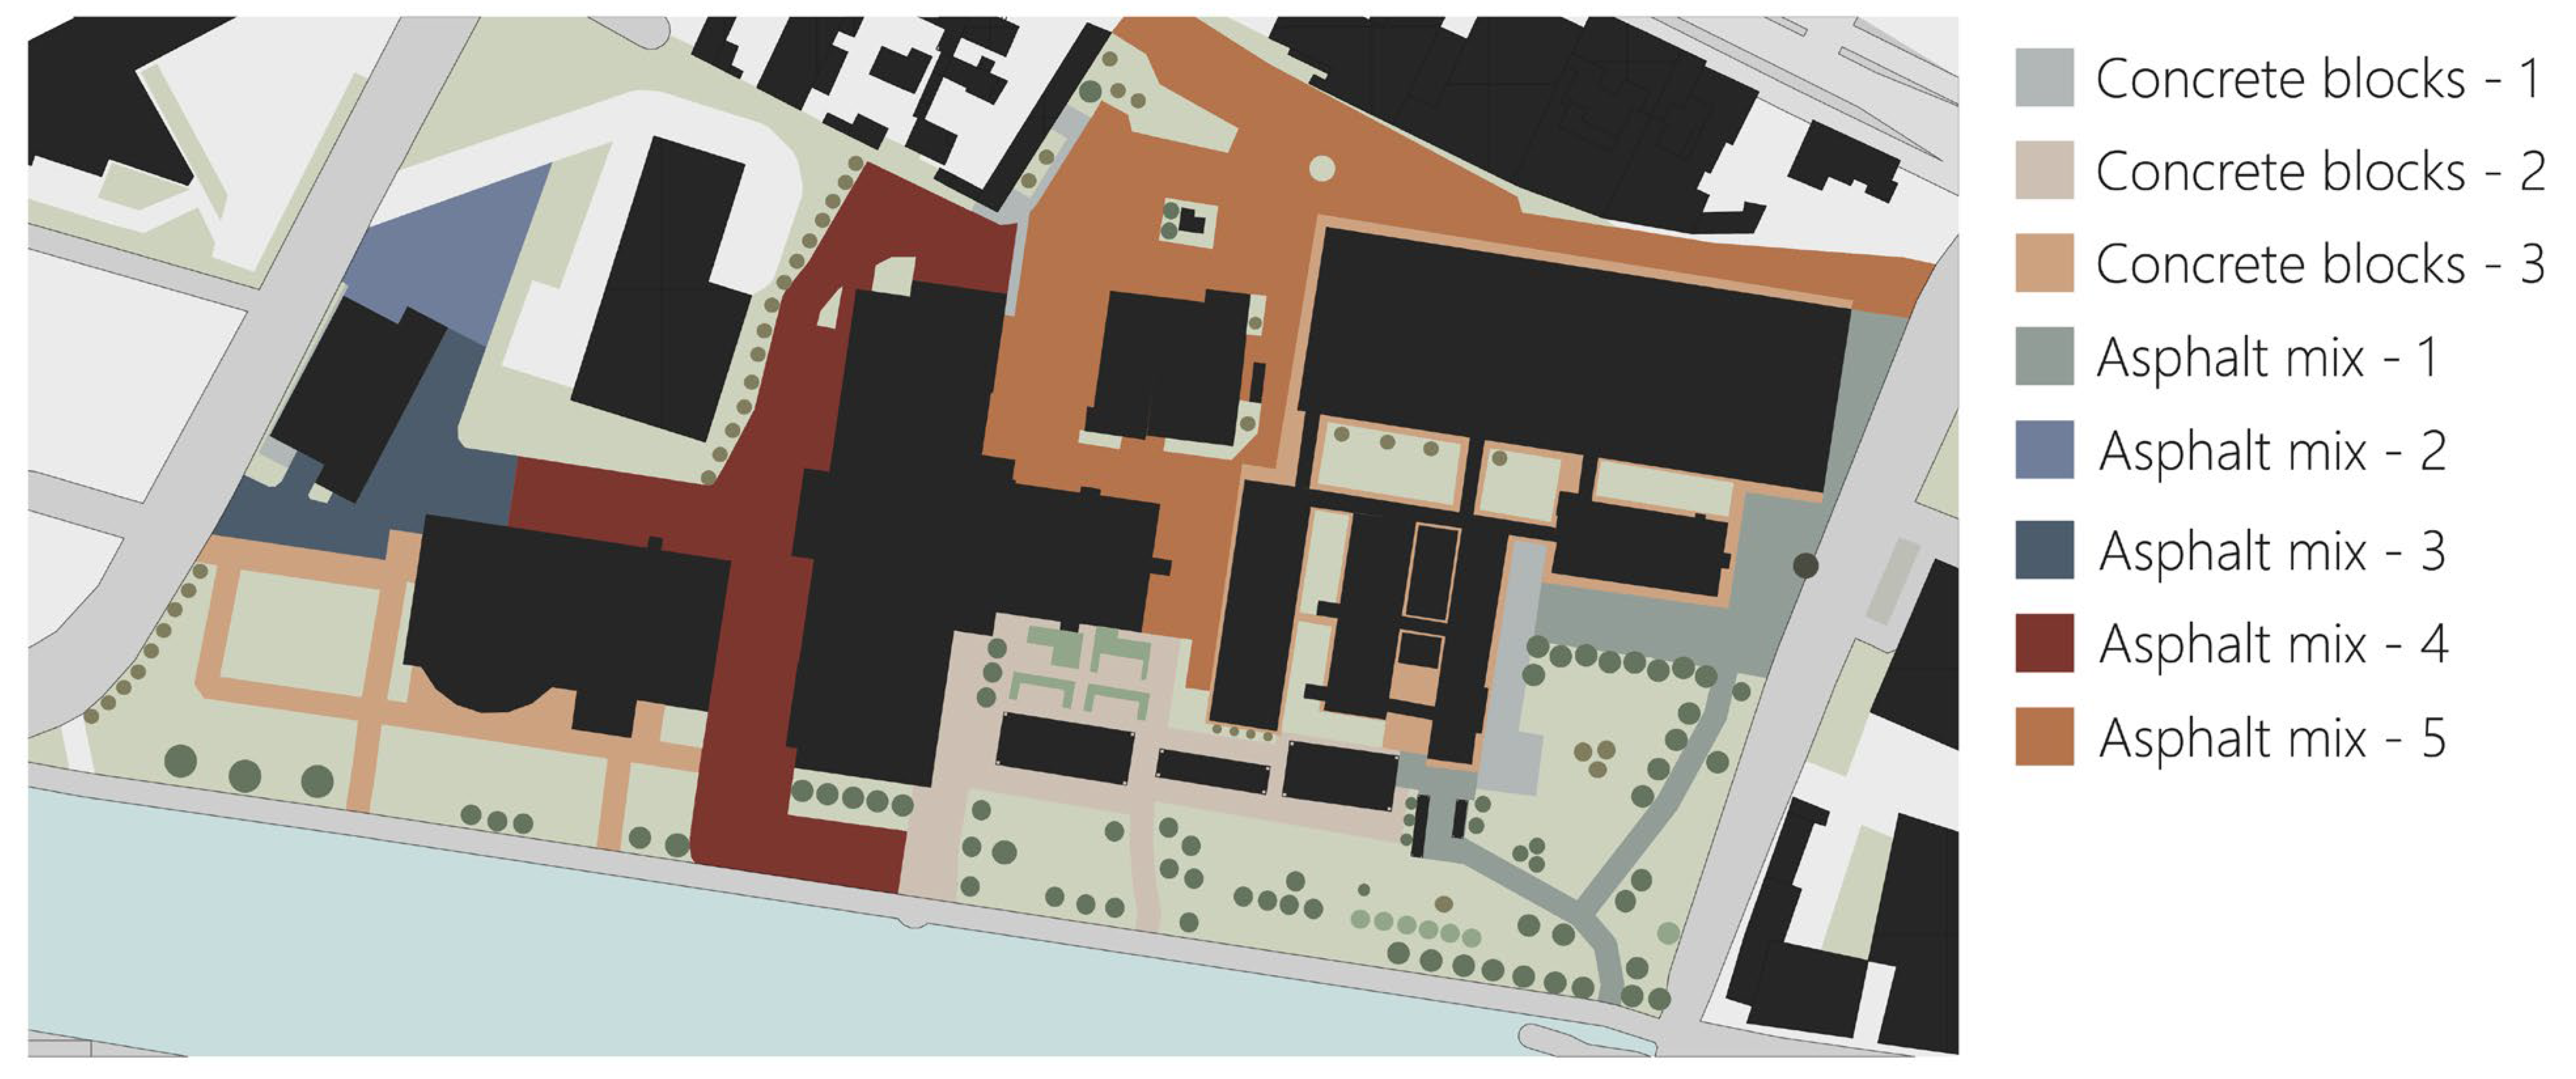
The first scenario highlighted the impact of pavements on generating the urban heat island effect, allowing the visualization of peaks in surface and air temperatures reached especially during the hottest hours of summer days. This permitted the identification of the areas where pavement replacement interventions would be most beneficial. After these analyses were related to the actual state of the area, the replacement of these pavements with cool materials was considered. The total area subject to redevelopment is approximately 19.740 m
2, with 11.890 m
2 proposed to be redeveloped using reflective materials, and the remaining are assumed to be transformed into permeable surfaces [
29]. The main materials utilized in this process include whitetopping, colored asphalt, permeable concrete, and permeable interlocking concrete blocks [
30,
31,
32,
33] (
Figure 6).
Following the design phase of the new pavements, it was necessary to create a new simulation scenario to compare it with the initial scenario and assess its effectiveness [
34]. The Leonardo section of Envi-met was used to generate, in a subsequent phase, comparison scenarios that considered the differences between the conditions before and after the requalification interventions. This type of comparison was possible with various analyzed parameters. These parameters could include surface temperature, air temperature, thermal comfort indices, or other relevant factors.
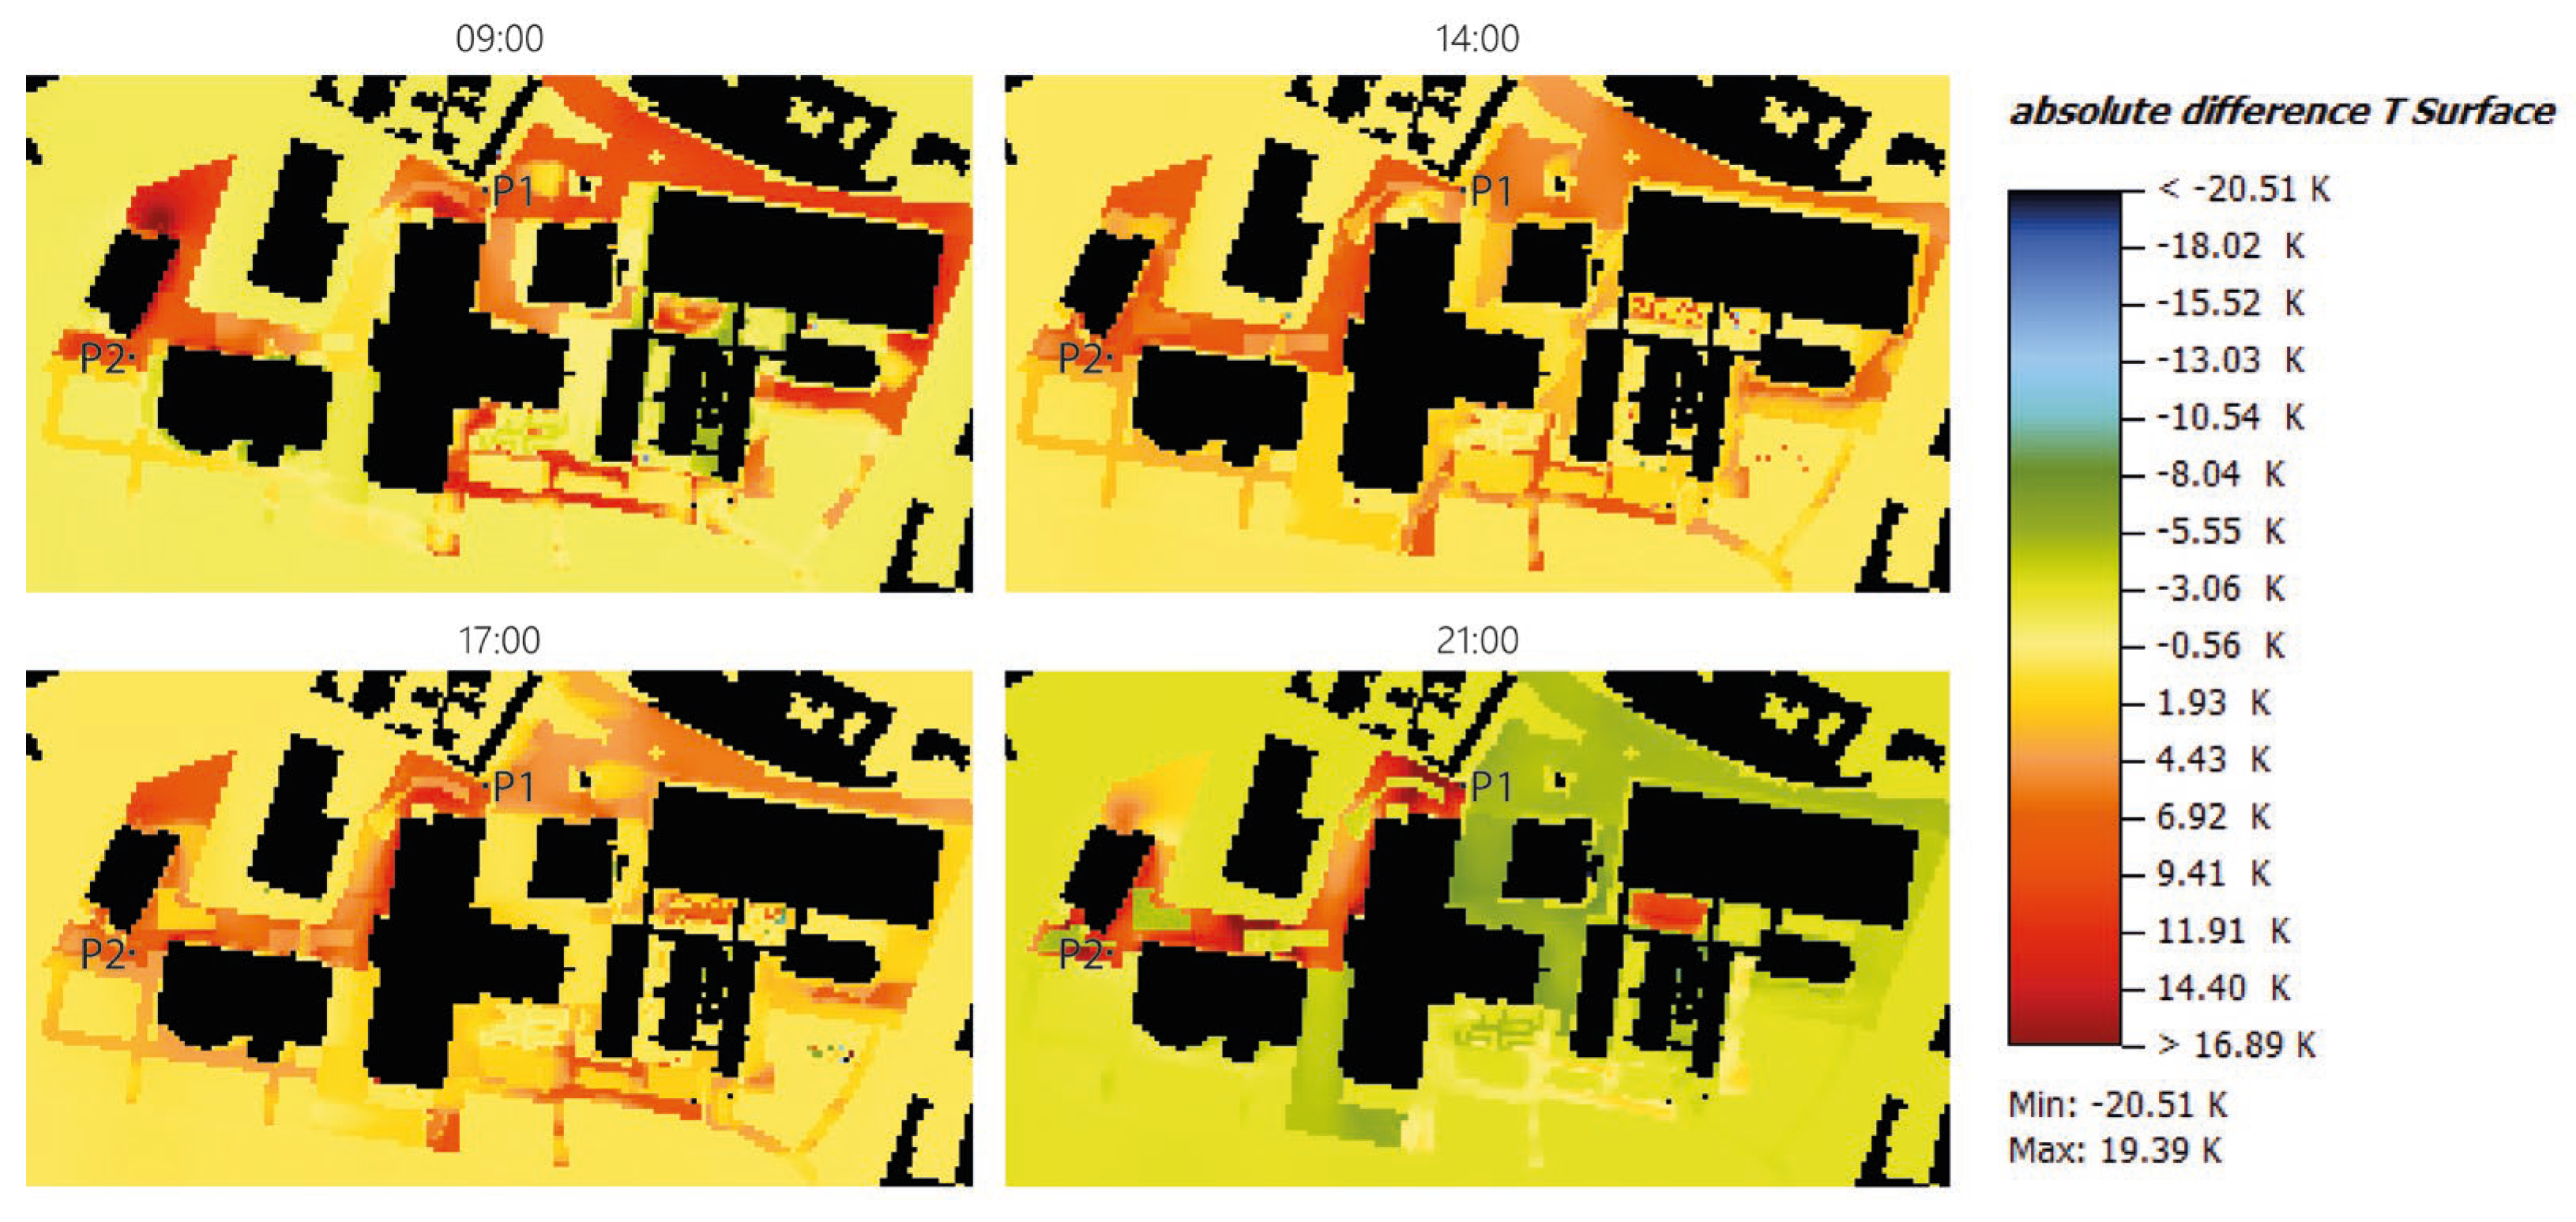
The second simulation scenario resulted in an overall decrease in surface temperature across the entire case study area, and the application of whitetopping provided the most significant cooling effect. The following graphical representations were produced comparing the results of the two scenarios (
Figure 7). These visualizations helped the identification of the areas where the replacement of pavements provided the greatest benefits.
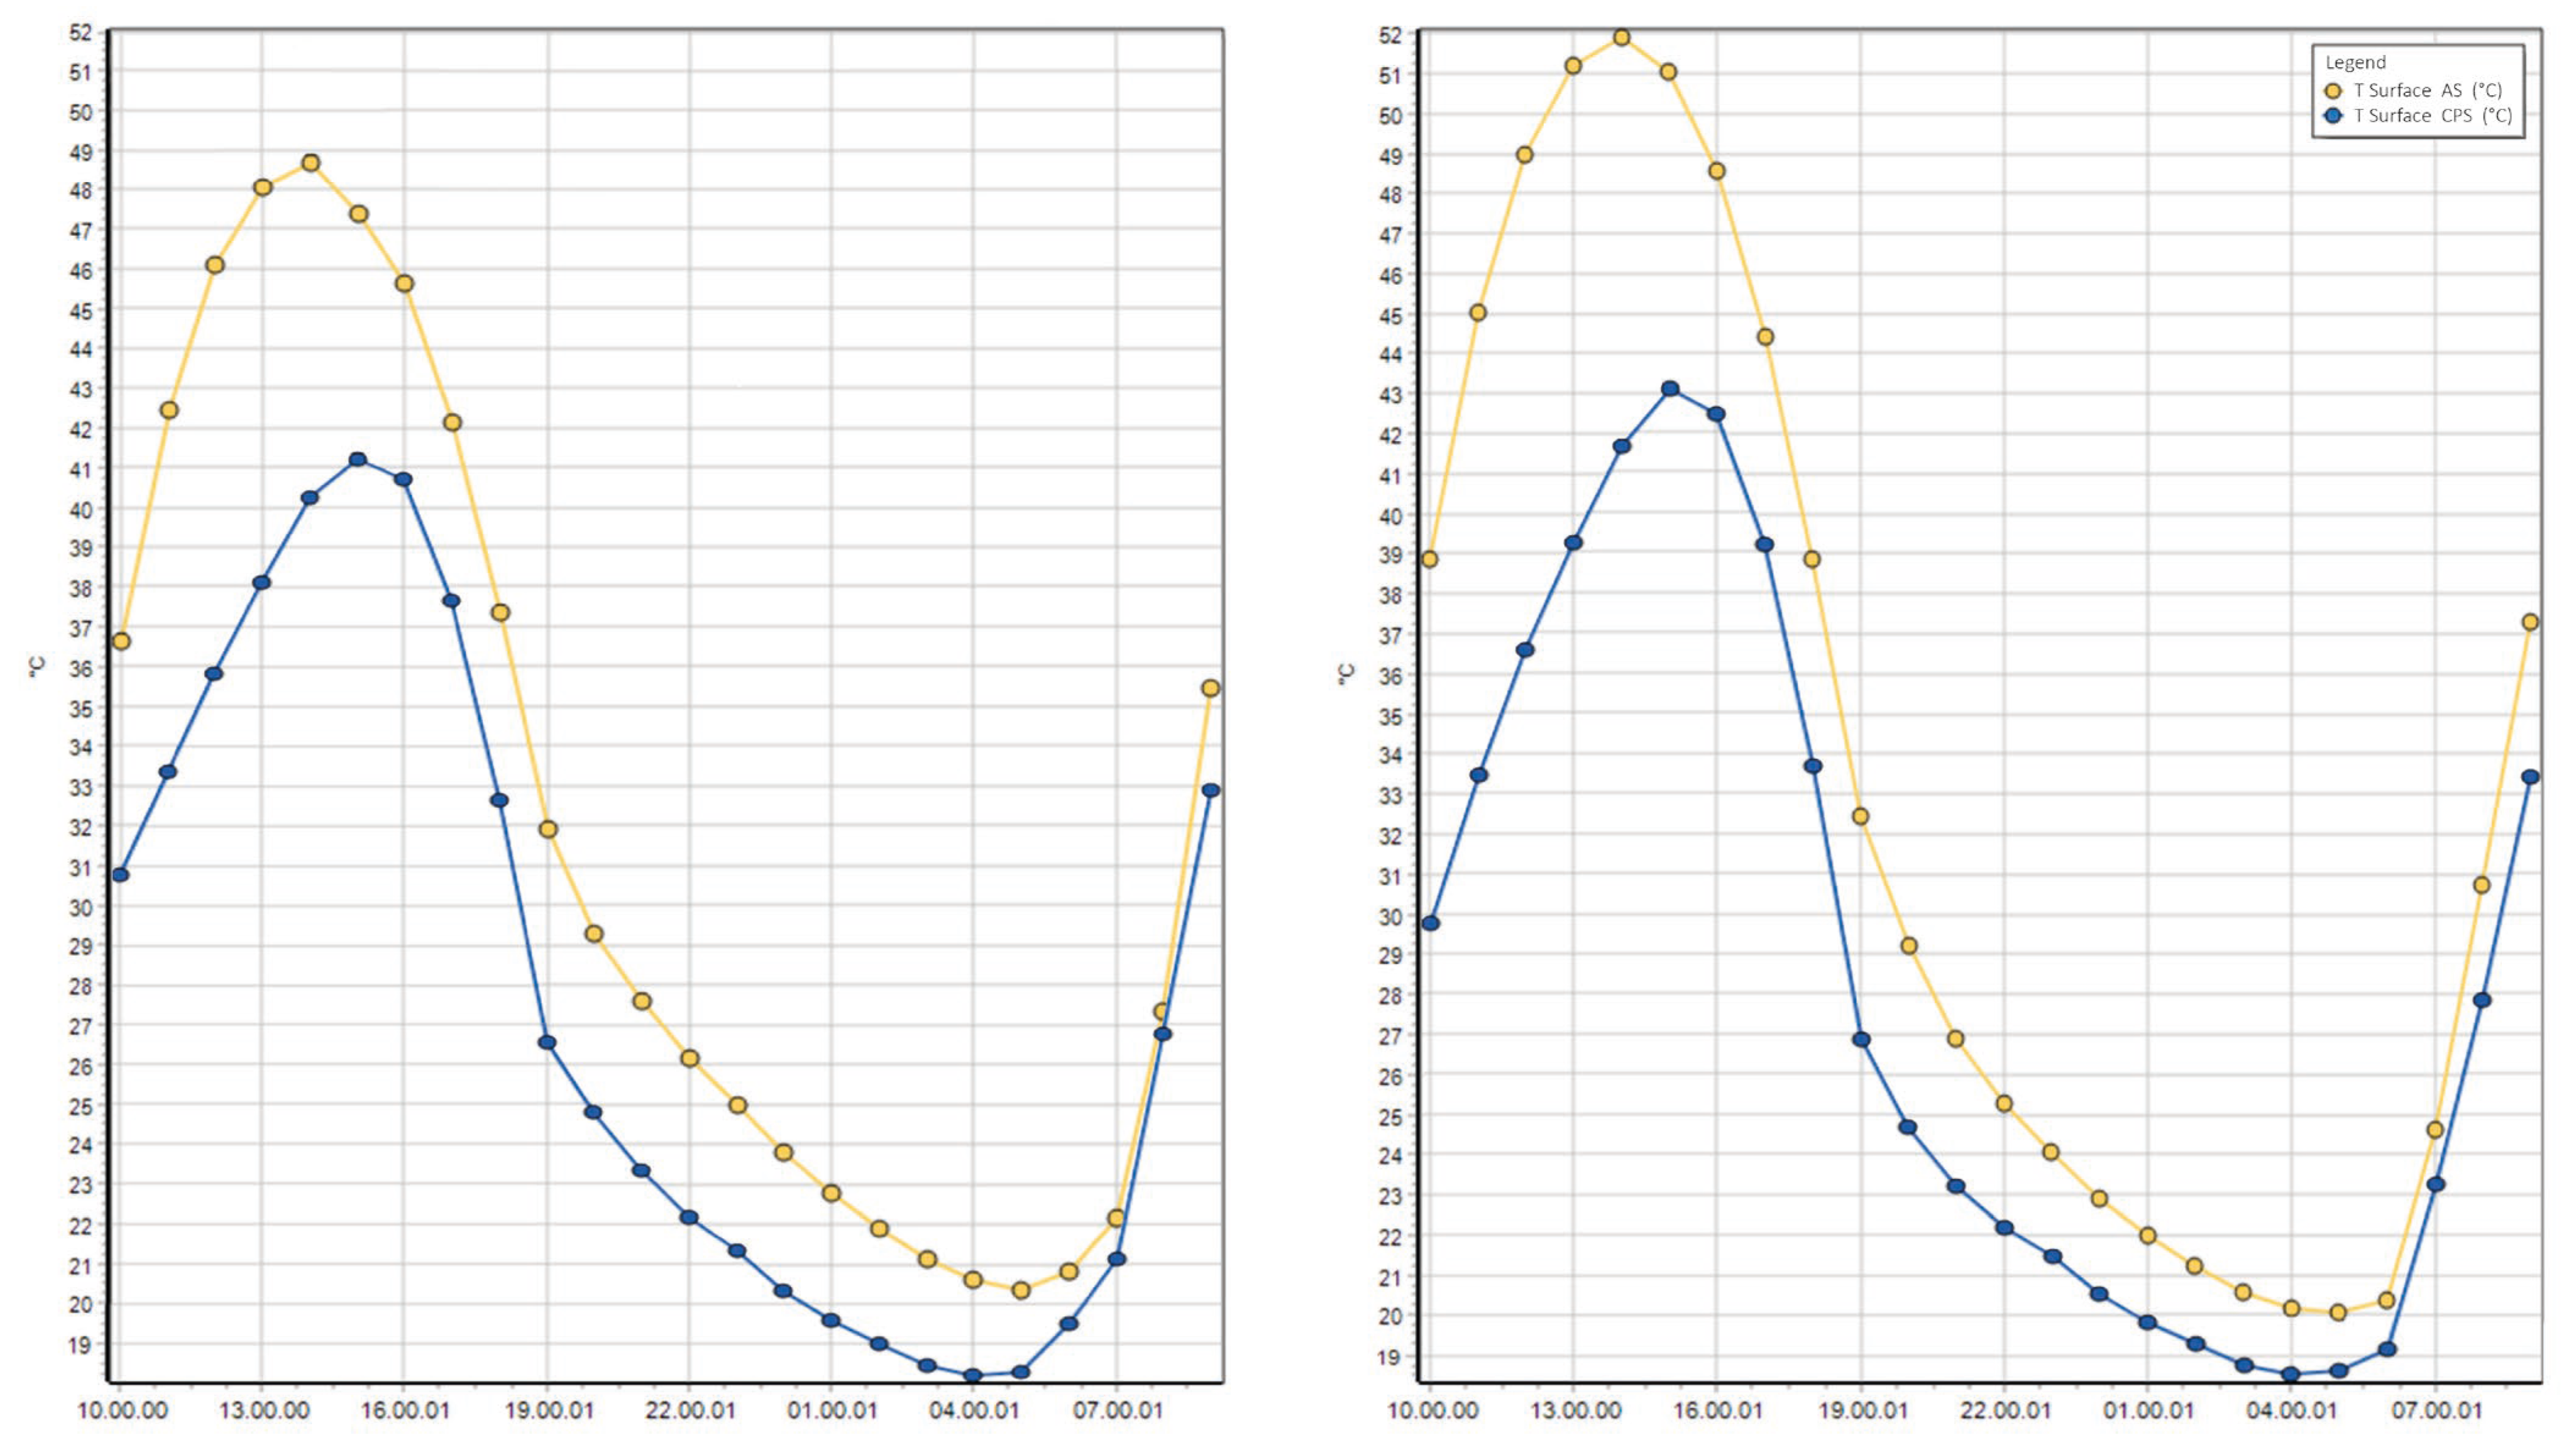
Through the analysis of two specific points within the area (P1 and P2), it was possible to realize some more detailed temperature analyses to observe the trends over the course of a whole day (
Figure 8). Specifically, it was possible to highlight that during the hottest hours, between 12:00 and 16:00, the results revealed significant temperature differences, with variations ranging from 7.5 °C to 9 °C during peak hours. Even during the remaining hours of the day, although the temperature differences were lower, improvements were still observed overall. These findings demonstrated the effectiveness of pavement replacement interventions in mitigating high temperatures and improving thermal conditions within the studied area.
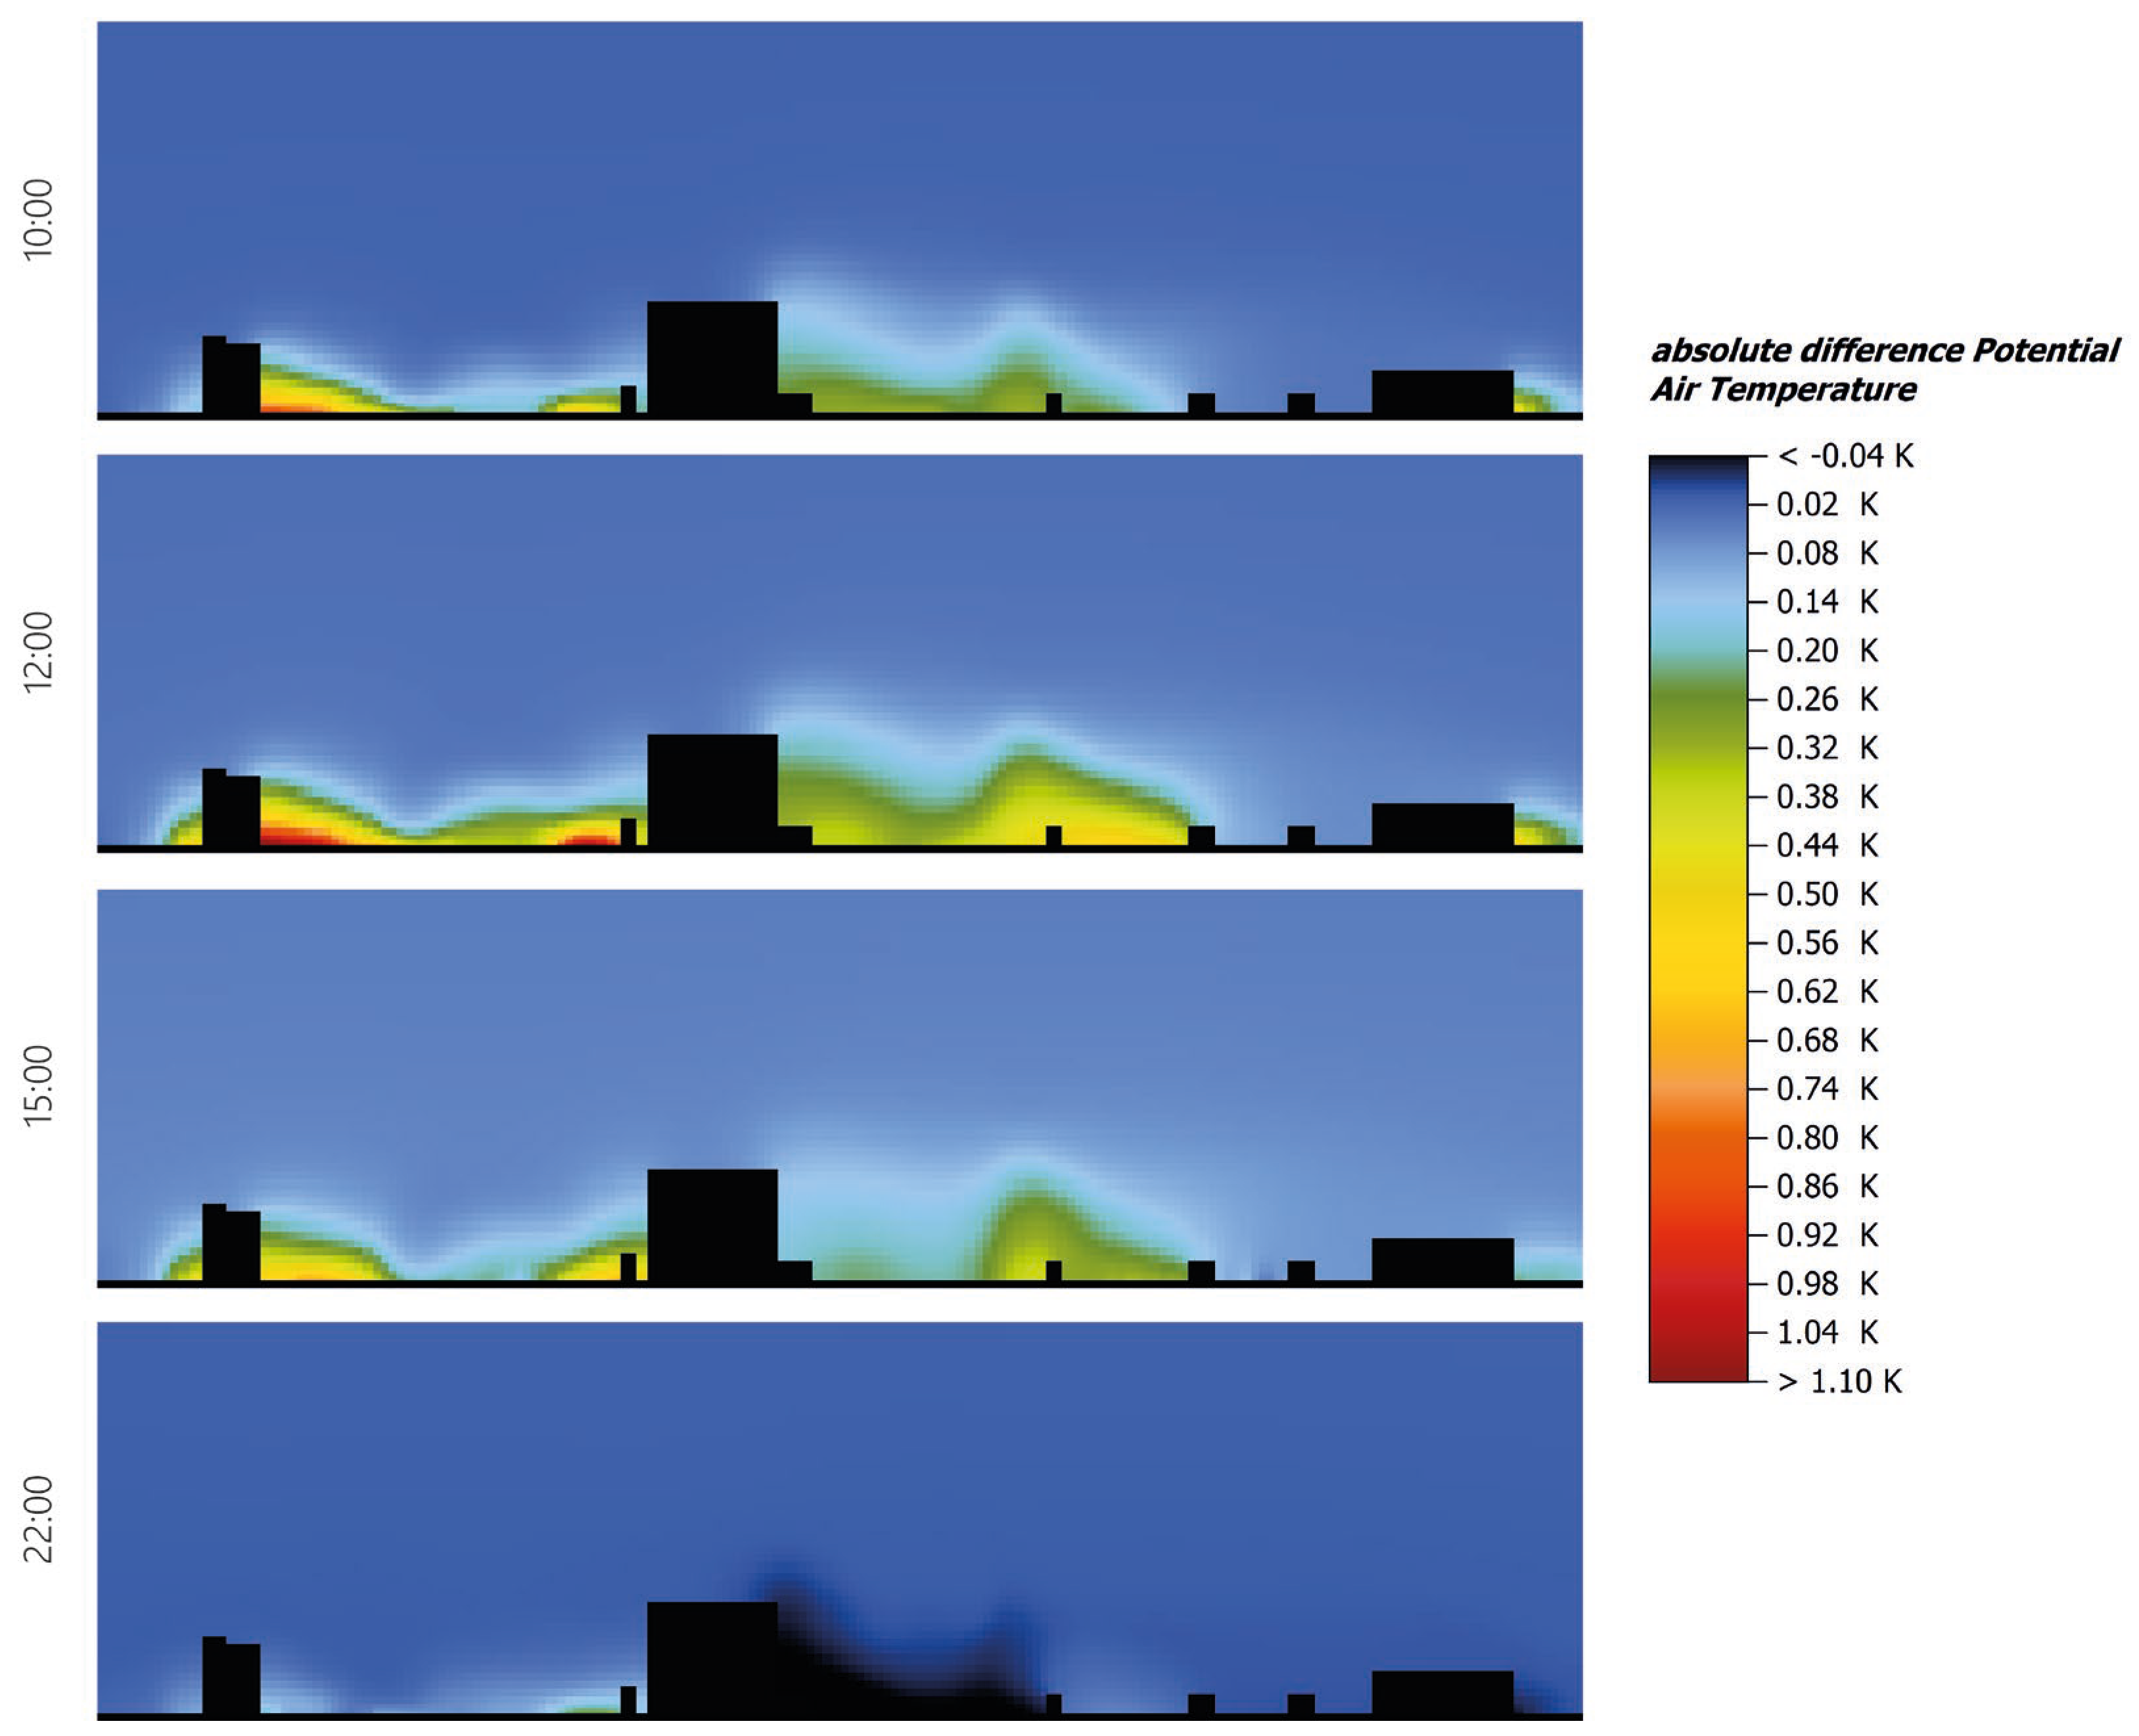
The changes in the outdoor environment not only affected surface temperatures but also had an impact on air temperatures [
35]. The alterations in reflection phenomena caused variations in heat exchange between surfaces, which consequently influenced the convective transfer of heat from the ground to the air. As a result, the cooling effect resulting from lower surface temperatures led to a decrease in atmospheric temperature. Analyzing the trends in air temperature in the section, the most significant differences between the two scenarios were observed during the hottest hours. The storage of thermal heat near buildings played a significant role in this context. The data obtained demonstrated the benefits derived from the replacement of materials in terms of reducing air temperatures (
Figure 9). The analysis highlighted the positive impact of pavement replacement interventions on the overall thermal conditions of the outdoor environment, particularly during the peak hours of heat.
4. Solar Potential Study
The next step in the study involved the extension of the analyses to assess the solar potential on a large scale, while also considering the transferability of the obtained data to the urban scale. This required the development of a methodology that combines solar potential simulation data with spatial data management in a GIS environment [
36,
37,
38].
By utilizing a 3D model, it is possible to gather, through tools for Grasshopper such as Ladybug and Honeybee, data on the solar potential of various surfaces, volumes, and buildings [
39]. However, one challenge with this relatively straightforward procedure concerns the fact that the resulting data are significantly influenced by the type and level of detail of the model used [
40]. If the model is oversimplified, the data obtained, in turn, will also be limited in their accuracy. On the other hand, when analyzing extensive areas of cities, it is not feasible to incorporate a high level of detail into the model [
41]. Striking the right balance between model complexity and practicality is crucial to obtaining reliable results.
4.1. Simplified Solar Potential Value Moderation
The first procedure developed focuses on obtaining reliable data compared to the real situation, calculating the solar potential using a simplified model. In this regard, a methodology was developed that can take into account the data obtained through simulations, supplementing the results with some corrective coefficients in order to make the data as close as possible to reality. This is necessary because each building has particular characteristics due to the presence of windows, balconies, shading, particular exterior overhangs, and canopies. These factors affect both the area available for the installation of new photovoltaic systems and their efficiency [
42]. These specific conditions are not considered at all by analyzing the solar potential using a simplified model. This could be obtained from a spatial database and generated with scripts using, for example, the Urbano tool, starting from an .osm file (
Figure 10). The comparison between the simplified and actual situation highlighted a substantial difference.
To avoid the problem related to the extreme simplification of the data, the proposed strategy was to find some correction coefficients that, when multiplied with the simplified input, can return a result very close to the solar potential calculated in a detailed model [
43]. The formulated equation establishes a correlation between the real solar potential (
SPs) and the simplified solar potential (
SPr). It takes into account the percentage of opaque surface area (%
oparea) as well as a previously calculated transformation coefficient (
TCoeff), as described in a paper co-published by the research group of the ICEA department of the University of Padua, coordinated by Professor Rossana Paparella [
44]:
The process of calculation of these indices involved visual and geometric surveys to evaluate the properties of the various surfaces and areas available [
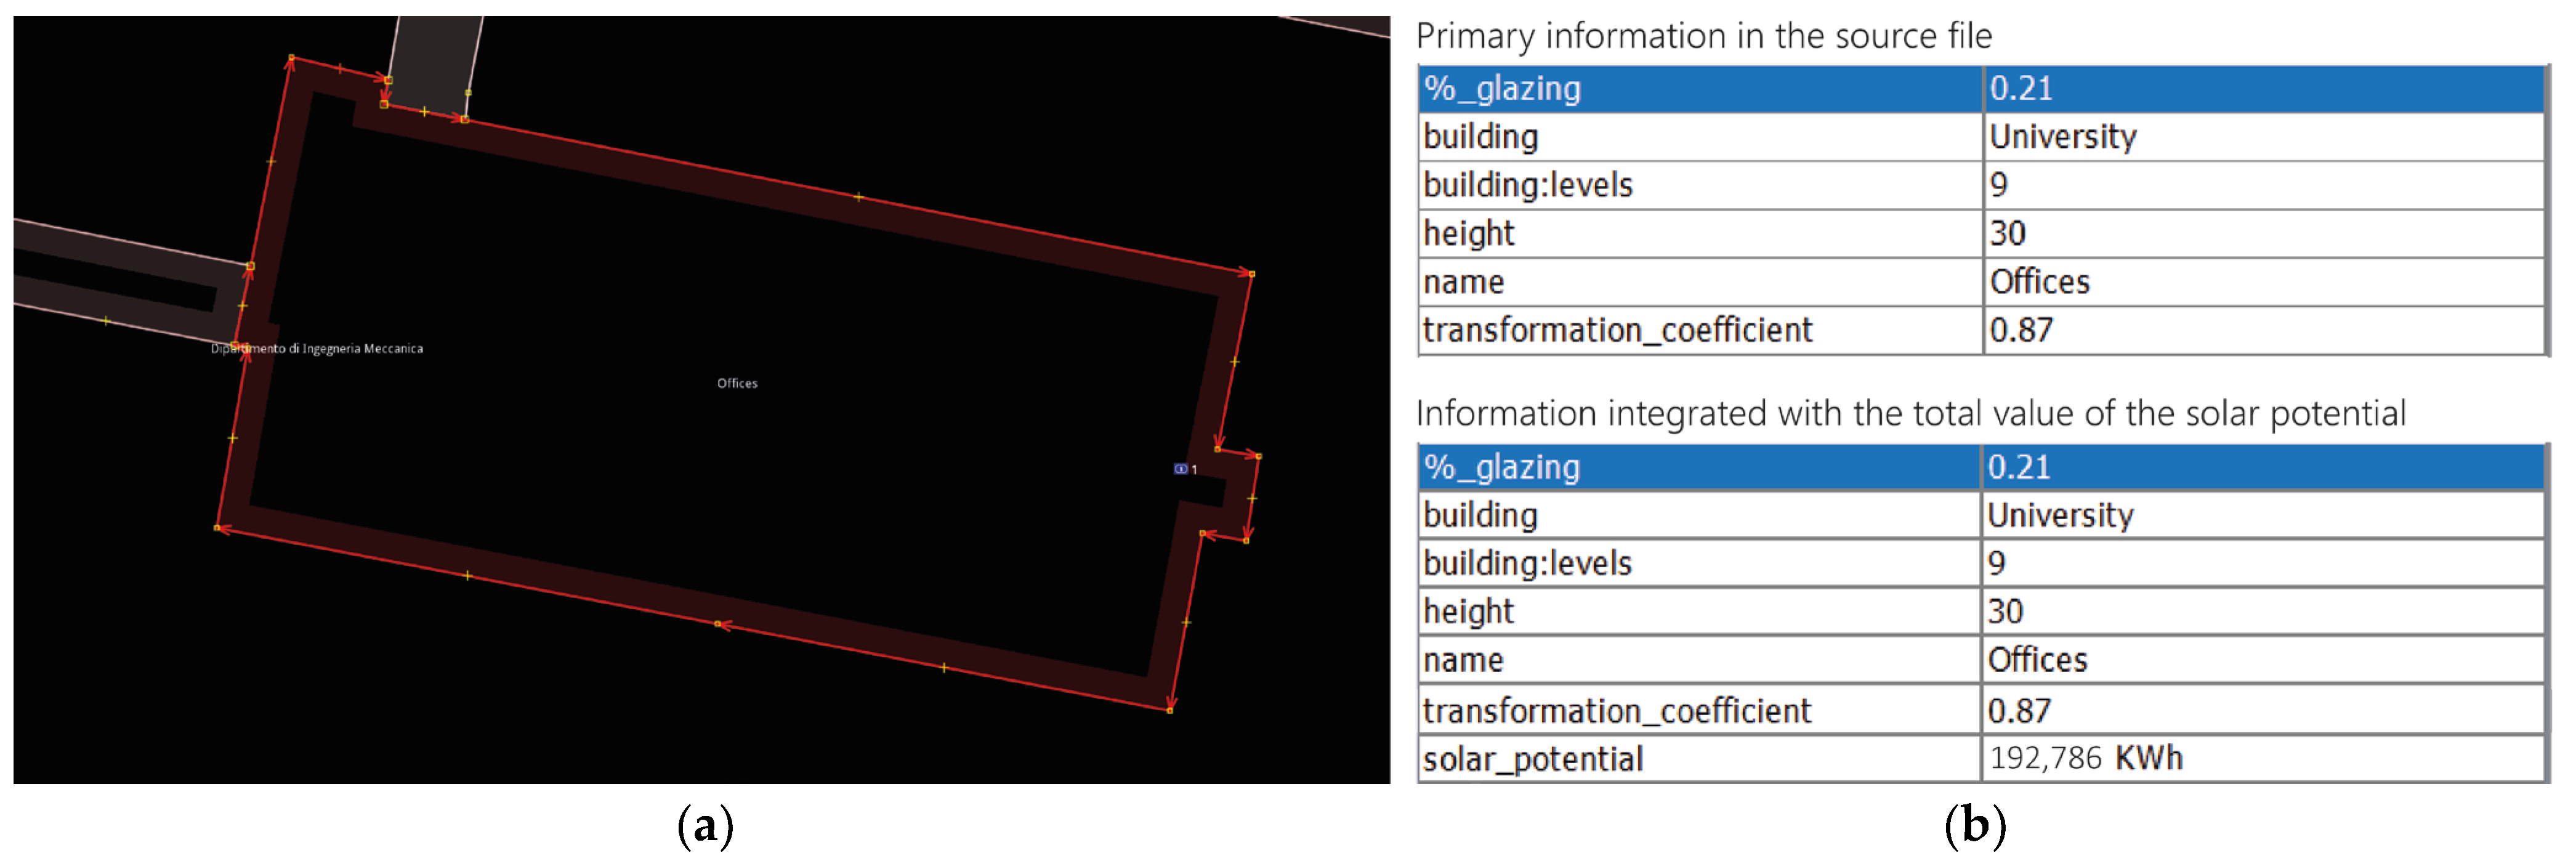
45]. This process had certain limitations, as it was neither immediate nor rapid. However, advancements in technology such as the use of drones and photogrammetry could potentially streamline and expedite the process. In reference to the mentioned case study, two particular buildings were chosen to test this methodology. They comprise an office building and another one with laboratories, situated adjacent to the first one on the east side of the intervention area. For each building, the necessary values for calculating and defining the transformation coefficient were determined for each facade. These values included the total surface area, the area occupied by windows (glazed surface), and the area occupied by solid walls (opaque surface). By considering these parameters, the percentages of glazed and opaque areas for each facade were determined. Additionally, the solar potential was calculated for both the application of a simplified model and a more detailed model, allowing for a comparison of results (
Figure 11).
To ensure consistency in the data, an arithmetic average was calculated based on the geometric values obtained. This averaging process aimed to harmonize the different conformational characteristics of the surfaces, taking into account their varying degrees of restrictiveness. Once the transformation coefficient was determined, it was incorporated into the calculation of the simplified solar potential, within the Grasshopper script. This adjustment enabled the generation of more accurate data that reflected the actual characteristics of the buildings. By comparing these adjusted results with the detailed solar potential data obtained for the two selected buildings, the accuracy and reliability of the output could be evaluated.
4.2. Connection between Spatial Data and Solar Potential Values
In the second part of the methodology, the focus was on making the solar potential data applicable and usable at the urban scale [
46]. The aim was, therefore, to integrate the calculated solar potential values for each surface area of every building with the basic information provided in a source .osm file [
47]. To achieve this, a code was developed in Grasshopper that allowed the grouping of the solar potential values for each building. The compiled list containing all the calculated values for each building was created. Subsequently, these data were integrated into the source .osm file, which served as the base for the urban model (
Figure 12). This integration process facilitated the incorporation of solar potential information into the overall urban analysis database.
In order to have a single data value that could be easily read and utilized in other software, the calculated solar potential values for each building were summed up. This sum was then used to overwrite the source .osm file, which was enriched with the new simulated solar potential information for each building. This enabled the export of the information to various spatial data processing software, such as Qgis [
48] (
Figure 13). The significance of this process lies in the creation of a sort of solar cadaster, where data on the solar potential of all buildings are consolidated into a single database. This database format ensures that the solar potential information is accessible and readable for various stakeholders, including individual building owners and public administrations involved in urban planning and energy management.
5. Active and Passive Building Interventions
In the final phase of the study, to further develop the methodology and design an energy requalification project, a specific building within the study area was chosen. The selection aimed to allow for more comprehensive considerations, particularly in terms of implementable solar active solutions. Among the buildings in the study area, the office building was chosen for further analysis.
To begin the energy requalification project, a detailed energy diagnosis of the office building was conducted using EDILCLIMA—EC720 software [
49]. This software was chosen because it could bring results about the energy diagnosis of the buildings. In this case, the building’s energy performance class was very low, highlighting the need for energy improvements/requalification measures to enhance energy efficiency (
Figure 14).
The value of the building’s overall non-renewable energy performance index, representing the annual non-renewable primary energy requirement for all provided services by the technical systems, amounts to 249.08 kWh/m2 annually. The building’s energy performance, which represents the qualitative index of the energy requirements to maintain internal comfort, indicates how effectively the building thermally insulates the internal environments in both summer and winter compared to the outside. In this case, the energy performance class was determined to be low for both seasons, indicating a need for energy improvement measures.
Additionally, in this case, the main geometric parameters were calculated, with a focus on identifying the usable area for installing new systems. The facade has a distinct configuration due to the presence of pilasters, which create shading on the adjacent surfaces, which are positioned on a recessed plane. The building, dating back to the 1960s–70s, possesses the following characteristics:
- -
Eight floors above ground with reinforced concrete frames and floors;
- -
Flat tiled roof (absent in a section of the roof given by a protruding body);
- -
Facades characterized by external reinforced concrete walls without plaster with variable sections, and with pilasters characterized by a marked vertical trend; among these, the presence of single-glazed iron windows and glass doors on the ground floor can be highlighted;
- -
Three lifts, with the capacity for four people.
Based on the analyses and simulations conducted in the previous phases, several regenerative interventions were designed to improve the energy performance of the office building. These interventions include the following:
External Envelope: The introduction of an external envelope involves adding a layer of 120 mm thick rock wool insulation. Around the pilasters, the insulation thickness is reduced to 60 mm.
Windows and Doors Replacement: The existing windows and doors will be replaced to enhance thermal performance and reduce heat loss.
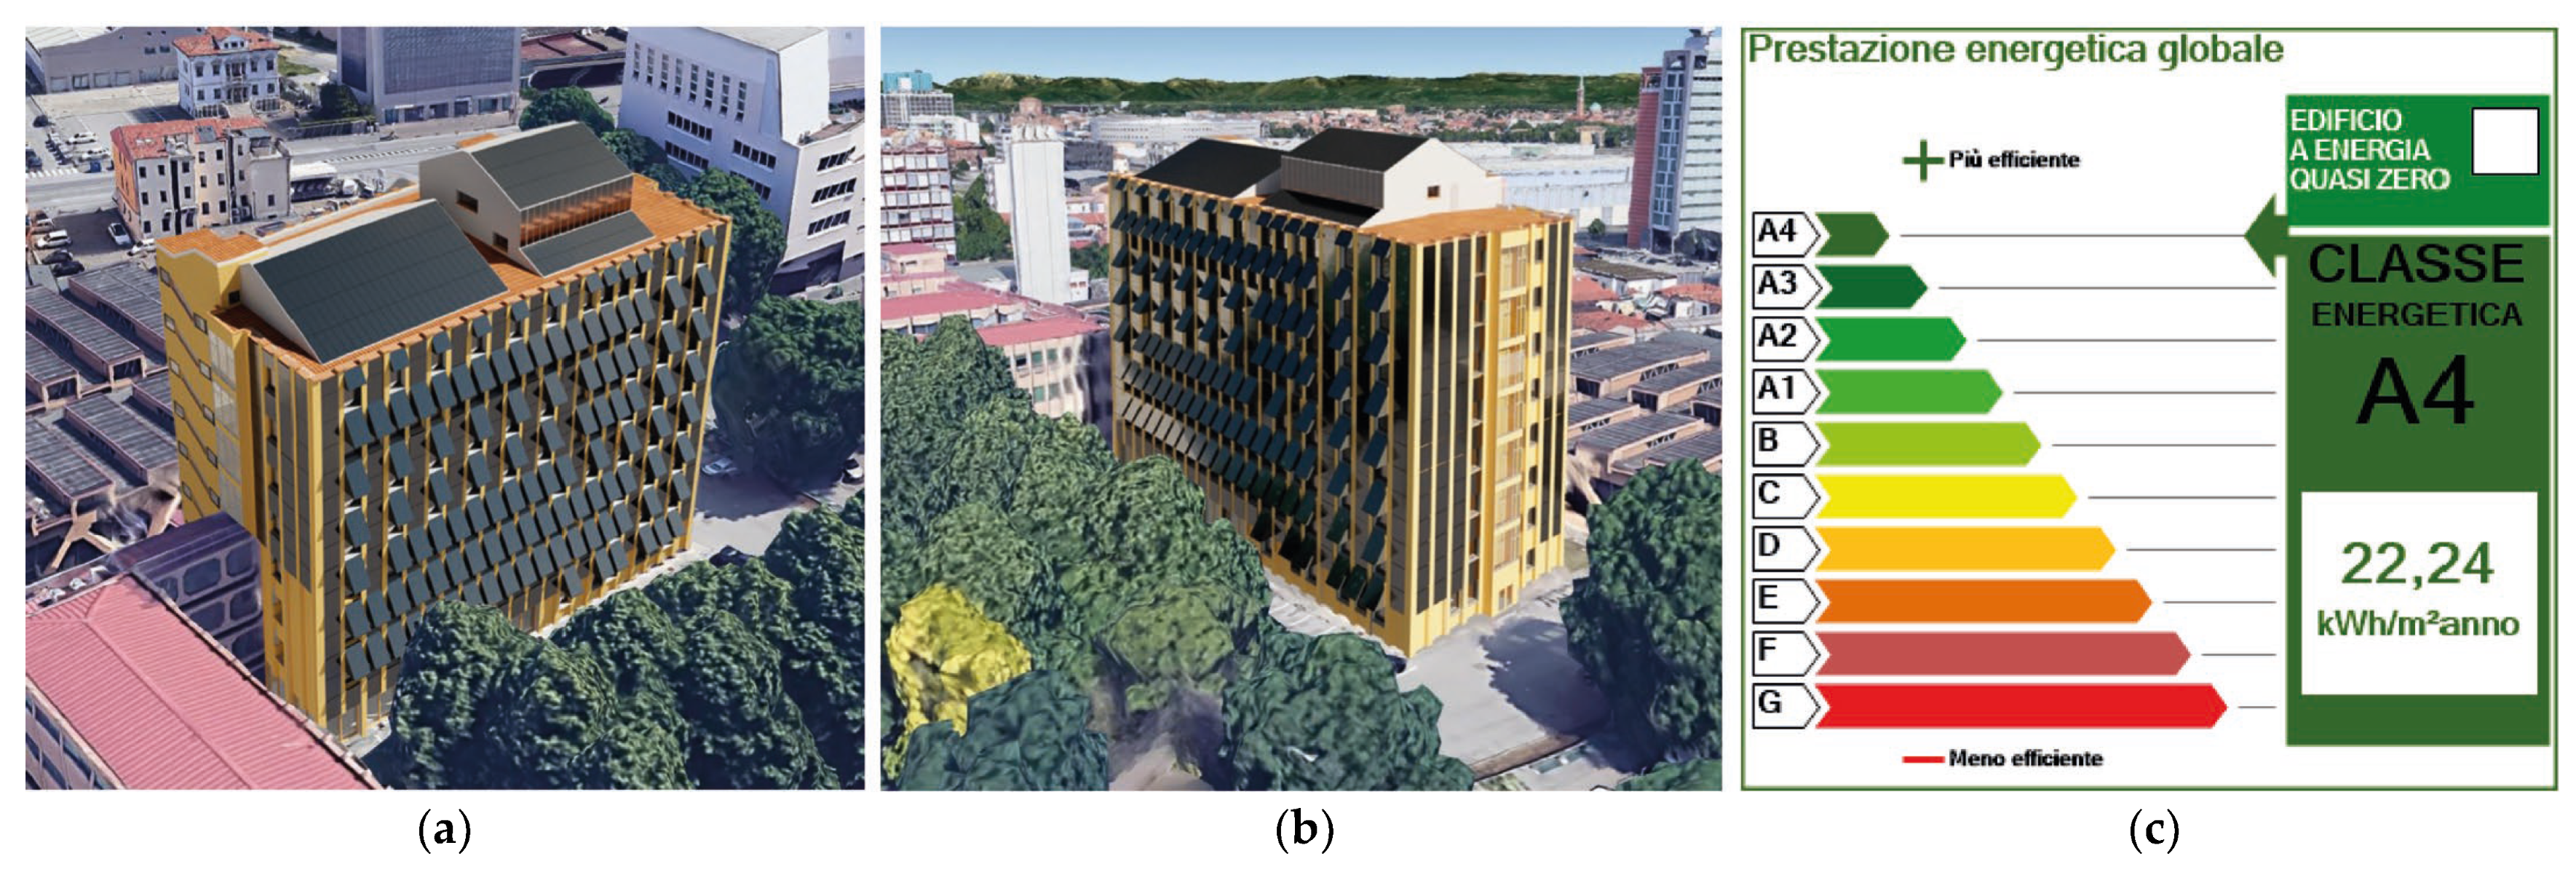
Photovoltaic Modules: Custom-made photovoltaic modules will be installed on both the roofs and facades of the building. On the south facade, the installation area was carefully determined, considering the shading caused by adjacent trees. Additionally, panels will be placed at a 57° angle above each window to provide additional protection from the sun and horizontal rainfall. The obstacle given by the adjacent bodies causes a variable shadow in the lower strip of the west facade that reaches up to the upper elevation of the roof of the adjacent body (12.76 m). Therefore, the portion above this height was considered for the insertion of the panels. On the roof, panels will be mounted on two large metal sheet structures to optimize the space, oriented towards the south.
These interventions collectively result in significant improvements in the energy performance of the building. As a result, the building achieves an energy class of A4, which is substantially higher than the initial energy performance class (
Figure 15).
These measures enhance energy efficiency, reduce energy consumption, and promote sustainability within the building. In this particular case, the building’s non-renewable global energy performance index is measured at 22.24 kWh/m2 annually. The energy performance indicates that the building exhibits a high energy performance during the winter season, whereas its performance level during the summer season is considered average. The planned photovoltaic system, therefore, has a total nominal power of 157 kW. Based on this capacity, it is estimated that the system will consume approximately 157.230 kWh/year. The projected electricity production from the photovoltaic system is estimated to be around 169.024 kWh/year, taking into account various inputs and monthly production variations. It is important to note that the quantitative results obtained for the solar potential estimation are calculated with caution over a one-year time frame. Additionally, it is worth highlighting that the application of photovoltaic systems only on building facades or roofs is not the only possibility. There are increasingly innovative methodologies emerging that integrate photovoltaic systems into various elements of urban design and less conventional building elements. These approaches aim to enhance energy efficiency and maximize the utilization of solar energy resources in urban environments.
6. Conclusions and Future Developments
The development of this methodology aims to provide different approaches for evaluating microclimatic conditions and simulated solar potential values, and we promote its replicability in other case studies, as well. To summarize the main results achieved in the three different phases (
Figure 16), it is important to highlight that in the case of the microclimatic analyses, the introduction of cool materials in urban areas demonstrates clear improvements in terms of microclimatic conditions, particularly in reducing surface temperatures and mitigating the urban heat island effect; in the case of solar potential analyses, the use of correction coefficients helps in obtaining more reliable solar potential values compared to simplified models. This approach considers specific characteristics of individual buildings and areas, enhancing the accuracy of the results; and in the design phase, the implementation of new photovoltaic systems, replacement of windows, and introduction of insulation material can lead to a significant improvement in energy performance.
However, it is important to acknowledge certain limitations associated with the methodology that, in some situations, may compromise the results obtained. In the microclimatic analysis phase, the model used is highly simplified due to restrictions in the Envi-met software. While this allows for faster simulations, it may not capture specific characteristics of individual buildings and areas, allowing for an incorrect simulation of the surface temperatures. In the solar potential analysis phase, the identification of surfaces and materials relied solely on visual analyses, which can be a laborious and time-consuming process. This process can also lead to inaccuracies that alter the calculation of actual available solar potential. Additionally, the placement of photovoltaic panels in the design phase was conducted in an approximate manner, which may affect the precision of the results about their production. These limitations should be taken into account when applying the methodology, and they can be further addressed through advancements in software capabilities, data collection methods, and modeling techniques. It is also important to highlight that the interference between all these types of analyses represents an important future work: to try to integrate better all the results.
In the described context, future research developments can certainly be addressed; firstly, towards the identification of the different kinds of interference that could be present between mitigation systems and the applied PV panels. It is crucial to evaluate the integrated behavior between different active and passive systems. While implementing mitigation systems and PV panels can be beneficial, potential negative aspects such as glare from over-reflective surfaces and heat emissions from photovoltaic surfaces should also be considered. Further research can focus on optimizing the balance between these systems to maximize overall benefits. To expedite the process of surface and material detection, utilizing drones and implementing photogrammetry and deep learning techniques can be beneficial. These technologies can enhance efficiency and accuracy in identifying suitable areas for photovoltaic installations and other interventions [
50,
51].
Finally, to gain a more comprehensive understanding of the benefits derived from building improvements, it is important to compare energy production and consumption. Evaluating the real self-sustainability of buildings involves analyzing the balance between energy production from PV systems and energy consumption by the building itself. This assessment provides valuable insights into the overall energy performance and sustainability of the building. By addressing these aspects, future developments can enhance the methodology, improve analysis accuracy, and provide a more comprehensive assessment of the energy performance and sustainability of buildings in urban environments.


