
Research on On-Line Detection Method and System for Nitrate in Groundwater


Abstract
:1. Introduce
2. Experimental Part
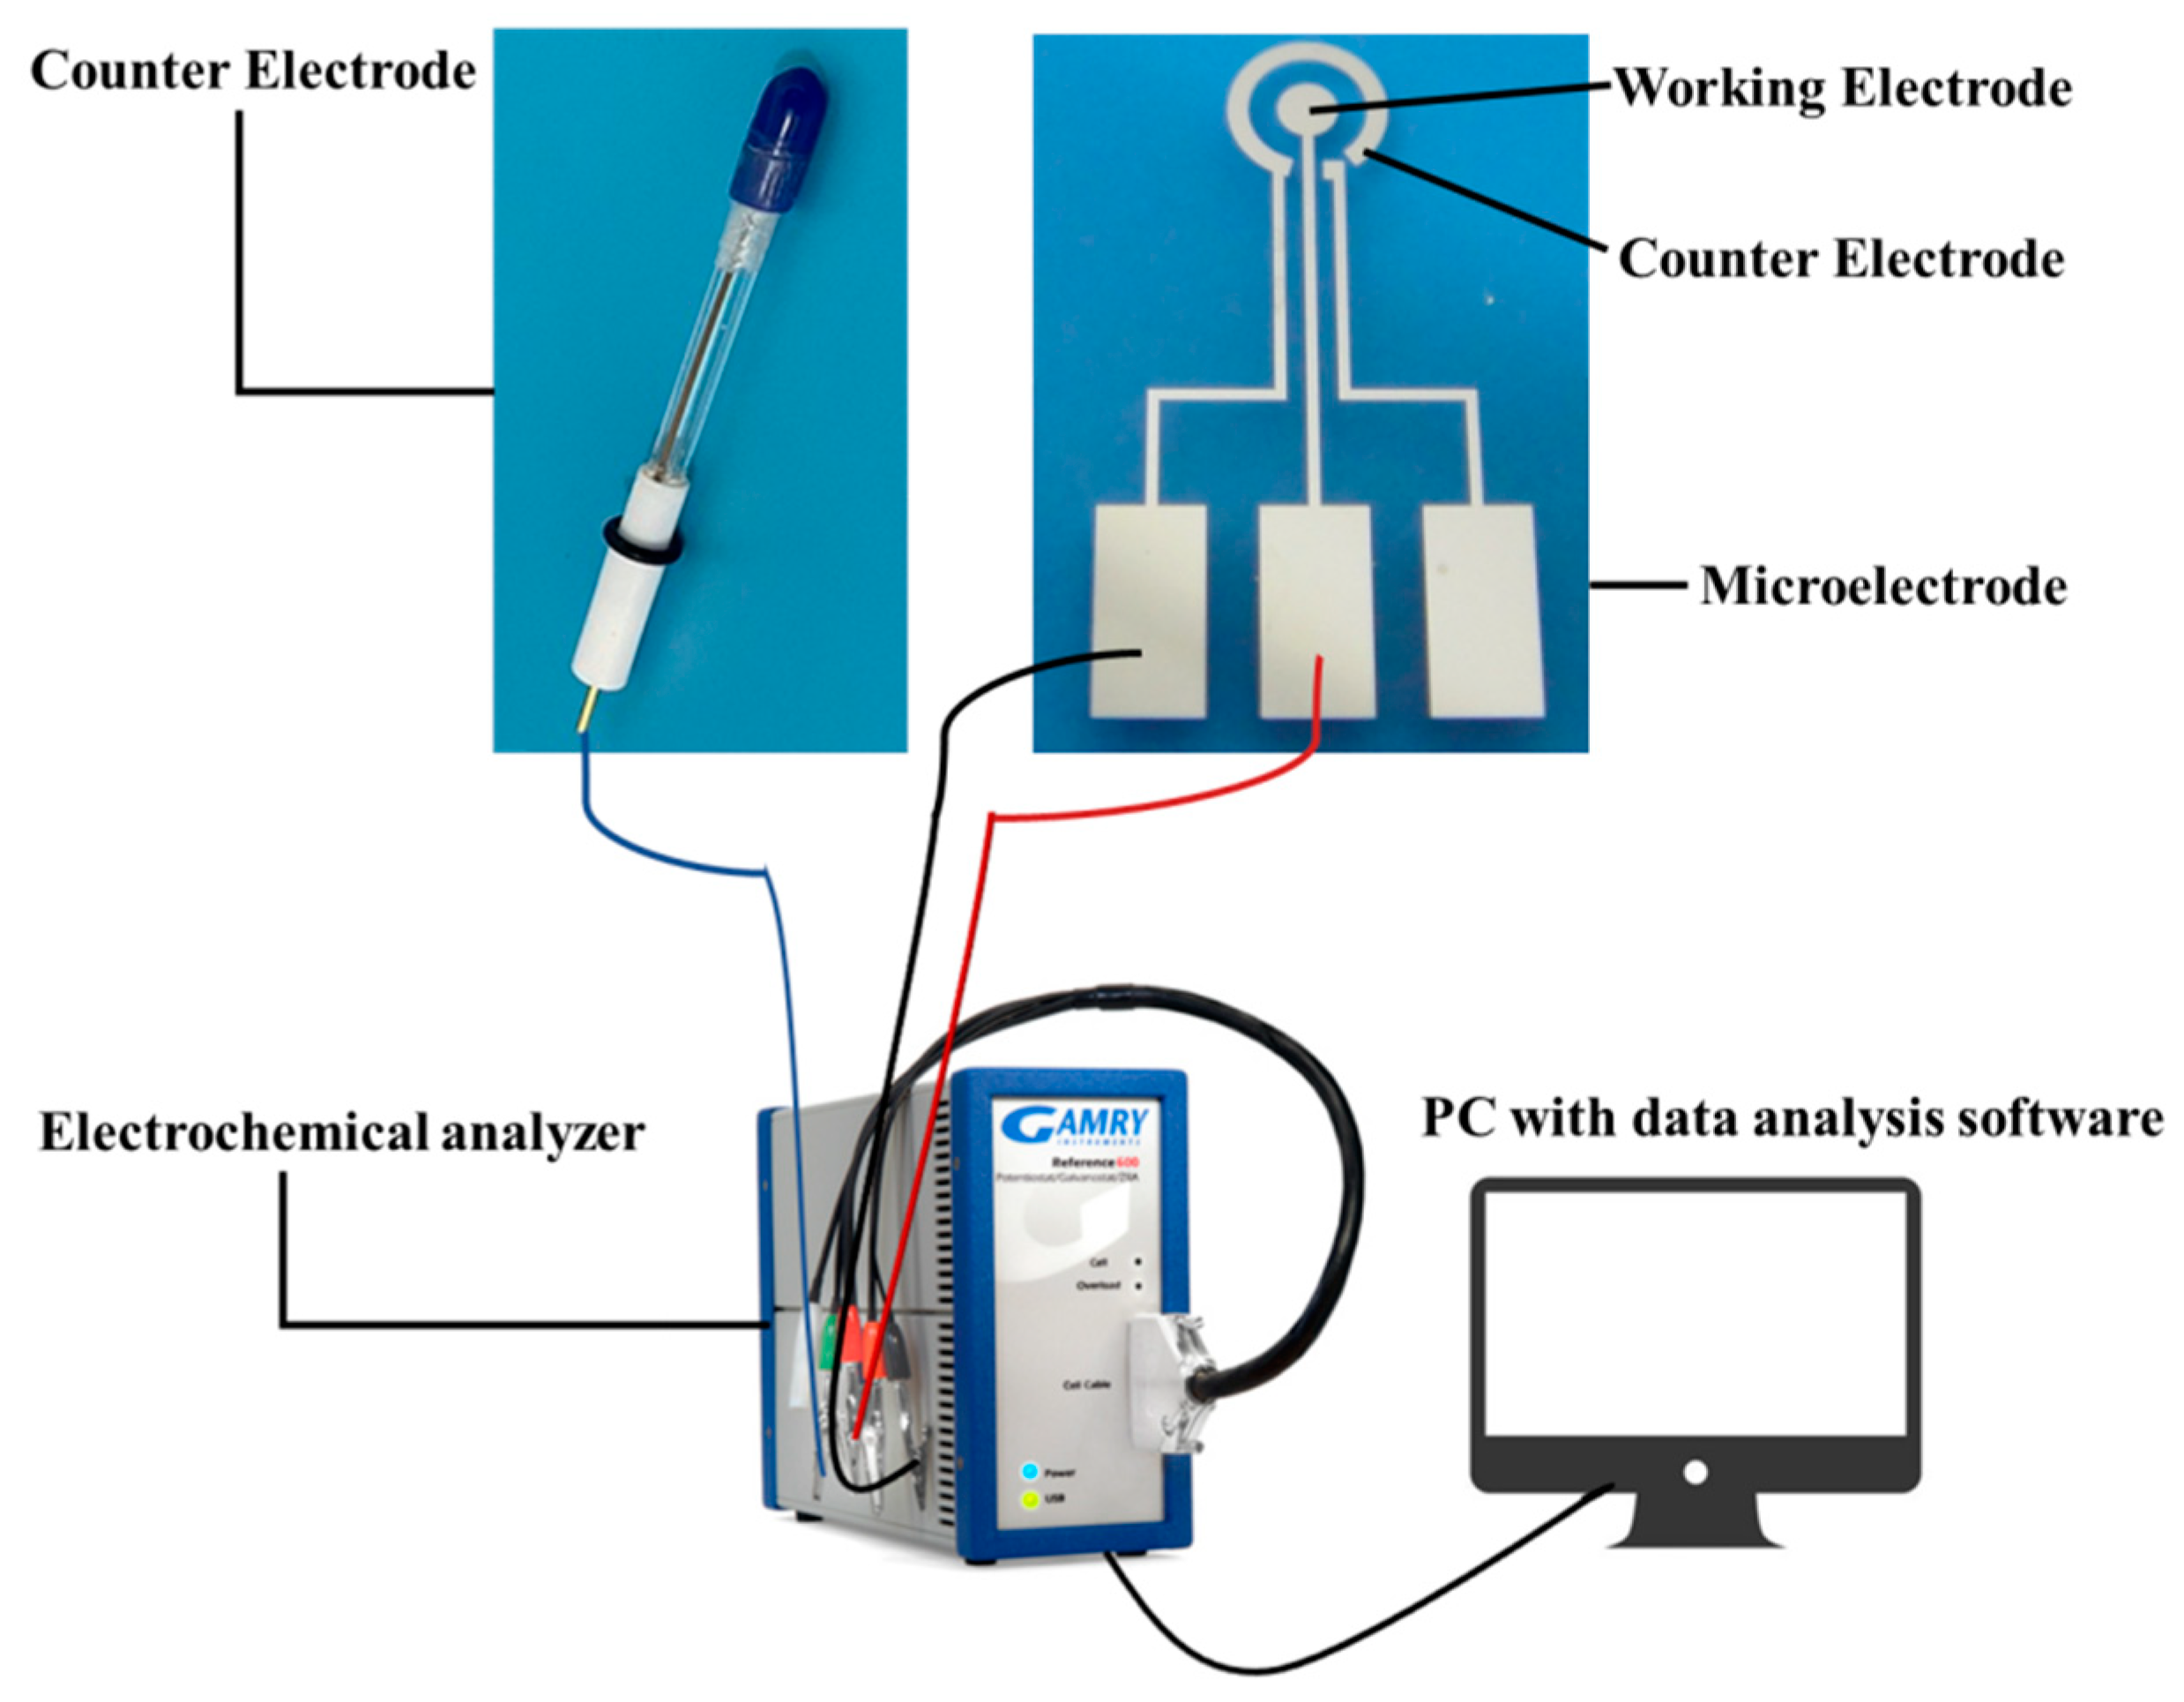
2.1. Reagents and Instruments
2.2. Experimental Process
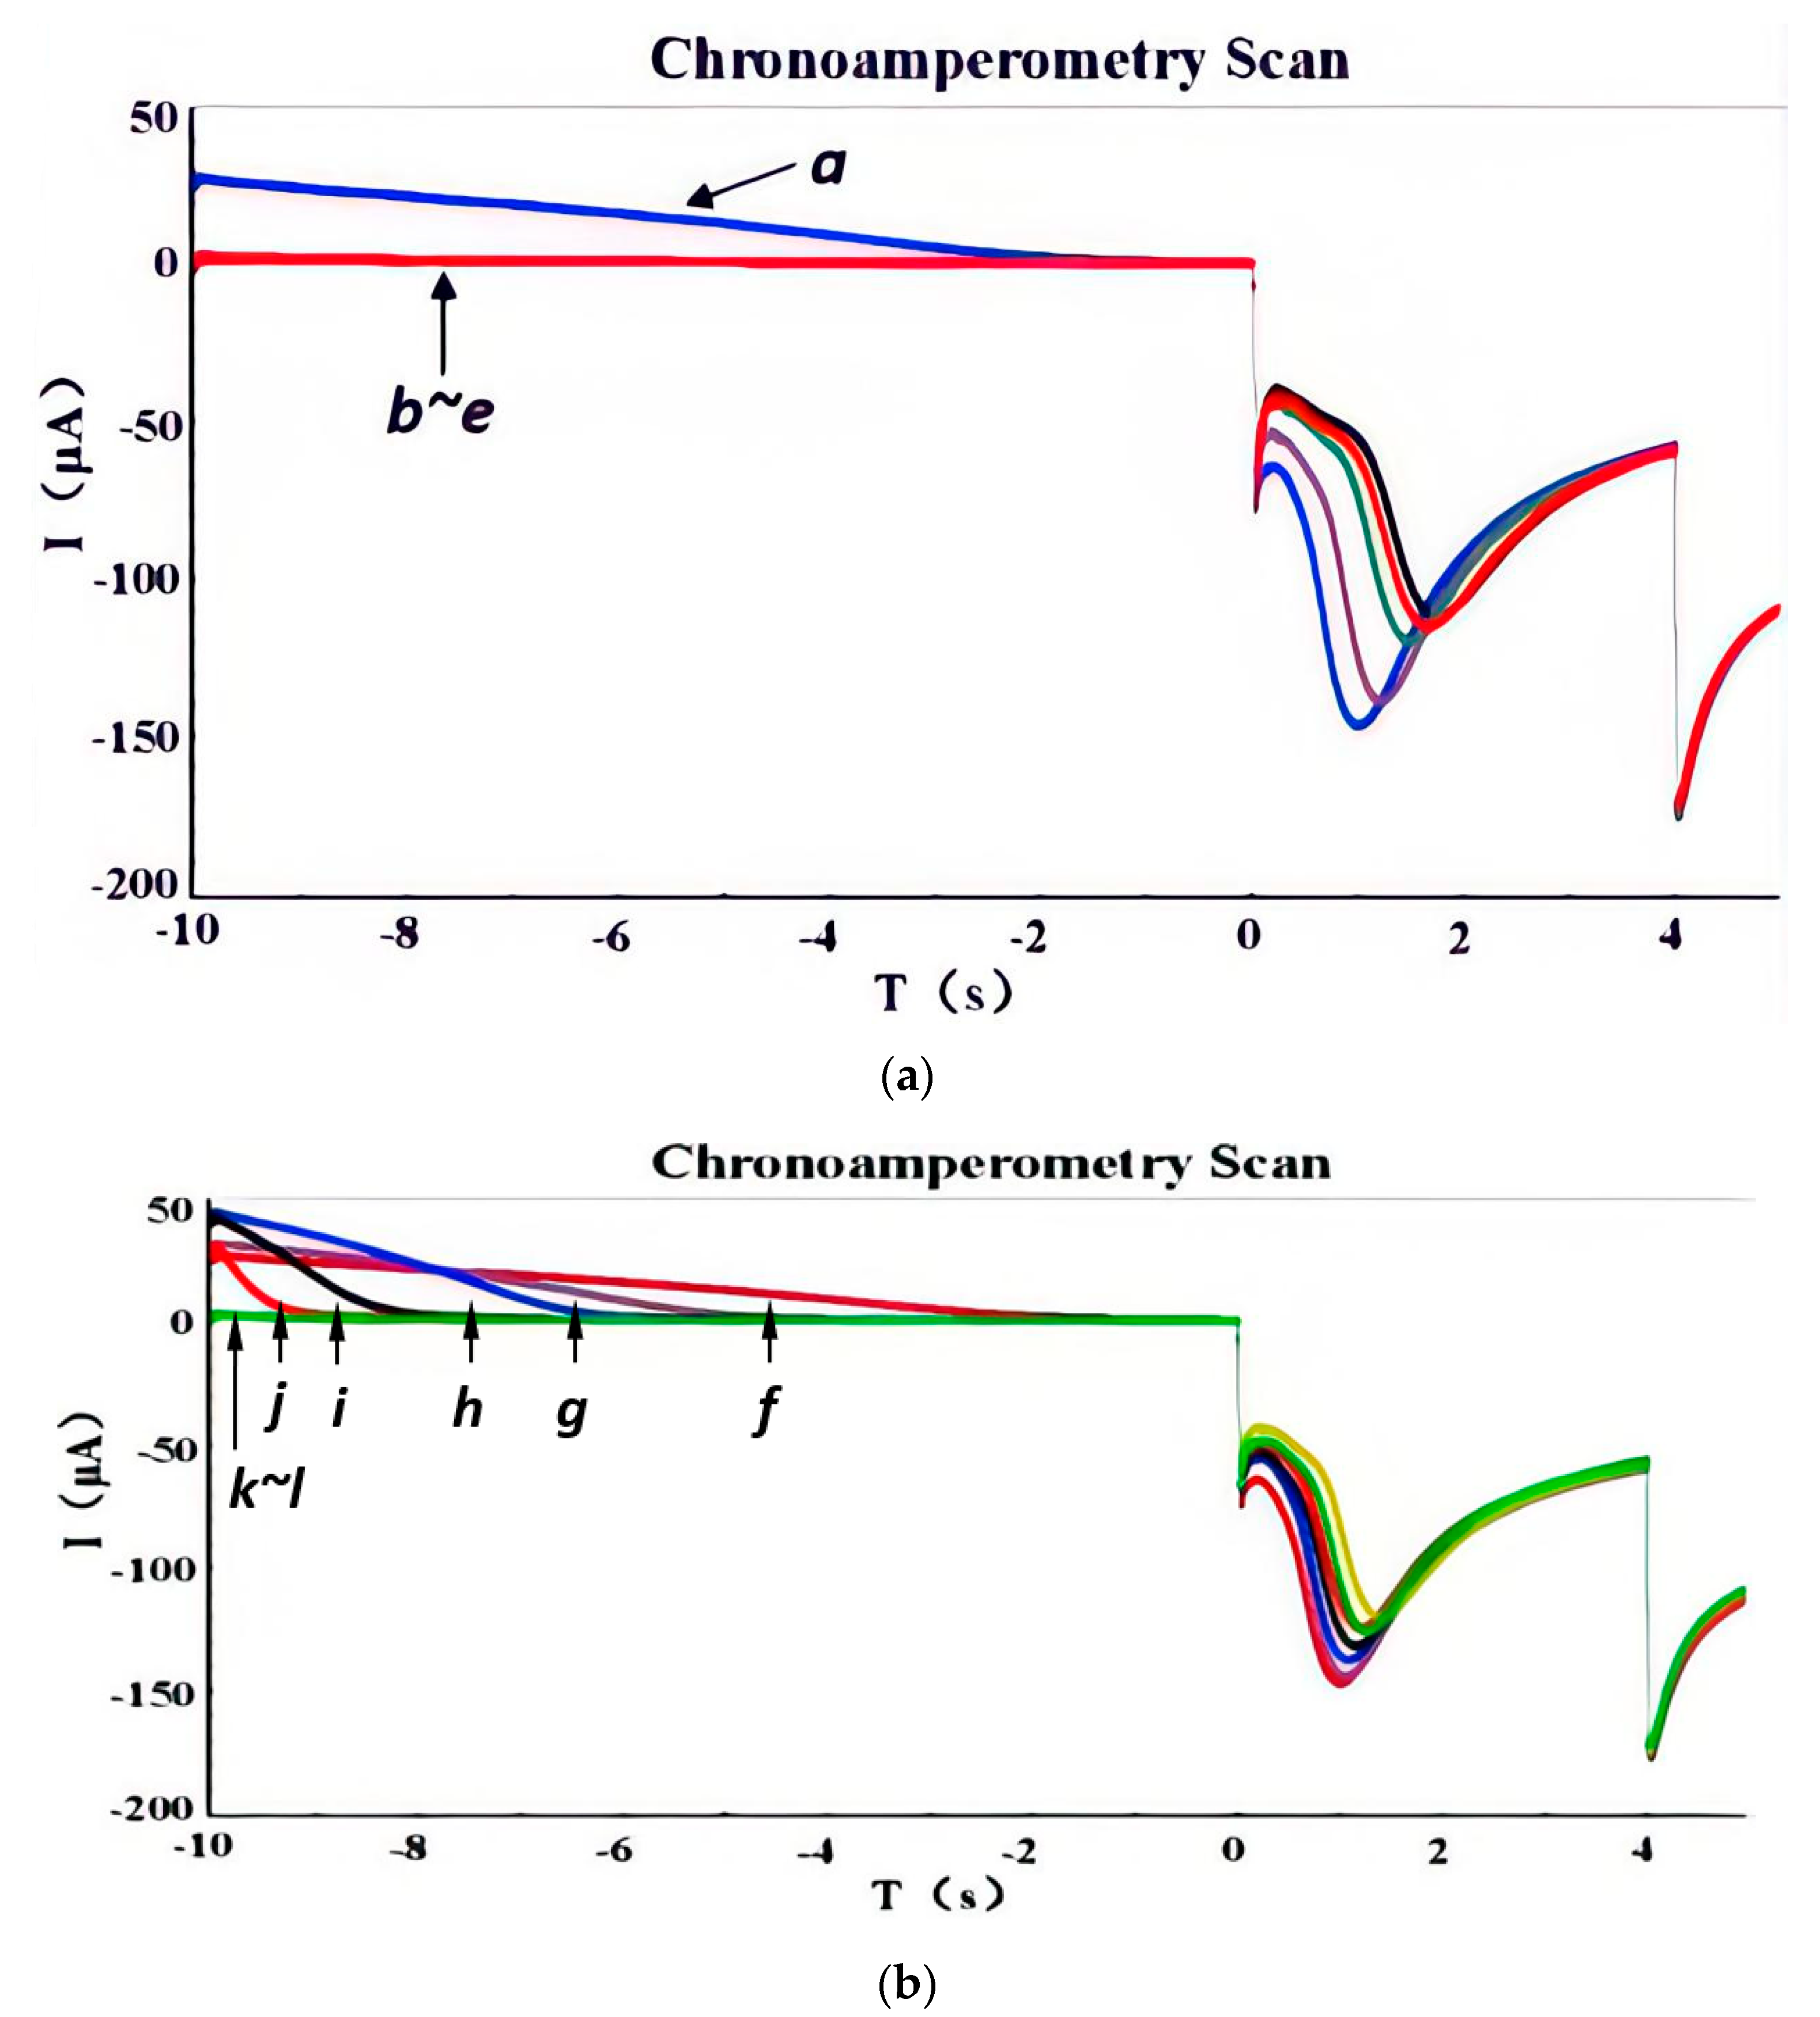
- (a)
- In the cleaning stage, at the dissolution potential E1, the microelectrode is cleaned, which removes the copper-sensitive layer deposited on the electrode surface.
- (b)
- In the modification stage, at the deposition potential E2 of the Cu2+ ions, electrodeposition is added to modify the microelectrode so that a layer of copper-sensitive material is deposited onto the electrode surface.
- (c)
- In the detection stage, the response current is detected at the detection potential E3 of the reduction peak of the NO3− ions.
3. Results and Discussion
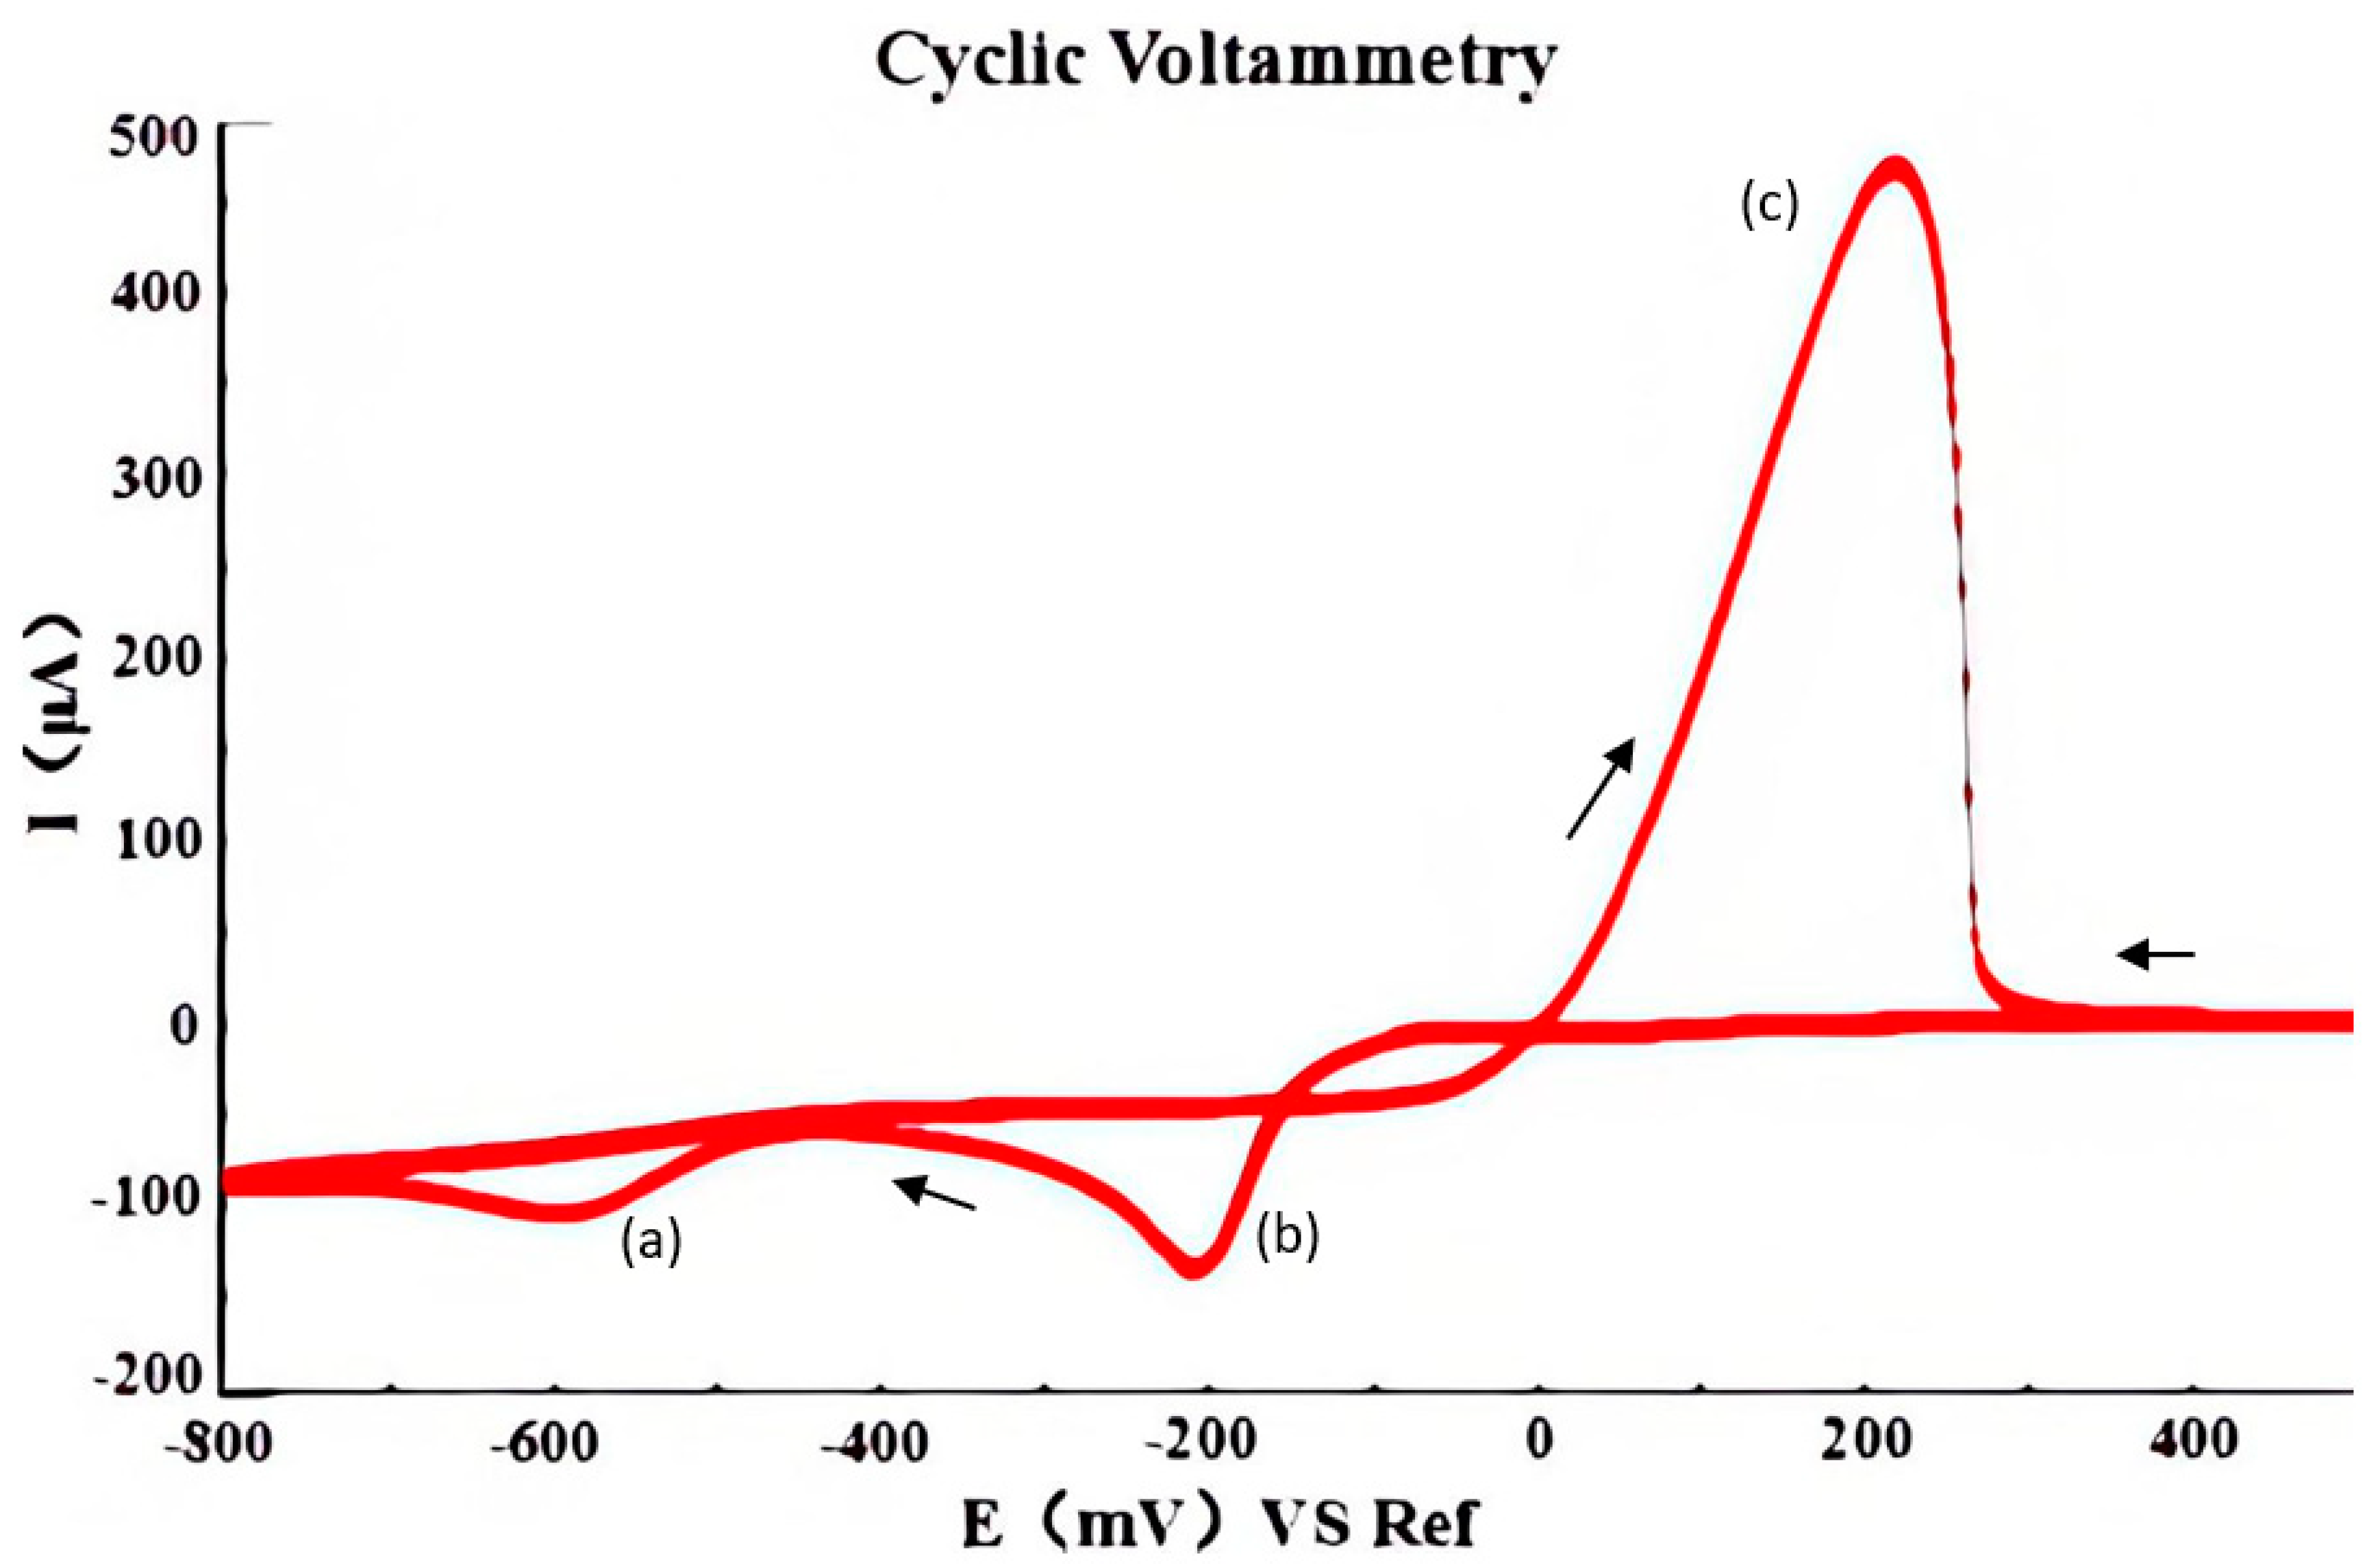
3.1. Parameter Optimization
- (1)
- Dissolution potential E1
- (2)
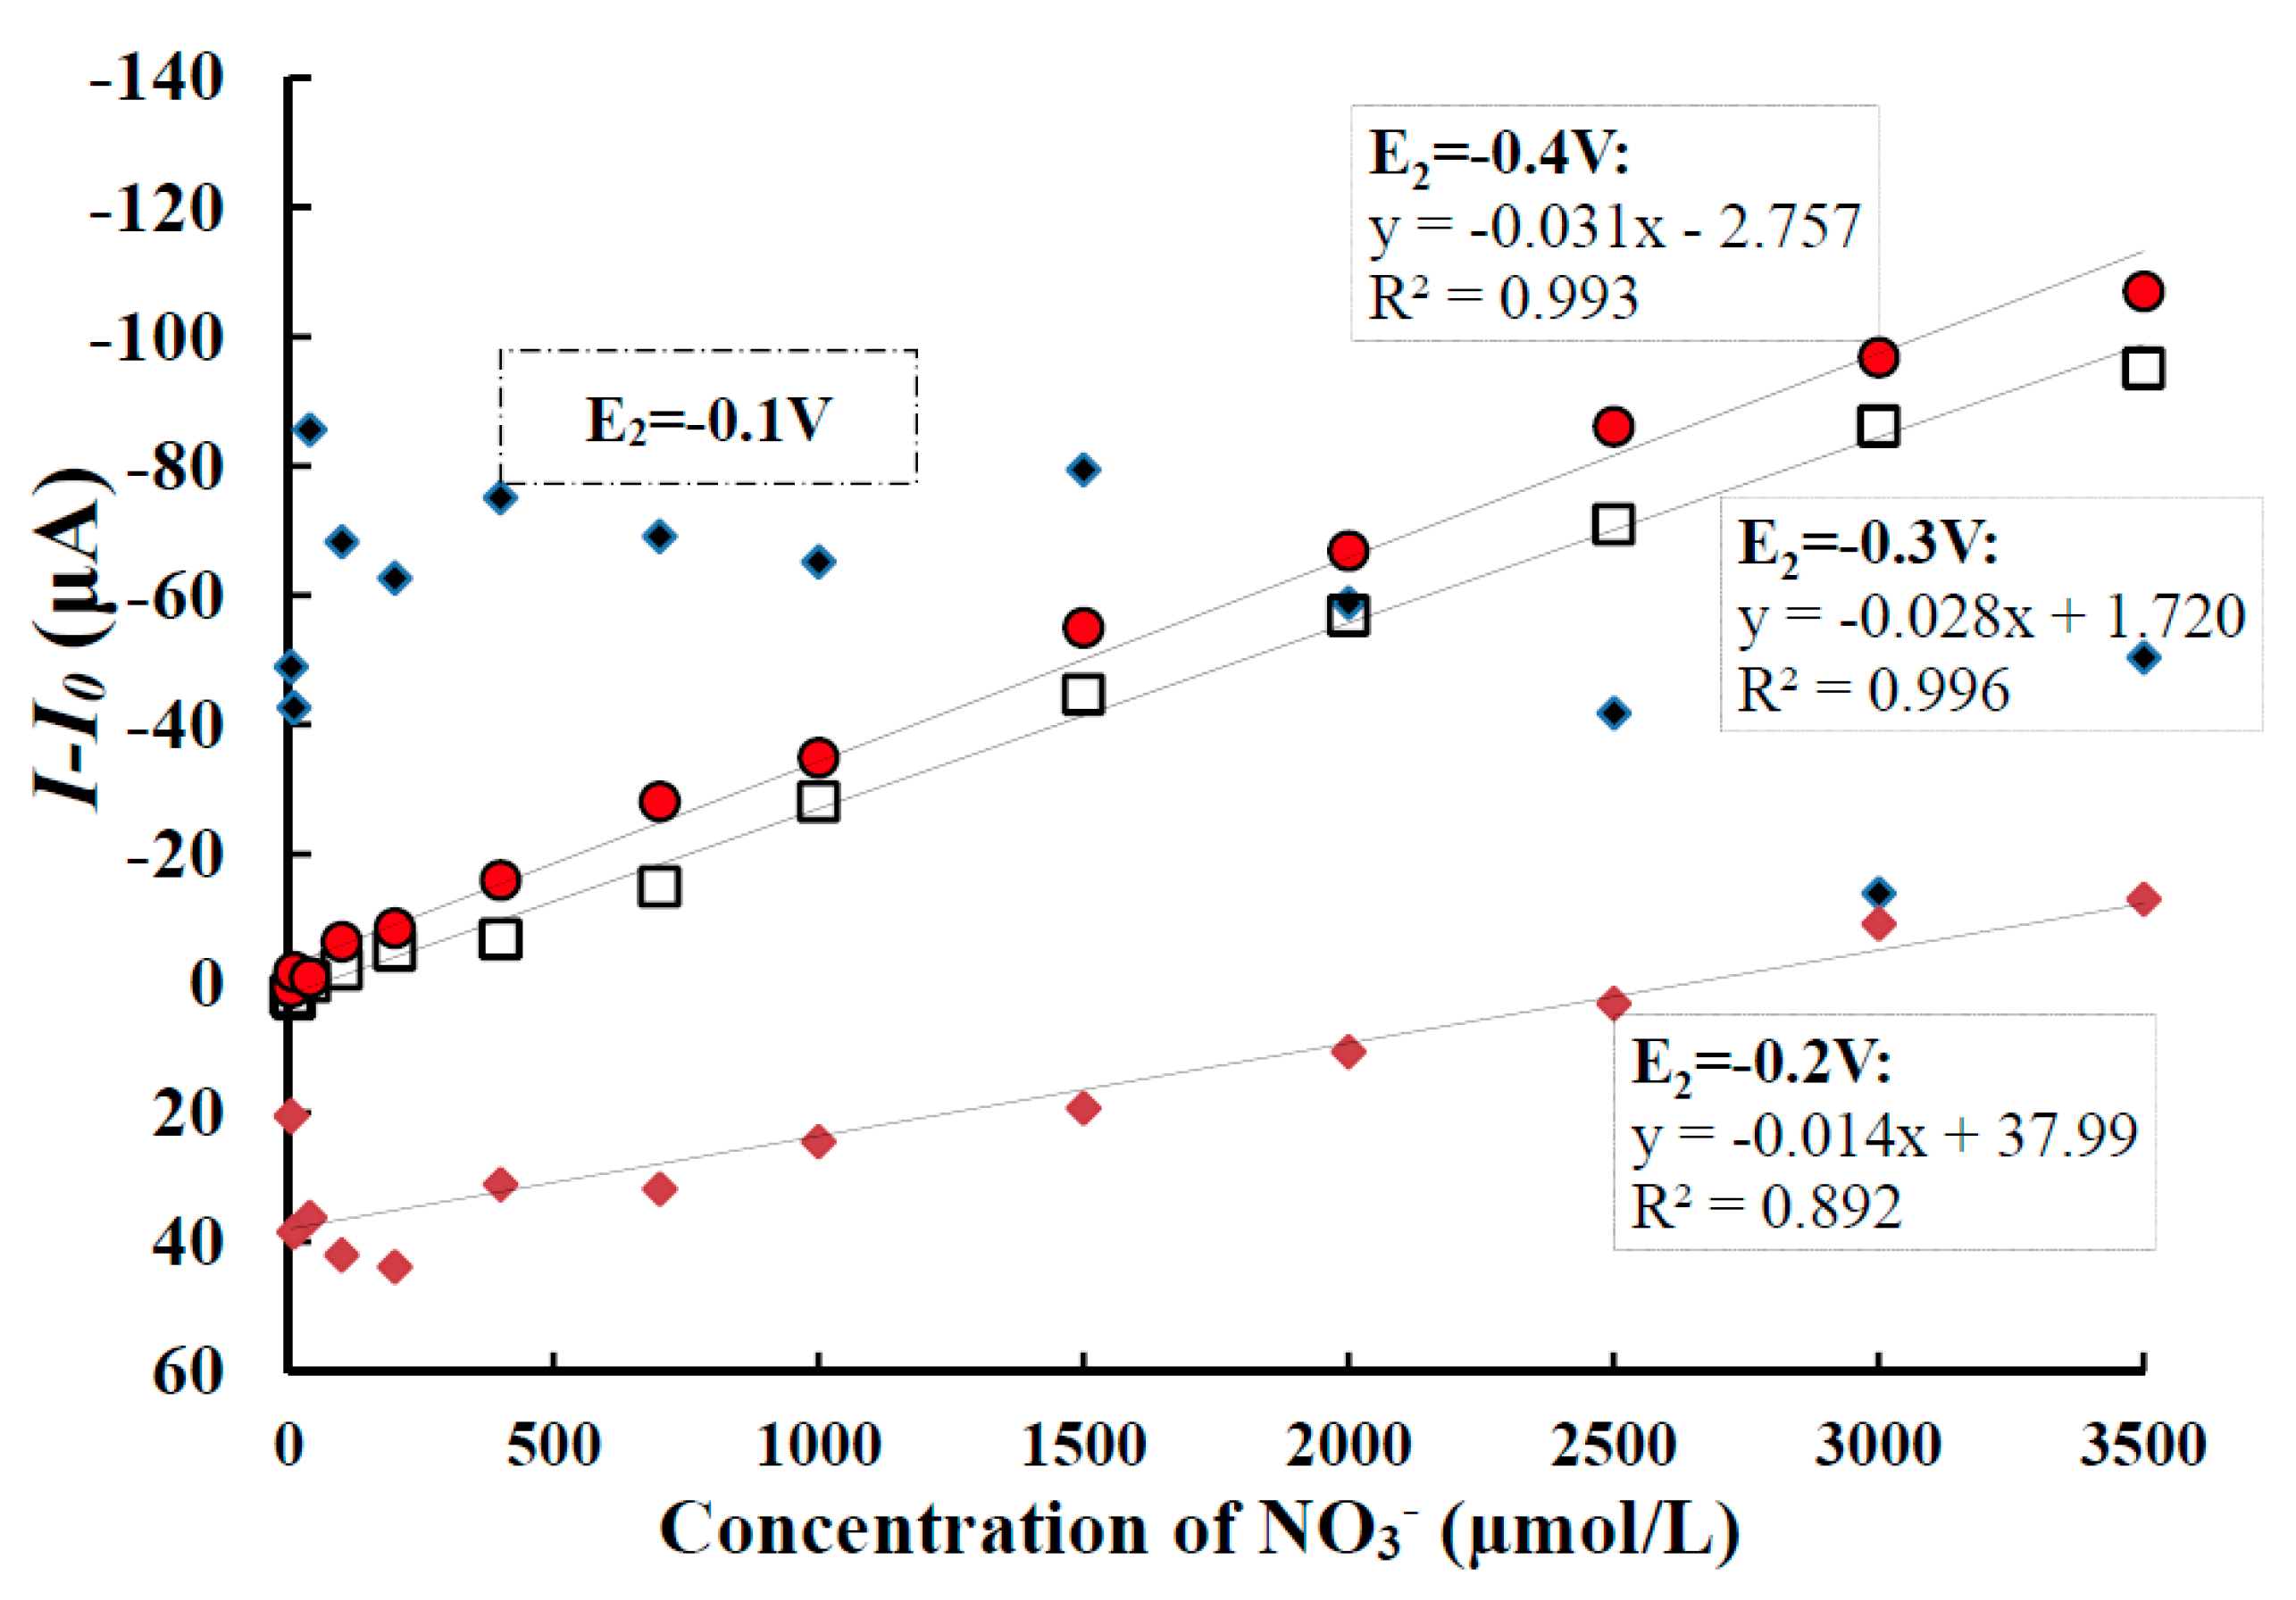
- Deposition potential E2
- (3)
- Deposition potential E3
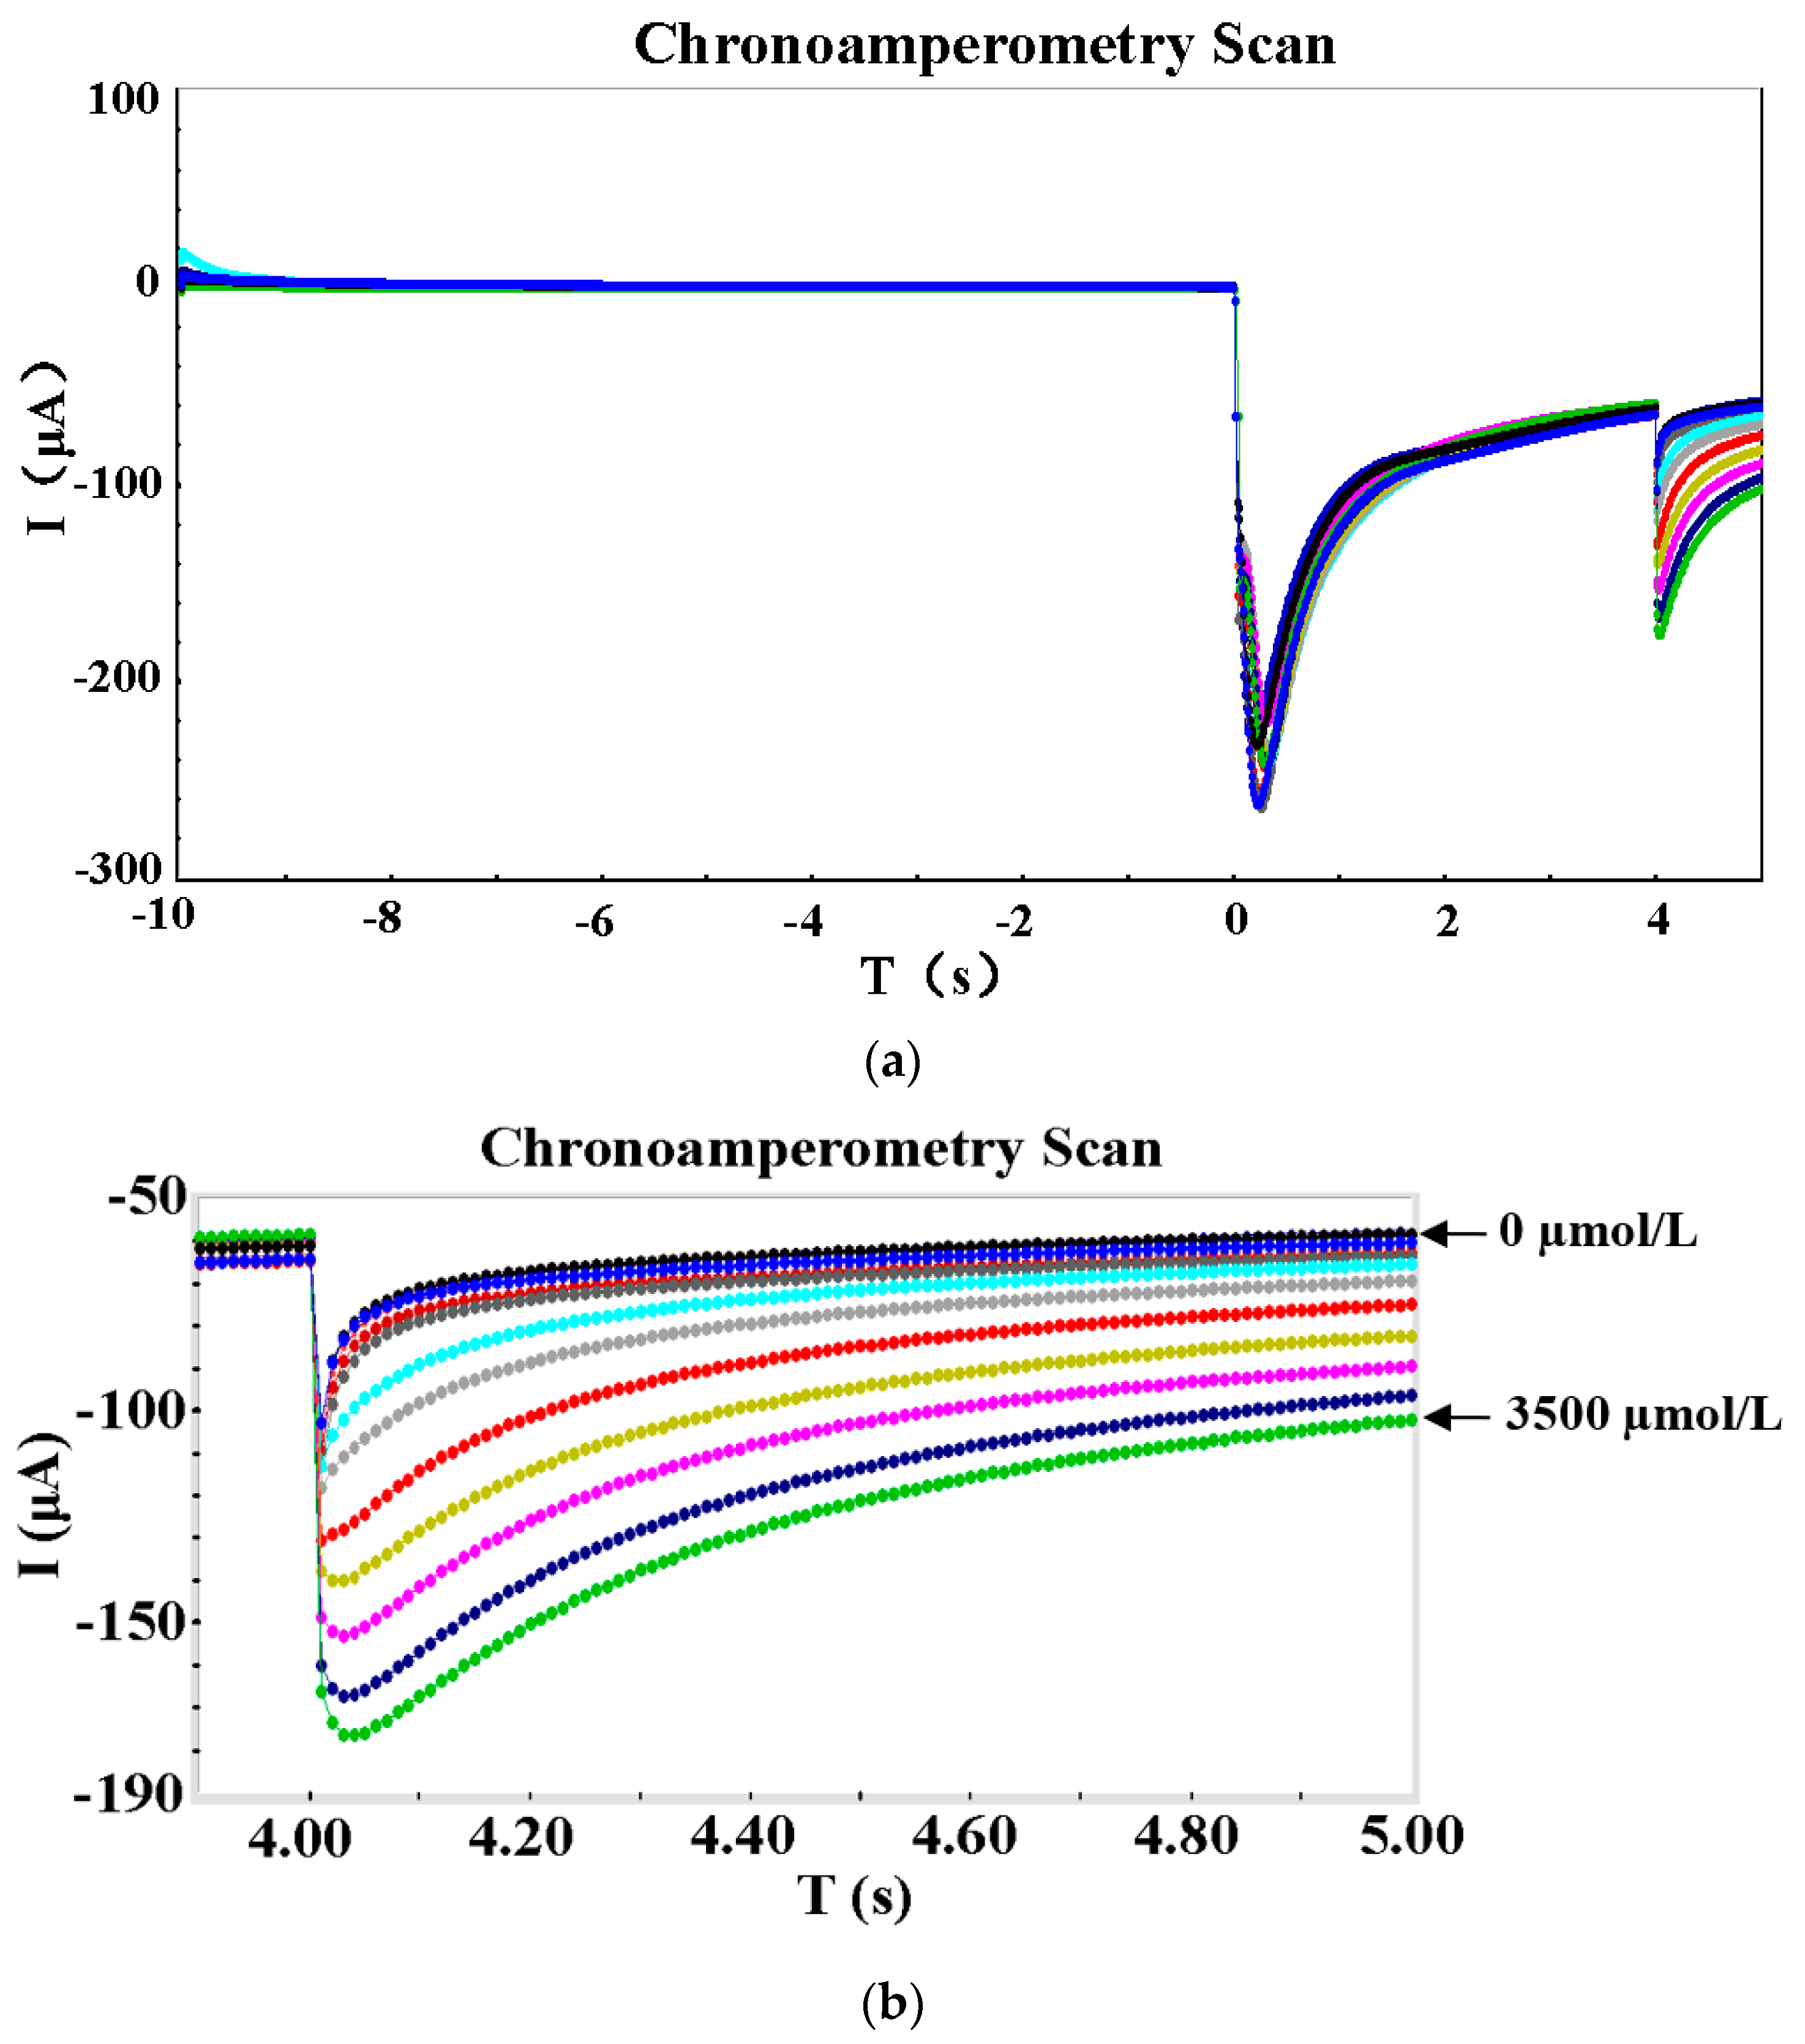
3.2. Performance Test
- (1)
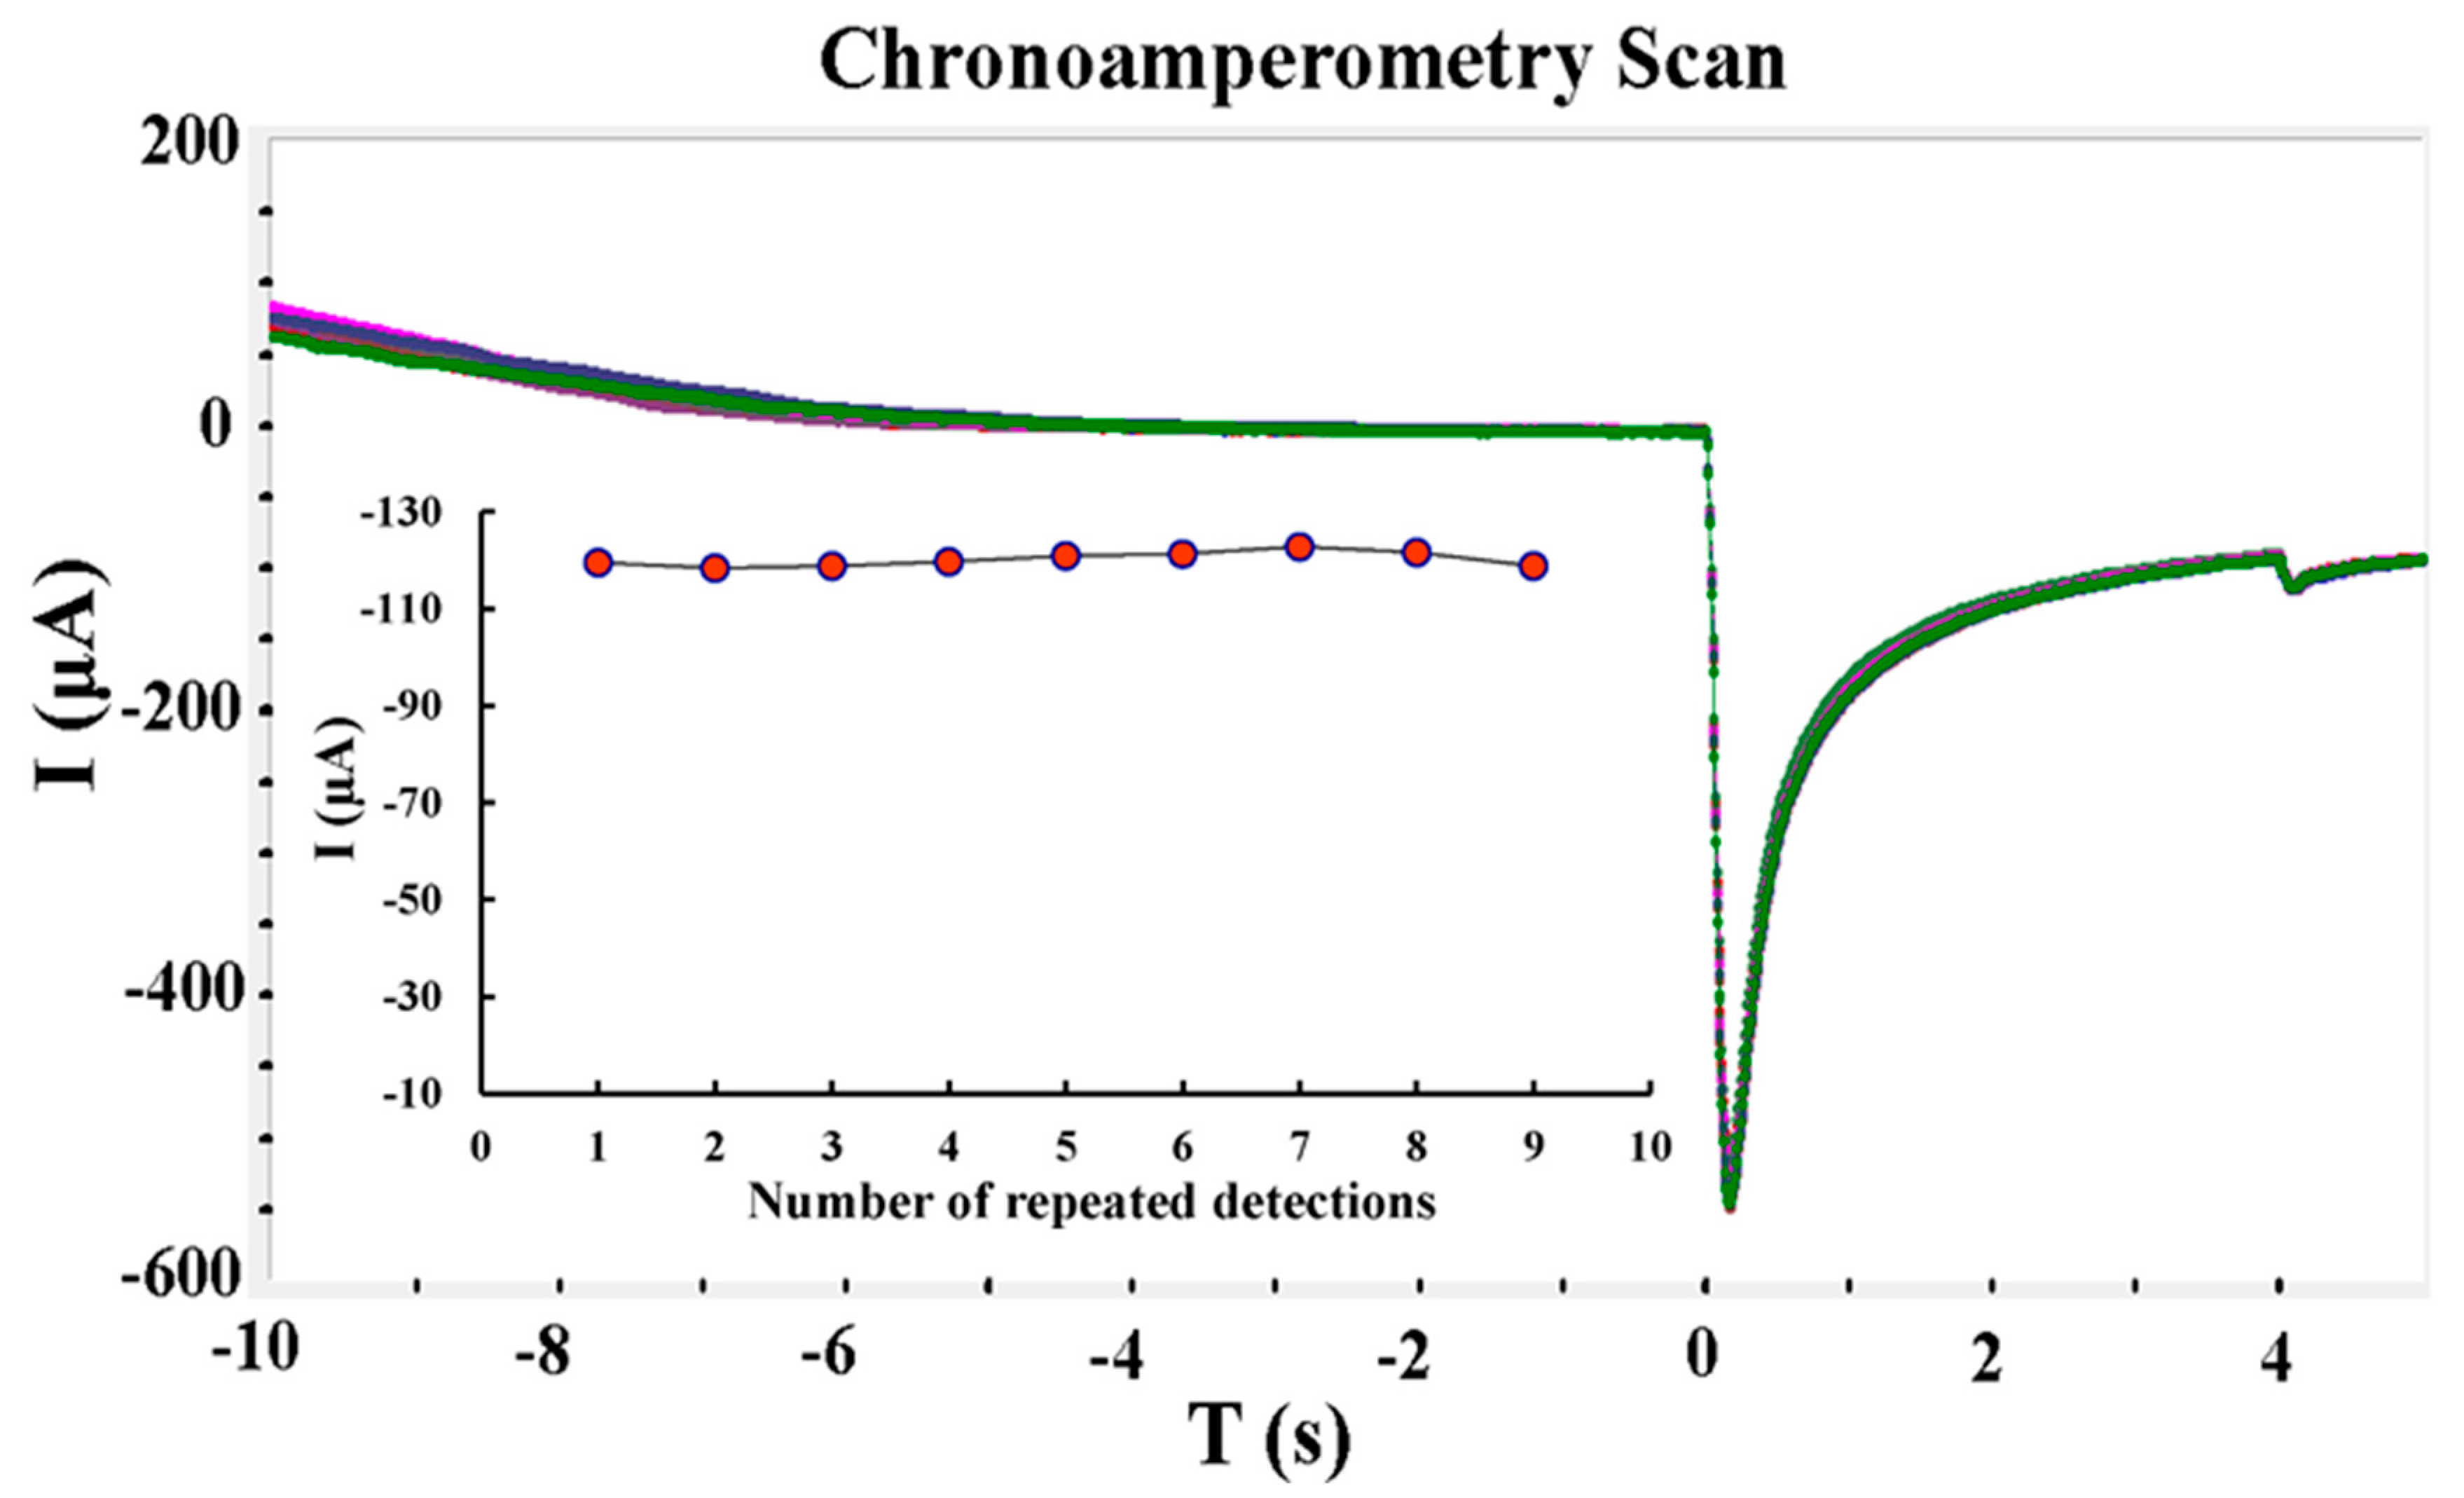
- Repeatability
- (2)
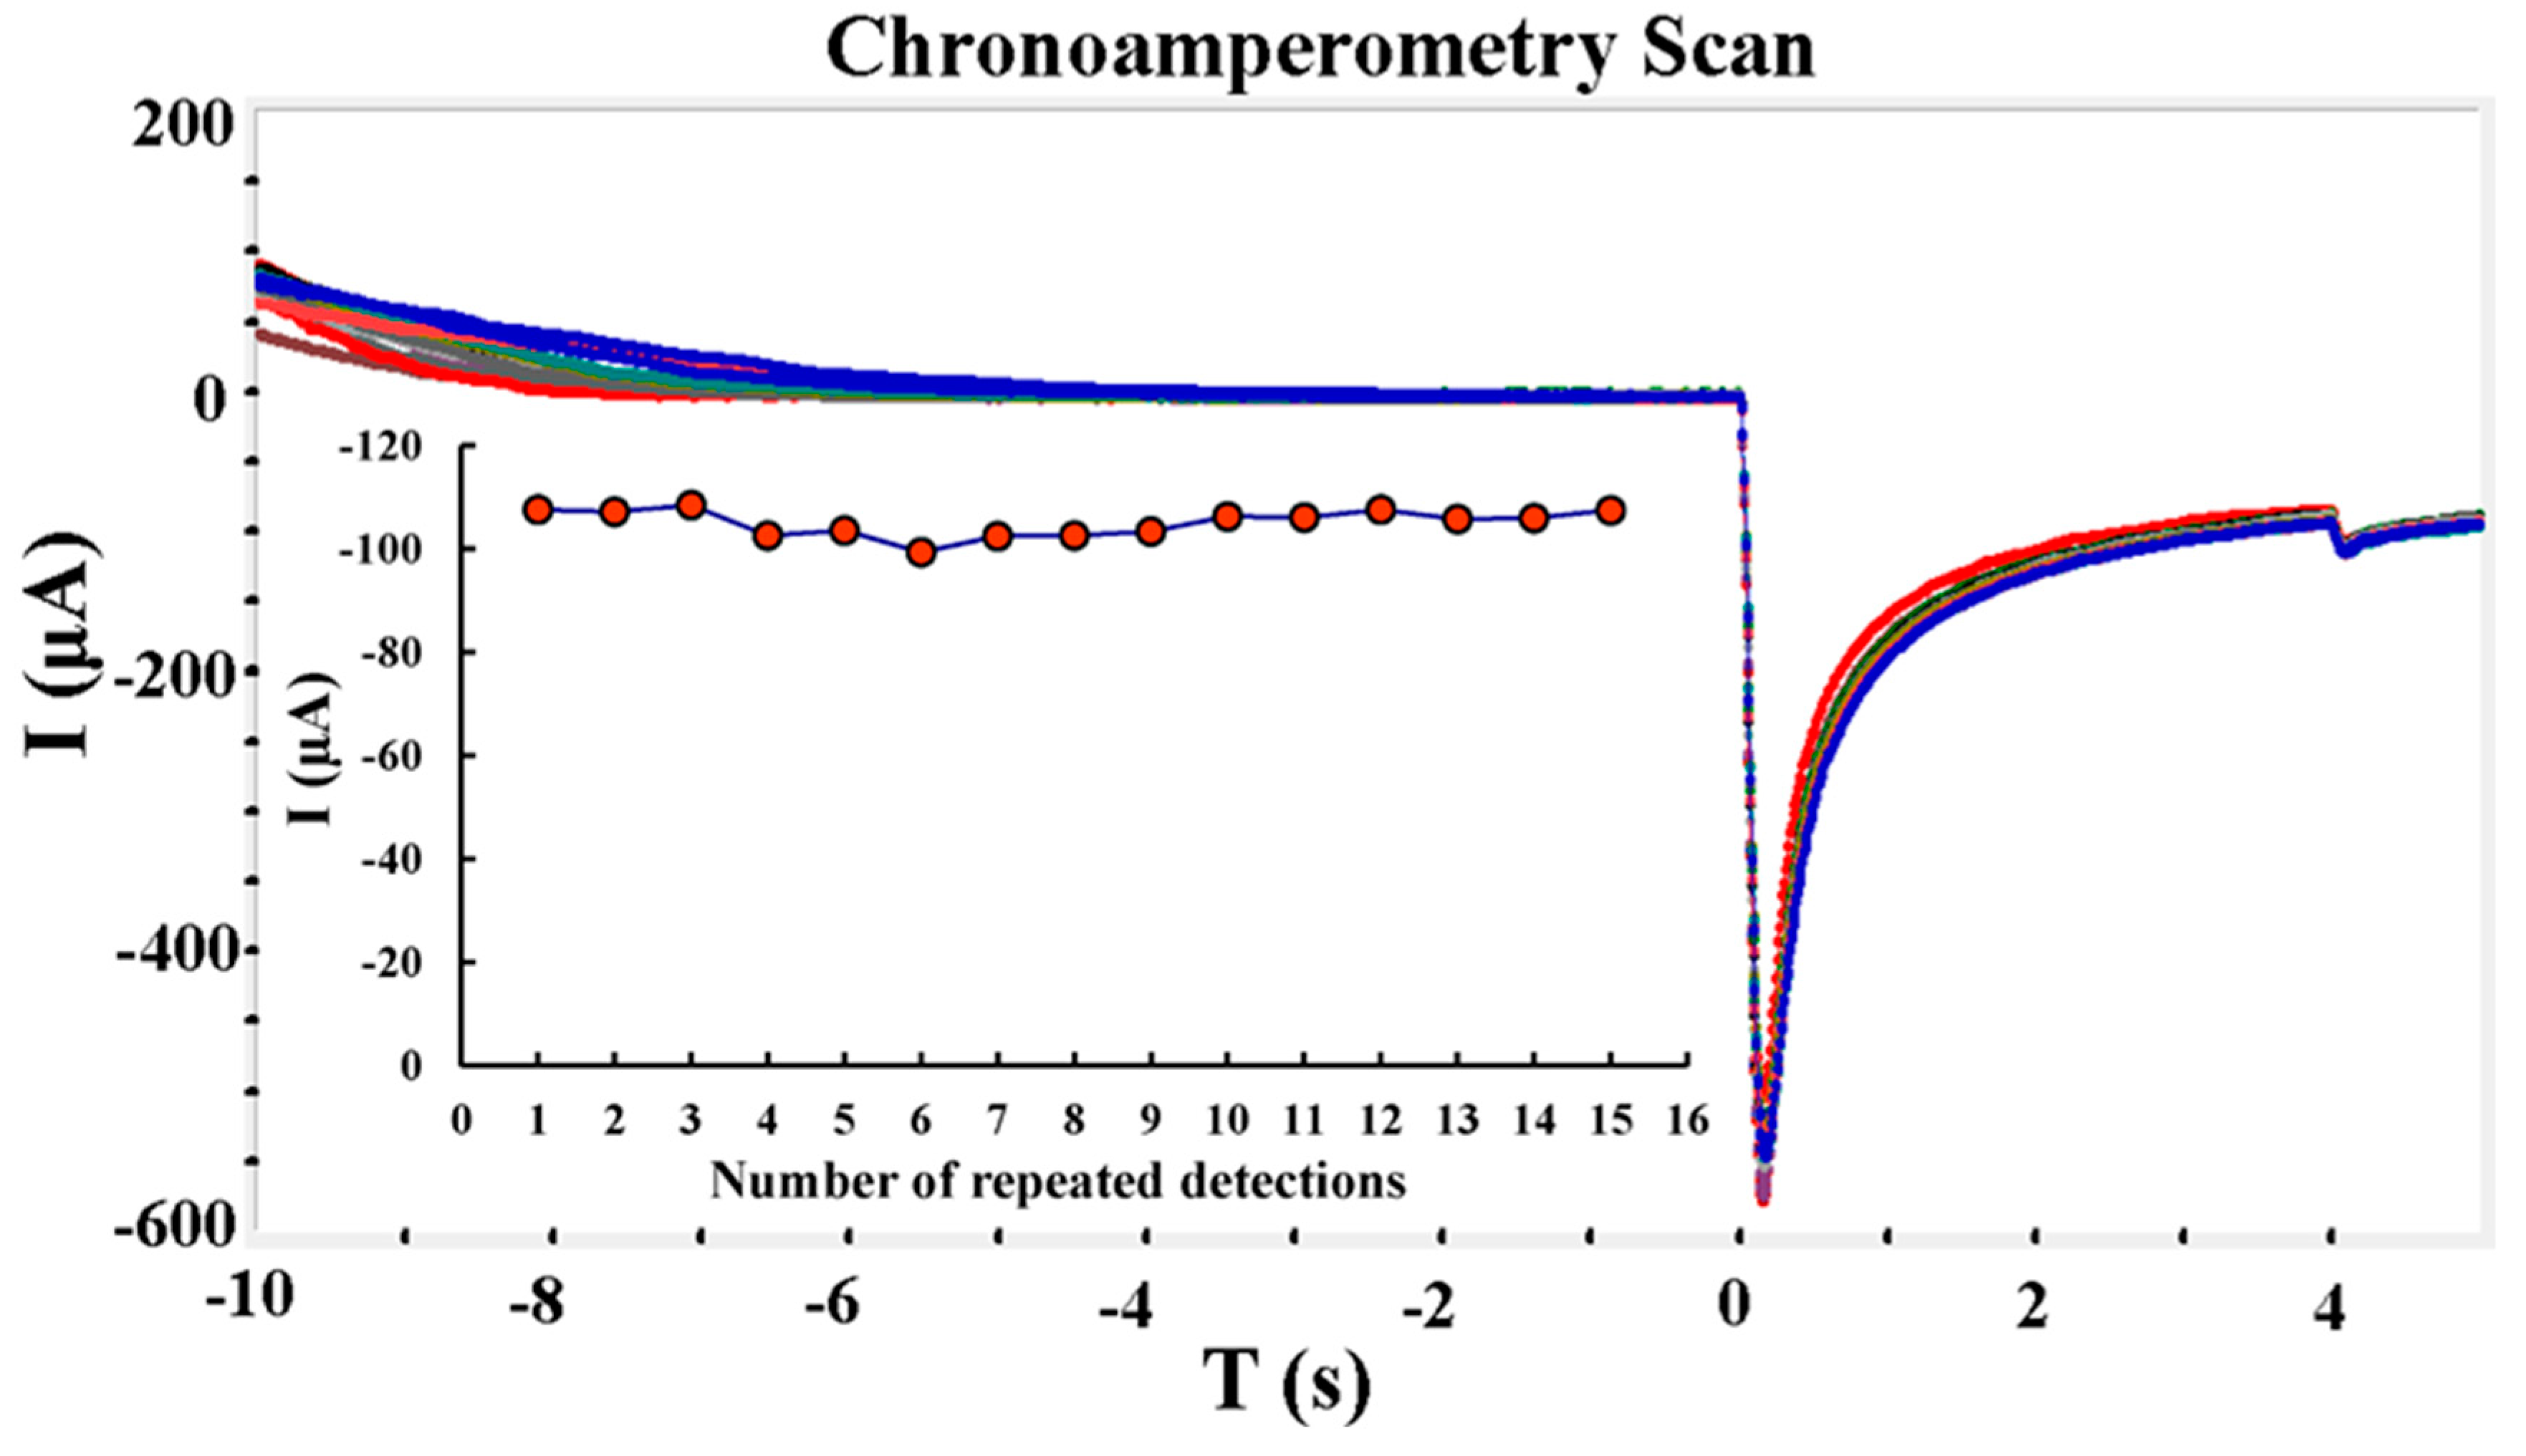
- Consistency
- (3)
- Detection performance of nitrate
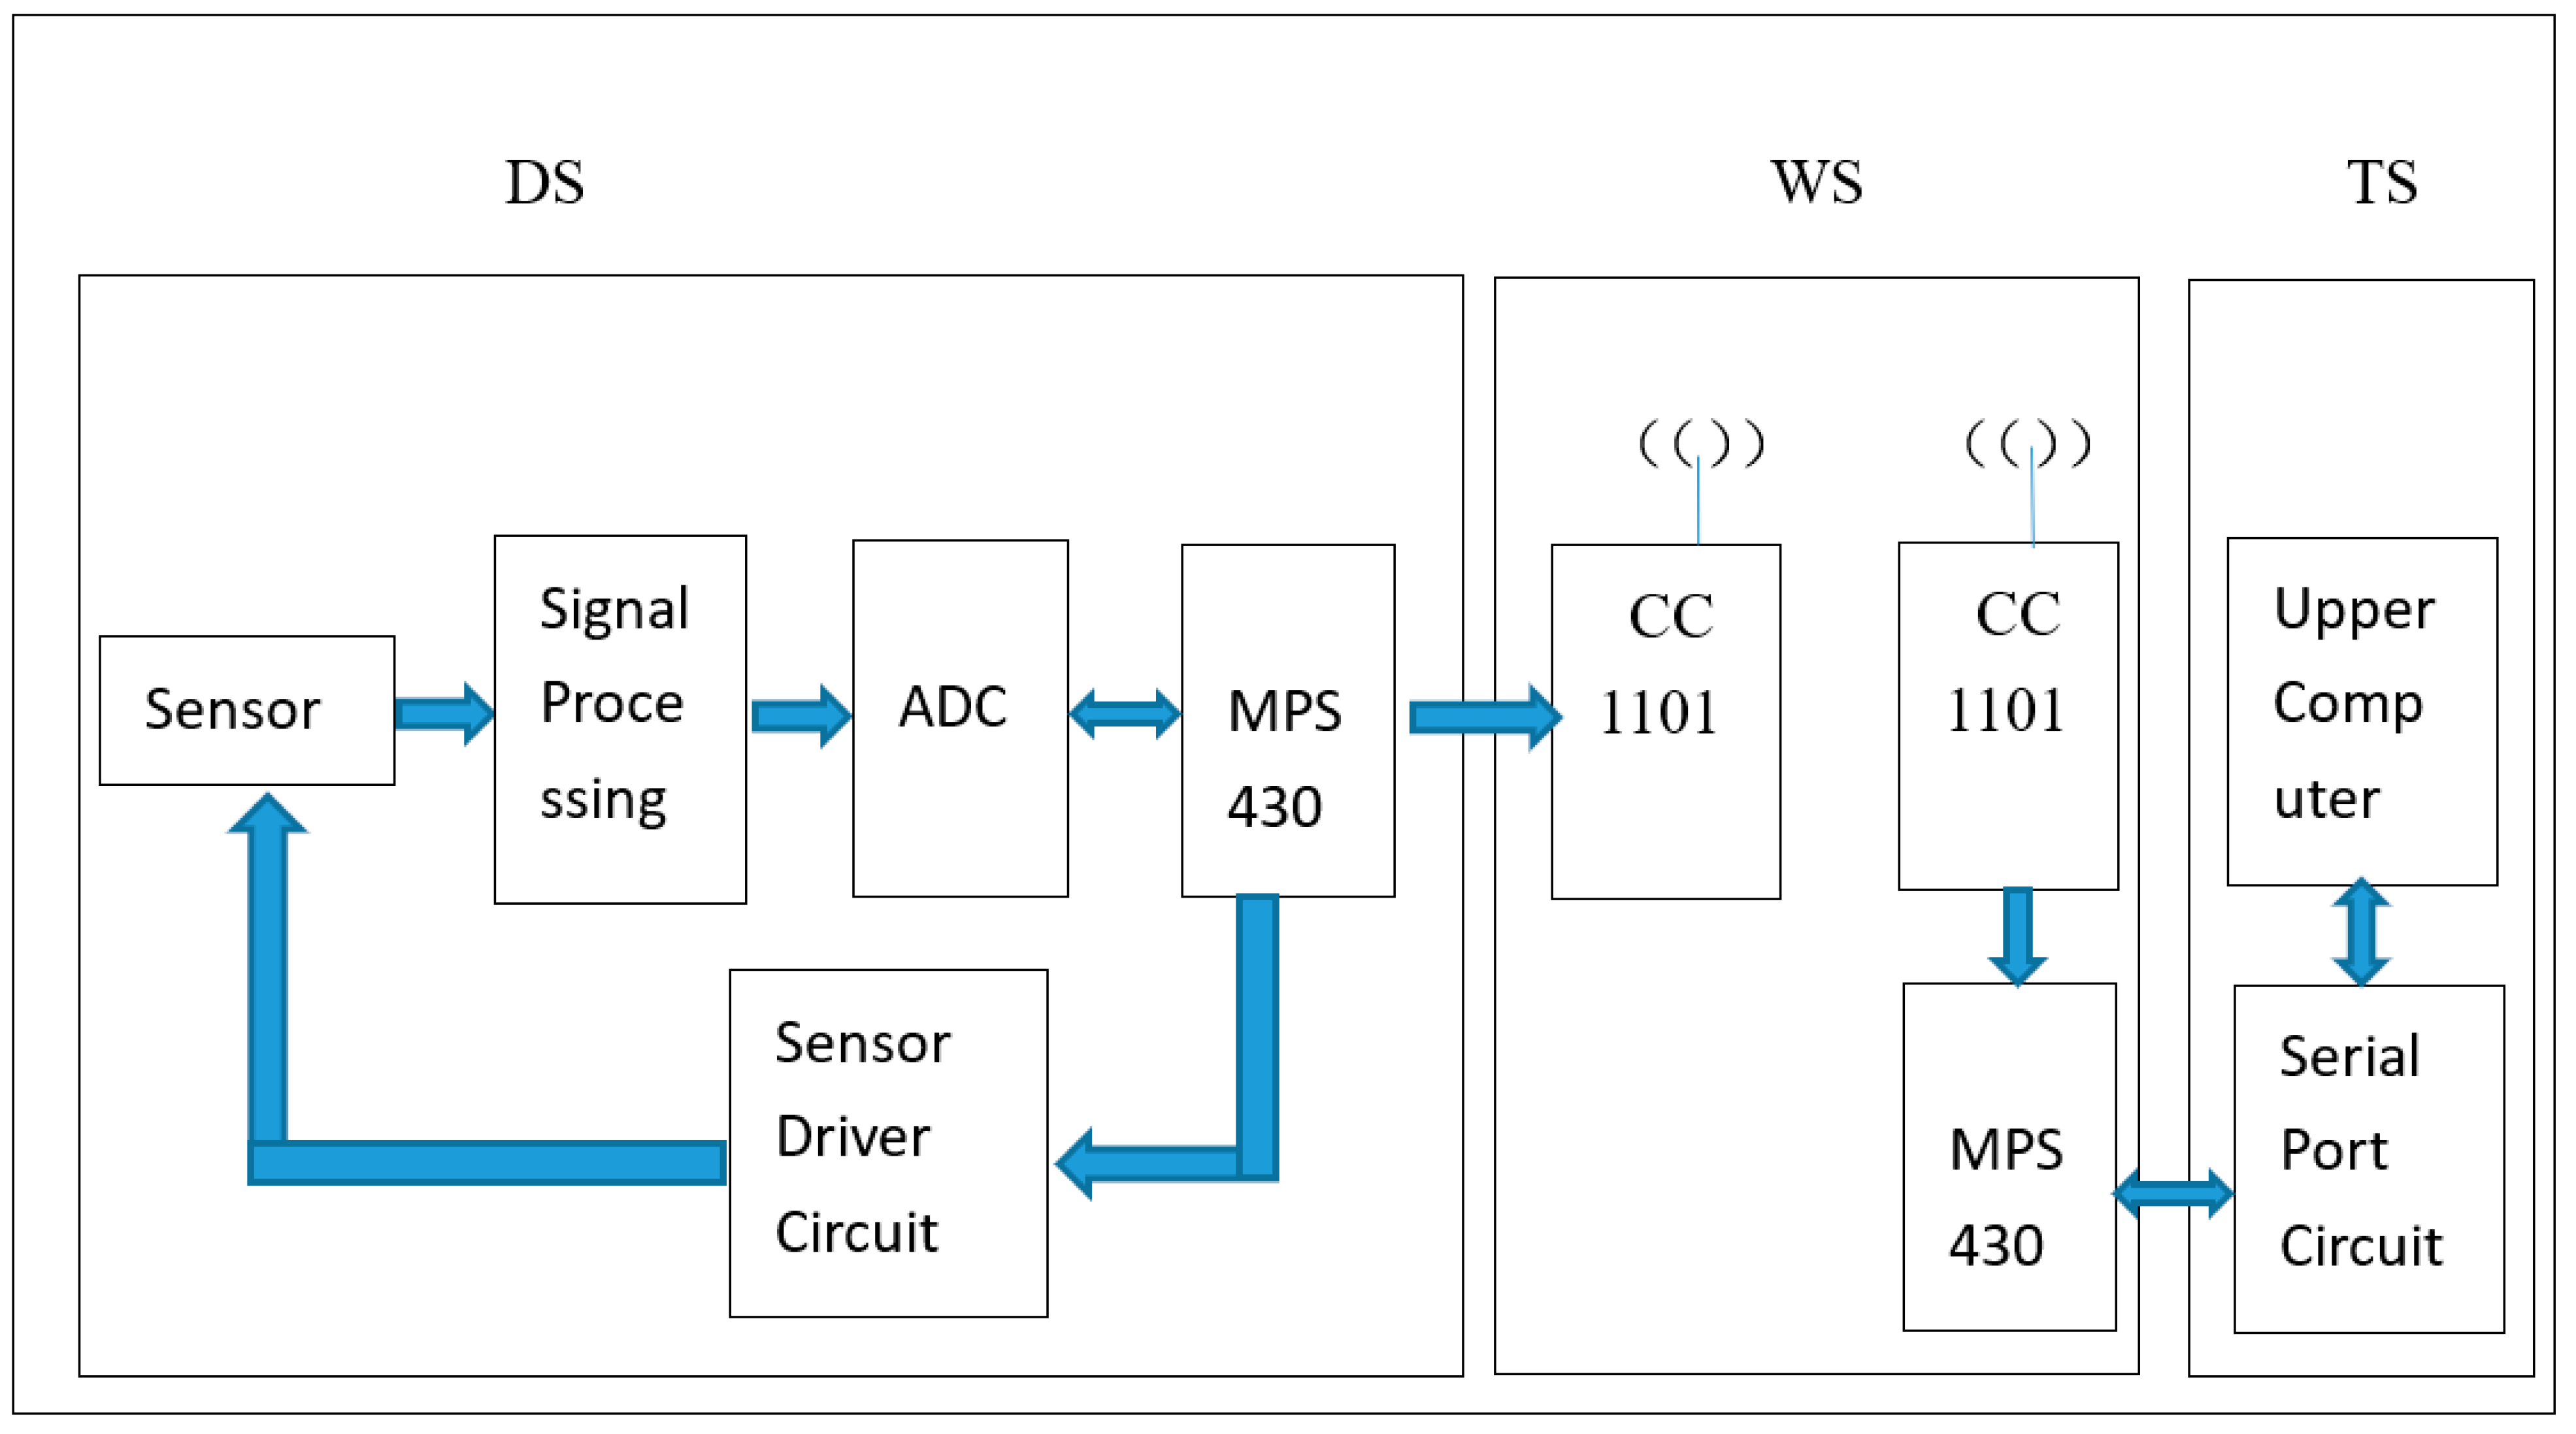
4. On-Line Monitoring System
5. Conclusions
Author Contributions
Funding
Institutional Review Board Statement
Informed Consent Statement
Data Availability Statement
Conflicts of Interest
References
- Marlinda, A.R.; An’amt, M.N.; Yusoff, N.; Sagadevan, S.; Wahab, Y.A.; Johan, M.R. Recent progress in nitrates and nitrites sensor with graphene-based nanocomposites as electrocatalysts. Trends Environ. Anal. Chem. 2022, 34, e00162. [Google Scholar] [CrossRef]
- Tan, J.F.; Anastasi, A.; Chandra, S. Electrochemical detection of nitrate, nitrite and ammonium for on-site water quality monitoring. Curr. Opin. Electrochem. 2022, 32, 100926. [Google Scholar] [CrossRef]
- Kim, M.-Y.; Lee, J.-W.; Park, D.J.; Lee, J.-Y.; Myung, N.V.; Kwon, S.H.; Lee, K.H. Highly stable potentiometric sensor with reduced graphene oxide aerogel as a solid contact for detection of nitrate and calcium ions. J. Electroanal. Chem. 2021, 897, 115553. [Google Scholar] [CrossRef]
- Zhang, Z.; Zhang, X.; Rajh, T.; Guha, S. Photonic microresonator based sensor for selective nitrate ion detection. Sens. Actuators B. Chem. 2021, 328, 129027. [Google Scholar] [CrossRef]
- Desai, R.; Marti, M.; Nathan, V.; Lawrence, S.; Davis, J. Green approaches to field nitrate analysis: An electroanalytical perspective. Electroanalysis 2009, 21, 789–796. [Google Scholar] [CrossRef]
- Moorcroft, M.J.; Davis, J.; Compton, R.G. Detection and determination of nitrate and nitrite: A review. Talanta 2001, 54, 785–803. [Google Scholar] [CrossRef]
- Catalan-Carrio, R.; Saez, J.; Fern, L.A.; Arana, G.; Basabe-Desmonts, L.; Benito-Lopez, F. Ionogel-based hybrid polymer-paper handheld platform for nitrite and nitrate determination in water samples. Anal. Chim. Acta 2022, 1205, 339753. [Google Scholar] [CrossRef] [PubMed]
- Wu, K.; Fei, M.; Li, Z.; Wei, C.; Gan, F.; Du, C. In-situ rapid monitoring of nitrate in urban water bodies using Fourier transform infrared attenuated total reflectance spectroscopy (FTIR-ATR) coupled with deconvolution algorithm. J. Environ. Manag. 2022, 317, 115452. [Google Scholar] [CrossRef]
- Amali, R.K.A.; Lim, H.N.; Ibrahim, I.; Zainal, Z.; Ahmad, S.A.A. Silver nanoparticles-loaded copper (II)-terephthalate framework nanocomposite as a screen-printed carbon electrode modifier for amperometric nitrate detection. J. Electroanal. Chem. 2022, 918, 116440. [Google Scholar] [CrossRef]
- Moo, Y.C.; Matjafri, M.Z.; Lim, H.S.; Tan, C.H. New development of optical fibre sensor for determination of nitrateand nitrite in water. Optik 2016, 127, 1312–1319. [Google Scholar] [CrossRef]
- Camas-Anzueto, J.; Aguilar-Castillejos, A.; Castañón-González, J.; Lujpán-Hidalgo, M.; de León, H.H.; Grajales, R.M. Fiber sensor based on Lophine sensitive layer for nitrate detection in drinking water. Opt. Lasers Eng. 2014, 60, 38–43. [Google Scholar] [CrossRef]
- Akyuz, M.; Ata, S. Determination of low level nitrite and nitrate in biological, food and environmental samples by gas chromatographymass spectrometry and liquid chromatography with fluorescence detection. Talanta 2009, 79, 900–904. [Google Scholar] [CrossRef] [PubMed]
- Helaleh, M.I.H.; Korenaga, T. Ion chromatographic method for simultaneous determination of nitrate and nitrite in human saliva. J. Chromatogr. B 2000, 744, 433–437. [Google Scholar] [CrossRef]
- Jimidar, M.; Hartmann, C.; Cousement, N.; Massart, D.L. Determination of nitrate and nitrite in vegetables by capillary electrophoresis with indirect detection. J. Chromatogr. A 1995, 706, 479–492. [Google Scholar] [CrossRef]
- Kodamatani, H.; Yamazaki, S.; Saito, K.; Tomiyasu, T.; Komatsu, Y. Selective determination method for measurement of nitrite and nitrate in water samples using high-performance liquid chromatography with postcolumn photo-chemical reaction and chemiluminescence detection. J. Chromatogr. A 2009, 1216, 3163–3167. [Google Scholar] [CrossRef]
- Noroozifar, M.; Khorasani-Motlagh, M.; Taheri, A.; Homayoonfard, M. Application of manganese(IV) dioxide microcolumn for determination and speciation of nitrite and nitrate using a flow injection analysis-flame atomic absorption spectrometry system. Talanta 2007, 71, 359–364. [Google Scholar] [CrossRef]
- Fang, T.; Li, H.; Bo, G.; Lin, K.; Yuan, D.; Ma, J. On-site detection of nitrate plus nitrite in natural water samples using smartphone-based detection. Microchem. J. 2021, 165, 106117. [Google Scholar] [CrossRef]
- Ren, Z.; Ji, G.; Liu, H.; Li, P.; Huang, J.; Lichtfouse, E. Higher performances of open vs. closed circuit microbial fuel cell sensor for nitrate monitoring in water. J. Environ. Chem. Eng. 2022, 10, 107807. [Google Scholar] [CrossRef]
- Yu, L.; Zhang, Q.; Xu, Q.; Jin, D.; Jin, G.; Li, K.; Hu, X. Electrochemical detection of nitrate in PM2.5 with a copper-modified carbon fiber micro-disk electrode. Talanta 2015, 143, 245–253. [Google Scholar] [CrossRef] [PubMed]
- Stortini, A.M.; Moretto, L.M.; Mardeganb, A.; Ongaro, M.; Ugo, P. Arrays of copper nanowire electrodes: Preparation, characterization and application as nitrate sensor. Sens. Actuators B 2015, 207, 186–192. [Google Scholar] [CrossRef]
- da Silva, I.S.; de Araujo, W.R.; Paixão, T.R.; Angnes, L. Direct nitrate sensing in water using an array of copper microelectrodes from flat flexible cables. Sens. Actuators B Chem. 2013, 188, 94–98. [Google Scholar] [CrossRef]
- Dohyun, K.; Ira, B.G.; Jack, W.J. Chronocoulometric determination of nitrate on silver electrode and sodium hydroxide electrolyte. Analyst 2007, 132, 350–357. [Google Scholar]
- Ren, W.; Mura, S.; Irudayaraj, J.M.K. Modified graphene oxide sensors for ultra-sensitive detection of nitrate ions in water. Talanta 2015, 143, 234–239. [Google Scholar] [CrossRef]
- Zhad, H.R.L.Z.; Lai, R.Y. Comparison of nanostructured silver modified silver and carbon ultramicroelectrodes for electrochemical detection of nitrate. Anal. Chim. Acta 2015, 892, 153–159. [Google Scholar] [CrossRef] [PubMed]
- Akhter, F.; Alahi, M.E.E.; Mukhopadhyay, S.C. An IoT-enabled portable sensing system with MWCNTs/PDMS sensor for nitrate detection in water. Measurement 2021, 178, 109424. [Google Scholar] [CrossRef]
- Siddiqui, H.; Chauhan, V.; Sathish, N.; Kumar, S. Electrochemical 3D printed copper garden for nitrate detection. Mater. Lett. 2021, 305, 130795. [Google Scholar] [CrossRef]
- Gamboa, J.C.M.; Peña, R.C.; Paixão, T.R.L.C.; Bertotti, M. A renewable copper electrode as an amperometric flow detector for nitrate determination in mineral water and soft drink samples. Talanta 2009, 80, 581–585. [Google Scholar] [CrossRef]
- Ward-Jones, S.; Simm, A.O.; Jiang, L.; Compton, R.G. An in situ copper plated boron-doped diamond microelectrode array for the sensitive electrochemical detection of nitrate. Electroanalysis 2005, 17, 1806–1815. [Google Scholar] [CrossRef]
- Thiago, R.L.C.P.; Juliana, L.C.; Mauro, B. Determination of nitrate in mineral water and sausage samples by using a renewable in situ copper modified electrode. Talanta 2007, 71, 186–191. [Google Scholar]
- Li, Y.; Sun, J.; Bian, C.; Tong, J.; Dong, H.; Zhang, H.; Xia, S. Copper nano-clusters prepared by one-step electrodeposition and its application on nitrate sensing. AIP Adv. 2015, 5, 041312–041317. [Google Scholar] [CrossRef]
- Li, Y.; Sun, J.; Bian, C.; Tong, J.; Xia, S. Micro electrochemical sensor with copper nanoclusters for nitrate determination in freshwaters. IET Micro Nano Lett. 2012, 7, 1197–1201. [Google Scholar] [CrossRef]
- Gao, X. Environmental Monitoring Transmission Node Wireless Transmission Low-Power Design. Master’s Thesis, North University of China (Taiyuan), Taiyuan, China, 2022. [Google Scholar]


| Detection Phase | Working Potential (mV) | Duration Time (s) |
|---|---|---|
| Cleaning | +140 | 10 |
| Modification | −400 | 4 |
| Detection | −597 | 1 |
Disclaimer/Publisher’s Note: The statements, opinions and data contained in all publications are solely those of the individual author(s) and contributor(s) and not of MDPI and/or the editor(s). MDPI and/or the editor(s) disclaim responsibility for any injury to people or property resulting from any ideas, methods, instructions or products referred to in the content. |
© 2023 by the authors. Licensee MDPI, Basel, Switzerland. This article is an open access article distributed under the terms and conditions of the Creative Commons Attribution (CC BY) license (https://creativecommons.org/licenses/by/4.0/).
Share and Cite
Xiong, R.; Li, Y.; Ren, Z. Research on On-Line Detection Method and System for Nitrate in Groundwater. Appl. Sci. 2023, 13, 9743. https://doi.org/10.3390/app13179743
Xiong R, Li Y, Ren Z. Research on On-Line Detection Method and System for Nitrate in Groundwater. Applied Sciences. 2023; 13(17):9743. https://doi.org/10.3390/app13179743
Chicago/Turabian StyleXiong, Rong, Yang Li, and Zhenxing Ren. 2023. "Research on On-Line Detection Method and System for Nitrate in Groundwater" Applied Sciences 13, no. 17: 9743. https://doi.org/10.3390/app13179743
APA StyleXiong, R., Li, Y., & Ren, Z. (2023). Research on On-Line Detection Method and System for Nitrate in Groundwater. Applied Sciences, 13(17), 9743. https://doi.org/10.3390/app13179743