Abstract
Oyster mushroom (Pleurotus ostreatus) is the second most widely cultivated mushroom worldwide but has a short shelf-life due to its high moisture content. Osmodehydrofreezing, including a step of osmotic dehydration (OD) prior to freezing, can be applied to extend product shelf life and preserve its quality characteristics. In this study, the effect of glycerol concentration (30–50%), temperature (30–50 °C), and immersion time (20–190 min) on mass transfer properties (WL, SG, aw, %moisture content, salt intake) and important quality indices (color and texture) was investigated. Experiments were conducted using a Box–Behnken Design with three factors at three levels, second order equations were used to describe all measured parameters (following the Response Surface Methodology principles), and preselected desirability functions were used to set the acceptability criteria for optimization. The optimized conditions were found to be 38.7 °C, 30% glycerol, and 130 min of immersion time. To maximize OD effect, an initial step was investigated, using the side streams of rose flowers distillation (ODR samples), aiming at enriching samples with bioactive compounds. Frozen OD and ODR samples demonstrated a significant improvement in color and texture retention, and suffered from a reduced drip loss after thawing, compared to their untreated counterparts.
1. Introduction
Oyster mushrooms (Pleurotus ostreatus) are the second most widely cultivated mushrooms in the world [1,2]. They have attracted increased attention due to their nutritional value and delicious taste [3]. Oyster mushrooms contain over 13 vitamins, such as Vitamin B groups and Vitamin C. It is worth mentioning that Vitamin B3 content in oyster mushroom is 5–10 times higher compared to any other vegetable, and calcium, phosphorus, and iron (with high bioavailability) content is approximately double the amount available in beef and pork meat [4]. In addition, mushrooms have a high percentage of high-quality proteins, containing all essential amino acids required by humans [2]. Therefore, mushrooms are considered a good substitute for high-protein foods that are also known as "meat free" (meat analogues), such as beef/chicken patties, nuggets, and sausages [5,6,7].
On the other hand, edible mushrooms degrade very quickly and lose their quality after harvest, mainly due to their high moisture content (85–95%, wet basis) which fosters microbial activities, high respiration rate, vulnerable texture, and high enzymatic activities [2,8]. The short shelf life of mushrooms causes difficulties in their distribution and marketing as fresh products, limits the amount of consumption, and has economic consequences. Generally, fresh oyster mushrooms can be stored for 8–11 days at 0 °C, 4–6 days at 5 °C, 2–3 days at 10 °C, and 1–2 days at 20 °C [2,3].
Dehydration, as a sole technique or in combination with other methods, is one of the most common treatments to extend the shelf life of foods. Techniques that are commonly used to produce dried mushrooms include conventional hot air drying, solar drying, sun-drying, oven drying, and microwave drying [2,3,8]. However, these methods require high temperatures and long processing times, resulting in alterations in the color and nutritional value of the final product. An alternative, mild dehydration method is osmotic dehydration (OD). OD involves the immersion of food in hypertonic solutions (composed of sugars, salts, or other solutes), leading to: (a) the removal of water from samples into osmotic solution, (b) the import of osmotic solutes from osmotic solution into the samples, and (c) the transfer of certain soluble solids from the food sample (including sugar, phenolic compounds, and minerals) to the hypertonic solution [9,10,11]. The driving force of mass transfer is the concentration difference on either side of the food cell membrane [12]. The mass transfer phenomena stop when chemical balance between the mediums is reached [13]. Osmotic dehydration helps to extend the shelf life of products by removing water, which inhibits microbial growth and enzymatic reactions [11]. The effectiveness of osmotic dehydration is influenced by three crucial factors: temperature, osmosis time, and osmotic solution concentration. Temperature plays a significant role in osmotic dehydration as it directly impacts the rate of water diffusion. Although higher temperatures lead to faster water extraction from the food material, excessively elevated temperatures can cause undesirable textural and color changes, so careful control of the process temperature is essential. For immersion time, a longer duration of osmosis allows for deeper penetration of the osmotic solution into the food, resulting in increased water loss and better preservation. Nevertheless, an excessively extended osmosis time might lead to excessive solutes uptake, altering the taste of the product. Lastly, the concentration of the osmotic solution significantly influences the process. A higher concentration of solutes creates a steeper osmotic pressure, driving more water out of the food material. However, using extremely concentrated solutions may cause a reverse osmotic effect, causing water uptake instead of removal [13,14,15].
Nonetheless, the reduction of moisture does not ensure the inhibition of microbial growth, and thus supplementary methods such as drying, refrigeration, freezing, or pasteurization are required [13,16]. The application of OD followed by conventional freezing is called osmodehydrofreezing (ODF). The reduction of moisture and increase in solid content of products caused by the osmotic process will lead to an improvement in nutritional quality, reduction in drip loss, and better retention of color and texture in thawed fruits and vegetables. Moreover, a reduction in moisture content lowers the refrigeration load during freezing, the size of ice crystals, and the cost of packaging, distribution, and storage [9,16,17,18]. Other advantages of the ODF process are the simplicity of the treatment, the reduced energy and cost as compared to common drying and freezing techniques (a savings of 27% for dehydrofreezing as compared with conventional freezing), the inhibition of enzymatic browning, and the minimum loss of natural flavor and color due to the mild temperatures that are usually used [11,18,19]. ODF has been successfully applied to apples [20,21], strawberries [22], carrots [23], broccoli [18], mangoes [24], and pears [25], but there are only a few studies on mushrooms. During storage under freezing conditions, mushrooms can undergo enzymatic browning, a natural process that occurs due to the oxidation of phenolic compounds in their tissues, as well as damage of their structure [26], leading to a substantial reduction in their quality. The browning of mushrooms during freezing is among the greatest challenges for the frozen mushroom industry [27]. Besides post-harvest handling, browning of mushrooms is mainly related to the activity of enzymes known as polyphenol oxidase (PPO), which include mostly tyrosinase, catechol oxidase, and laccase. When mushrooms are exposed to low temperatures, the activity of polyphenol oxidase enzymes is not completely inhibited, leading to enzymatic browning. This enzymatic browning can result in undesirable changes in the appearance of mushrooms, with the development of darkened spots or discoloration on their surfaces. Although freezing effectively preserves the overall quality of mushrooms by slowing down other enzymatic and microbial reactions, precautions must be taken to minimize enzymatic browning during storage. Techniques like blanching, vacuum impregnation, or washing before freezing can help minimize the impact of enzymatic browning, ensuring that mushrooms retain their fresh appearance and quality for extended periods in frozen storage [27,28,29,30]. In this context, the use of antioxidant treatments as a preliminary anti-browning process has been also investigated, especially by replacing metabisulfites with compounds that can be naturally retrieved from plants, which can also inhibit PPO activity and the resulting enzymatic browning. Among them, rose hydrosols (by-products produced by steam distillation of aromatic plant materials) have been found to reduce enzymatic browning of fresh-cut products, and this beneficial impact may be attributed to the main chemical compounds present, i.e., terpenoids [31,32,33]. In our study, the liquid side streams from Rosa damascena distillation, rich in polyphenols and an acknowledged source of antioxidants [34,35,36], have been used to investigate their potential effect on the stability of dehydrofrozen mushrooms. If proven effective, this approach would assist in finding ways to rationalize the sustainable use of these by-products, which constitute a serious environmental issue regarding their management and disposal, by focusing on the exploitation of compounds of added value.
Considering the increasing interest in the nutritional and pharmaceutical properties of mushrooms, the aim of this study was to investigate an optimized composite procedure, i.e., osmotic dehydration followed by commercial freezing, so to provide a final frozen product of improved quality and extended shelf life. In the proposed process, the osmotic dehydration step was considered to be the key step, and, therefore, the Response Surface Methodology (RSM) was used to optimize the OD process, setting appropriate criteria through predefined desirability functions. The optimal conditions were corroborated by an independent validation study. Moreover, to extend the positive effect of OD on frozen mushroom quality, a further process step was investigated: a preliminary enrichment with bioactive compounds from Rosa damascena by-products. The aim of this additional treatment was to evaluate the potential effectiveness of such a side stream of the essential oils distillation industry to stabilize color in frozen mushrooms [29].
2. Materials and Methods
2.1. Sample Preparation
Fresh, edible oyster mushrooms were obtained from the local company “DIRFIS MUSHROOMS” with an initial moisture content of 90.85 ± 1.34% (wet basis, wb). The water content was measured after vacuum drying at 70 °C (Heraeus Instruments Vacutherm, ThermoScientific, Waltham, MA, USA) for 24 h, according to the official method [37]. Each measurement was carried out in three replicates to estimate the average value and standard deviation. Mushrooms of uniform size were selected, washed to remove dirt, and then dried on a blotting paper. Samples were immediately immersed in freshly prepared osmotic solutions.
2.2. Osmotic Dehydration
The first phase of the current study included kinetic experiments aiming at optimizing the OD process prior to freezing. During osmotic dehydration, the impact of the three main factors of the process (solution concentration, immersion time, and temperature) was investigated, and a polynomial model was proposed to describe the main effects of the procedure on mass transfer (WL, SG), water activity (aw), and quality attributes (color, texture, salt intake). Food grade glycerol (Honeywell Specialty Chemicals Seelze GmbH) and food grade calcium chloride (Chem-Lab NV) were purchased from local providers. According to the results of preliminary experiments and previously published data [38,39,40,41,42], the OD conditions used included a processing temperature (30–50 °C), immersion time (20–190 min), and a concentration of osmotic solution, including glycerol (30–50%), salt (NaCl 5%), and calcium chloride (CaCl2 1.5%). The application of calcium chloride aims at minimizing tissue damage [43]. For each experiment, the ratio of sample to osmotic solution was maintained constant at 1:15 (w/w) (based on preliminary experiments) to avoid significant dilution of the medium by water removal, which would lead to a local reduction of the osmotic driving force during the process.
2.3. Calculation of Mass Transport Parameters during Osmotic Dehydration
During osmotic dehydration, mass transfer parameters were calculated in terms of water loss (WL) and solid gain (SG) according to the following equations (Equations (1) and (2)):
where M0 is the initial mass of fresh material before the OD, M is the mass of mushroom samples after time t of OD, m is the dry mass of mushrooms after time t of OD, and m0 is the dry mass of untreated material [44].
2.4. Physicochemical Measurements during Osmotic Dehydration
Water activity of oyster mushrooms and °Brix of the hypertonic osmotic solution were measured by an aw-meter (AquaLab Dew Point Water Activity Meter 4TE, METERGroup, Inc., Pullman, WA, USA) and by a hand-held refractometer (Atago, Master refractometer, Yorii, Japan), respectively. The color of the samples was determined with a tristimulus chromatometer (model CR-400, Minolta, Tokyo, Japan) calibrated with a white standard plate (L*: 97.83, a*: −0.45, b*: +1.88). The CIELAB color scales were used, with coordinates (L*, a*, b*) being directly read from the chromameter. The total color change (ΔE) was calculated according to Equation (3):
where ΔE is the total color change, L*, a*, and b* are the luminosity, redness, and yellowness of the samples, respectively. Subscripts “t” and “0” are referring to time t and zero, respectively [3,10,45]. All measurements were performed in triplicate.
A Texture Analyzer (TA-XT2i of Stable Micro Systems, Godalming, UK) was used for texture analysis of all samples, and a TPA (Texture Profile Analysis) test was carried out. The test was performed on a non-lubricated flat platform, using a 6 mm cylindrical compression probe and a 25 Kg load cell, under the following instrument parameters: pre-test speed—5 mm/s; test speed—2 mm/s; post-test speed—5 mm/s, at 50% deformation. Texture characteristics, such as hardness, were calculated [45,46]. All measurements were performed in triplicate.
Salt intake was measured using silver nitrate solution by the Mohr Method with some modifications [37]. More specifically, 2 g of finely chopped mushrooms were taken and put into a beaker with 250 mL distilled water. After 10 min, the solution was filtered, and 50 mL of final solution was put into an Erlenmeyer flask. A total of 1 mL of K2CrO4 (indicator) was added. The burette was filled with 0.1 N of AgNO3, and the samples were titrated until the first perceptible pale red color. The color should remain constant for 30 s. Titration volume was recorded. Calculations were based on the following reaction:
2.5. Experimental Design for Osmotic Dehydration Optimization
The Response Surface Methodology (RSM) was used to investigate the effect of glycerol concentration (30–50%), process temperature (30–50 °C), and immersion time (20–190 min), to obtain the optimal osmotic process parameters for mushroom treatment. Experiments, performed in triplicate, were conducted using a Box–Behnken Design with three factors at three levels, including fifteen experiments formed by three central points (Table 1), and the indices measured included mass transfer parameters (WL, SG, aw, and moisture content), physicochemical (salt intake), and selected quality indices (color and texture).

Table 1.
Experimental data for three variables and three levels or Response Surface analysis.
A second order polynomial model was chosen for the description of the response variables Y as a function of the factor variables Xi/Xj (concentration in the osmotic solution (C, 30, 40, and 50% glycerol), osmotic process temperature (T, 30, 40, and 50 °C), and immersion time (t, 70, 100, and 130 min)) (Equation (4)) [47], as follows:
where aο is the constant, ai is the linear, aii is the quadratic, and aij is the interaction effect of the factors. Positive values of the equation coefficient indicate a promoting effect on the response, whereas a negative value reflects an opposite relationship between the factor and response. Once the coefficients of Equation (4) have been mathematically determined, an analysis of variance (ANOVA) is applied to assess how well the model describes the data via the associated p value.
Once the models have been constructed, the next step involves the optimization of the process, based on the implementation of the appropriate desirability functions, as proposed by Costa et al., 2011 [48]. Using RSM principles, appropriate mathematical models are constructed and statistically assessed to investigate the relationship between process parameters and responses of interest, aiming at determining optimum conditions [49]. The final stage of this methodology may consist of the simultaneous optimization of different, even conflicting criteria, mathematically described by appropriate desirability functions [50]. In the present study, the main aim of the optimization of OD process was to produce a final mushroom piece of intermediate moisture, which, when submitted to subsequent frozen storage, would preserve its quality characteristics (color, texture, drip loss) even after thawing. For that reason, proper desirability functions were applied on the second order models in order to estimate the optimized process parameters (independent variables), i.e., osmotic solution concentration, temperature, and dehydration time, which would fulfill specific criteria for the dependent factors, i.e., derive minimum aw, and, at the same time, maximum lightness preservation (L/L0), with a minimum value of 0.8 (based on a preliminary sensory test, where color change was set as the rejection criterion).
2.6. Bioactive Compounds Impregnation before the Optimized OD Process
In a second phase of our study, a composite process was investigated in which an enrichment step was applied prior to OD as a separate step, as described in [51]. For the impregnation of mushroom pieces, aqueous by-products from the Rosa damascena distillation process were used. For that purpose, samples were immersed in the solution of by-products (1:10) for 10 min, and then pre-weighed amounts of the osmotic materials (namely glucerol, salt, and calcium chloride) were added to apply the osmotic step. Osmosis continues until the end of the procedure (total time: 130 min). OD took place at the optimized conditions, as estimated by implementing the methodology detailed in Section 2.5.
2.7. Determination of Total Phenolic Content (TPC) during Bioactive Compounds Impregnation
The total phenolic content (TPC) of wastewater solutions from the steam distillation of Rosa damascena was measured using the modified Folin Ciocalteu’s micromethod, as reported in [52]. The TPC of the osmotically treated samples (ODR) was also determined during the impregnation procedure to assess bioactive compound immersion within mushroom tissue. Each measurement was performed three times.
2.8. Determination of Quality Degradation during Frozen Storage
In a third, discrete stage of our study, a comparative stability study was conducted during frozen storage, aiming at investigating the effect of the pretreatments implemented on the quality degradation of frozen mushrooms. Osmotically treated at optimum conditions, with (ODR) and without (OD) former impregnation into Rosa damascena by-products, and control (C) samples were stored at −18 °C for ~5 months using shield packaging (PET 12/PE 60–450 mm). To estimate the effect of osmotic dehydration on frozen oyster mushrooms, some significant quality parameters were monitored. As an important marker of quality of frozen products, drip loss during the thawing process was calculated using Equation (5). Frozen samples were allowed to thaw on a previously weighed absorbent paper, at ambient temperature, for ~50 min. Drip loss was then calculated by weighing the absorbent paper [53].
where w0 is the weight of the dry absorbent paper (g), wt is the weight of the wet absorbent paper at time t (g), and ws is the weight of the frozen sample (g).
Additionally, color and texture changes of thawed samples were calculated. For total color change, Equation (3) was used. For texture, a TPA test was carried out as described in Section 2.4, and hardness was measured as the highest peak of the first down and up cycle (N). Three replicate runs were carried out for each parameter.
2.9. Statistical Analysis
Using STATISTICA 12.0 (Stat. Soft Inc., Tulsa, OK, USA), polynomial equations from the RSM methodology were statistically analyzed using analysis of variance (ANOVA), and Tukey’s HSD test was used to determine whether there were any significant differences in the mean values of the measured indices (at a probability level p < 0.05). Mass transfer factors were also subjected to multivariate analysis using principal component analysis (PCA) to further explore any specific interrelationships. Minitab® was used to analyze the Box–Behnken design and optimize the dependent variable using the tool of desirability functions (DOE-response surface application).
3. Results and Discussion
In the first stage of the experiments, osmotic dehydration was applied as a single pre-treatment on mushrooms prior to freezing, with the goal of deriving the optimized conditions. Detailed results on OD kinetics and the optimization approach are described in Section 3.1, Section 3.2 and Section 3.3.
3.1. Determination of Factor Interactions during Osmotic Dehydration, RSM Methodology
The coefficients of Equation (4) are presented in Table 2, indicatively for four of the main dependent variables related to mass transfer during OD, which were investigated at the first stage of our study, that aimed at optimizing the OD process. The same statistical analysis has been performed for all other parameters measured during OD, as described in Section 2.5. An asterisk sign accounts for p value < 0.05 and shows which coefficients are statistically significant, at a confidence level of 95%. In this context, aw, WL, and SG values are influenced mostly by temperature (a1/a11), as compared to glycerol concentration (a2) and time duration (a3). Regarding synergistic effects, interactions between glycerol concentration with temperature and time, and temperature with glycerol concentration and time, were not found to have a significant effect on any of the mass transfer factors measured. Regarding the statistical analysis via ANOVA, in order to assess the goodness of fit, the coefficient of correlation R2 (adj.) estimates suggest that the models represent raw data in a satisfactory way and can be implemented to describe the design space [54].
Table 2.
Mass transfer parameter effect based on the second order polynomial model and statistical ANOVA table overview (coefficients of parameters and the respective p-values are depicted).
3.2. Effect of Independent Values on Mass Transfer Variables (aw, WL, SG, and %MC)
The interaction effect of independent variables (glycerol concentration, OD temperature, and duration of osmosis) on the response can be better illustrated by a 3-dimensional (3D) surface graph, applying a color spectrum. The highest values are represented by the dark red color, intermediate values by the yellow, and the lowest values by the dark green color. The three-dimensional response surface graphs depict the combined effect of the independent variables (time, temperature, and OD solution concentration) on the dependent variables studied. In these graphs, plots are constructed as a function of two variables while keeping the third variable constant (at the central value, as presented in Table 1).
The interactions of glycerol concentration and osmosis time at 40 °C on %moisture content (%MC), water activity (aw), water loss (WL), and solid gain (SG) are shown in Figure 1. The graphs illustrate that %MC and aw decrease significantly as the glycerol concentration increases, with samples which were treated with 50% glycerol reaching the lowest values. Samples treated with 30, 40, and 50% glycerol showed, after 130 min of osmosis, %MC values of 66.73%, 59.79%, and 48.25% (%wb), respectively, and water activity values of 0.8978, 0.8631, and 0.7971, respectively. In general, water activity and moisture content decreased as the OD solution glycerol concentration increased, and the processing time led to higher water removal. The same results were reported by [55] on osmotically dehydrated cheese with glycerol.
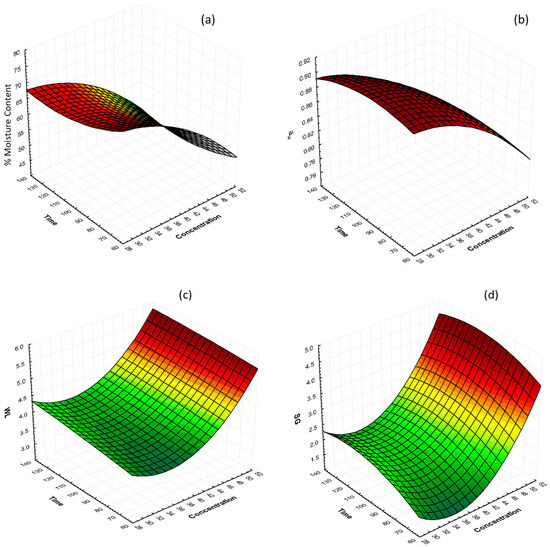
Figure 1.
3D response surface graphs of the effect of OD time and glycerol concentration at constant temperature (40 °C) on (a) % moisture content (%MC, wb), (b) water activity (aw), (c) water loss (g of water/100 g, WL), and (d) solid gain (g of solute/100 g, SG).
Water loss and solid gain values increased during osmotic dehydration. After 130 min of osmosis, the highest WL value was 5.36 g/100 g, and the lowest value was 4.25 g/100 g, which can be observed in the samples that were treated with 50% glycerol and 30% glycerol, respectively. Correspondingly, the highest SG value were 4.05 g/100 g, and the lowest value was 2.14 g/100 g, in samples that were treated with 50% glycerol and 30% glycerol, respectively. The increase in SG and WL with the increase in glycerol concentration could be attributed to the high concentration difference between the mushroom piece and the osmotic solution. The results are in agreement with [55,56,57].
The interactions of glycerol concentration and osmosis time at 40% glycerol on %moisture content (%MC, wb), water activity (aw), water loss (WL), and solid gain (SG) are shown in Figure 2. It can be observed that there is no significant change on %MC as the temperature and the time increase. Small changes can be observed on aw values as the temperature changes, with the lowest values for samples that were treated at 30, 40, and 50 °C being 0.9199, 0.8672, and 0.8612, respectively, after 130 min. WL and SG decrease and then increase as the temperature increases. The lowest values for both WL and SG are observed in the samples treated at 40 °C at 130 min.
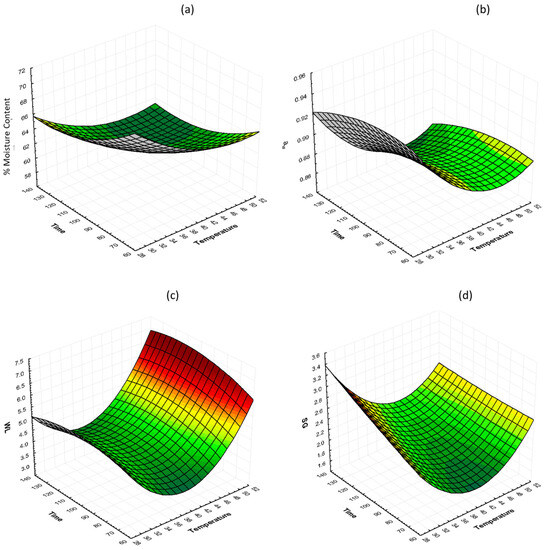
Figure 2.
3D response surface graphs of the effect of OD time and temperature at constant glycerol concentration (40%) on (a) % moisture content (%MC, wb), (b) water activity (aw), (c) water loss (WL), and (d) solid gain (SG).
All mass transfer phenomena showed a rapid change in the early phase of osmosis, and then the rate decreased. The process reached an equilibrium within the first 70–110 min, depending on the conditions applied, and thus osmosis times within this time range were chosen for the upcoming optimization. Our results agree with the findings reported by [57,58].
3.3. Principal Component Analysis (PCA)
In order to further analyze the abovementioned results, Principal Component Analysis (PCA) was used. PCA is a statistical procedure used to summarize the information content in large data tables via a set of new orthogonal variables called principal components [59]. As can be observed from the PCA score plot (Figure 3b), the OD-pretreated mushroom pieces could be divided in six major groups, numbered from 1 to 6. Group 1 contains the samples treated with 50% glycerol at all three temperatures, Group 2 refers to the samples treated with 40% glycerol at all three temperatures, and Group 3 includes the samples treated with 30% glycerol at all three temperatures. Groups 4, 5, and 6 contain the untreated samples (t0 of OD process). Thus, the factor which affected the process the most was the glycerol concentration. These results are in agreement with the findings of [45,58]. Group 1 has the highest values of °Brix of osmotic solution and SG and the lowest of aw and %MC. On the contrary, Group 3 has the lowest values of °Brix and SG and the highest values of aw and %MC. Furthermore, based on Figure 3a and Table 3, the first principal component was positively correlated with %MC and water activity, while it was negatively correlated with SG and salt intake. The second principal component was only positively correlated with °Brix of the osmotic solution.
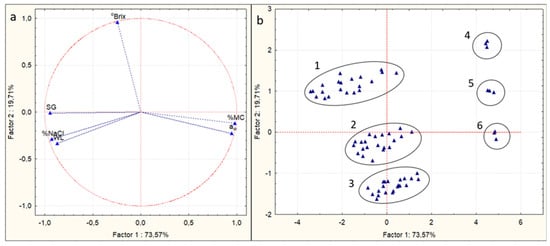
Figure 3.
Principal component analysis to investigate the correlation between %moisture content (%MC, wb), water loss (WL), solid gain (SG), salt intake (%NaCl), °Brix of osmotic solution, and water activity (aw) with the glycerol concentration, temperature, and time of osmosis. (a) Loading plot, (b) score plot. Numbers 1–6 represent the different samples groups.
Table 3.
Factor coordinates of the variables, based on correlations (all).
3.4. Combined Effect of Independent Values on Color of Mushrooms
The effects of glycerol concentration and osmosis time at 40 °C on lightness preservation (L/L0) and total color change (ΔΕ) are shown in Figure 4. It can be observed that, during the process, the lightness decreases and the total color change increases. Moreover, by increasing the glycerol concentration, total color change increased, and lightness retention decreased. Samples treated with 50% glycerol had lower color retention compared to samples treated with 30 and 40% glycerol. The L/L0 values for 30, 40, and 50% glycerol, after 130 min of osmosis, were 0.89, 0.87, and 0.84, respectively, and the ΔΕ values were 8.28, 12.21, and 12.91, respectively. Similar results were reported by [55] on osmotically dehydrated cheese with glycerol.
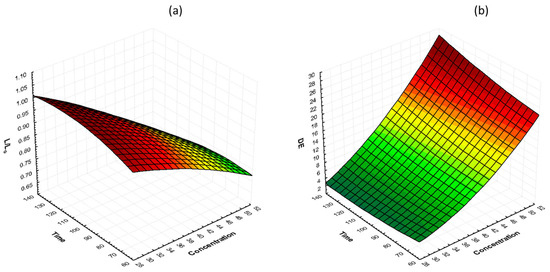
Figure 4.
3D response surface graphs of the effect of OD time and glycerol concentration at a constant temperature (40 °C) on (a) lightness retention (L/L0) and (b) total color change (ΔΕ).
The interactions of glycerol concentration and osmosis time at 40% glycerol on lightness preservation (L/L0) and total color change (ΔΕ) are shown in Figure 5. It can be observed that both temperature and time have a mild effect on lightness retention, with the lowest values being recorded in samples treated at 50 °C. ΔΕ values increase as the temperature increases, and there is no unambiguous change with time of osmosis. However, the influence of glycerol concentration on color was more pronounced than the temperature influence.
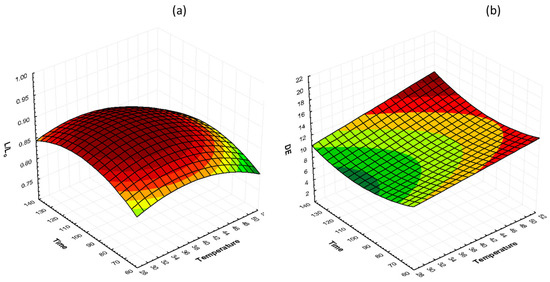
Figure 5.
3D response surface graphs of the effect of OD time and temperature at a constant glycerol concentration (40%) on (a) lightness retention (L/L0) and (b) total color change (ΔΕ).
3.5. Optimization and Validation of the Process
To optimize the process, preset criteria were used, as mentioned in Section 2.5, and the corresponding desirability functions for aw and L/L0 were solved in pair, using Minitab® 17.1.0 (Figure 6). The desirability function approach is one of the most frequently used tools in multi-response optimization techniques in practice. The optimized conditions were found to be 38.7 °C, 30% glycerol, and immersion time equal to 130 min.
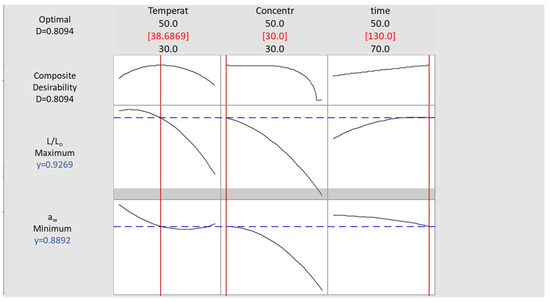
Figure 6.
Desirability plot for OD process parameter optimization, based on preset criteria for aw minimization and L/Lo maximization.
At those optimum conditions, the theoretical values of all dependent variables were estimated using the second order polynomial equations developed, and they are presented in Table 4. Aiming at verifying these theoretical values, three independent experiments were carried out at the optimal conditions. Average values and standard deviations are reported also in Table 4.
Table 4.
Predicted values, experimental values, and %error for the responses at optimum conditions.
3.6. Bioactive Compound Impregnation Using By-Products from Rosa damascena
In the second stage of the experiments, an enrichment step was applied prior to the optimized OD process, as a separate step.
Rosa damascena by-products were measured to have a TPC content of 1539.14 ± 187.43 mg GAE/L. The process of phenolic compound impregnation within the mushroom matrix during the preliminary immersion step in Rosa wastewater, before the subsequent osmotic dehydration, is shown in Figure 7. During the first step (10 min immersion in wastewater), the penetration rate was low; by adding glycerol and NaCl and converting the hypotonic solution to hypertonic, the penetration increased almost three times and was observed to remain stable until the end of the OD procedure. Similar behavior, regarding the rate of phenolics impregnation, was also observed on chicken fillets enriched with phenolics from Origanum vulgare [60] and on eel fillets enriched with phenolics from Rosemary Serum [51].
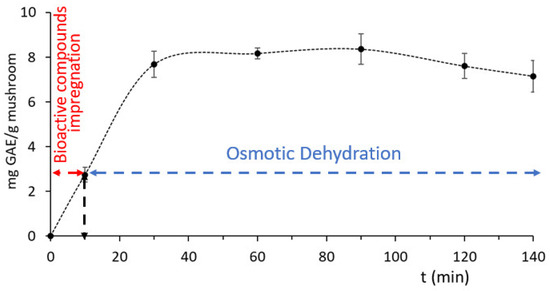
Figure 7.
Impregnation of phenolic compounds from Rosa damascena by-products during osmosis at optimum conditions, expressed as mg gallic acid equivalents (GAE/g Mushroom). Error bars represent the ± standard deviation of measurements.
3.7. Evaluation of Stability of Some Important Quality Attributes during Storage under Frozen Conditions
After having optimized the osmotic dehydration step through RSM principles and attempting to maximize this OD beneficial effect by adding a preliminary anti-browning impregnation, using the side streams of Rosa damascena distillation, a stability study under frozen storage was conducted (third phase of our study). The main purpose of this part of our research was to assess the effectiveness of the pretreatment implemented on the quality retention of mushroom samples, which constitutes the main objective of this work. Color is the most important factor of mushrooms quality, especially during the detrimental subzero frozen storage. Color changes of mushroom samples during frozen storage are presented in Figure 8 and Figure 9. It can be easily observed from Figure 8a that control samples, after being thawed, have a significant reduction in lightness that remains almost constant throughout storage. After thawing, the OD samples have no significant changes during storage under freezing conditions, and ODR samples present a small reduction on lightness during storage. However, there is no significant difference in L values between control and OD samples during storage, with final values being equal to 50.87 (Control) and 49.04 (OD), while ODR reached a value of 42.73. On the contrary, b*-parameter of the control samples increased during storage, while the values of OD and ODR samples remained constant. From a visual observation viewpoint, the control samples turn yellow, and the OD and ODR samples retain their initial color. As far as total color change is concerned, a large difference is observed between treated and untreated samples, with the control samples suffering from an important degradation compared to the OD and ODR samples (Figure 8c). During storage under freezing conditions, the control samples had an average ΔΕ value of 19.29, while the OD and ODR samples had values of 5.27 and 9.00, respectively. The untreated samples have almost four times higher ΔΕ values compared to the OD samples and two times higher compared to the ODR samples.
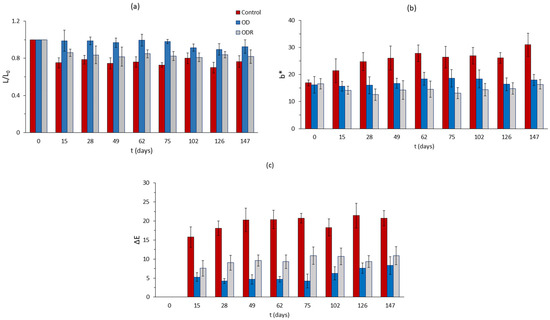
Figure 8.
Color changes of mushroom samples during storage under frozen conditions, expressed as (a) loss of initial lightness (L/L0), (b) change in parameter b*, and (c) total color change, ΔE. Error bars represent the ± standard deviation of measurements.
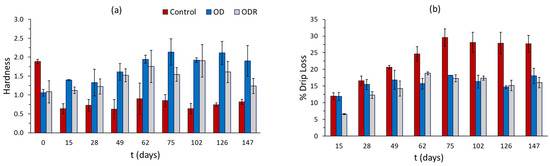
Figure 9.
Changes in (a) hardness and (b) % drip loss of mushroom samples during storage under frozen conditions. Error bars represent the ± standard deviation of measurements.
The changes in the texture of the thawed mushroom samples are presented in Figure 9a,b. It can be observed that the control samples do not maintain their initial compact structure, showing over 60% reduction in their hardness from day 15 until the end of storage and about 28.50% drip loss from day 75. Drip loss after this day remains constant. OD and ODR samples more efficiently maintain their structure, showing a progressive increase in hardness values, which reach 92% and 57%, respectively, after 62 days of storage, a level that remains constant throughout storage. Moreover, OD and ODR samples have lower drip loss values compared to control samples, more specifically, 16.4% for OD and 16.6 for ODR from the 75th day until the end of storage. Previous studies also reported that osmotic dehydration prior to freezing improved the hardness of the final product [9].
Overall, OD and ODR samples preserve their initial visual appearance and texture/structure characteristics to a greater extent compared to untreated samples during frozen storage. Similar results were presented for bananas [61], pears, kiwis, strawberries and apples [20], strawberries [22], apples [62], and mangoes [63].
4. Conclusions
The aim of this study was to investigate the benefits of hurdle technology on the quality of frozen oyster mushrooms. Bioactive compound impregnation, osmotic dehydration, and storage under frozen conditions were used as “hurdles”. Osmosis, as a unique procedure, caused a significant water loss (both water activity and moisture content decrease) in mushroom samples, indicating an extension of product shelf-life. The use of Response Surface Methodology and Box–Behnken Design was proven to be an effective way to determine the optimum OD conditions of oyster mushrooms based on the validation experiment. The optimal conditions for the dehydration of oyster mushrooms were found to be 38.7 °C, 30% glycerol, and 130 min OD immersion time. The mushrooms dehydrated at optimum conditions and enriched with bioactive compounds from Rosa damascena by-products (ODR) seemed to maintain their quality better, exhibiting a reduced total color change and drip loss during frozen storage compared to the untreated samples. However, dehydrofrozen (OD) mushrooms, at the optimum conditions, were also found to equally maintain overall product quality characteristics in a better way compared to the untreated samples after five months of storage. These findings show that the appropriate selection and implementation of successive hurdles can derive products of predesigned quality characteristics (e.g., improved antioxidant content/better appearance and consistency) with increased stability during the—frequently detrimental—conventional frozen storage. Moreover, these results also suggest that side streams, which constitute an important environmental problem, deriving from the distillation of aromatic plants may possess beneficial effects on color stability, which implies that these “wastes” might be promising inhibitors of enzymatic browning for fresh-cut foods.
Author Contributions
Conceptualization, N.A.S. and M.C.G.; methodology, N.A.S. and M.C.G.; validation, N.A.S. and M.C.G.; resources, M.C.G.; data curation, N.A.S.; writing—original draft preparation, N.A.S.; writing—review and editing, M.C.G.; visualization, M.C.G.; supervision, M.C.G.; project administration, M.C.G. All authors have read and agreed to the published version of the manuscript.
Funding
This research received no external funding.
Institutional Review Board Statement
Not applicable.
Informed Consent Statement
Not applicable.
Data Availability Statement
Not applicable.
Conflicts of Interest
The authors declare no conflict of interest.
References
- Bellettini, M.B.; Fiorda, F.A.; Maieves, H.A.; Teixeira, G.L.; Ávila, S.; Hornung, P.S.; Maccari Júnior, A.; Ribani, R.H. Factors affecting mushroom Pleurotus spp. Saudi J. Biol. Sci. 2019, 26, 633–646. [Google Scholar] [CrossRef] [PubMed]
- Kibar, B. Influence of different drying methods and cold storage treatments on the postharvest quality and nutritional properties of P. ostreatus mushroom. Turk. J. Agric. For. 2021, 45, 565–579. [Google Scholar] [CrossRef]
- Ucar, T.M.; Karadag, A. The effects of vacuum and freeze-drying on the physicochemical properties and in vitro digestibility of phenolics in oyster mushroom (Pleurotus ostreatus). J. Food Meas. Charact. 2019, 13, 2298–2309. [Google Scholar] [CrossRef]
- Thakur, M.P. Advances in mushroom production: Key to food, nutritional and employment security: A review. Indian Phytopathol. 2020, 73, 377–395. [Google Scholar] [CrossRef]
- Kim, K.; Choi, B.; Lee, I.; Lee, H.; Kwon, S.; Oh, K.; Kim, A.Y. Bioproduction of mushroom mycelium of Agaricus bisporus by commercial submerged fermentation for the production of meat analogue. J. Sci. Food Agric. 2011, 91, 1561–1568. [Google Scholar] [CrossRef] [PubMed]
- Kumar, P.; Chatli, M.K.; Mehta, N.; Singh, P.; Malav, O.P.; Verma, A.K. Meat analogues: Health promising sustainable meat substitutes. Crit. Rev. Food Sci. Nutr. 2017, 57, 923–932. [Google Scholar] [CrossRef] [PubMed]
- Mohamad Mazlan, M.; Talib, R.A.; Chin, N.L.; Shukri, R.; Taip, F.S.; Mohd Nor, M.Z.; Abdullah, N. Physical and microstructure properties of oyster mushroom-soy protein meat analog via single-screw extrusion. Foods 2020, 9, 1023. [Google Scholar] [CrossRef]
- Thakur, M.P. Advances in post-harvest technology and value additions of edible mushrooms. Indian Phytopathol. 2018, 71, 303–315. [Google Scholar] [CrossRef]
- Alabi, K.P.; Olalusi, A.P.; Olaniyan, A.M.; Fadeyibi, A.; Gabriel, L.O. Effects of osmotic dehydration pretreatment on freezing characteristics and quality of frozen fruits and vegetables. J. Food Process Eng. 2022, 45, e14037. [Google Scholar] [CrossRef]
- Romero, I.P.; Gómez, M.J.R.; Iñiguez, F.M.S.; Magro, P.C. Optimization of the osmotic dehydration process of plums (Prunus Salicina Lindl.) in solutions enriched with inulin, using response surface methodology. LWT 2022, 157, 113092. [Google Scholar] [CrossRef]
- Pandiselvam, R.; Tak, Y.; Olum, E.; Sujayasree, O.J.; Tekgül, Y.; Çalışkan Koç, G.; Kaur, M.; Nayi, P.; Kothakota, A.; Kumar, M. Advanced osmotic dehydration techniques combined with emerging drying methods for sustainable food production: Impact on bioactive components, texture, color, and sensory properties of food. J. Texture Stud. 2021, 53, 737–762. [Google Scholar] [CrossRef] [PubMed]
- Filipović, V.; Filipović, J.; Lončar, B.; Knežević, V.; Nićetin, M.; Filipović, I. Synergetic dehydration method of osmotic treatment in molasses and successive lyophilization of peaches. J. Food Process. Preserv. 2022, 46, e16512. [Google Scholar] [CrossRef]
- Abrahão, F.R.; Corrêa, J.L.G. Osmotic dehydration: More than water loss and solid gain. Crit. Rev. Food Sci. Nutr. 2021, 63, 2970–2989. [Google Scholar] [CrossRef] [PubMed]
- González-Pérez, J.E.; Ramírez-Corona, N.; López-Malo, A. Mass transfer during osmotic dehydration of fruits and vegetables: Process factors and non-thermal methods. Food Eng. Rev. 2021, 13, 344–374. [Google Scholar] [CrossRef]
- Kaur, D.; Singh, M.; Zalpouri, R.; Singh, I. Osmotic dehydration of fruits using unconventional natural sweeteners and non-thermal-assisted technologies: A review. J. Food Process. Preserv. 2022, 46, e16890. [Google Scholar] [CrossRef]
- Giannakourou, M.C.; Dermesonlouoglou, E.K.; Taoukis, P.S. Osmodehydrofreezing: An integrated process for food preservation during frozen storage. Foods 2020, 9, 1042. [Google Scholar] [CrossRef]
- Hajji, W.; Gliguem, H.; Bellagha, S.; Allaf, K. Structural and textural improvements of strawberry fruits by partial water removal prior to conventional freezing process. J. Food Meas. Charact. 2022, 16, 3344–3353. [Google Scholar] [CrossRef]
- James, C.; Purnell, G.; James, S.J. A critical review of dehydrofreezing of fruits and vegetables. Food Bioprocess Technol. 2014, 7, 1219–1234. [Google Scholar] [CrossRef]
- Coimbra, L.M.P.D.L.; Zagmignan, A.; Gomes, P.V.V.; Araujo, J.F.; Santos, G.D.C.D.; Miranda, R.D.C.M.D.; Salgado, S.M.; Andrade, S.A.C.; Nascimento da Silva, L.C. Optimization of osmotic dehydration of Sapodilla (Achras zapota L.). Foods 2022, 11, 794. [Google Scholar] [CrossRef]
- Marani, C.M.; Agnelli, M.E.; Mascheroni, R.H. Osmo-frozen fruits: Mass transfer and quality evaluation. J. Food Eng. 2007, 79, 1122–1130. [Google Scholar] [CrossRef]
- Said, L.B.H.; Bellagha, S.; Allaf, K. Dehydrofreezing of apple fruits: Freezing profiles, freezing characteristics, and texture variation. Food Bioprocess. Technol. 2015, 9, 252–261. [Google Scholar] [CrossRef]
- Dermesonlouoglou, E.K.; Giannakourou, M.; Taoukis, P.S. Kinetic study of the effect of the osmotic dehydration pre-treatment with alternative osmotic solutes to the shelf life of frozen strawberry. Food Bioprod. Process. 2016, 99, 212–221. [Google Scholar] [CrossRef]
- Ando, H.; Kajiwara, K.; Oshita, S.; Suzuki, T. The effect of osmotic dehydrofreezing on the role of the cell membrane in carrot texture softening after freeze-thawing. J. Food Eng. 2012, 108, 473–479. [Google Scholar] [CrossRef]
- Zhao, J.H.; Liu, F.; Pang, X.L.; Xiao, H.W.; Wen, X.; Ni, Y.Y. Effects of different osmo-dehydrofreezing treatments on the volatile compounds, phenolic compounds and physicochemical properties in mango (Mangifera indica L.). Int. J. Food Sci. Technol. 2016, 51, 1441–1448. [Google Scholar] [CrossRef]
- Agnelli, M.E.; Marani, C.M.; Mascheroni, R.H. Modelling of heat and mass transfer during (osmo) dehydrofreezing of fruits. J. Food Eng. 2005, 69, 415–424. [Google Scholar] [CrossRef]
- Fallah-Joshaqani, S.; Hamdami, N.; Keramat, J. Qualitative attributes of button mushroom (Agaricus bisporus) frozen under high voltage electrostatic field. J. Food Eng. 2021, 293, 110384. [Google Scholar] [CrossRef]
- Bernaś, E.; Jaworska, G. Onion juice and extracts for the inhibition of enzymatic browning mechanisms in frozen Agaricus bisporus mushrooms. J. Sci. Food Agric. 2021, 101, 4099–4107. [Google Scholar] [CrossRef]
- Bernaś, E. Comparison of the mechanism of enzymatic browning in frozen white and brown A. Bisporus. Eur. Food Res. Technol. 2018, 244, 1239–1248. [Google Scholar] [CrossRef]
- Bernaś, E.; Jaworska, G. Vitamins profile as an indicator of the quality of frozen Agaricus bisporus mushrooms. J. Food Compos. Anal. 2015, 49, 1–8. [Google Scholar] [CrossRef]
- Czapski, J.; Szudyga, K. Frozen mushrooms quality as affected by strain, flush, treatment before freezing, and time of storage. J. Food Sci. 2000, 65, 722–725. [Google Scholar] [CrossRef]
- Bustos, M.C.; Agudelo-Laverde, L.M.; Mazzobre, F.; Buera, P. The relationship between antibrowning, anti-radical and reducing capacity of Brassica and Allium extracts. Int. J. Food Stud. 2014, 3, 82–92. [Google Scholar] [CrossRef]
- Xiao, Y.; He, J.; Zeng, J.; Yuan, X.; Zhang, Z.; Wang, B. Application of citronella and rose hydrosols reduced enzymatic browning of fresh-cut taro. J. Food Biochem. 2020, 44, e13283. [Google Scholar] [CrossRef]
- Nakatsu, T.; Lupo, A.T., Jr.; Chinn, J.W., Jr.; Kang, R.K. Biological activity of essential oils and their constituents. Stud. Nat. Prod. Chem. 2020, 21, 571–631. [Google Scholar] [CrossRef]
- Slavov, A.; Denev, P.; Panchev, I.; Shikov, V.; Nenov, N.; Yantcheva, N.; Vasileva, I. Combined recovery of polysaccharides and polyphenols from Rosa damascena wastes. Ind. Crops Prod. 2017, 100, 85–94. [Google Scholar] [CrossRef]
- Tsanaktsidis, C.G.; Tamoutsidis, E.; Kasapidis, G.; Itziou, A.; Ntina, E. Preliminary results on attributes of distillation products of the rose Rosa damascene as a dynamic and friendly to the environment rural crop. Asia-Pac. Chem. Biol. Environ. Eng. Soc. Procedia 2012, 1, 66–73. [Google Scholar] [CrossRef][Green Version]
- Giannakourou, M.C.; Tsironi, T.; Thanou, I.; Tsagri, A.M.; Katsavou, E.; Lougovois, V.; Kyrana, V.; Kasapidis, G.; Sinanoglou, V.J. Shelf life extension and improvement of the nutritional value of fish fillets through osmotic treatment based on the sustainable use of Rosa Damascena distillation by-products. Foods 2019, 8, 421. [Google Scholar] [CrossRef]
- AOAC. Official Methods of Analysis, 15th ed.; Association of Official Analytical Chemists: Washington, DC, USA, 1990. [Google Scholar]
- Aronika, J.; Manimehalai, N. Studies on the effect of process parameter on the textural characteristics of osmotically dehydrated papaya (var. Red lady) cubes. Int. J. Agric. Sci. Food Technol. 2014, 5, 75–80. [Google Scholar]
- Dermesonlouoglou, E.; Paraskevopoulou, E.; Andreou, V.; Taoukis, P. Osmotic dehydration for the production of novel pumpkin cut products of enhanced nutritional value and sustainability. Appl. Sci. 2020, 10, 6225. [Google Scholar] [CrossRef]
- Mercali, G.D.; Ferreira Marczak, L.D.; Tessaro, I.C.; Zapata Noreña, C.P. Evaluation of water, sucrose and NaCl effective diffusivities during osmotic dehydration of banana (Musa sapientum, shum.). LWT-Food Sci. Technol. 2011, 44, 82–91. [Google Scholar] [CrossRef]
- Mokhtarian, M.; Heydari Majd, M.; Koushki, F.; Bakhshabadi, H.; Garmakhany, A.D.; Rashidzadeh, S. Optimisation of pumpkin mass transfer kinetic during osmotic dehydration using artificial neural network and response surface methodology modelling. Qual. Assur. Saf. Crops Foods 2014, 6, 201–214. [Google Scholar] [CrossRef]
- Tiroutchelvame, D.; Maran, J.P.; Pragalyaashree, M.M. Response surface analysis and optimization of osmotic dehydration of musa acuminata slices. J. Microbiol. Biotechnol. Food Sci. 2019, 8, 1016–1020. [Google Scholar] [CrossRef]
- Dermesonlouoglou, E.K.; Giannakourou, M.C. Modelling dehydration of apricot in a non-conventional multi-component osmotic solution: Effect on mass transfer kinetics and quality characteristics. J. Food Sci. Technol. 2018, 55, 4079–4089. [Google Scholar] [CrossRef] [PubMed]
- Ma, Y.; Yi, J.; Bi, J.; Wu, X.; Li, X.; Li, J.; Zhao, Y. Understanding of osmotic dehydration on mass transfer and physical properties of freeze-dried apple slices: A comparative study of five saccharides osmotic agents. J. Food Process. Preserv. 2022, 46, e16328. [Google Scholar] [CrossRef]
- Stavropoulou, N.A.; Pavlidis, V.A.; Giannakourou, M.C. Optimization of osmotic dehydration of white mushrooms by Response Surface Methodology for shelf-life extension and quality improvement of frozen end-products. Foods 2022, 11, 2354. [Google Scholar] [CrossRef] [PubMed]
- Nishinari, K.; Kohyama, K.; Kumagai, H.; Funami, T.; Bourne, M.C. Parameters of texture profile analysis. Food Sci. Technol. Res. 2013, 19, 519–521. [Google Scholar] [CrossRef]
- Terkmane, N.; Krea, M.; Moulai-Mostefa, N. Optimisation of inulin extraction from globe artichoke (Cynara cardunculus L. subsp. scolymus (L.) Hegi) by electromagnetic induction heating process. Int. J. Food Sci. Technol. 2016, 51, 1997–2008. [Google Scholar] [CrossRef]
- Costa, N.R.; Lourenço, J.; Pereira, Z.L. Desirability function approach: A review and performance evaluation in adverse conditions. Chemom. Intell. Lab. Syst. 2011, 107, 234–244. [Google Scholar] [CrossRef]
- Khuri, A.I.; Mukhopadhyay, S. Response surface methodology. Wiley Interdiscip. Rev. Comput. Stat. 2010, 2, 128–149. [Google Scholar] [CrossRef]
- Calvi, A.; Preiti, G.; Poiana, M.; Marconi, O.; Gastl, M.; Zarnkow, M. Multi-response optimization of the malting process of an Italian landrace of rye (Secale cereale L.) using Response Surface Methodology and desirability function coupled with genetic algorithm. Foods 2022, 11, 3561. [Google Scholar] [CrossRef]
- Giannakourou, M.C.; Stavropoulou, N.; Tsironi, T.; Lougovois, V.; Kyrana, V.; Konteles, S.J.; Sinanoglou, V.J. Application of hurdle technology for the shelf life extension of European eel (Anguilla anguilla) fillets. Aquac. Fish. 2023, 8, 393–402. [Google Scholar] [CrossRef]
- Andreou, V.; Strati, I.F.; Fotakis, C.; Liouni, M.; Zoumpoulakis, P.; Sinanoglou, V.J. Herbal distillates: A new era of grape marc distillates with enriched antioxidant profile. Food Chem. 2018, 253, 171–178. [Google Scholar] [CrossRef] [PubMed]
- Islam, M.N.; Zhang, M.; Adhikari, B.; Xinfeng, C.; Xu, B.G. The effect of ultrasound-assisted immersion freezing on selected physicochemical properties of mushrooms. Int. J. Refrig. 2014, 42, 121–133. [Google Scholar] [CrossRef]
- Lazou, A.Ε.; Dermesonlouoglou, E.K.; Giannakourou, M.C. Modeling and evaluation of the osmotic pretreatment of tomatoes (S. lycopersicum) with alternative sweeteners for the production of candied products. Food Bioprocess Technol. 2020, 13, 948–961. [Google Scholar] [CrossRef]
- Giannoglou, M.; Koumandraki, H.; Andreou, V.; Dermesonlouoglou, E.; Katsaros, G.; Taoukis, P. Combined osmotic and air dehydration for the production of shelf-stable white cheese. Food Bioprocess Technol. 2020, 13, 1435–1446. [Google Scholar] [CrossRef]
- Deshmukh, S.D.; Gabhane, S.; Deshmukh, D.S. Osmotic dehydration of carrot strips and modelling. J. Phys. Conf. Ser. 2021, 1913, 012093. [Google Scholar] [CrossRef]
- Kaur, B.; Rana, P.; Sridhar, K. Mass transfer kinetics and process optimization of osmotic dehydration of Kinnow mandarin (Citrus reticulata) peel. J. Food Process. Preserv. 2022, 46, e16318. [Google Scholar] [CrossRef]
- Mehta, B.K.; Jain, S.K.; Sharma, G.P.; Mudgal, V.D.; Verma, R.C.; Doshi, A.; Jain, H.K. Optimization of osmotic drying parameters for button mushroom (Agaricus bisporus). Appl. Math. 2012, 3, 1298–1305. [Google Scholar] [CrossRef]
- Abdi, H.; Williams, L.J. Principal component analysis. Wiley Interdiscip. Rev. Comput. Stat. 2010, 2, 433–459. [Google Scholar] [CrossRef]
- Giannakourou, M.C.; Poulis, S.; Konteles, S.J.; Dipla, A.; Lougovois, V.P.; Kyrana, V.; Proestos, C.; Sinanoglou, V.J. Combined effect of impregnation with an Origanum Vulgare infusion and osmotic treatment on the shelf life and quality of chilled chicken fillets. Molecules 2021, 26, 2727. [Google Scholar] [CrossRef]
- Jariyawaranugoon, U. Effect of freezing on quality of osmotically dehydrated banana slices. Adv. J. Food Sci. Technol. 2015, 9, 98–105. [Google Scholar] [CrossRef]
- Bunger, A.; Moyano, P.C.; Vega, R.E.; Guerrero, P.; Osorio, F. Osmotic dehydration and freezing as combined processes on apple preservation. Food Sci. Technol. Int. 2004, 10, 163–170. [Google Scholar] [CrossRef]
- Zhao, J.H.; Xiao, H.W.; Ding, Y.; Nie, Y.; Zhang, Y.; Zhu, Z.; Tang, X.M. Effect of osmotic dehydration pretreatment and glassy state storage on the quality attributes of frozen mangoes under long-term storage. J. Food Sci. Technol. 2017, 54, 1527–1537. [Google Scholar] [CrossRef]


Disclaimer/Publisher’s Note: The statements, opinions and data contained in all publications are solely those of the individual author(s) and contributor(s) and not of MDPI and/or the editor(s). MDPI and/or the editor(s) disclaim responsibility for any injury to people or property resulting from any ideas, methods, instructions or products referred to in the content. |
© 2023 by the authors. Licensee MDPI, Basel, Switzerland. This article is an open access article distributed under the terms and conditions of the Creative Commons Attribution (CC BY) license (https://creativecommons.org/licenses/by/4.0/).