Article

Image Recognition Method for Micropores Inside Small Gas Pipelines

1
School of Automation, Beijing Information Science & Technology University, Beijing 100192, China
2
Beijing Key Laboratory of High Dynamic Navigation Technology, Beijing 100192, China
*
Author to whom correspondence should be addressed.
Appl. Sci. 2023, 13(17), 9697; https://doi.org/10.3390/app13179697
Submission received: 3 July 2023 / Revised: 17 August 2023 / Accepted: 26 August 2023 / Published: 28 August 2023
(This article belongs to the Section Applied Industrial Technologies)

Abstract

:
To address difficulties in the early detection of small gas pipeline leaks, a method is proposed for the image recognition of micropores inside small gas pipelines. First, we design a feature fusion network (Neck) for a small gas pipeline internal micropores identification network model, introducing BiFPN (bi-directional feature pyramid network) into the Neck, and enhancing the micropores feature fusion capability of the network model using cross-scale feature information fusion. Second, we design a classification prediction network (Head) for a small gas pipeline internal micropores identification network model, constructing a small target detection layer in the classification prediction network, and improving the microporosity detection rate of the network model by improving the detection capability for small leakages. Then, micropore datasets are fed into the network model separately to train the model. Finally, comparison and ablation experiments are used to verify the micropore recognition ability of the network model. The experimental results show that the precision of the image recognition method for micropores inside small gas pipelines is 94.7%, the detection rate is 96.6%, and the average precision is 95.5%, which can better realize the early detection of leakages in small gas pipelines.

1. Introduction

As the important carrier of gas transportation, gas pipelines play a vital role in gas transmission, such as gas and natural gas, thus bringing many conveniences and economic benefits to daily life and industrial production. Gas pipelines are mainly buried underground with intricate pipelines [1], and corrosion, holes, and breakage can occur over the years [2,3,4], leading to pipeline leaks. Pipeline leakage not only wastes energy and causes economic loss, but it may also threaten people’s life safety in serious cases [5]. Therefore, regular maintenance of gas pipelines is necessary. Existing pipeline leakage identification techniques such as negative pressure wave detection [6], wavelet detection [7], acoustic emission detection [8], pressure point analysis [9], micro-electromagnetic detection [10], the infrared sensor method [11], and other methods can only identify the leakage that has occurred. Early leakages in the inner wall of the pipeline will appear as micropores, the characteristic precursor to leakage, which will gradually become larger and eventually lead to the occurrence of pipeline leaks. However, the above methods are unable to identify these early features of leaks [12,13,14]. Therefore, to carry out safety warnings, and prevent the occurrence of large-scale leaks in gas pipelines that lead to economic losses and threats to people’s lives, this paper proposes an image recognition method for micropores inside small gas pipelines.
To address the problem related to difficulties in the early detection of small gas pipeline leaks, a method is proposed for the image recognition for micropores inside small gas pipelines. First, we use the head camera of an inspection robot to collect micropore images inside the small gas pipeline. Then, the number of images is expanded to build a dataset, and the dataset is labeled with micropores to produce label data. Second, the BiFPN [15] is introduced into the Neck of the YOLOv5s algorithm to enhance the fusion of different scale feature information fusion to improve the recognition precision of leaking pores. Finally, a small target detection layer [16] is constructed in the Head of the YOLOv5s algorithm to identify micropores of tiny size and improve the detection rate of the network model for micropores of tiny size. The method in this paper can solve the problem that traditional methods cannot realize by visualizing early leakage characteristics such as micropores, avoiding the high economic cost and high manpower investment related to large-area excavation, and preventing the danger caused by a large leakage in the pipeline to realize the early safety investigation of pipeline leakage.

2. Dataset Creation

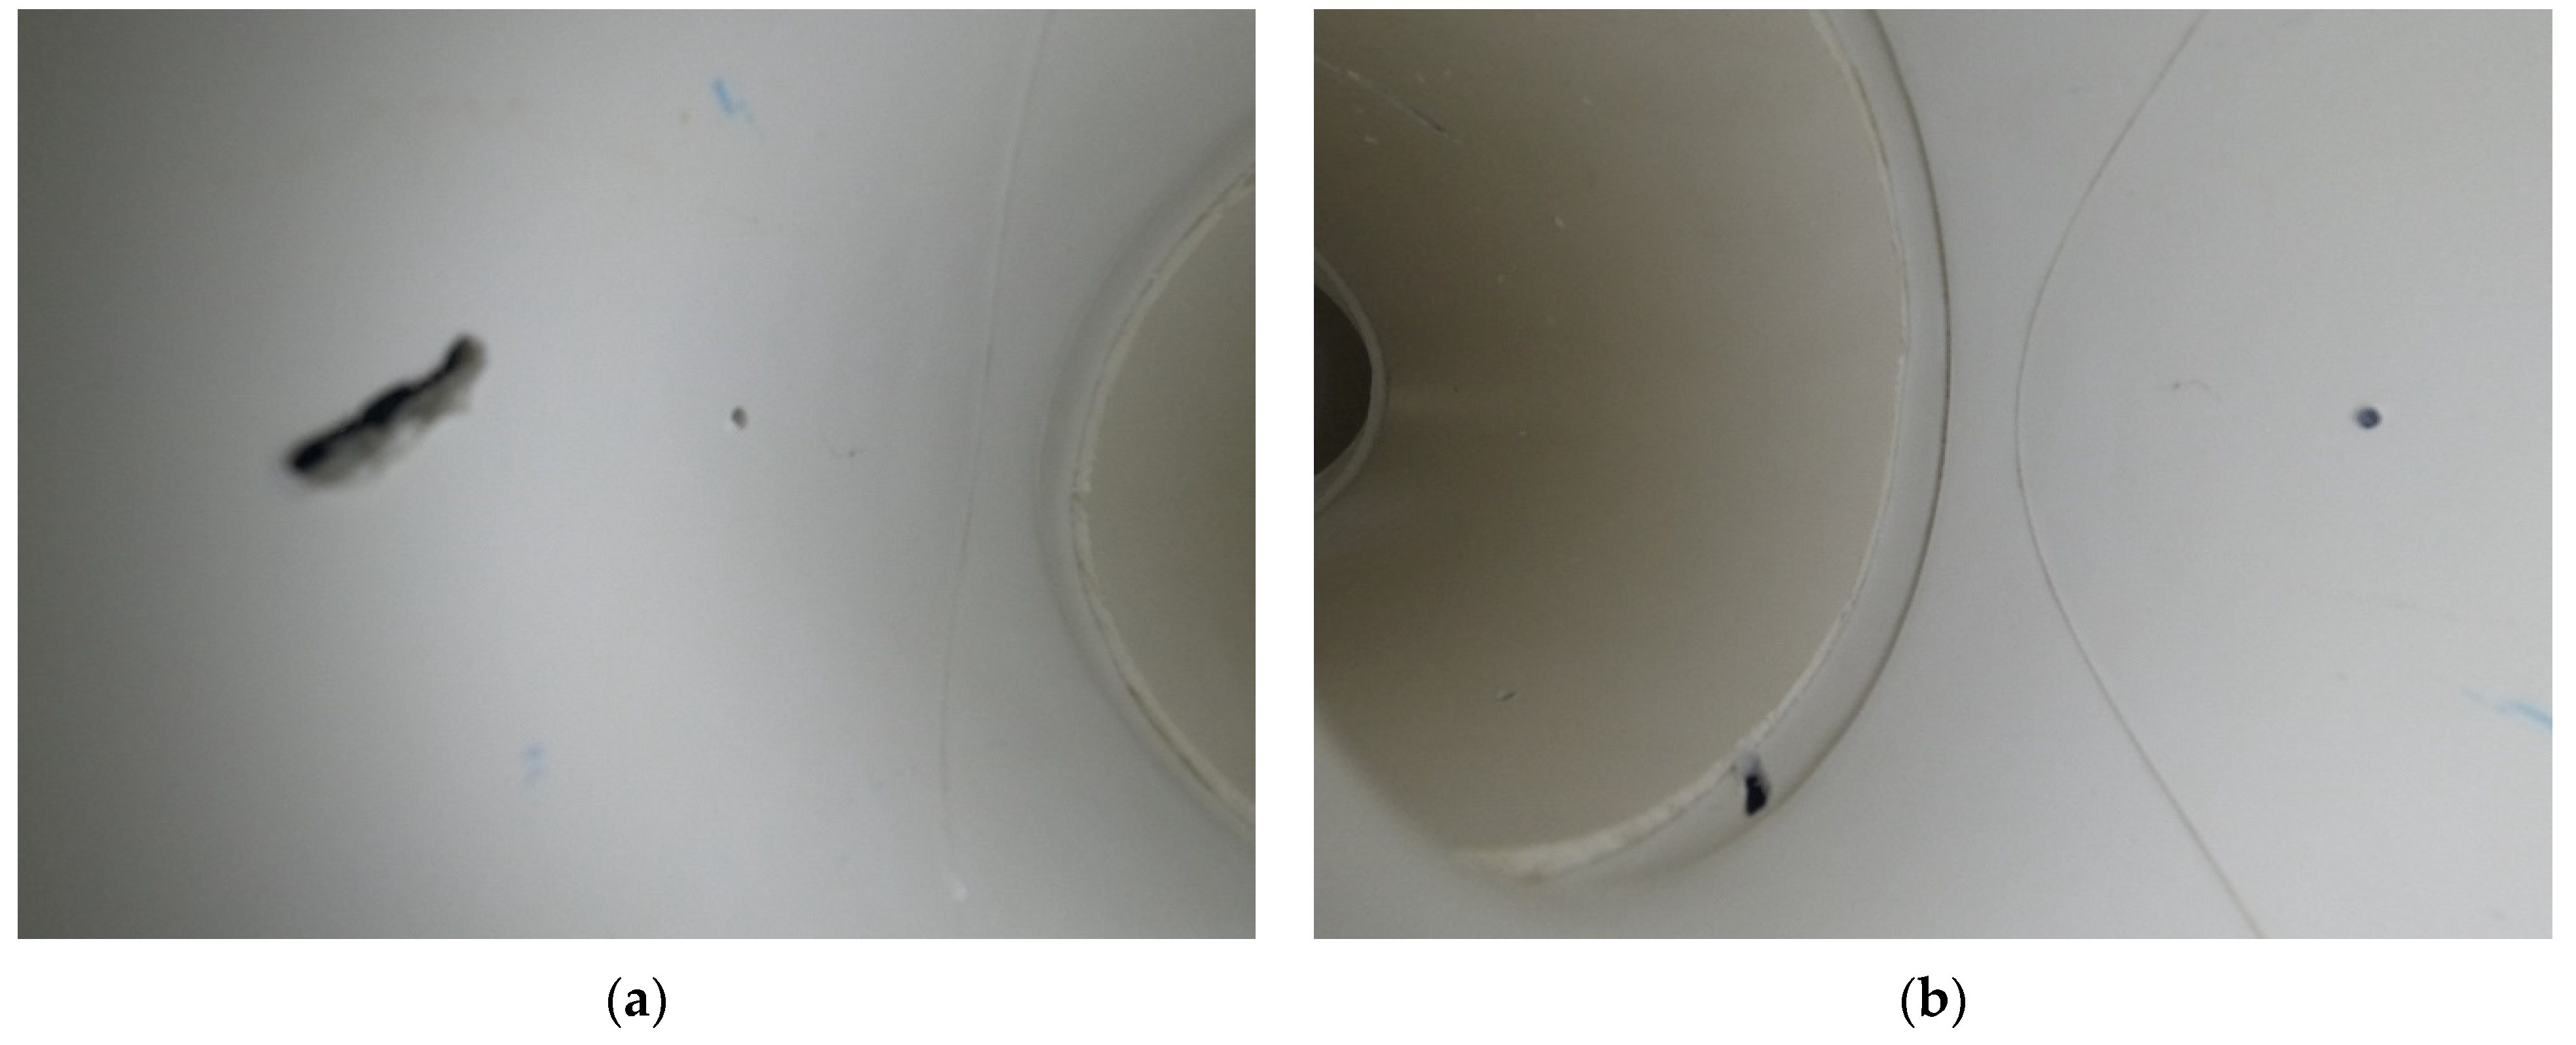
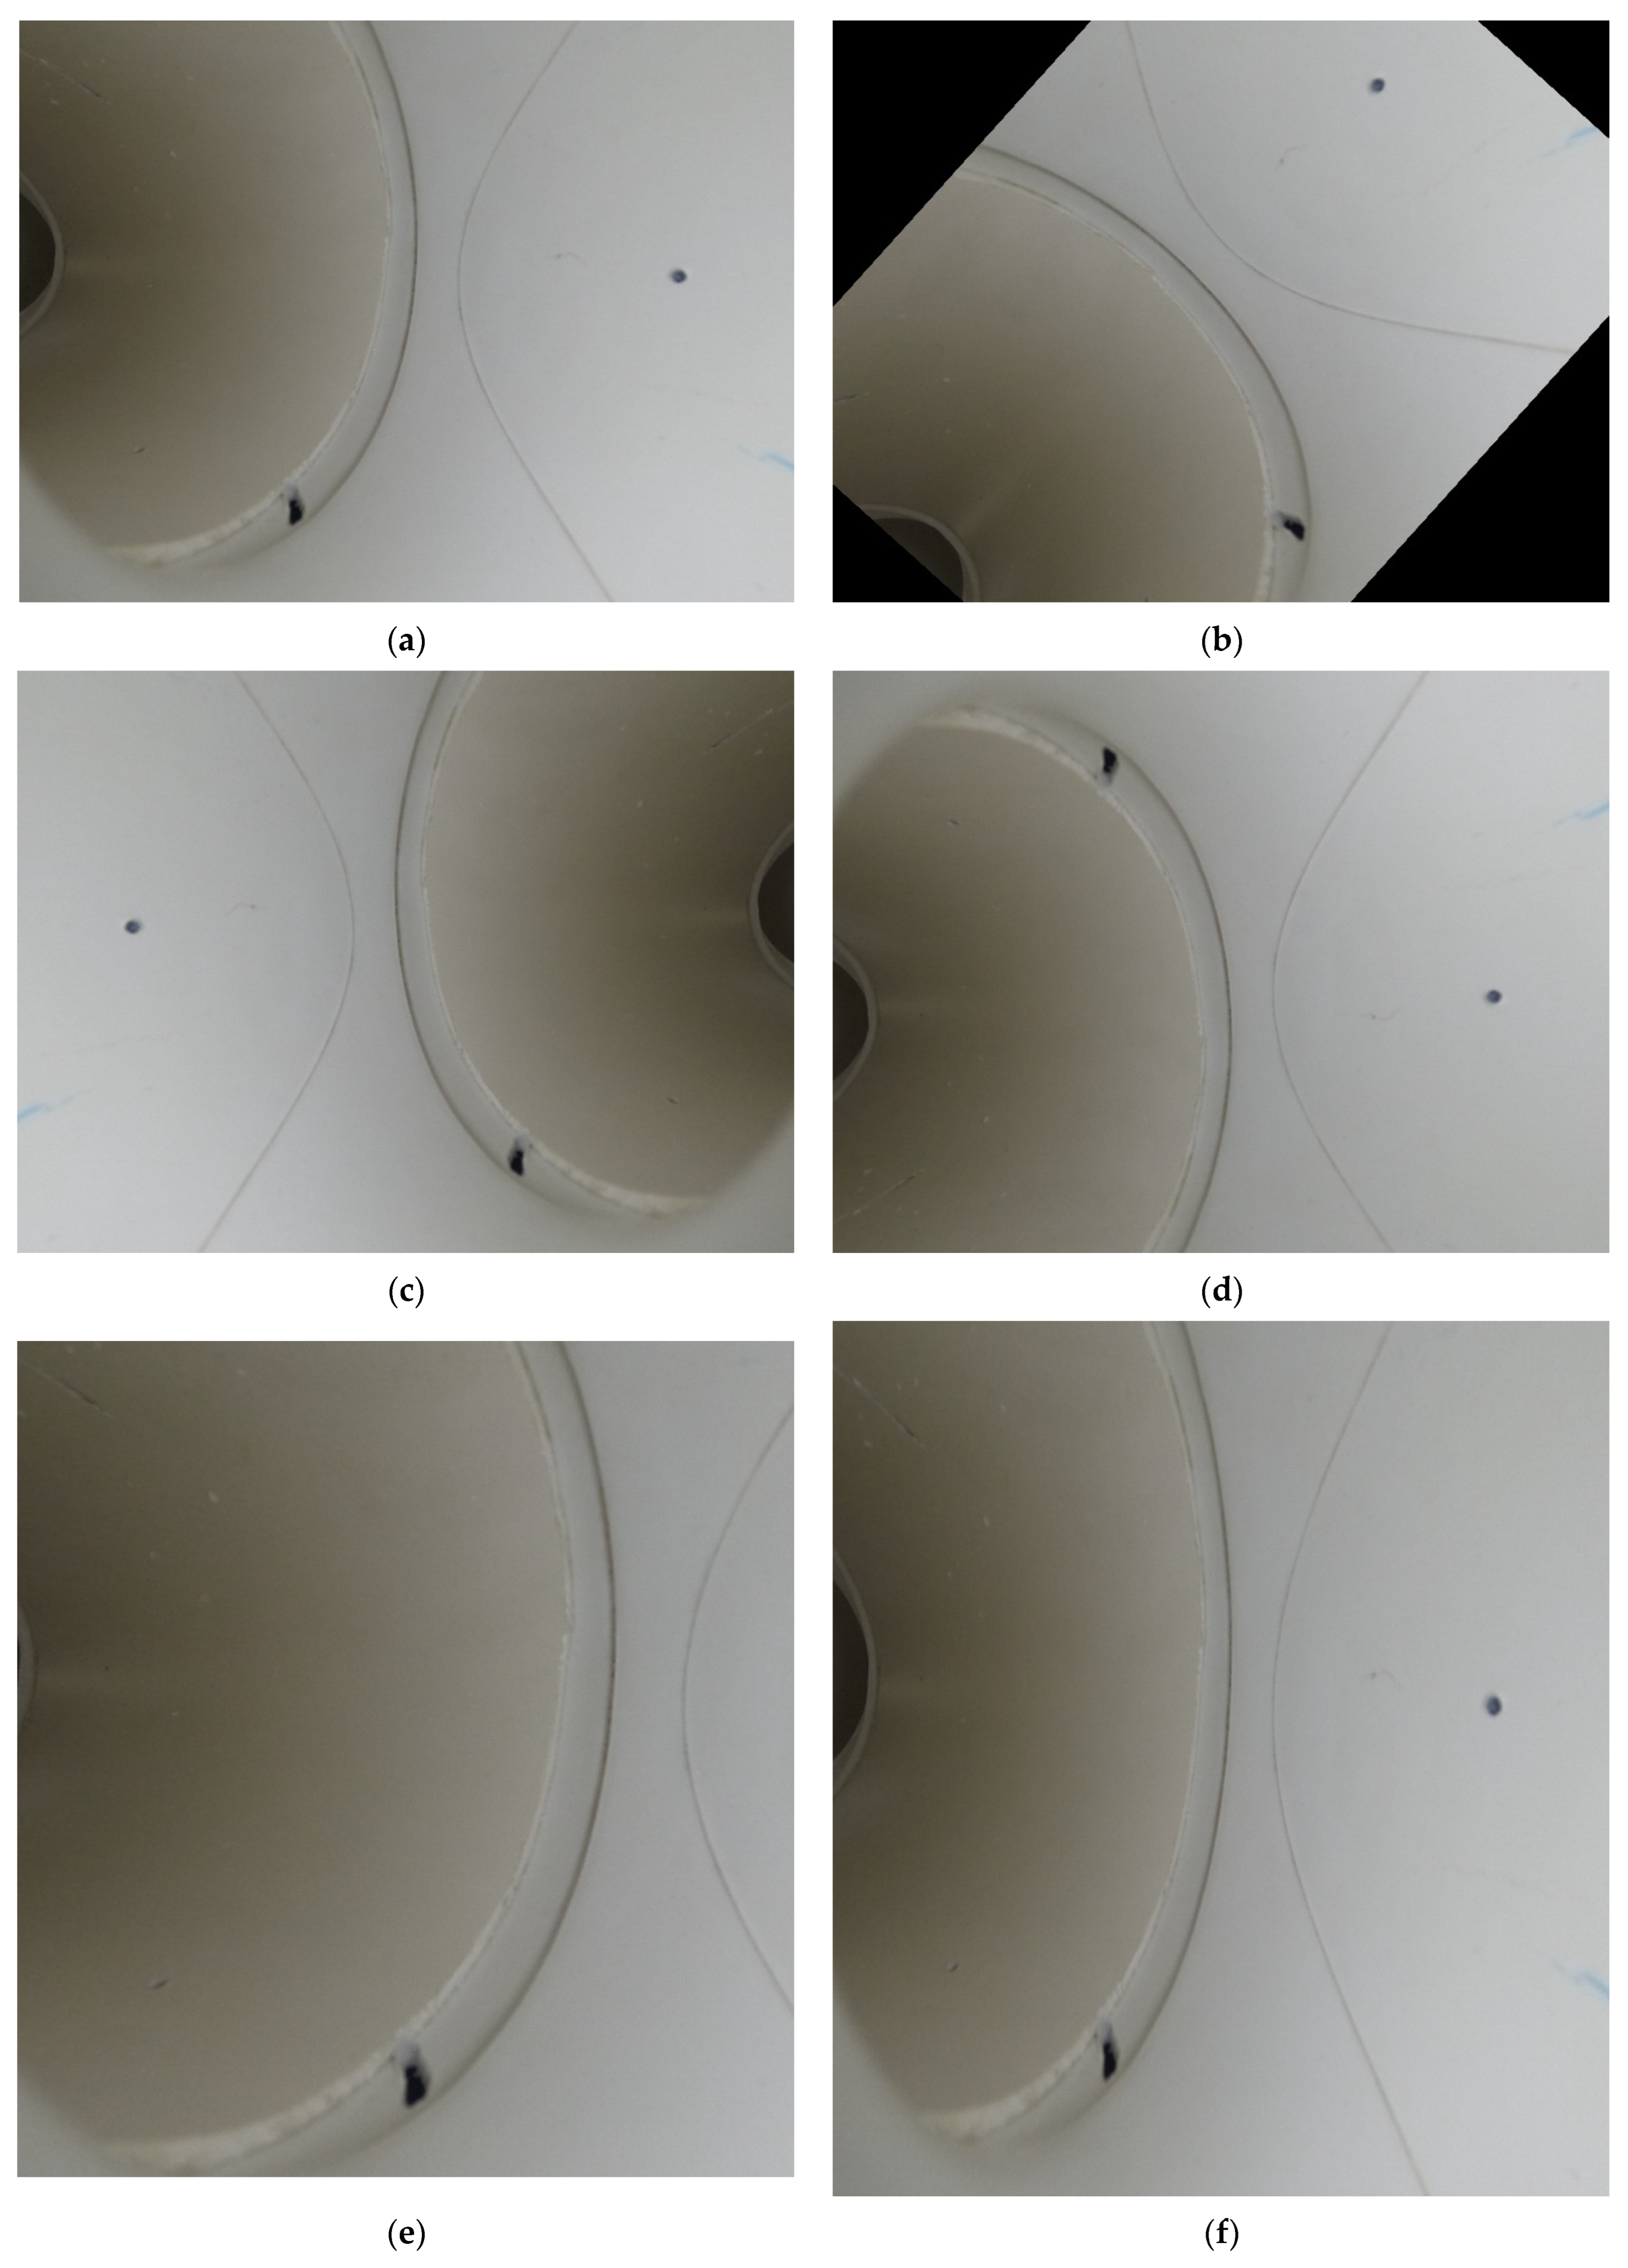
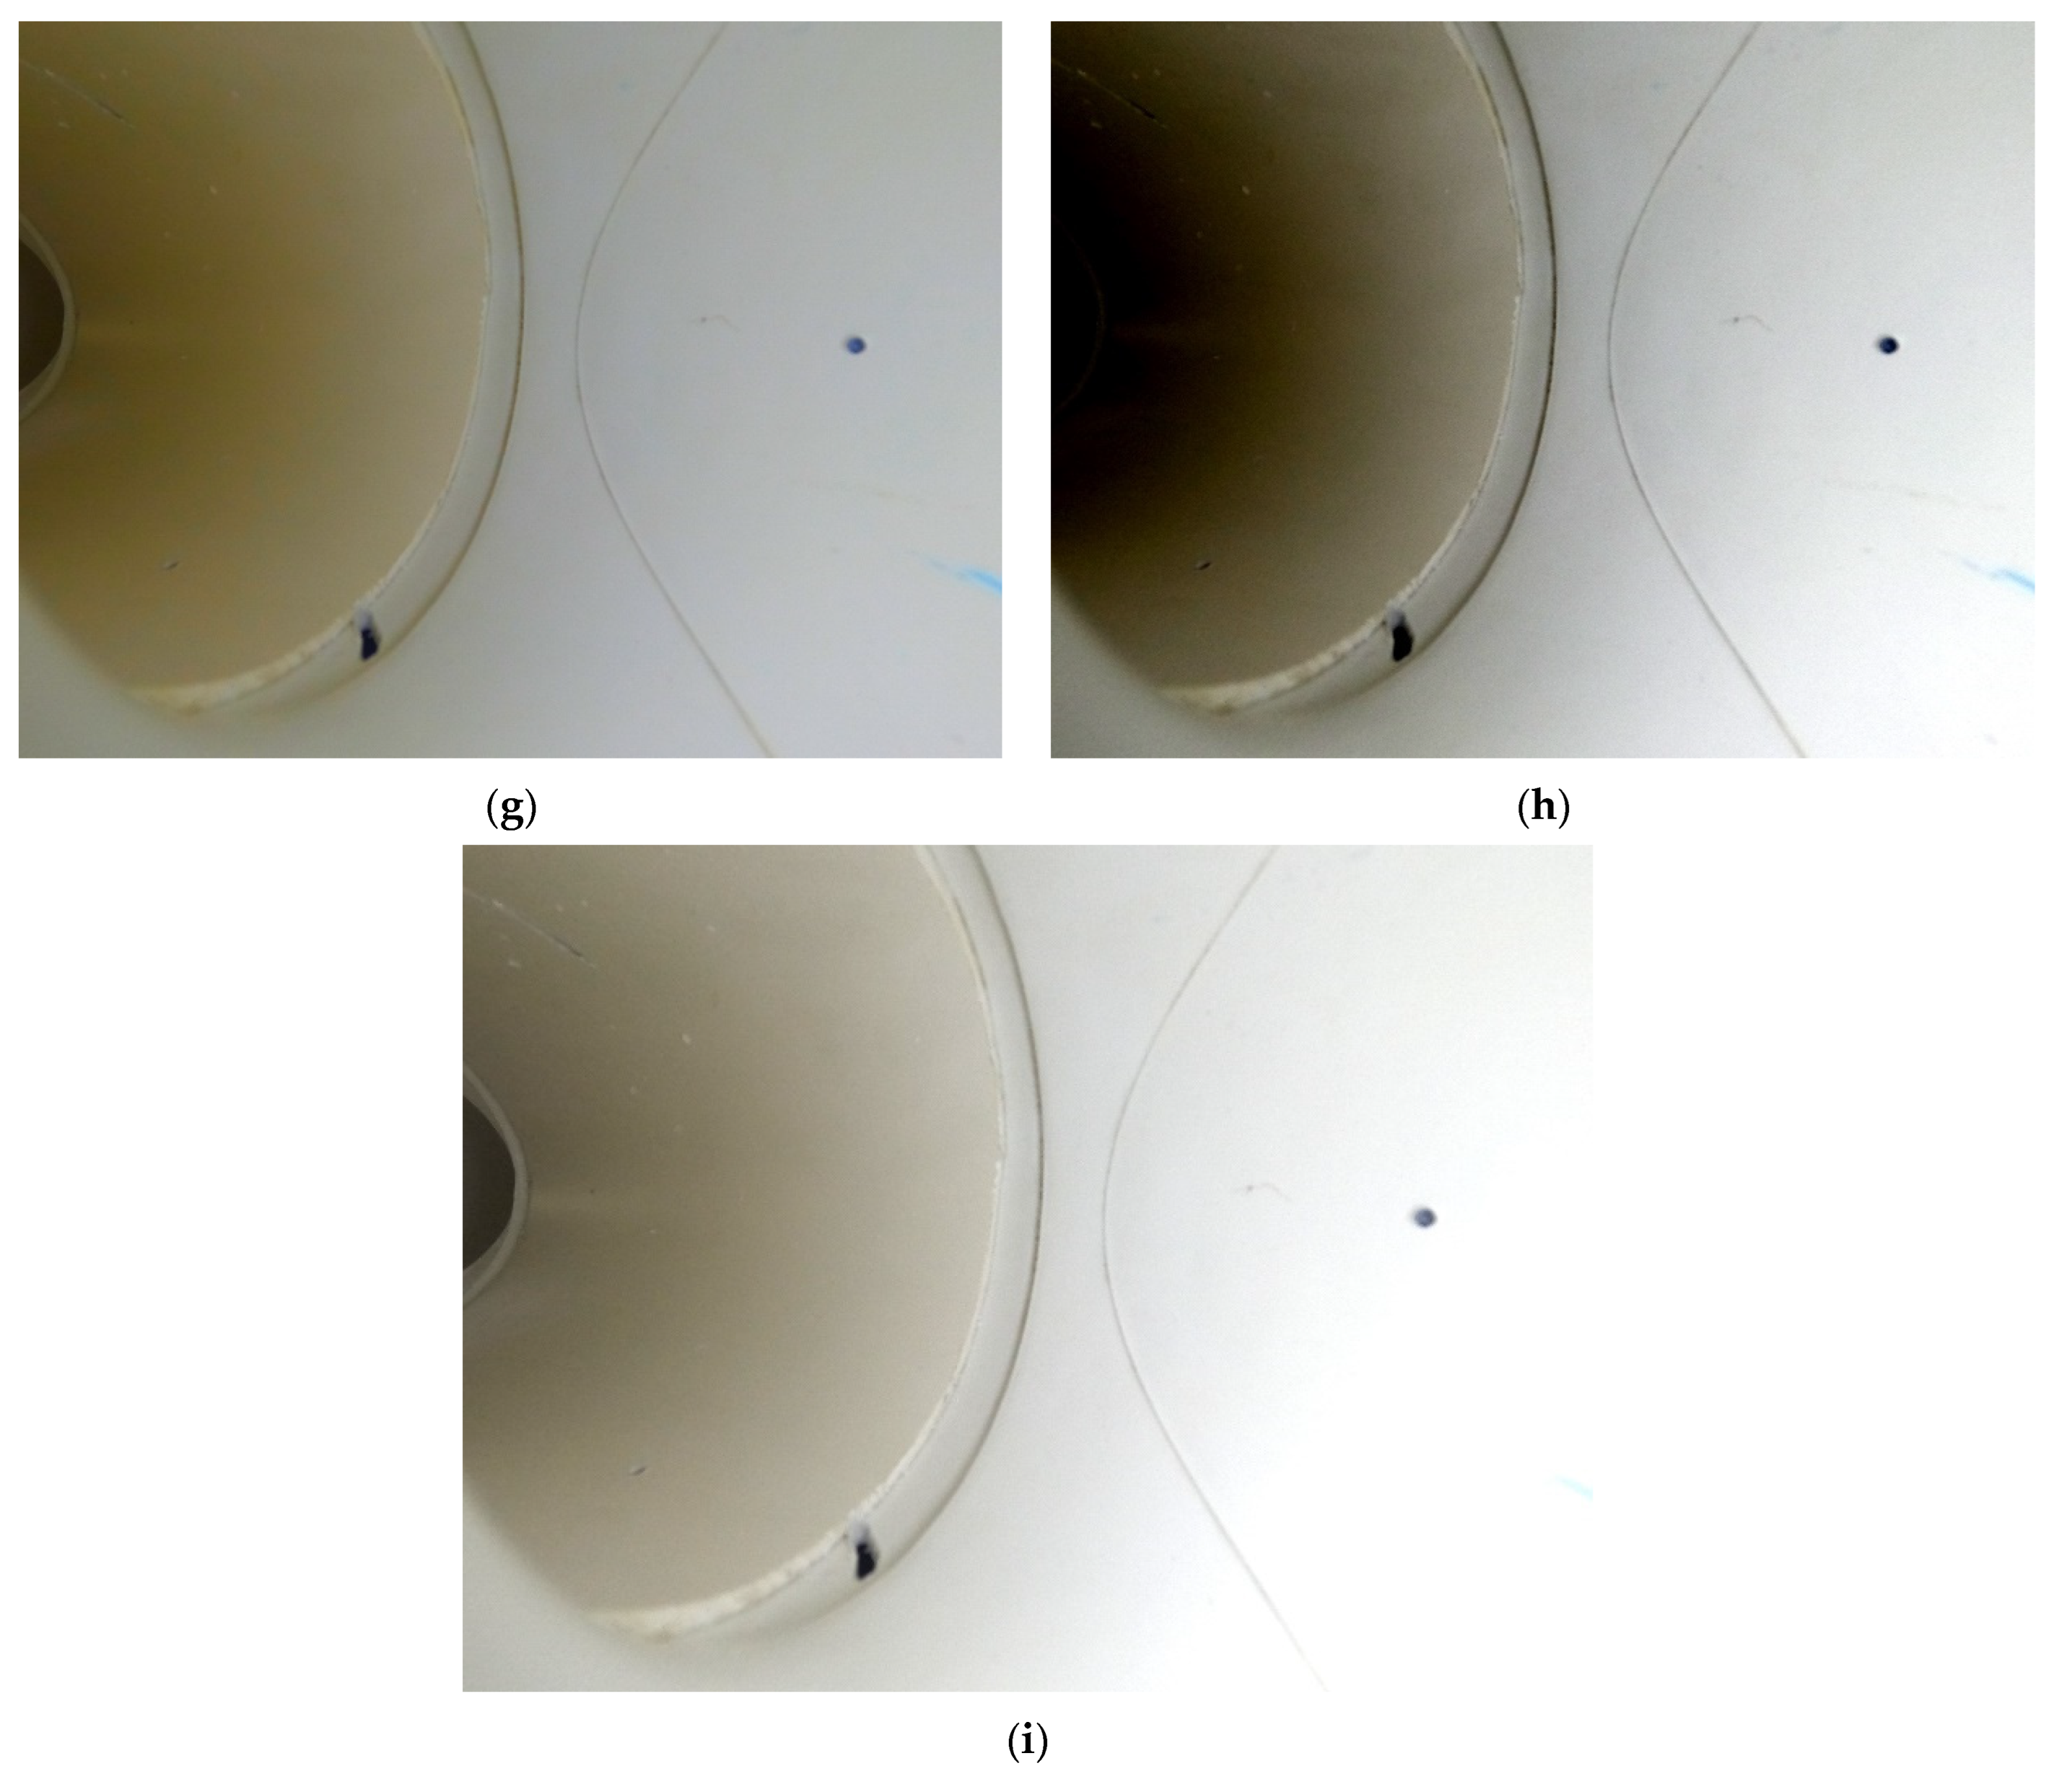
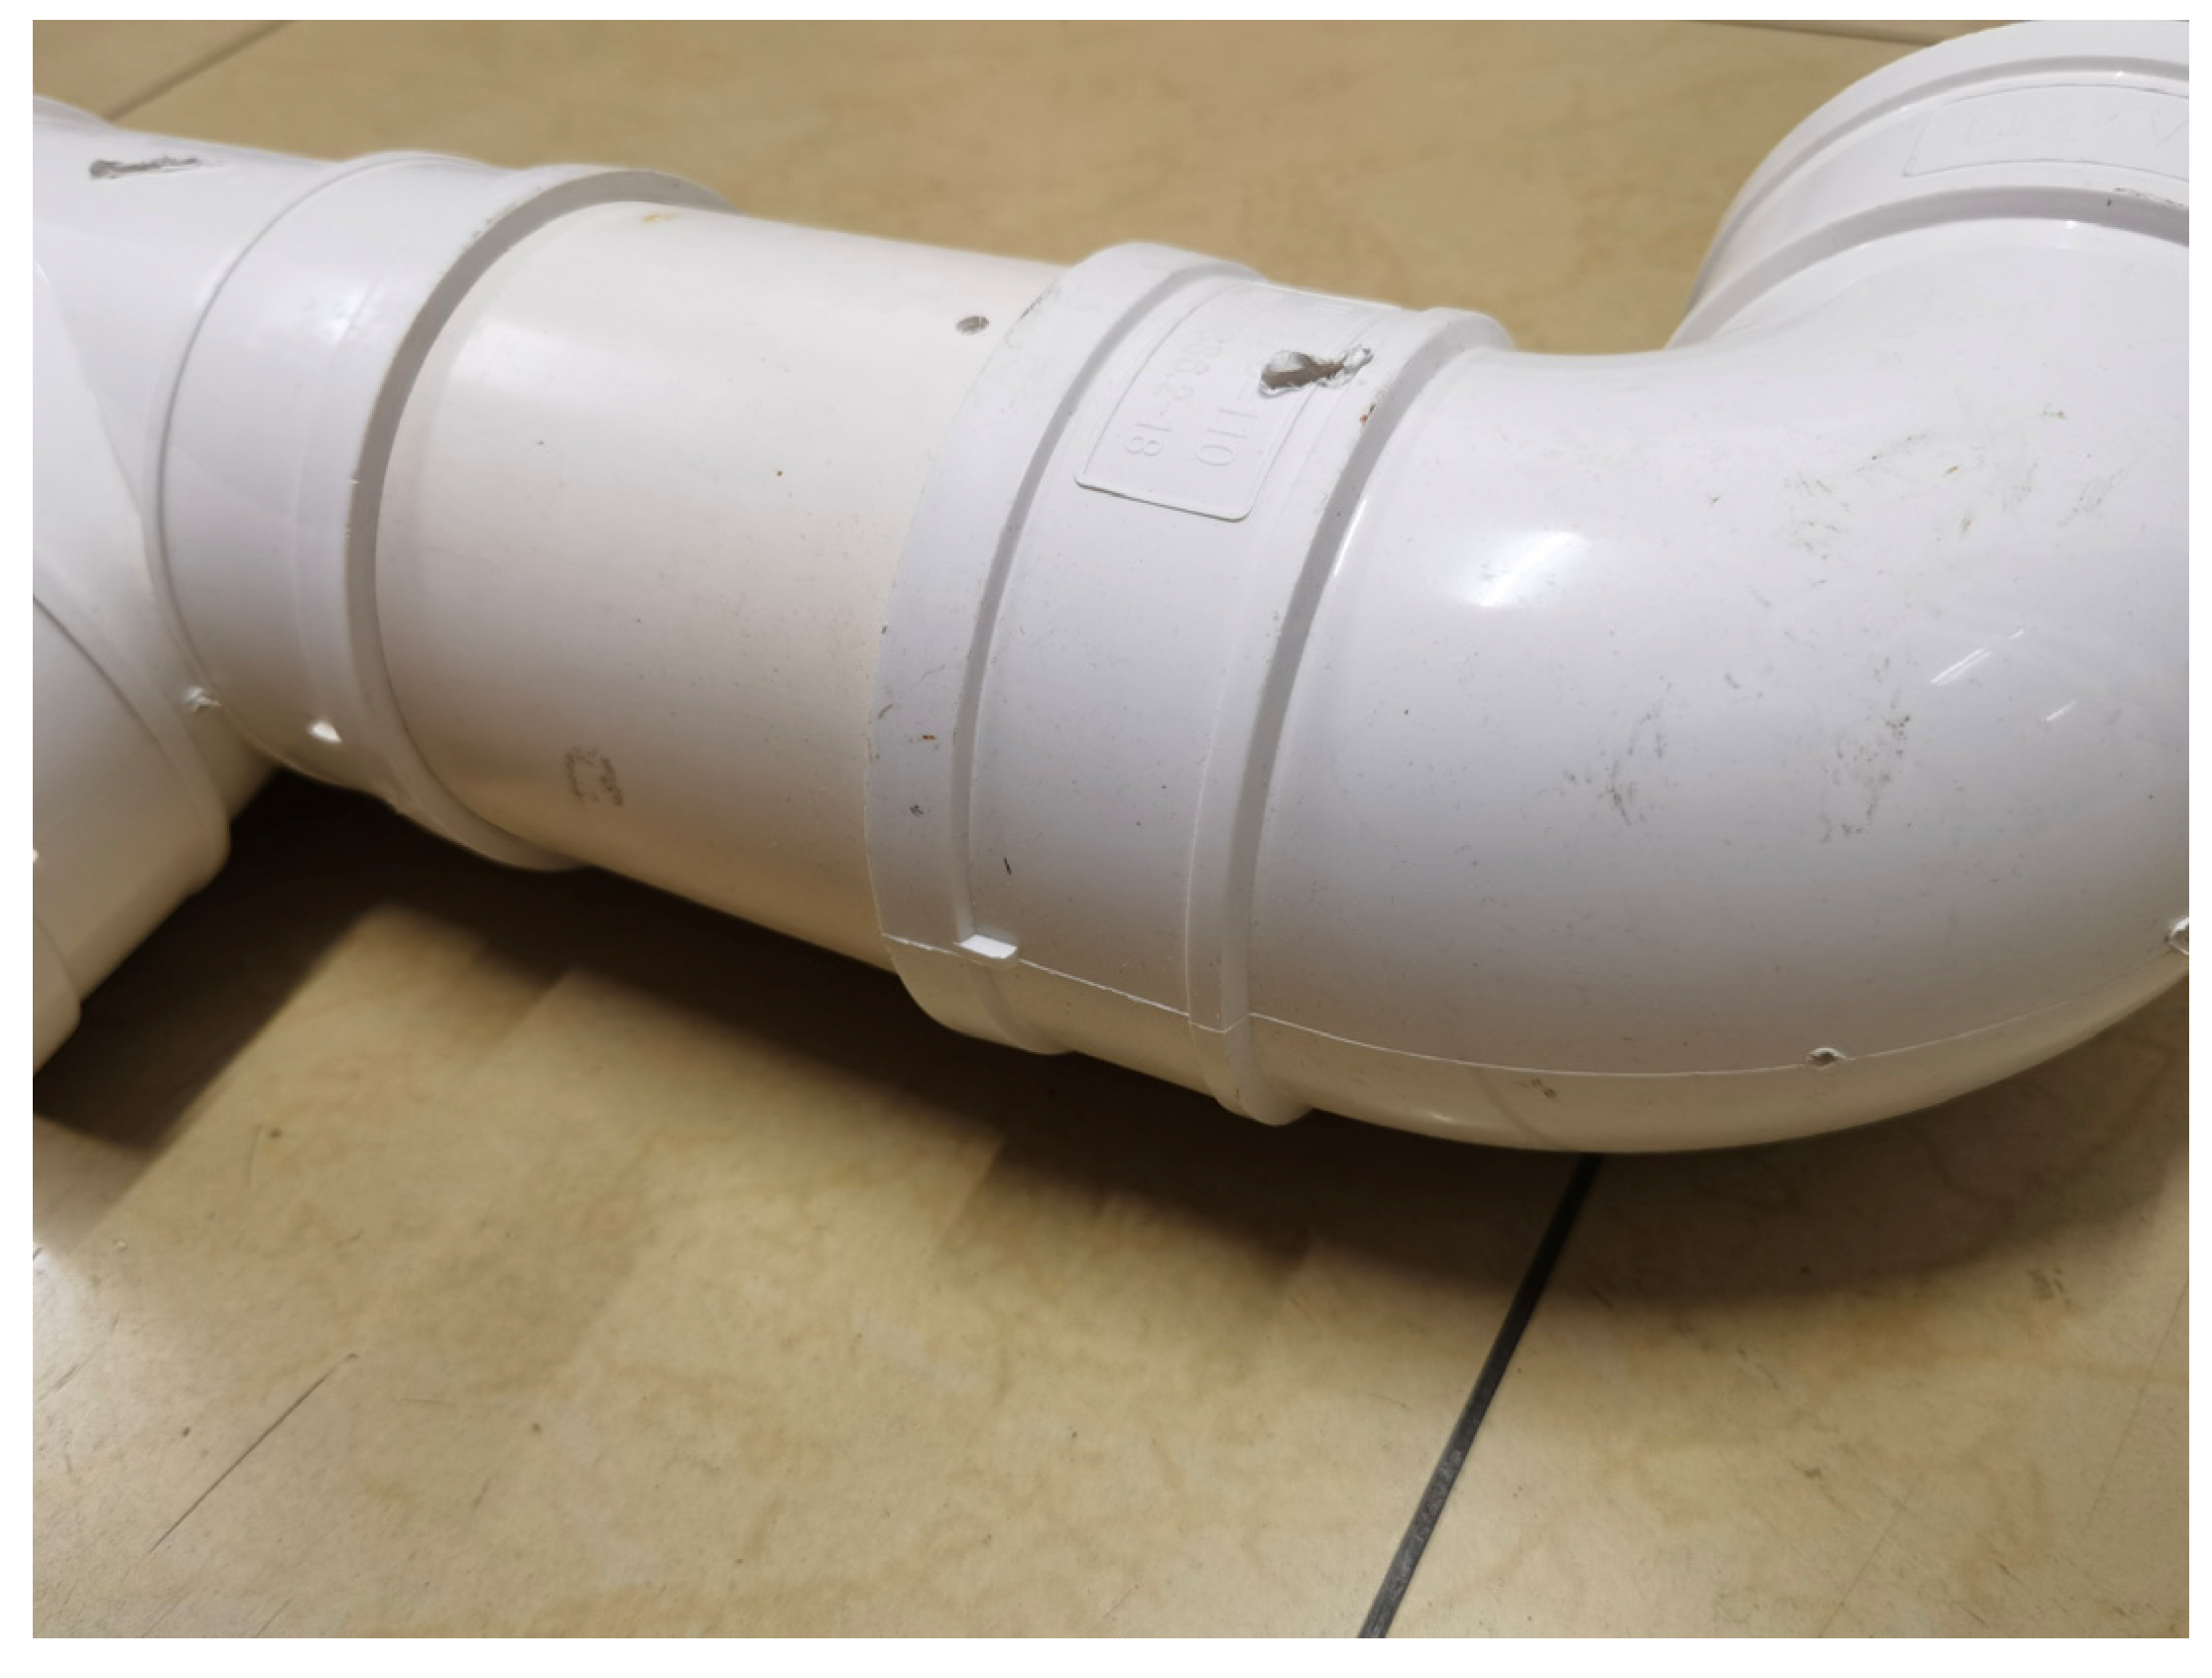
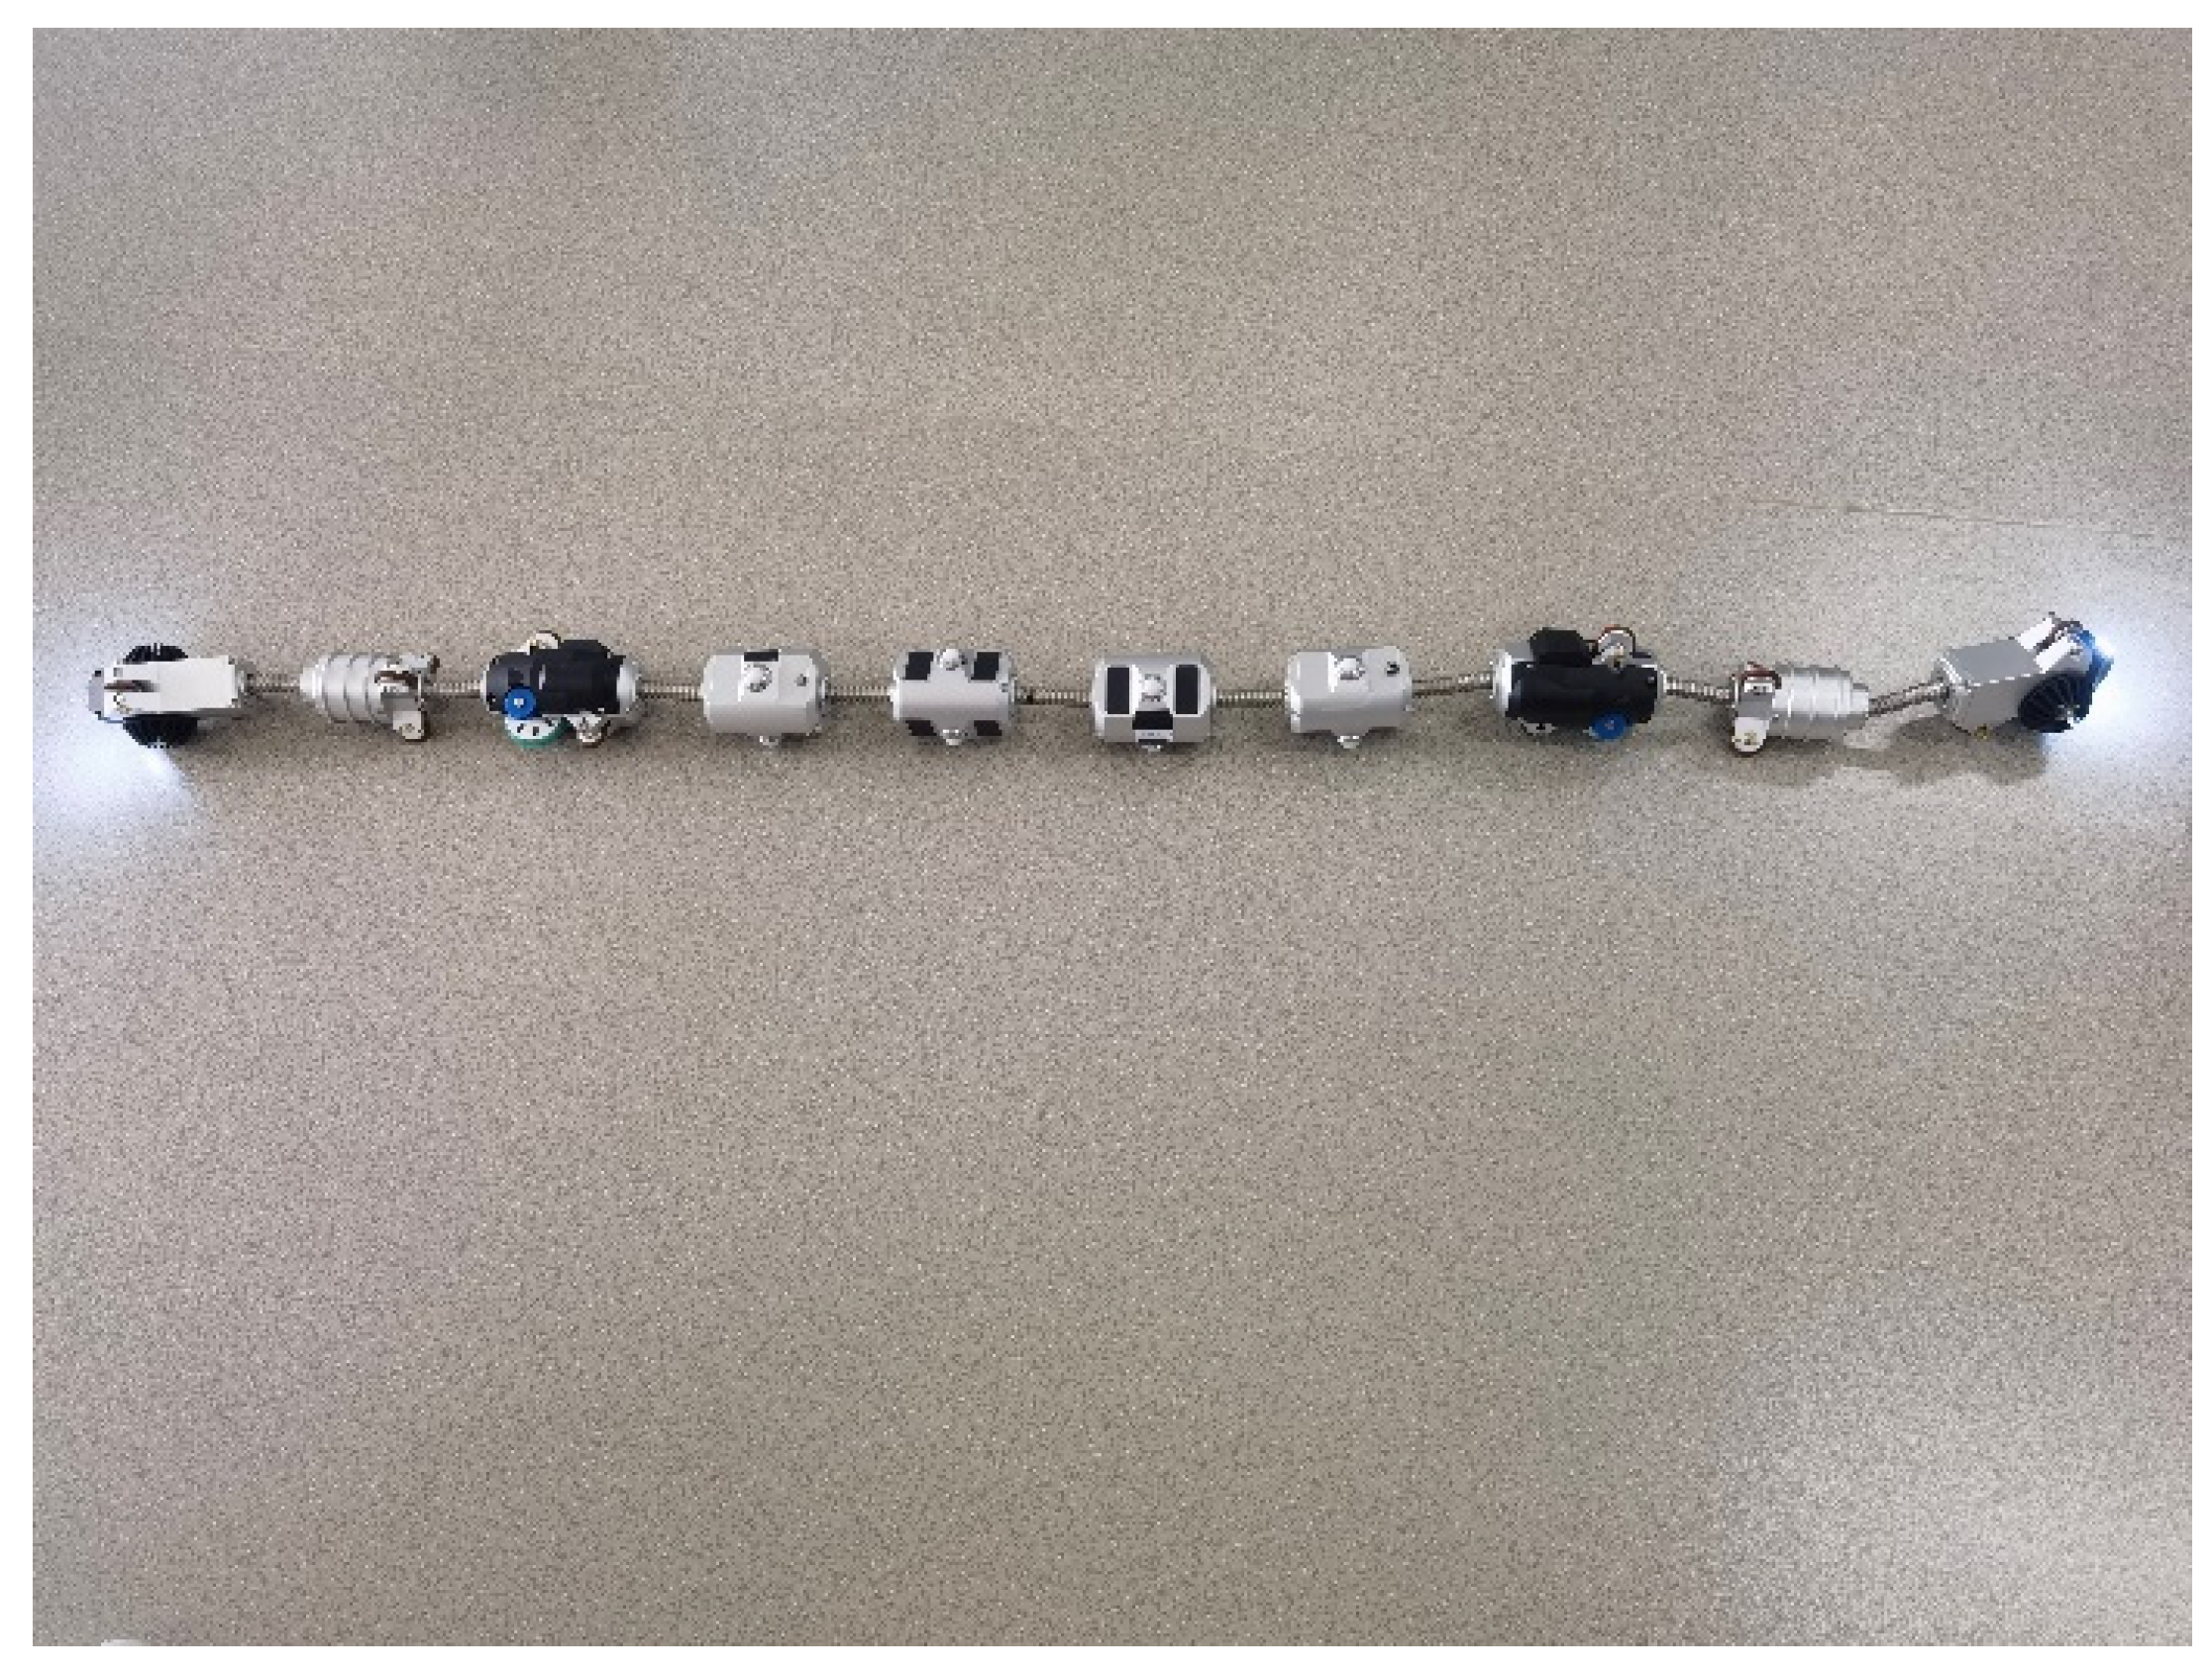
2.1. Image Acquisition

The pipe specification in this paper is DN100. It is a pipe with an outside diameter of 100 mm, and the pipe material is PE. An image of a small gas pipe is shown in Figure 1.
The early leakage characteristics of the pipeline include pore-like structures, strip-like structures, and irregular shapes. The early leakage characteristics of the pipeline are shown in Figure 2, where the micropores on the left side in Figure 2a are irregularly shaped, the micropores on the right side are pore-like structures, the micropores on the upper-left side in Figure 2b are strip-like structures, the micropores in the middle are irregularly shaped, and the micropores on the right side are pore-like structures.
In this paper, the camera on the head of an in-pipe inspection robot is used to collect images of micropores inside small gas pipelines, and the in-pipe inspection robot is shown in Figure 3. Regarding the original images of micropores inside the pipeline taken using the in-pipe inspection robot, a total of 198 images were captured, and the original images were screened to eliminate images with poor image quality, leaving a total of 171 images with high quality to complete the image acquisition.

2.2. Dataset Creation

The problem of datasets with a small number of images is common in the field of target detection, where a small number of images can lead to overfitting the network model. Therefore, to prevent the network model from overfitting, the number of images needs to be expanded.
Image transformation methods are widely used in the field of target detection to expand the number of images, and in this paper, we use image transformation methods such as rotation, left-right flip, top-down flip, clipping, scaling, contrast transformation, color transformation, and brightness transformation [17,18] to expand the number of the initial 171 images. A comparison images before and after image expansion are shown in Figure 4.
The expanded images and the initial 171 images are used to construct the image dataset, and the total number of images in the constructed dataset is 1500. That is, the dataset consists of the 171 initial images and the images that were expanded using the image expansion method. The data expression for the dataset construction is shown in Equation (1).
F i n a l ( x ) = O r g ( x ) F i l t ( x ) + A u g [ O r g ( x ) F i l t ( x ) ]
where x denotes the number of samples, Final(x) denotes the image dataset, Org(x) denotes the 198 original images acquired, Filt(x) denotes the rejected images, and Aug(x) denotes the expanded images.
The constructed image dataset is uniformly normalized to the size of 640 × 640, and the normalized image dataset and its corresponding label data are divided into a training set and a test set. Among them, the training set is used to train the network model for micropore recognition inside small gas pipes proposed in this paper, accounting for 80% of the total 1200 images and label data. The test set is used to test the recognition ability of the trained network model, accounting for 20% of the total 300 images and label data, to complete the establishment of the dataset. To further understand the diversity and representativeness of the data, both the training set and the validation set contain micropores such as pore-like structures, strip-like structures, irregular shapes, etc., and each image contains at least one micropore with the minimum size leakage, being pore-like micropores with a diameter of 1 mm. To prevent the network from overfitting due to too small of a dataset, the dataset in this paper also underwent a dataset expansion process to solve the problem.

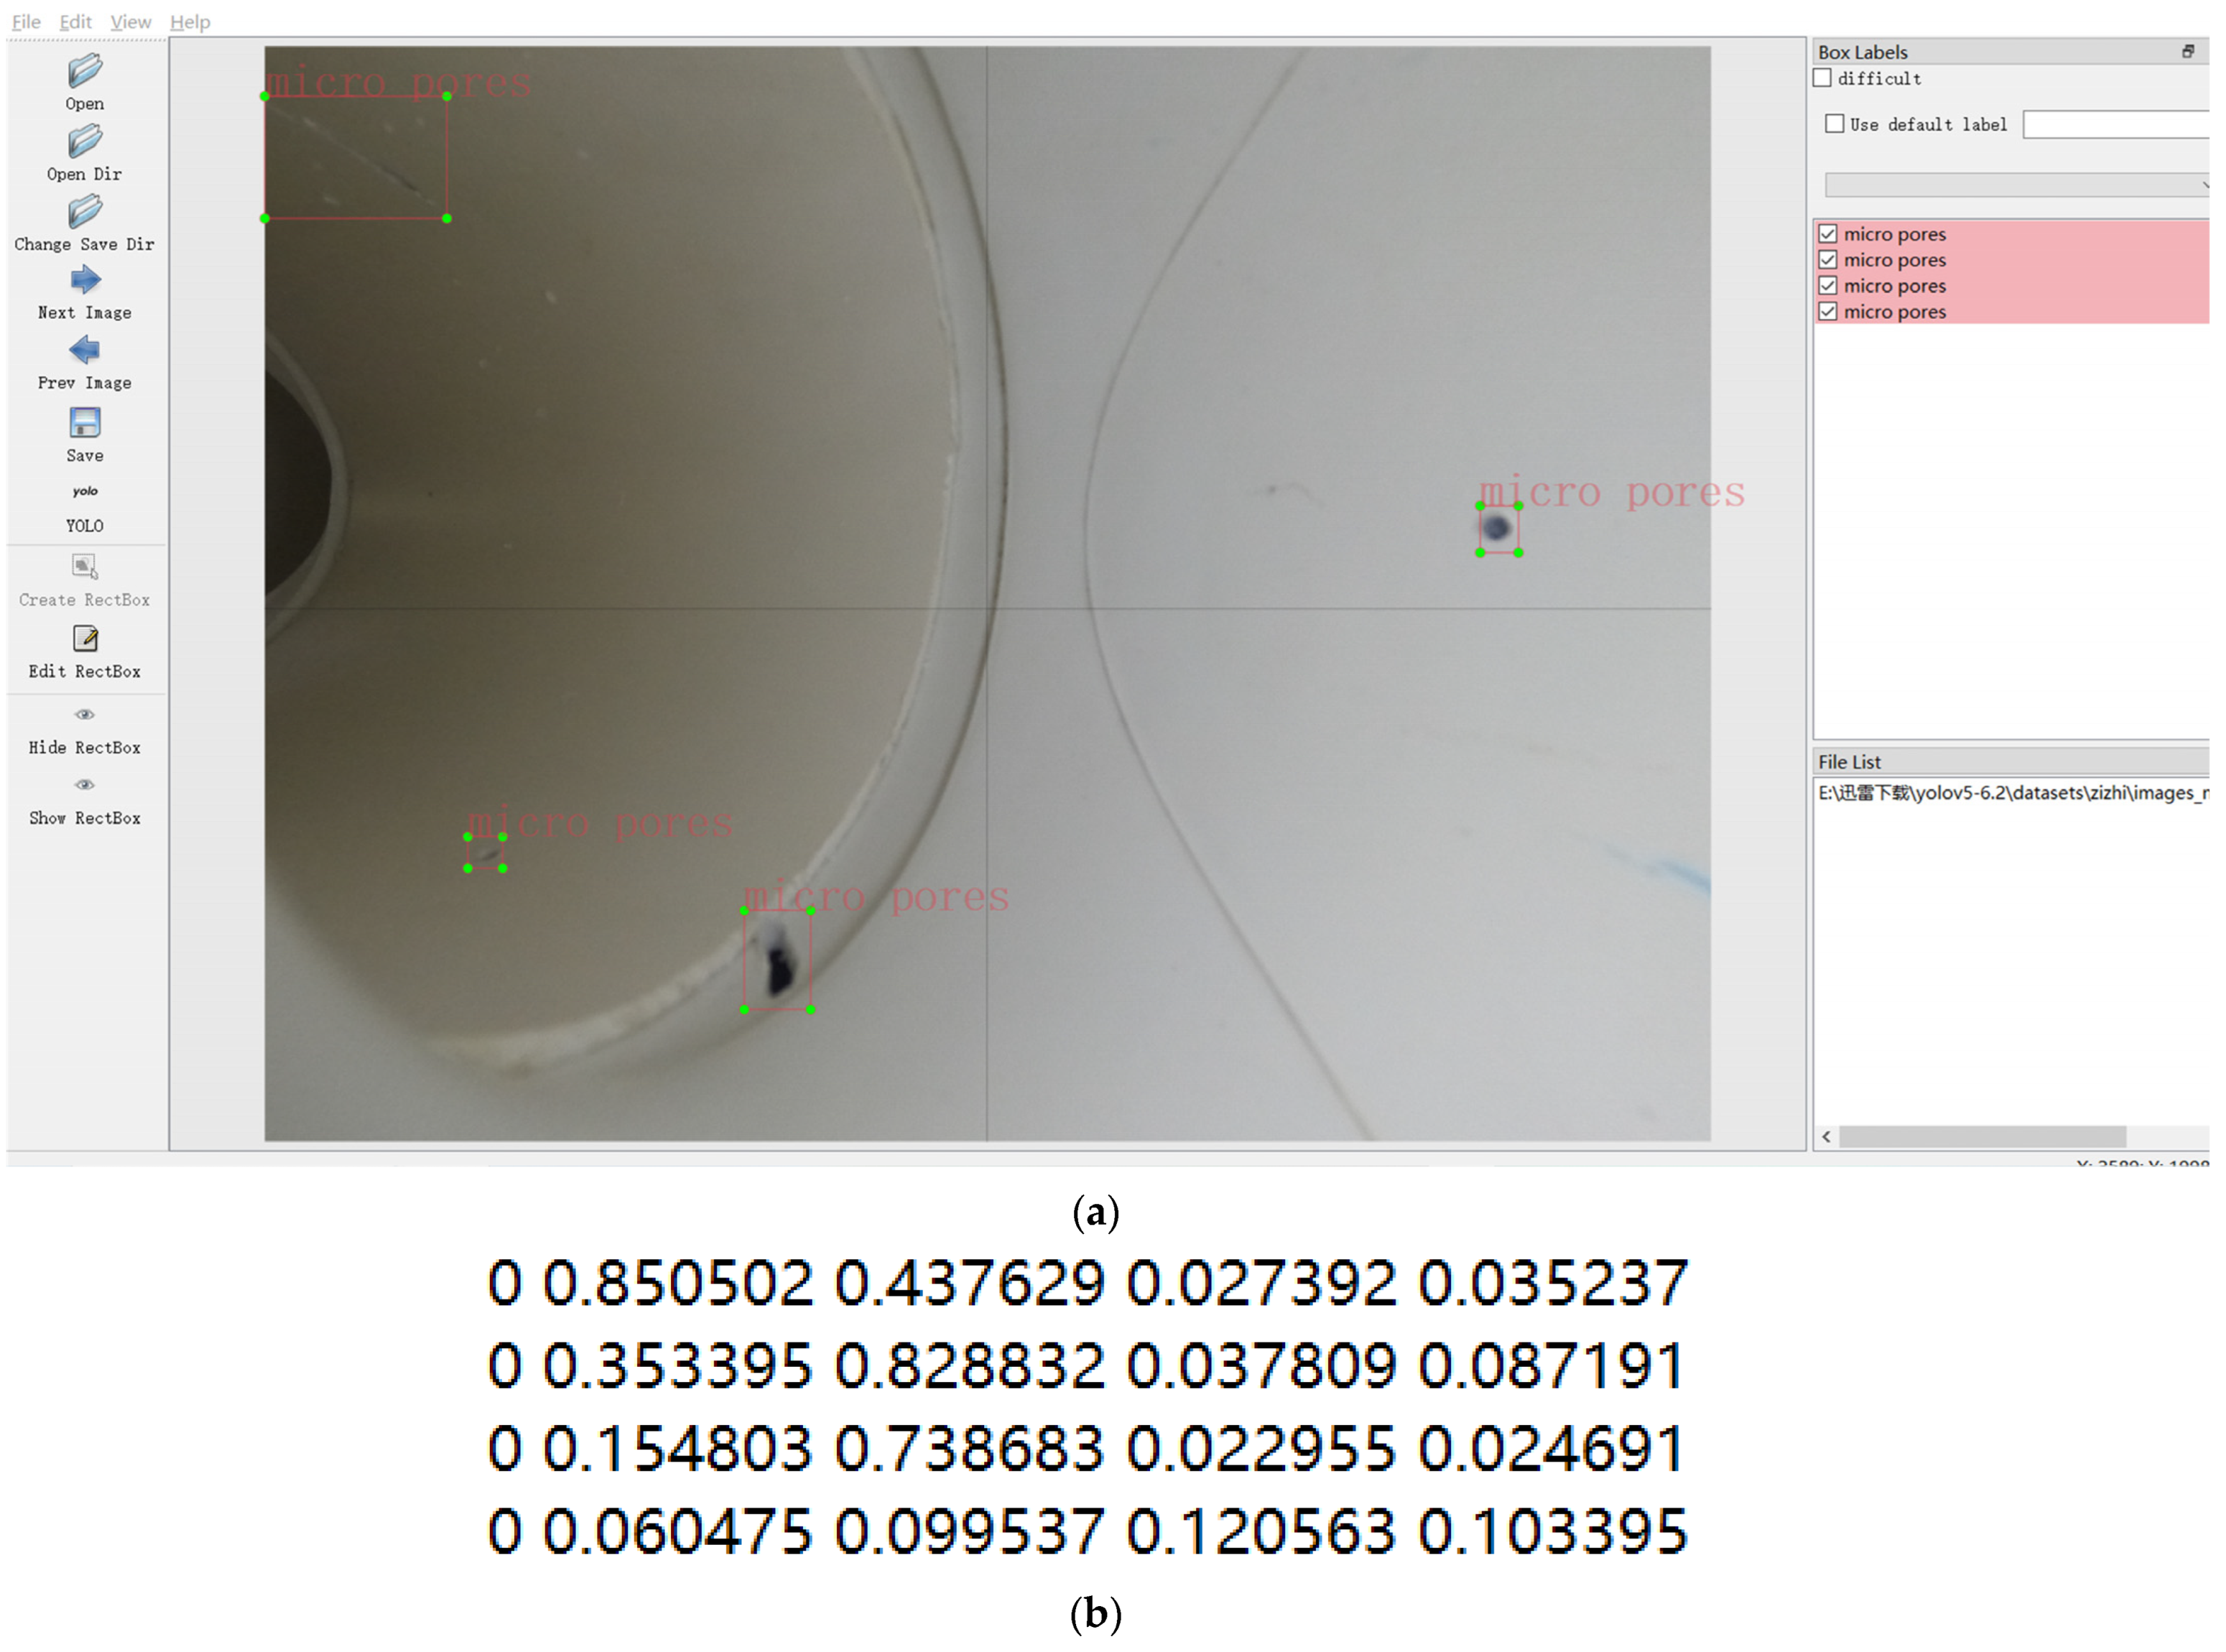
2.3. Annotation of Data Sets

In this paper, we use the labelimg image annotation tool to annotate the 1500 image datasets one by one, producing label data corresponding to each image. First, we use a rectangular labeling box to select the micropores in the image dataset. Second, we name the selected area, where the target in this paper is only micropores, which are named micropores. Then, we label all the micropores in an image, and the labelimg image labeling tool automatically saves them as label data after the labeling is finished. Finally, the 1500 image datasets are labeled one by one to generate the corresponding label data and create the corresponding label data for the dataset. The results using the lalelimg image annotation tool to annotate the micropores in the images are shown in Figure 5.

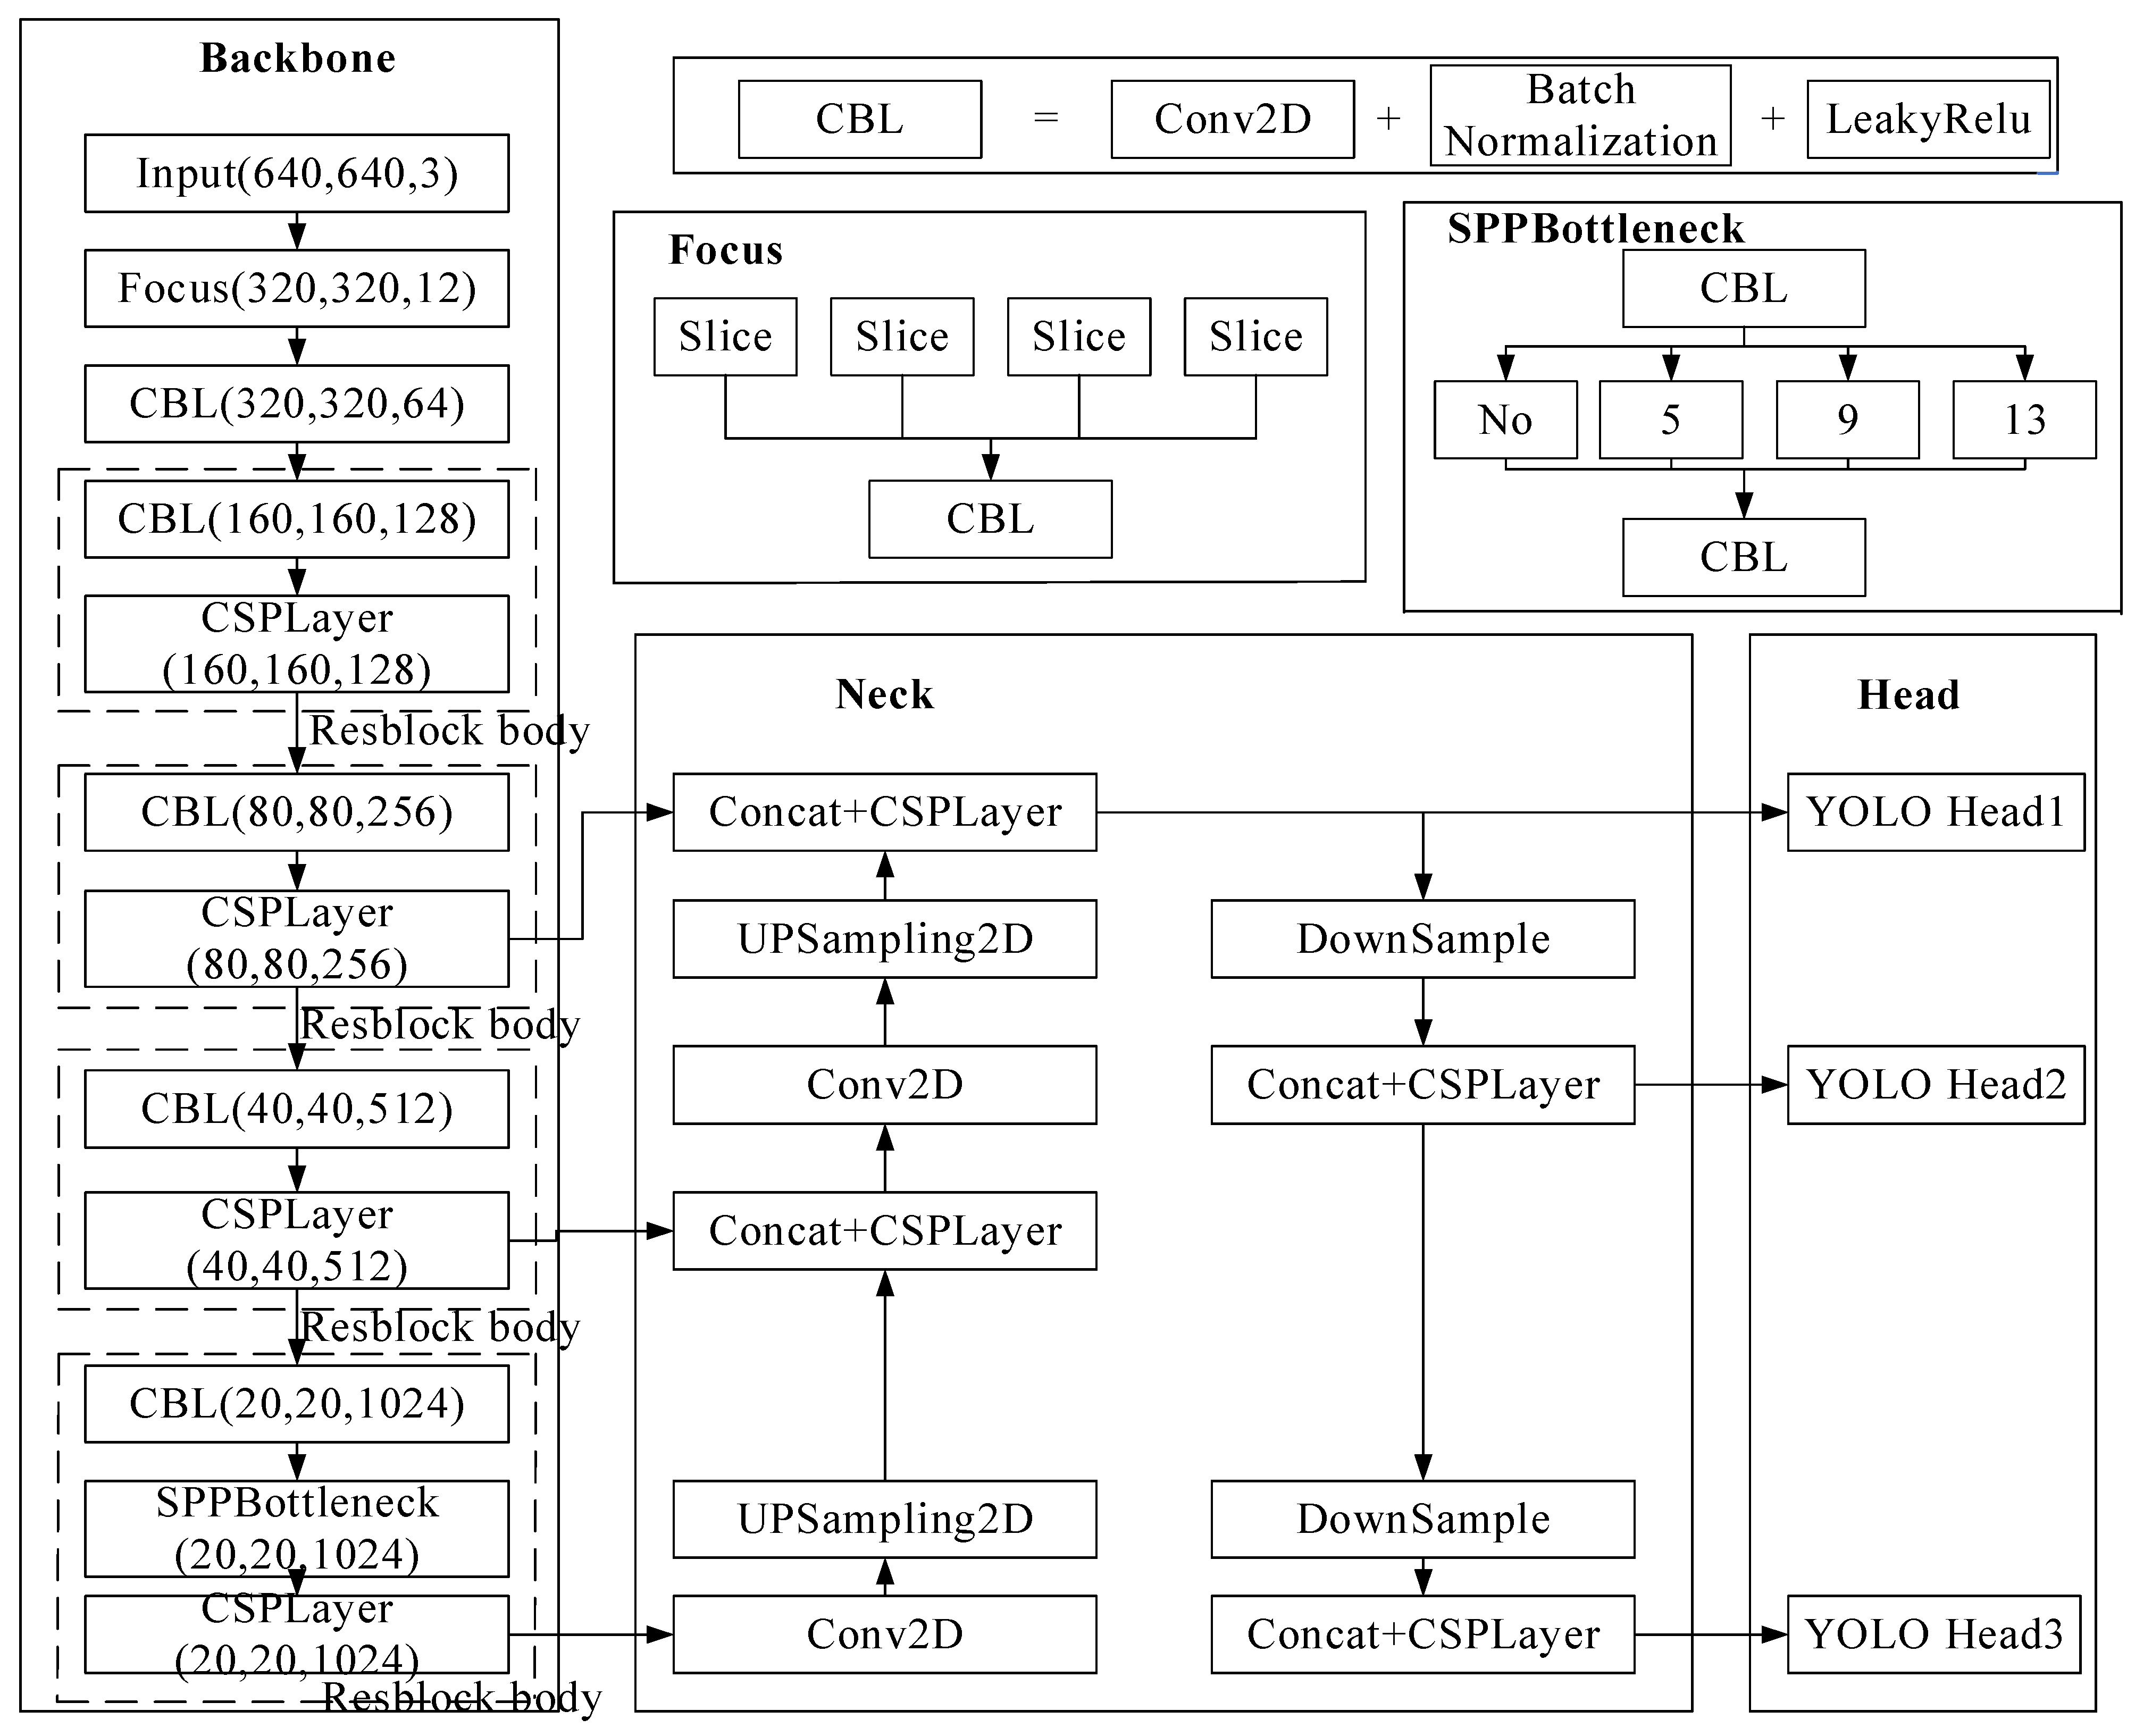
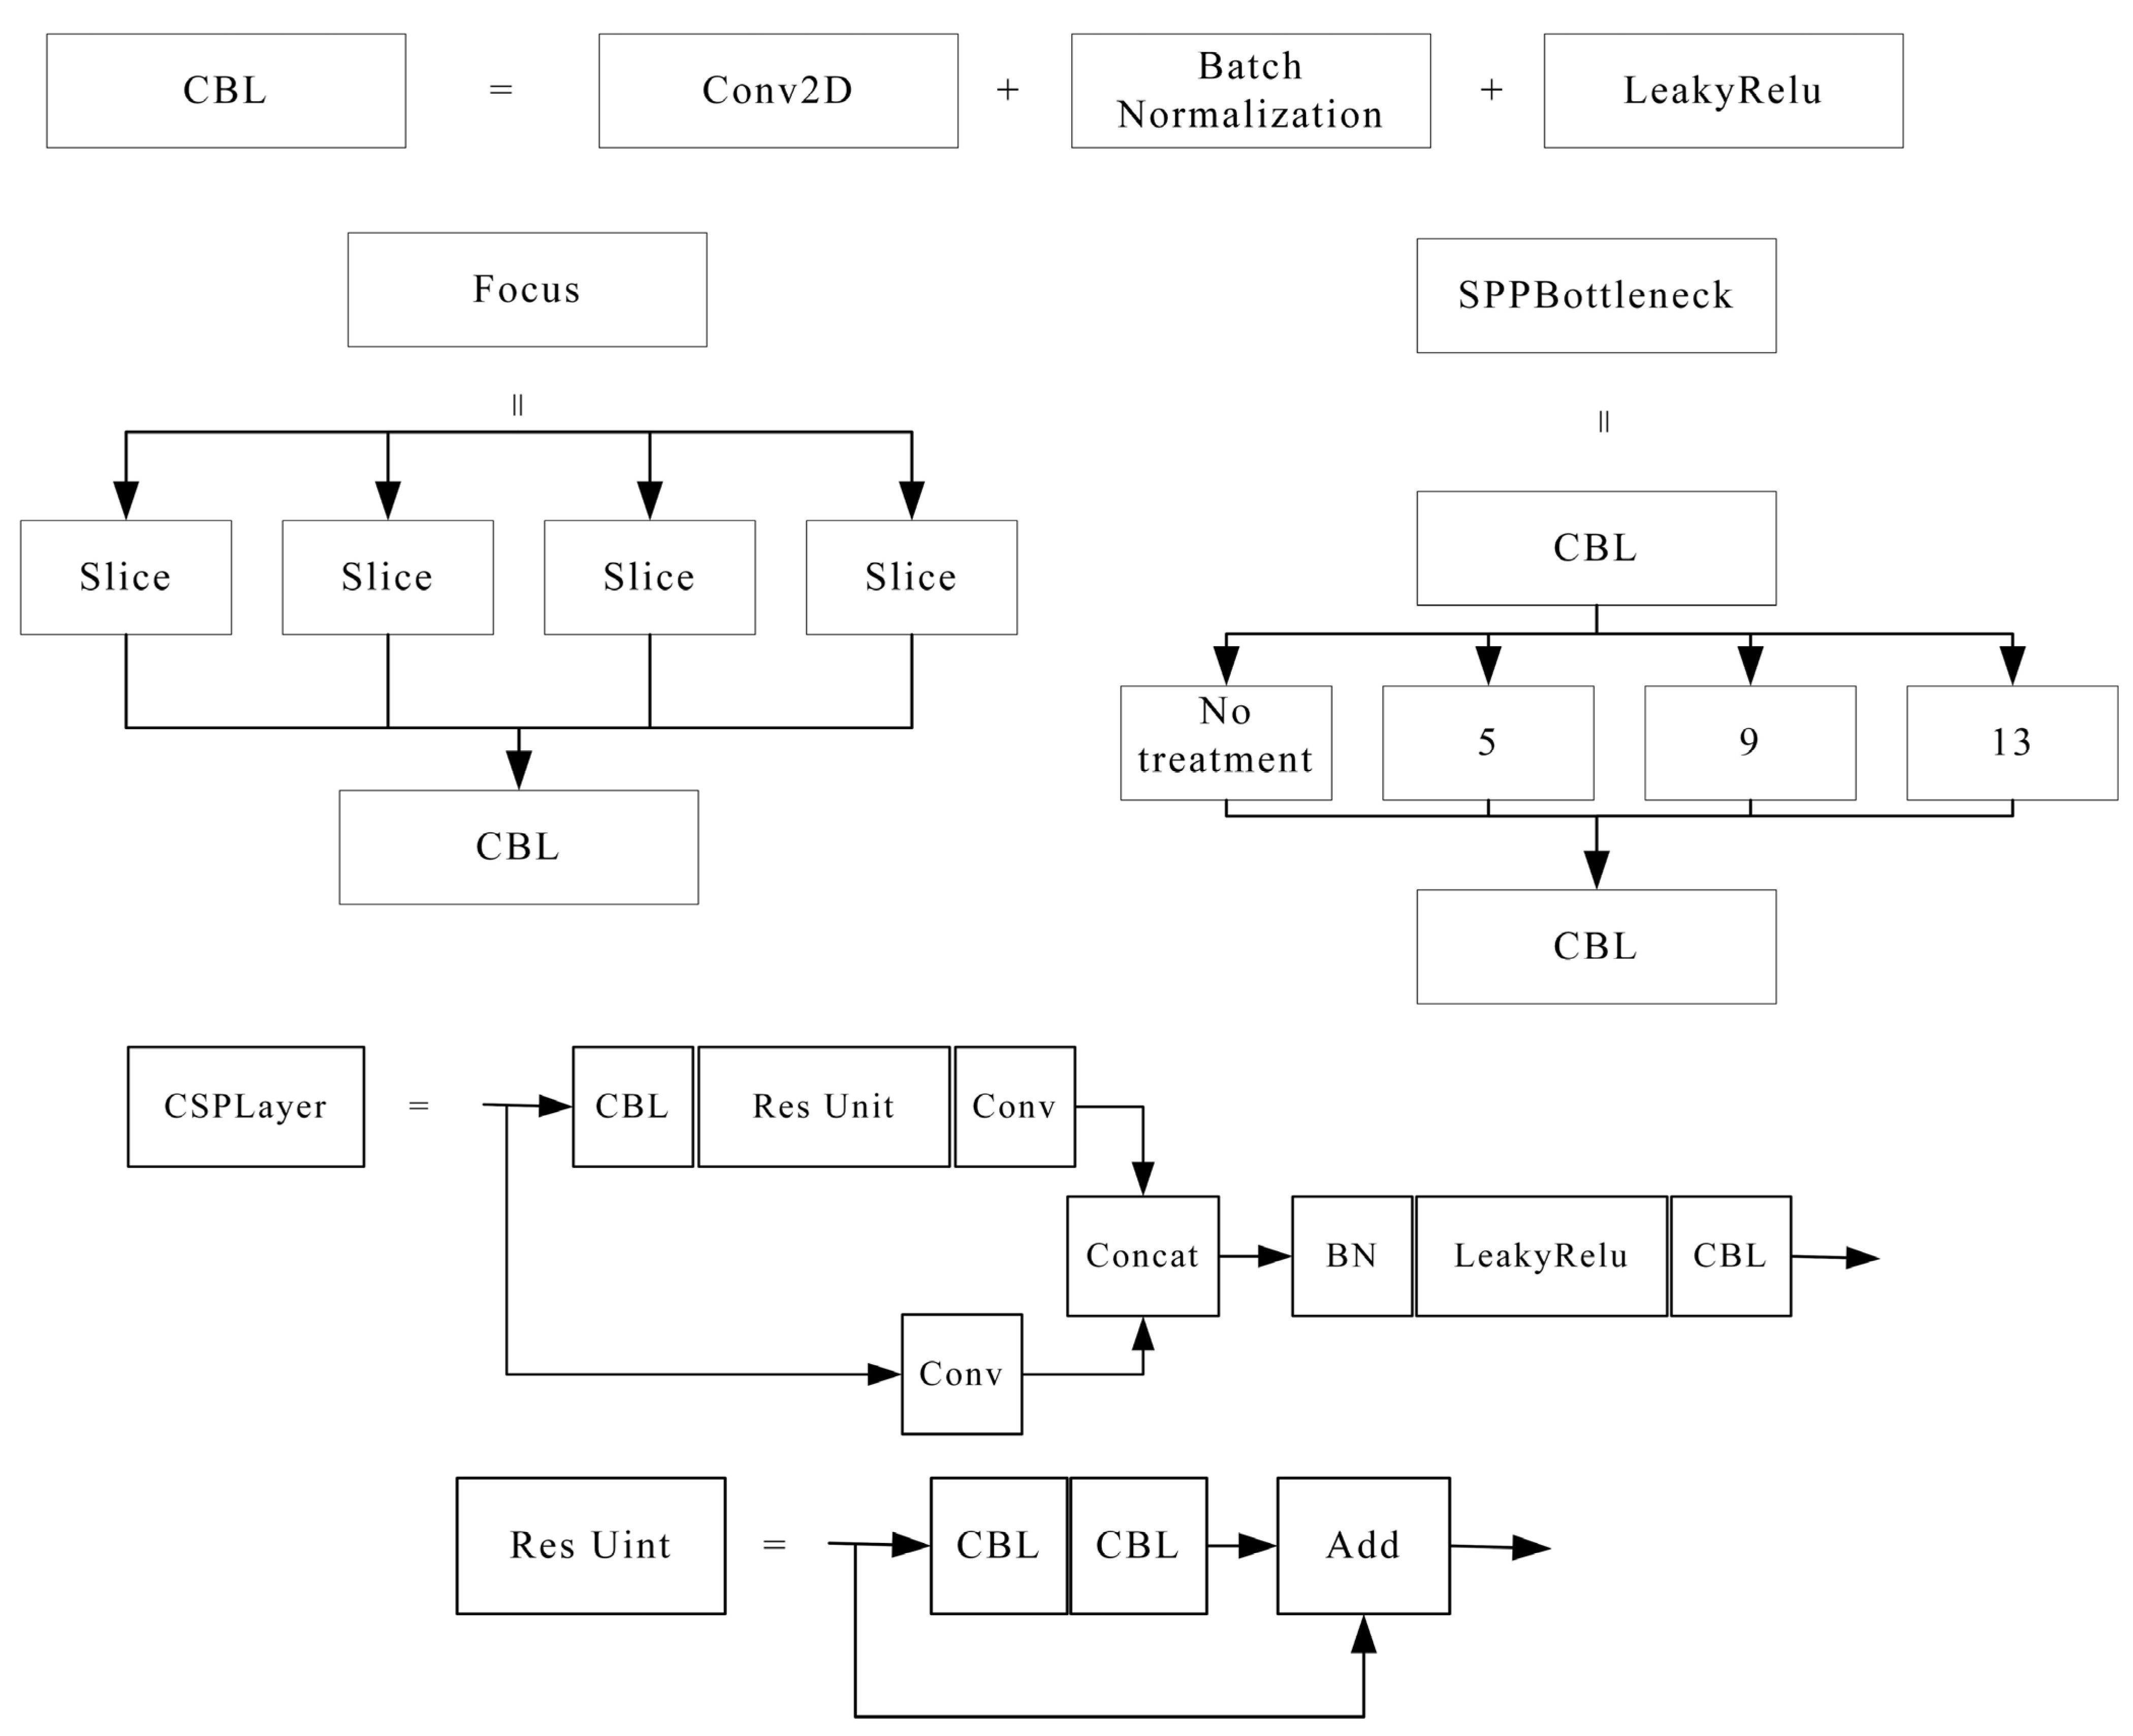
3. Construction of Micropores Identification Network Model

3.1. YOLOv5s Algorithm

The target detection algorithm is divided into the one-stage and two-stage algorithms. The training speed and detection speed of the one-stage algorithm is faster than the two-stage algorithm, while the two-stage algorithm has higher precision than the one-stage algorithm. In this paper, from the perspective of computer arithmetic power and training time, the YOLOv5s algorithm, which has a smaller network depth and network width in YOLOv5 [19], is selected as the base algorithm for the method developed in this paper.
The YOLOv5s algorithm can be divided into three networks consisting of a feature extraction network (Backbone), Neck, and Head depending on the role of the network [20]. The structure of the YOLOv5s algorithm is shown in Figure 6.
The three networks: Backbone, Neck, and Head consist of many modules such as the Focus module, CBL module, CSP module, SPP module, Conv2D module, UPSampling2D module, Down-Sample module, Concat, and Res module. The structure of each module is shown in Figure 7.
In this paper, based on the existing structure of the YOLOv5s algorithm, the structure of the YOLOv5s algorithm is improved for application to the scenario of micropores inside small gas pipelines to meet the micropore recognition requirements. First, the Backbone uses the CSPDarknet structure in the YOLOv5s algorithm to extract micropore feature information from the micropore images from inside the pipelines in the input network model. Second, we improve the Neck layer by introducing the BiFPN structure into the Neck layer, replacing the original feature pyramid network (FPN) + path aggregation network (PAN) structure, and fusing the output micropores feature maps in the Backbone with cross-scale feature information to improve the precision of micropore identification [21]. Finally, we improve the Head layer by constructing a new small target detection in the original Head layer to identify micropores with smaller sizes and improve the micropore detection rate [22].

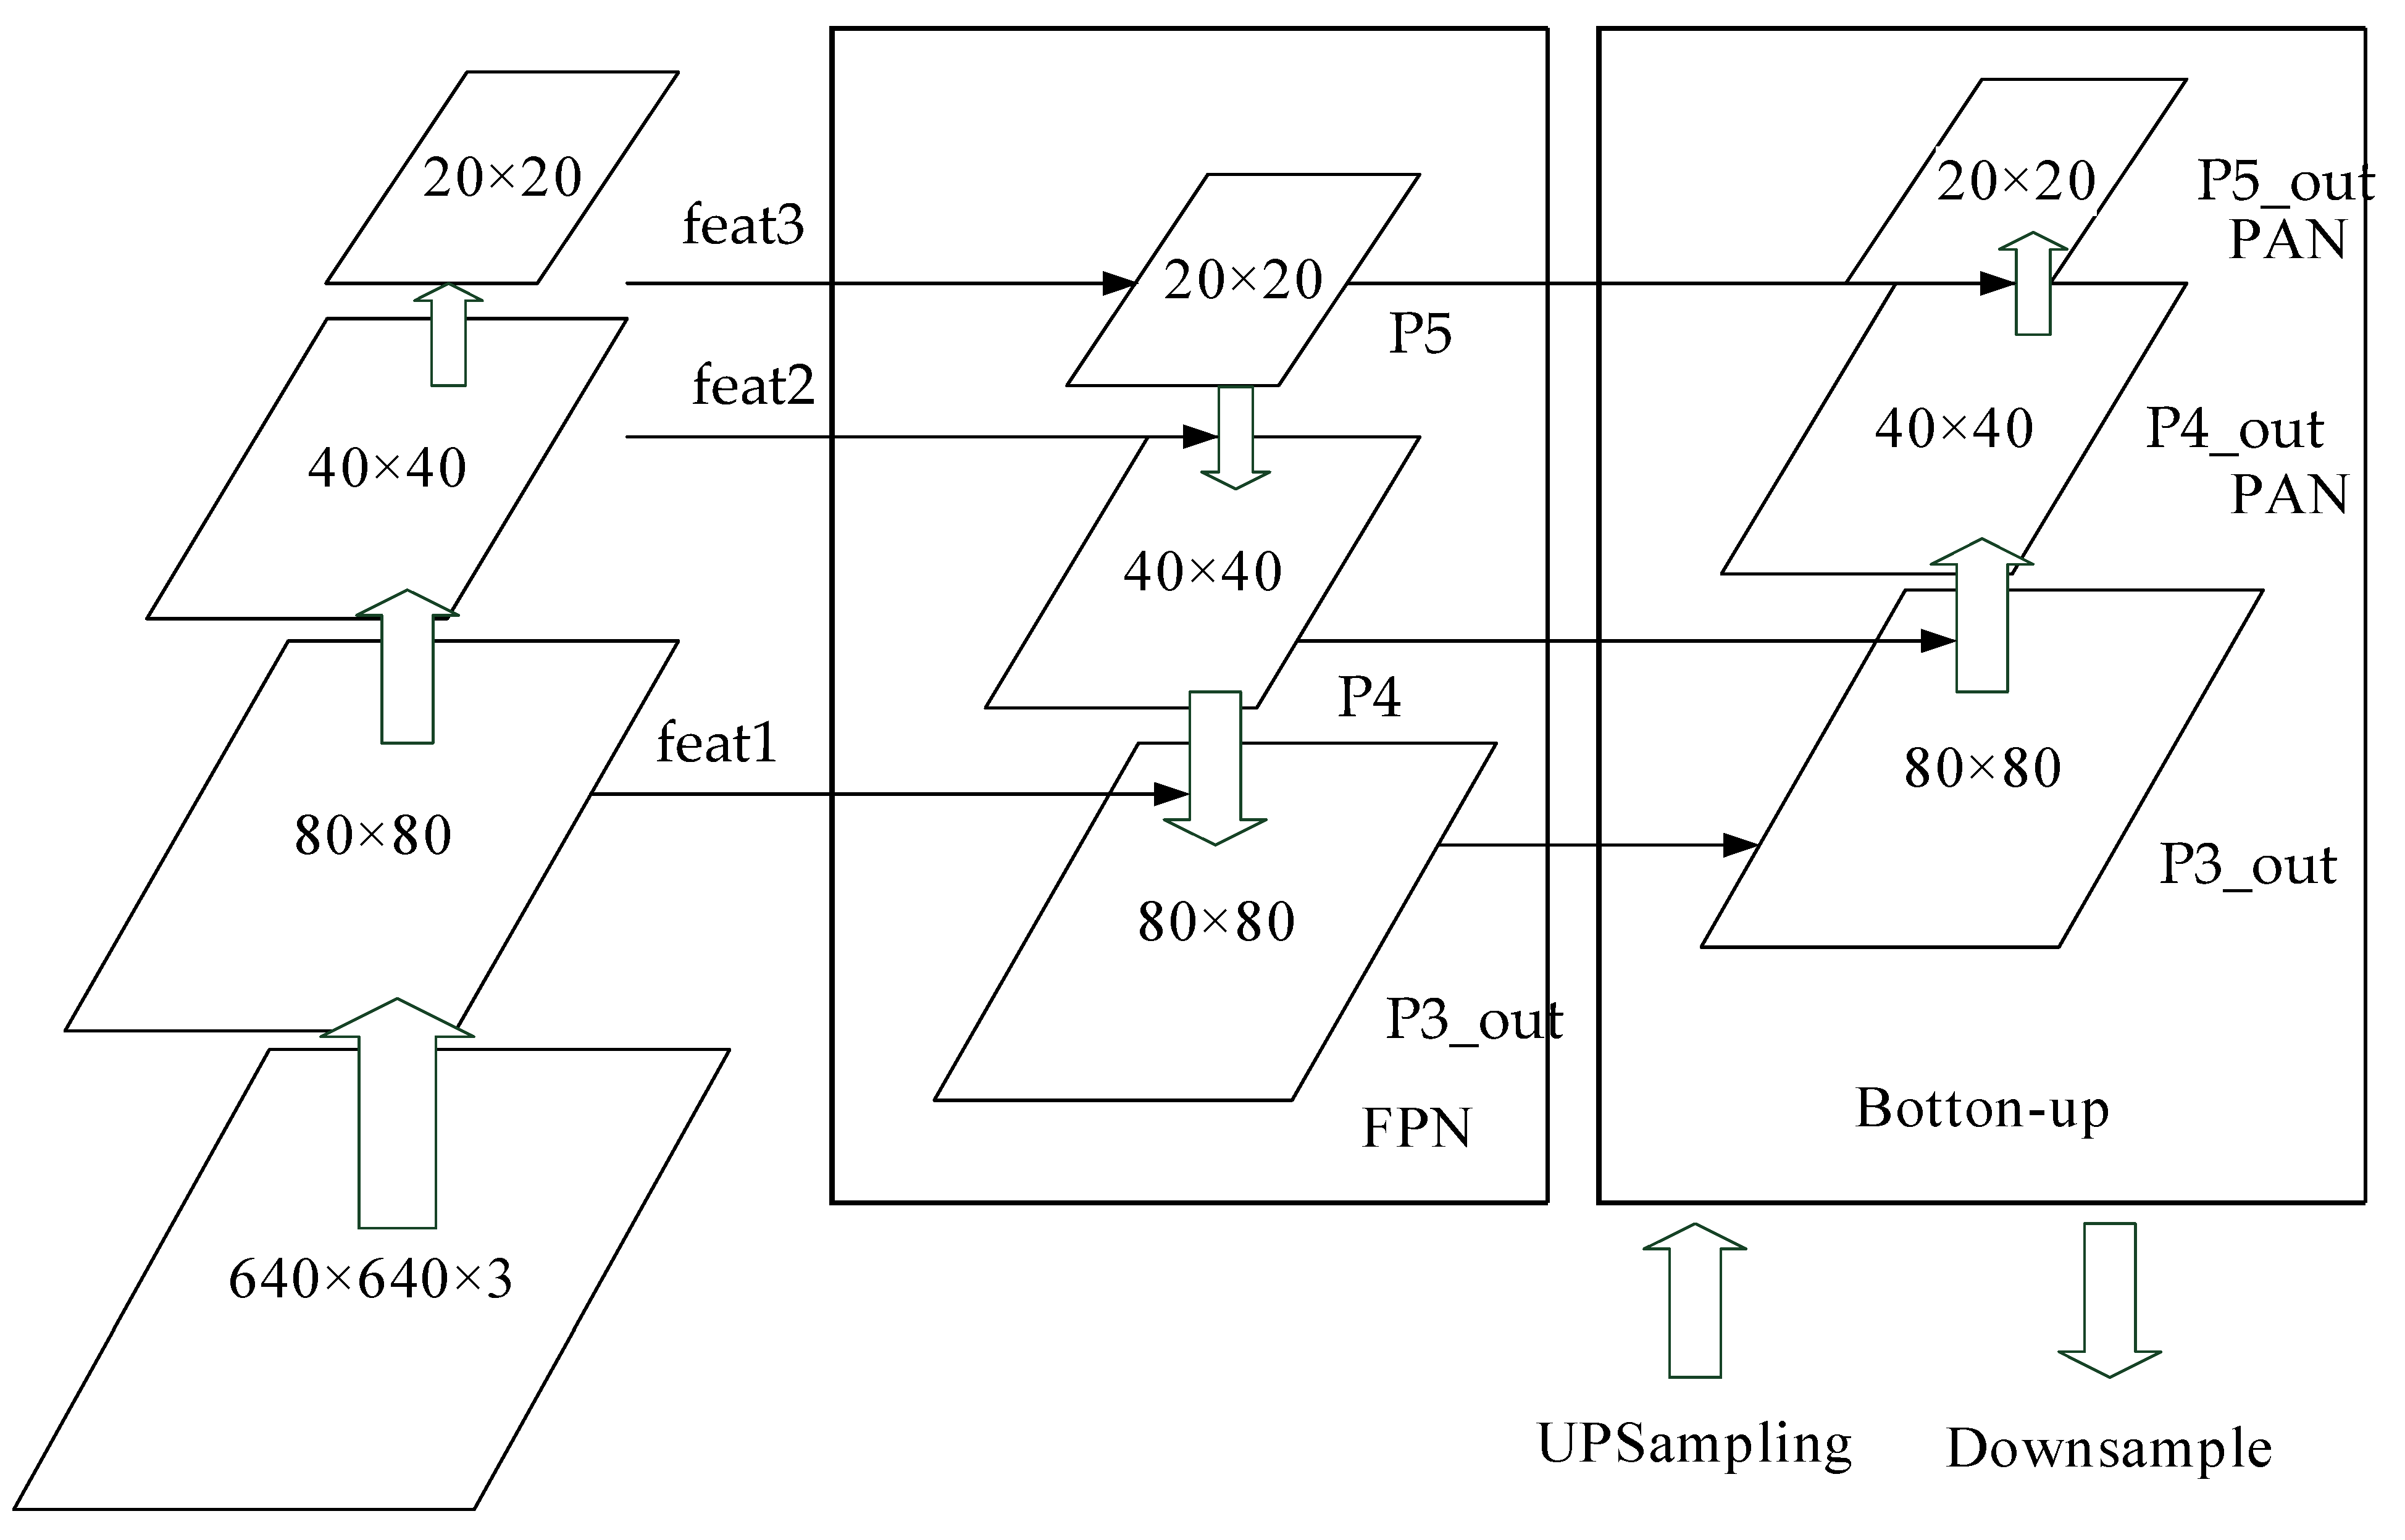
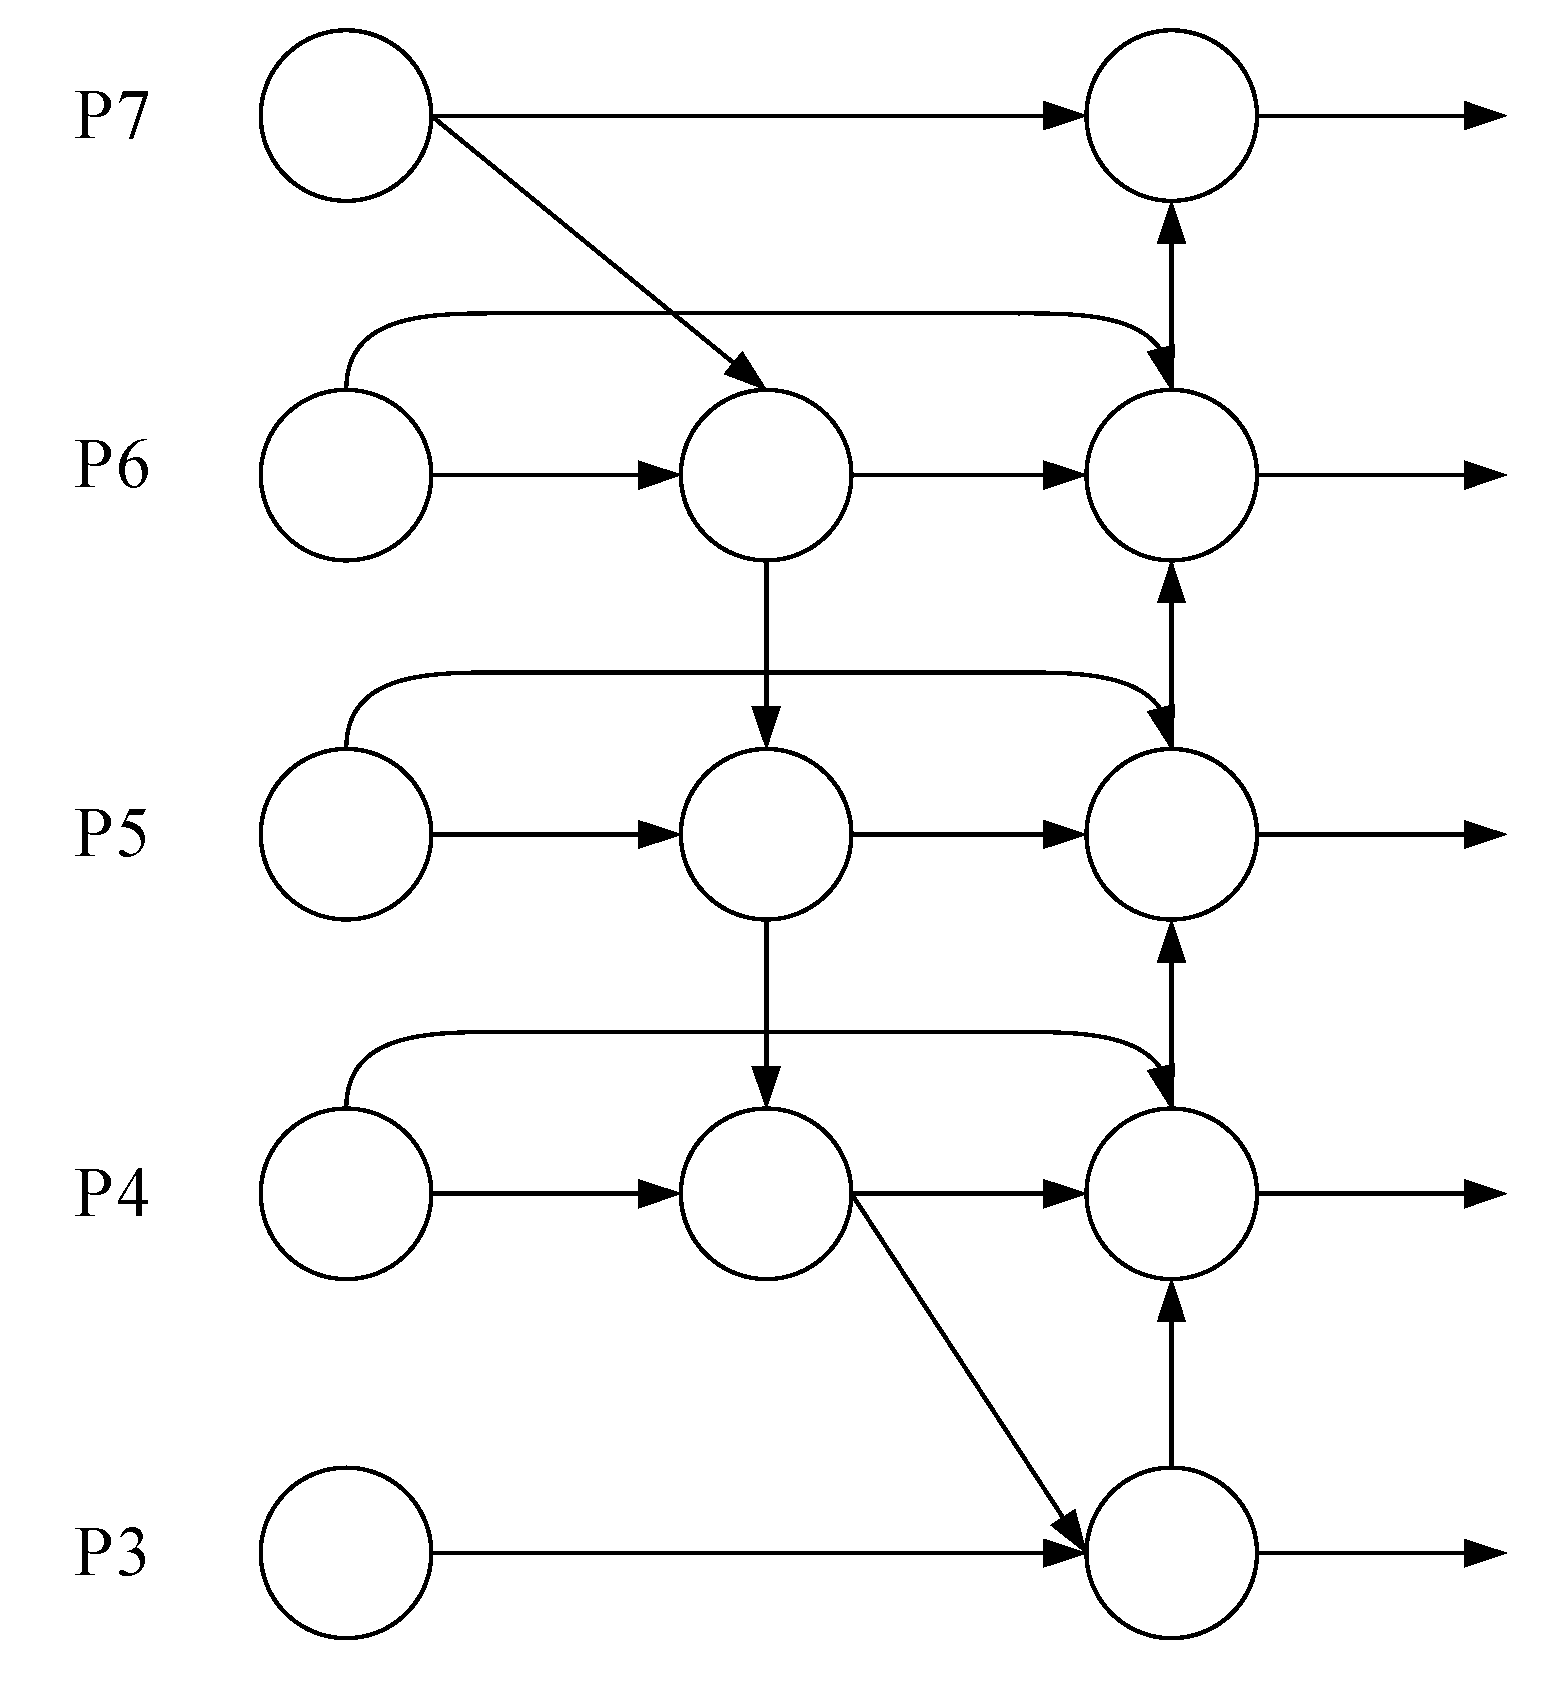
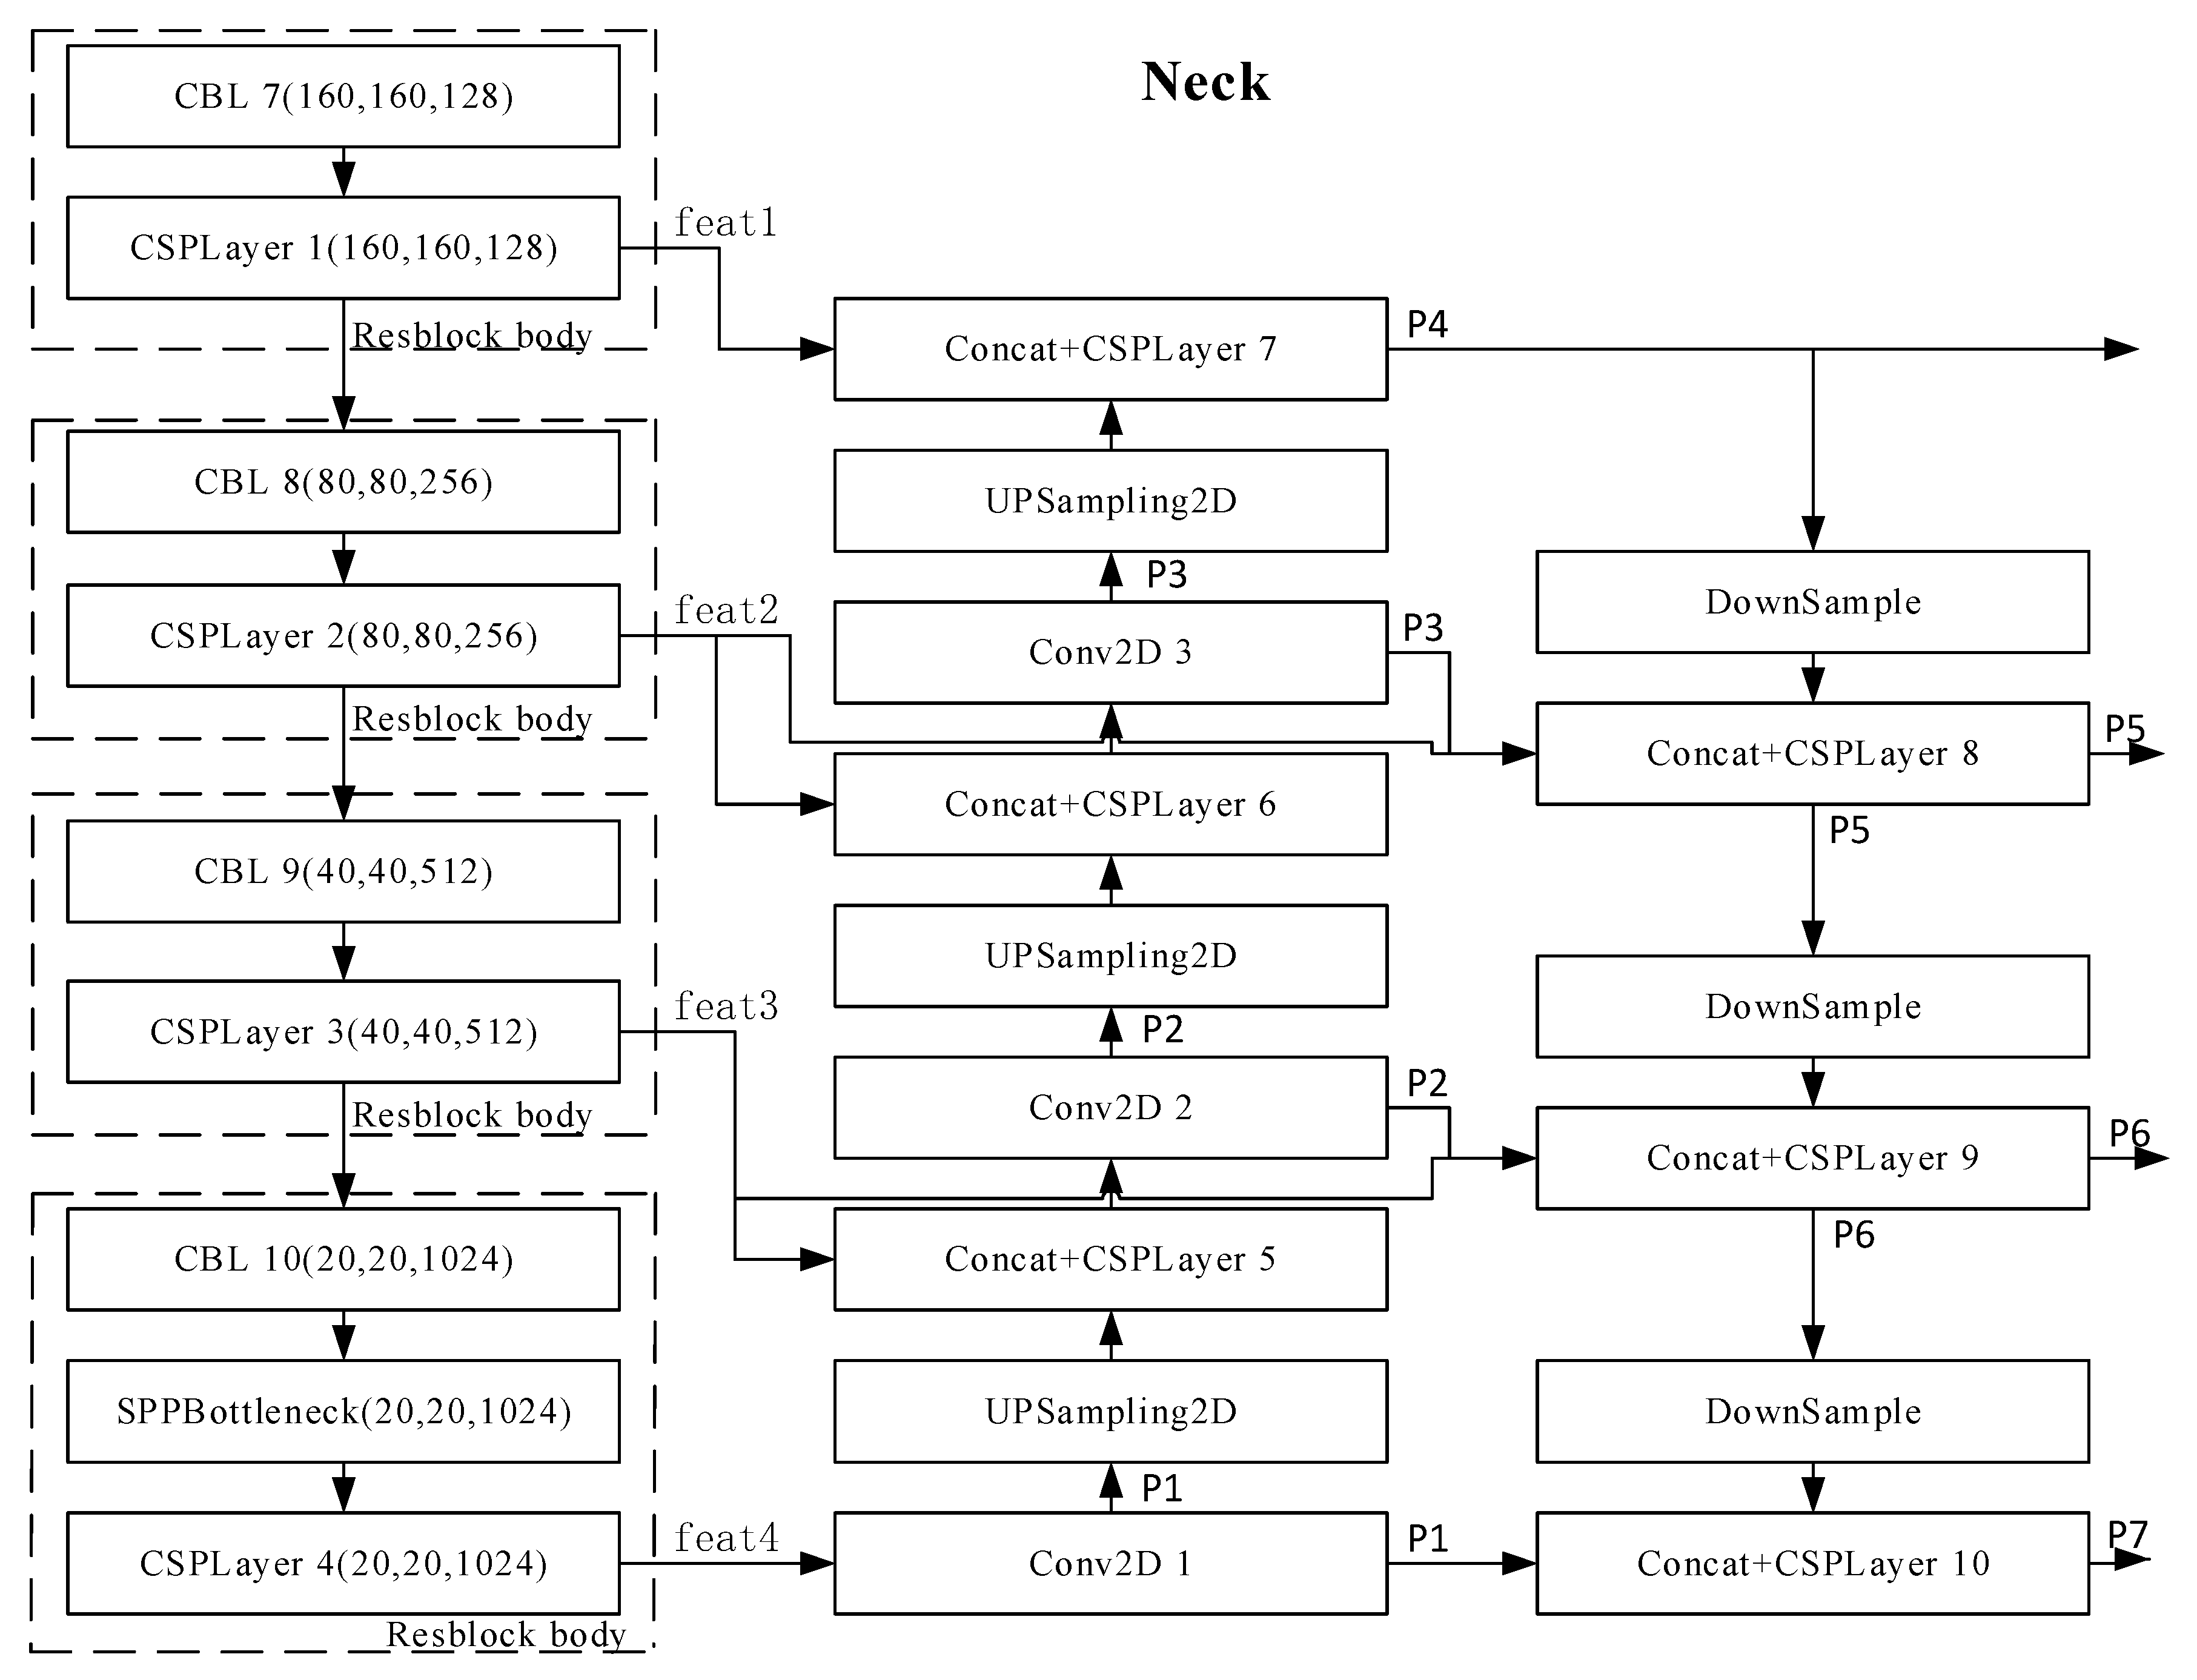
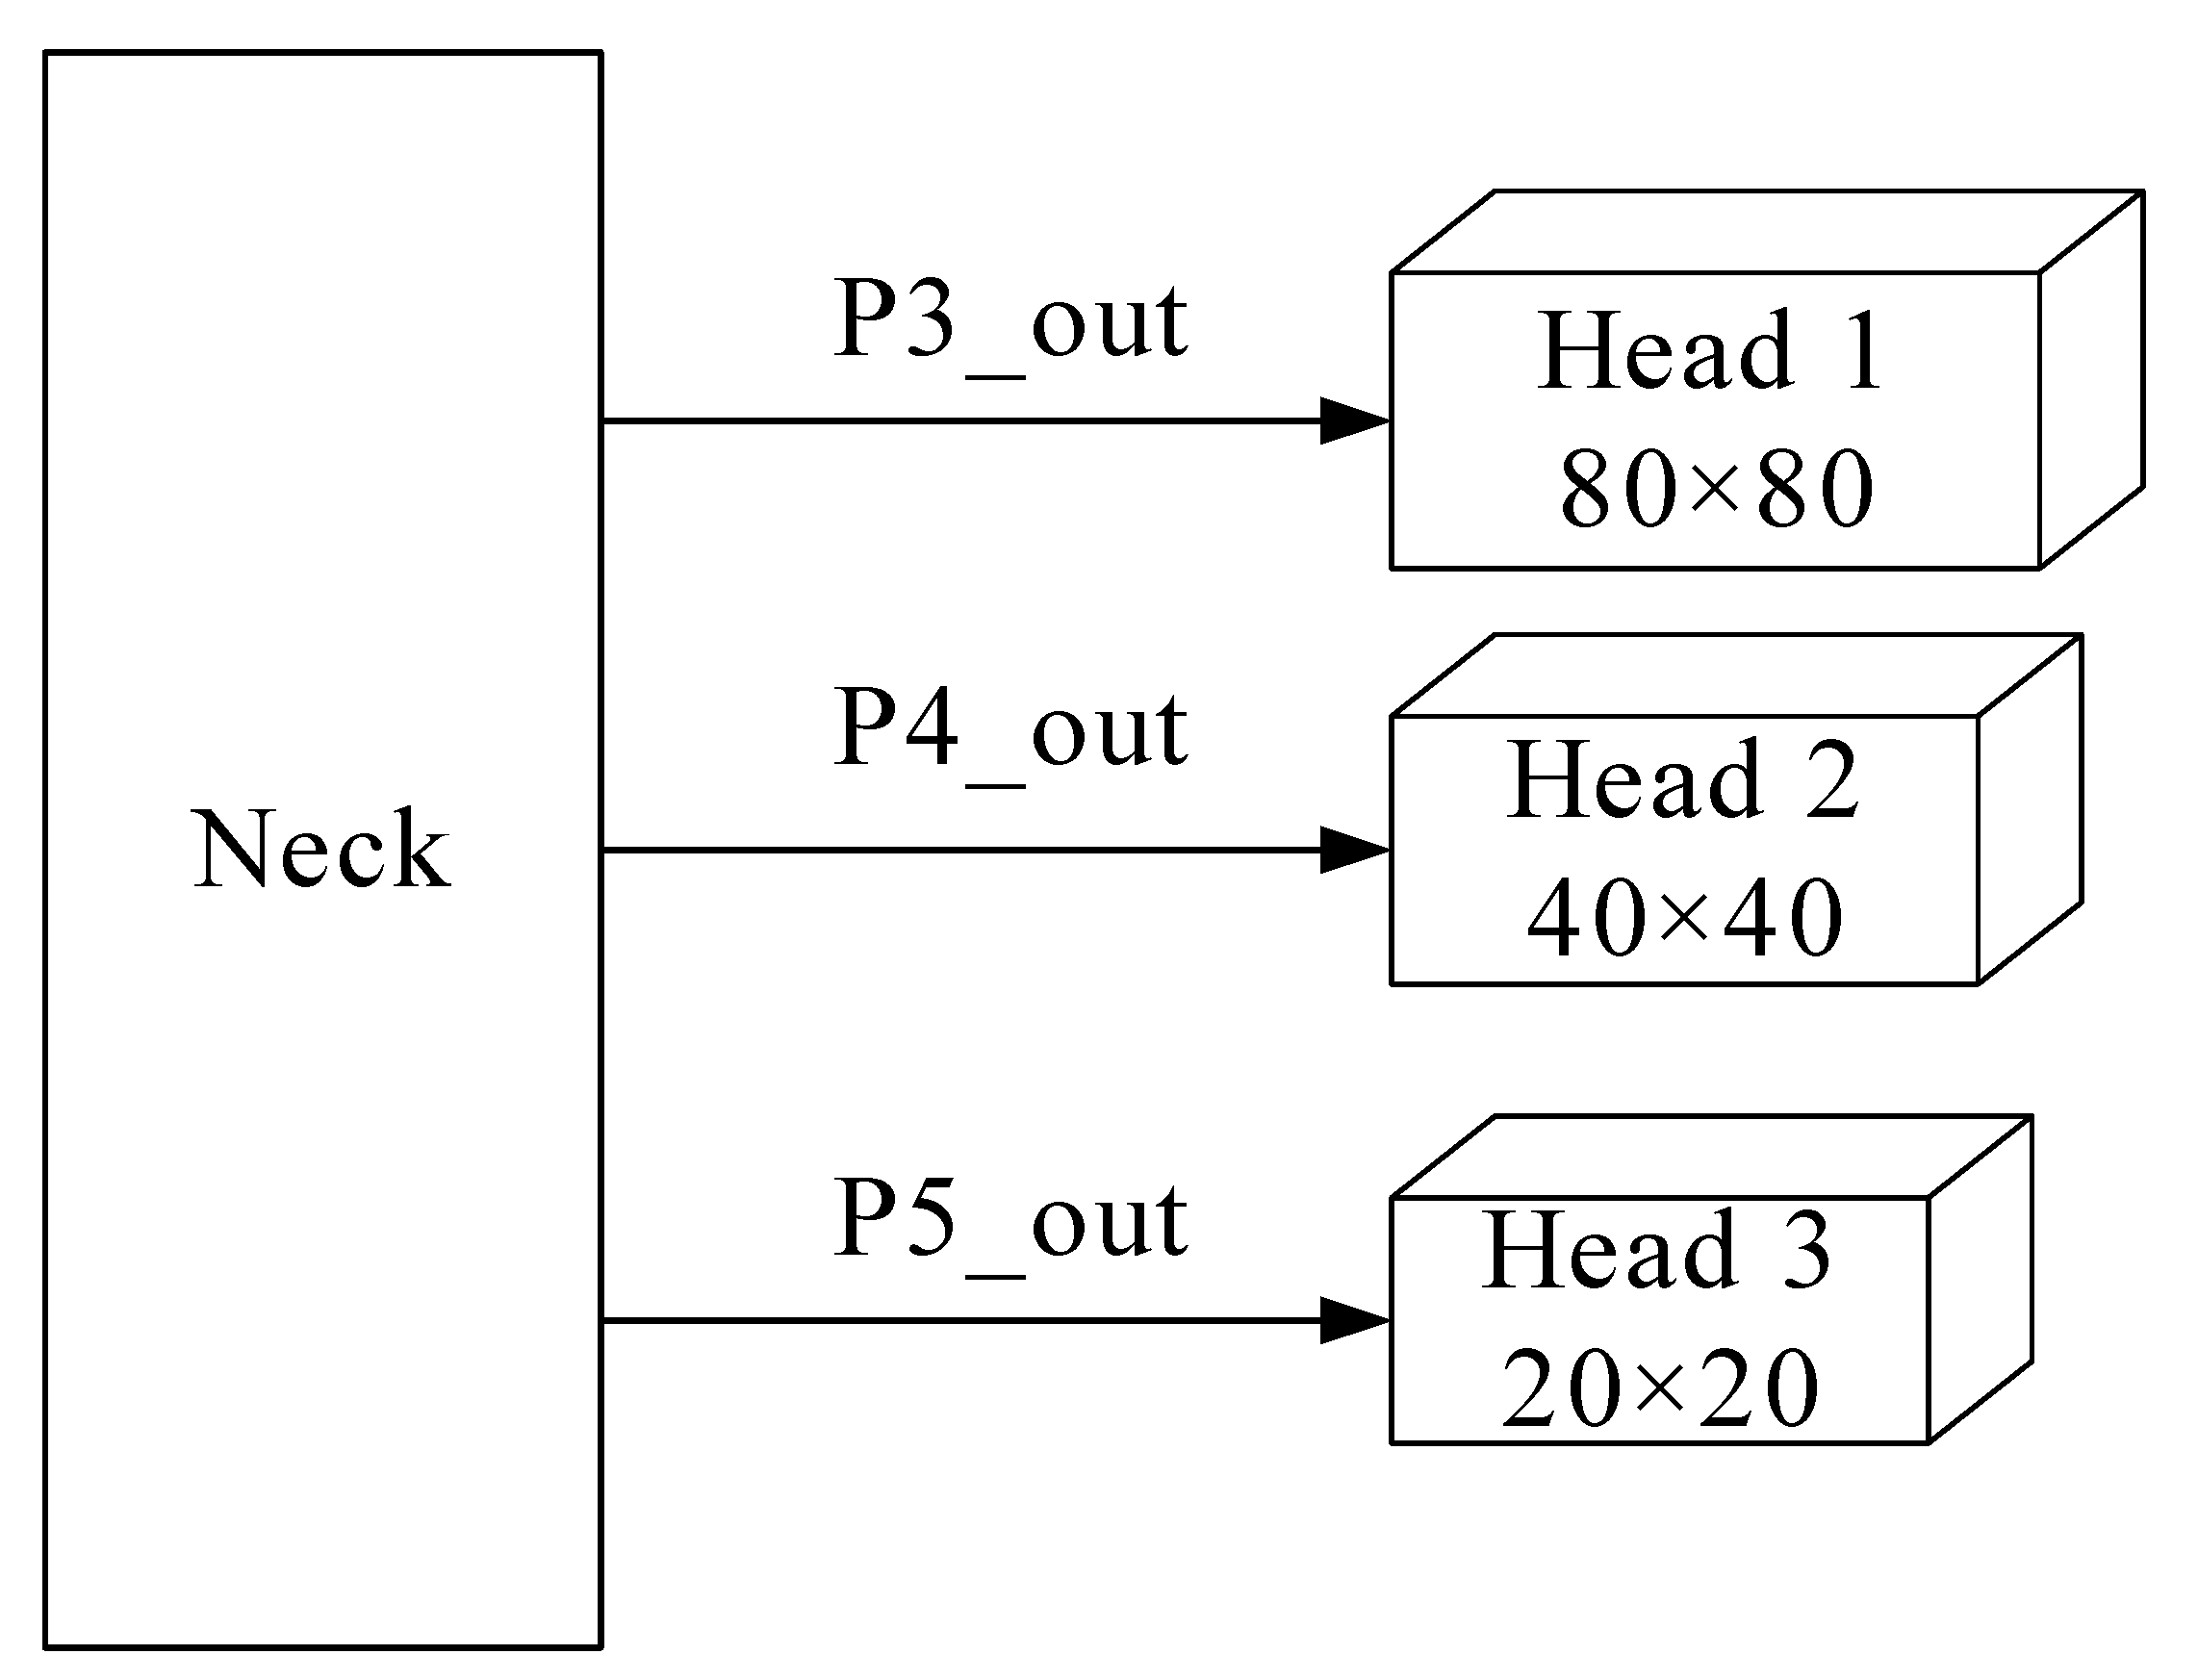
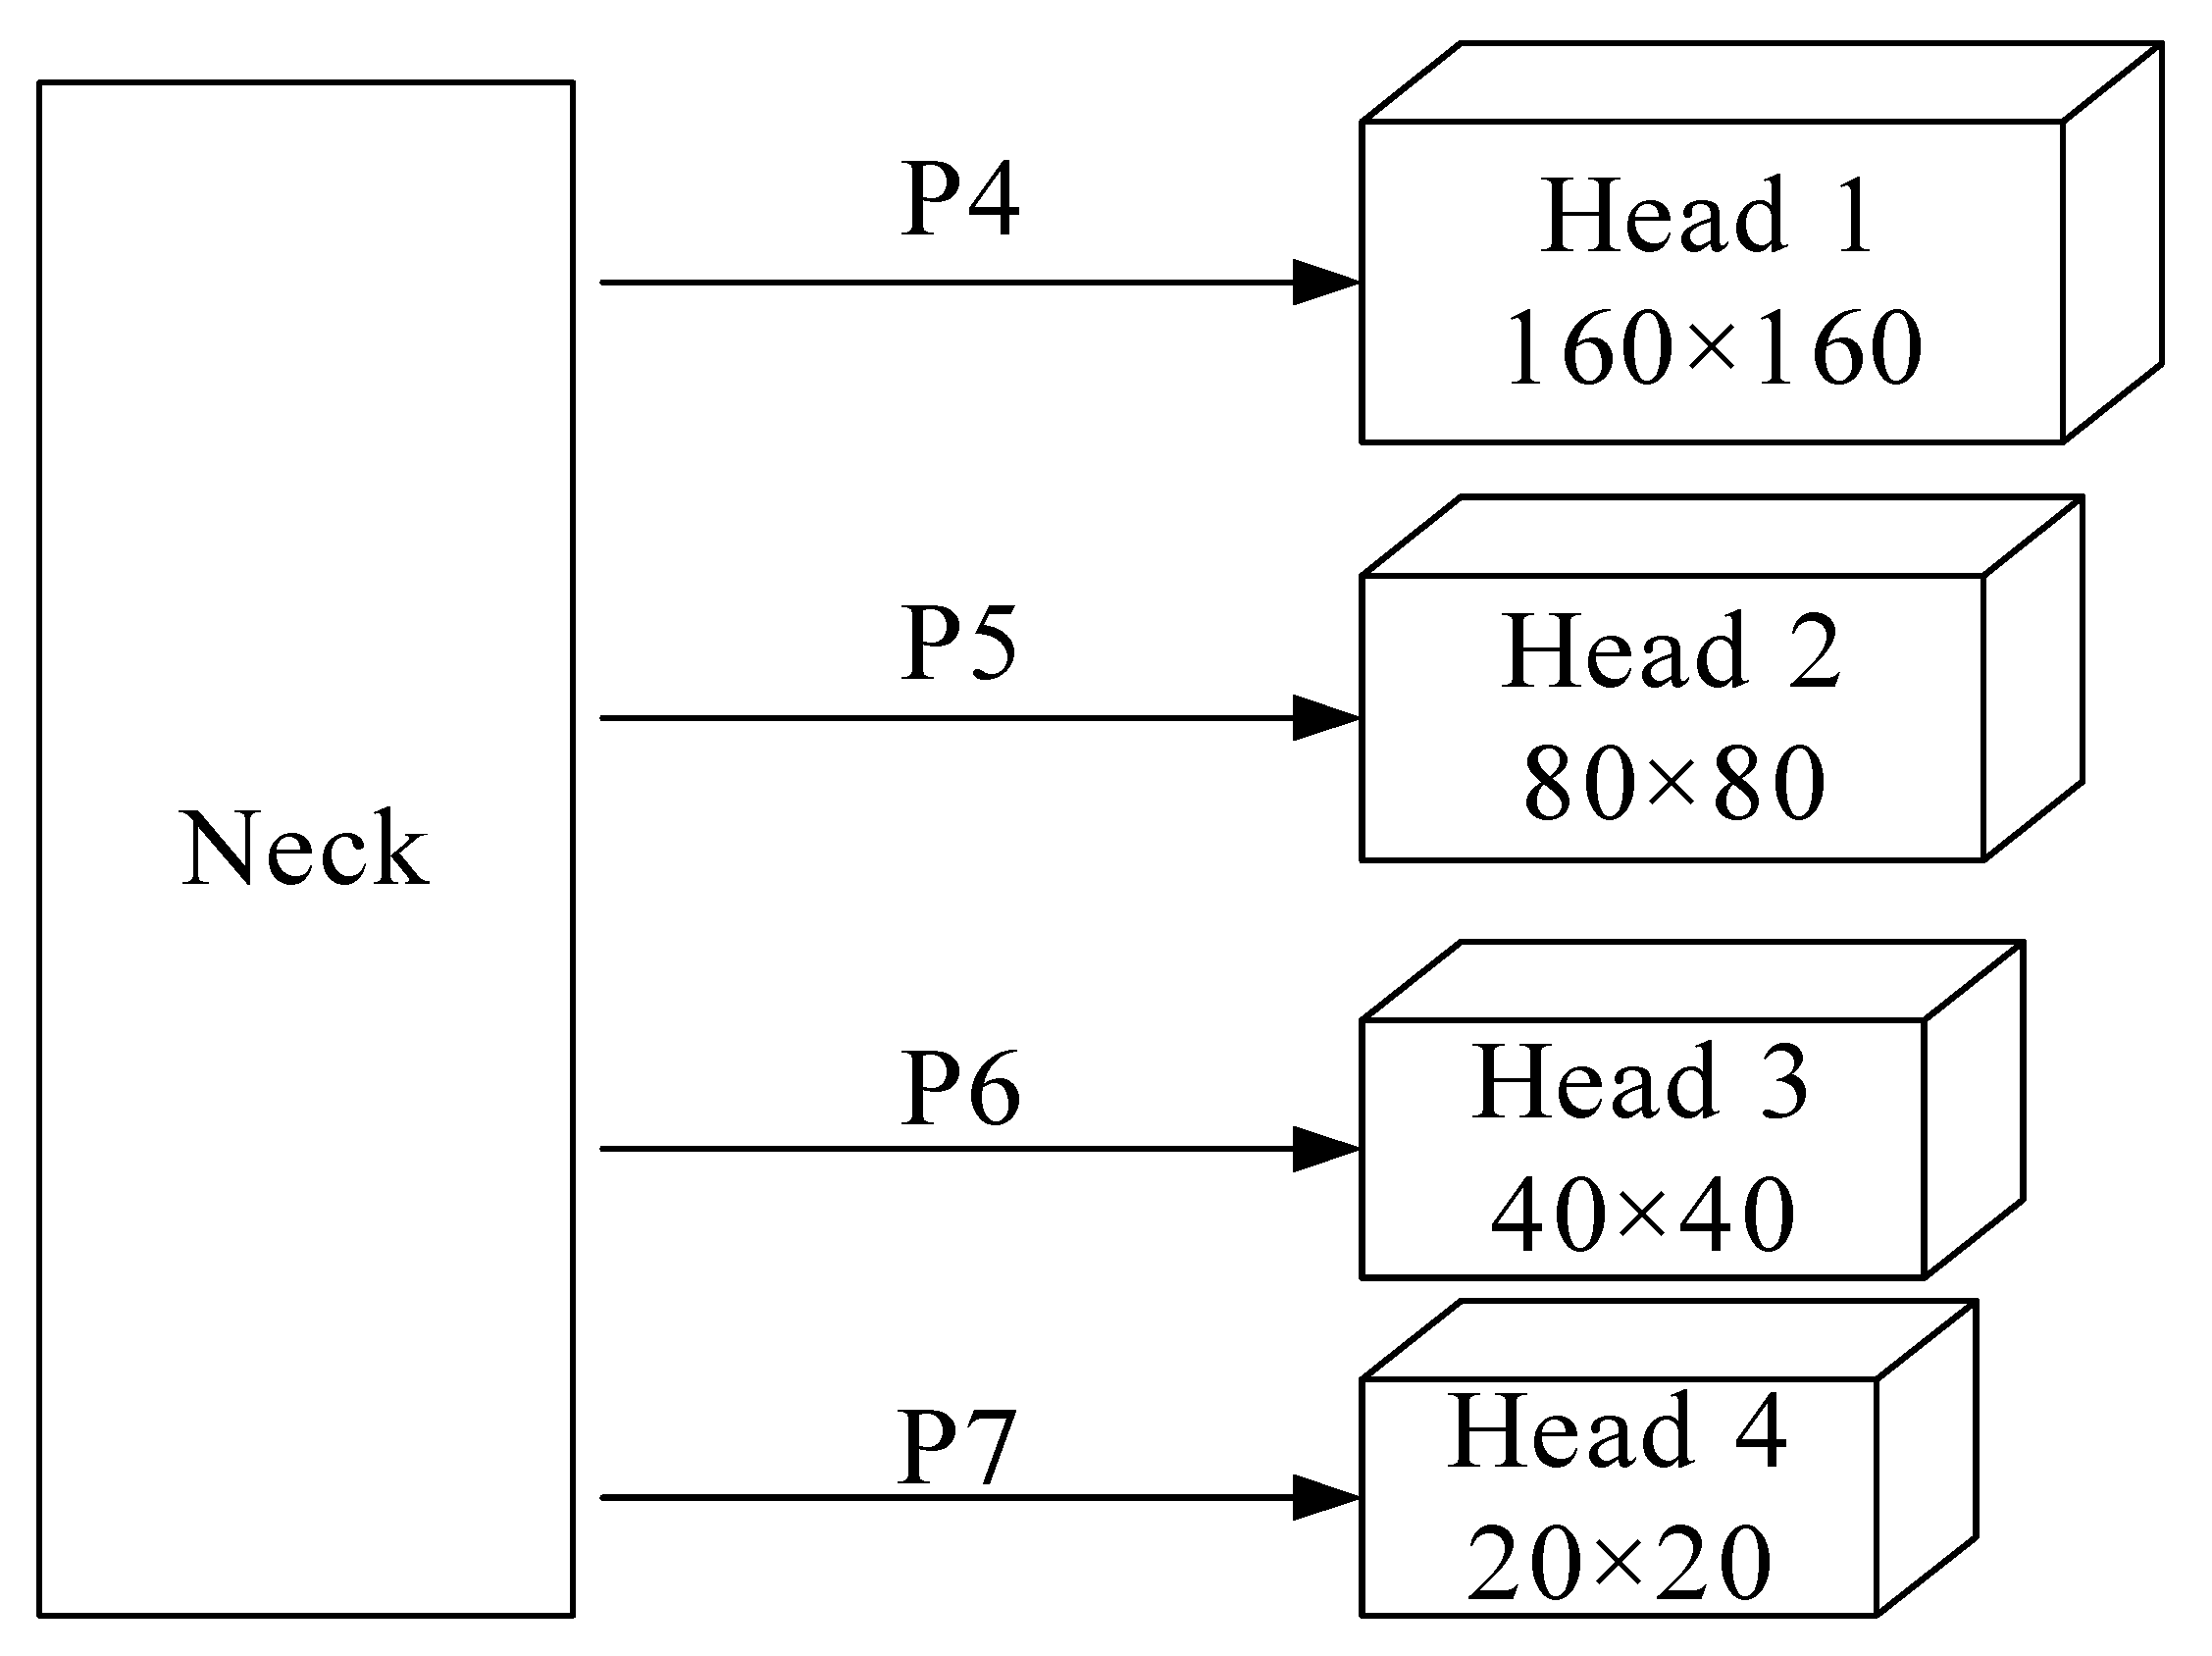
3.2. Construction of the Neck Layer

The Neck layer in the YOLOv5s algorithm has the FPN + PAN structure, which uses a combination of top-down and bottom-up approaches to fuse feature information at different scales to achieve multi-scale fusion. The FPN + PAN structure is shown in Figure 8.
The FPN + PAN structure is cumbersome, has many parameters, and can only achieve the fusion of adjacent scale information. To reduce the computation of the network model and improve the precision of micropore recognition, this paper introduces the BiFPN structure into the Neck layer of YOLOv5s to replace the FPN + PAN structure of the YOLOv5s Neck layer. The BiFPN structure uses cross-scale connecting lines, which not only realize the fusion of adjacent feature information but also realize cross-scale information fusion, thus realizing the multi-scale information fusion of micropores and improving the precision of micropore recognition. The BiFPN structure is shown in Figure 9.
The feature extraction network elicits four preliminary feature layers: feat1, feat2, feat3, and feat4 at different scales from different CSPs n (n = 1, 2, 3, and 4), respectively, and inputs them into the BiFPN structure for feature fusion. The fused four enhanced feature layers are input into the four head classification prediction networks for classification prediction. The structure of the Neck layer constructed in this paper is shown in Figure 10.

3.3. Construction of the Head Layer

The Head layer of the YOLOv5s network model includes three different detection heads (YOLO Head), namely, Head 1 (80 × 80), Head 2 (40 × 40), and Head 3 (20 × 20). The enhanced feature layers P3_out, P4_out, and P5_out output from the Neck layer correspond to the input to Head 1, Head 2, and Head 3 for target classification and prediction, respectively, to achieve the recognition of small, medium, and large targets in the input image. The location of the target is selected using a rectangular box to give confidence that the target belongs to that category. The Head layer structure of the YOLOv5s algorithm is shown in Figure 11.
In this paper, the micropores inside the small- and medium-sized gas pipes have different sizes. The smallest micropores are pore-like structures with a size of 1 mm in diameter, and the recognition effect of the YOLOv5s network model is not ideal for such tiny targets. In this paper, we construct a small target detection layer in the Head layer of the YOLOv5s algorithm to realize the recognition of tiny-sized micropores and improve the detection rate of tiny-sized micropores.
A new micro-target detection head, i.e., Head (160 × 160), is added to realize the recognition of micropores of 1 mm in diameter, and finally, a Head layer with four different detection heads is constructed, namely, micro-target detection Head 1 (160 × 160), small target detection Head 2 (80 × 80), medium target detection Head 2 (80 × 80), medium target detection Head 1 (160 × 160), medium target detection head Head 3 (40 × 40), and large target detection head Head 4 (20 × 20). After constructing the tiny target detection head, the prediction frames are changed from nine to twelve, accordingly, and the three newly added prediction frames are predicted for tiny-sized microfine pores. The structure of the Head layer constructed in this paper is shown in Figure 12.
Seven enhanced feature layers P1–P7 are obtained after feature fusion by the Neck layer, and four of the enhanced feature layers P4–P7 are input into different detection heads, i.e., Head 1–Head 4, respectively, to realize the recognition of micropores, small pores, medium pores, and large pores.

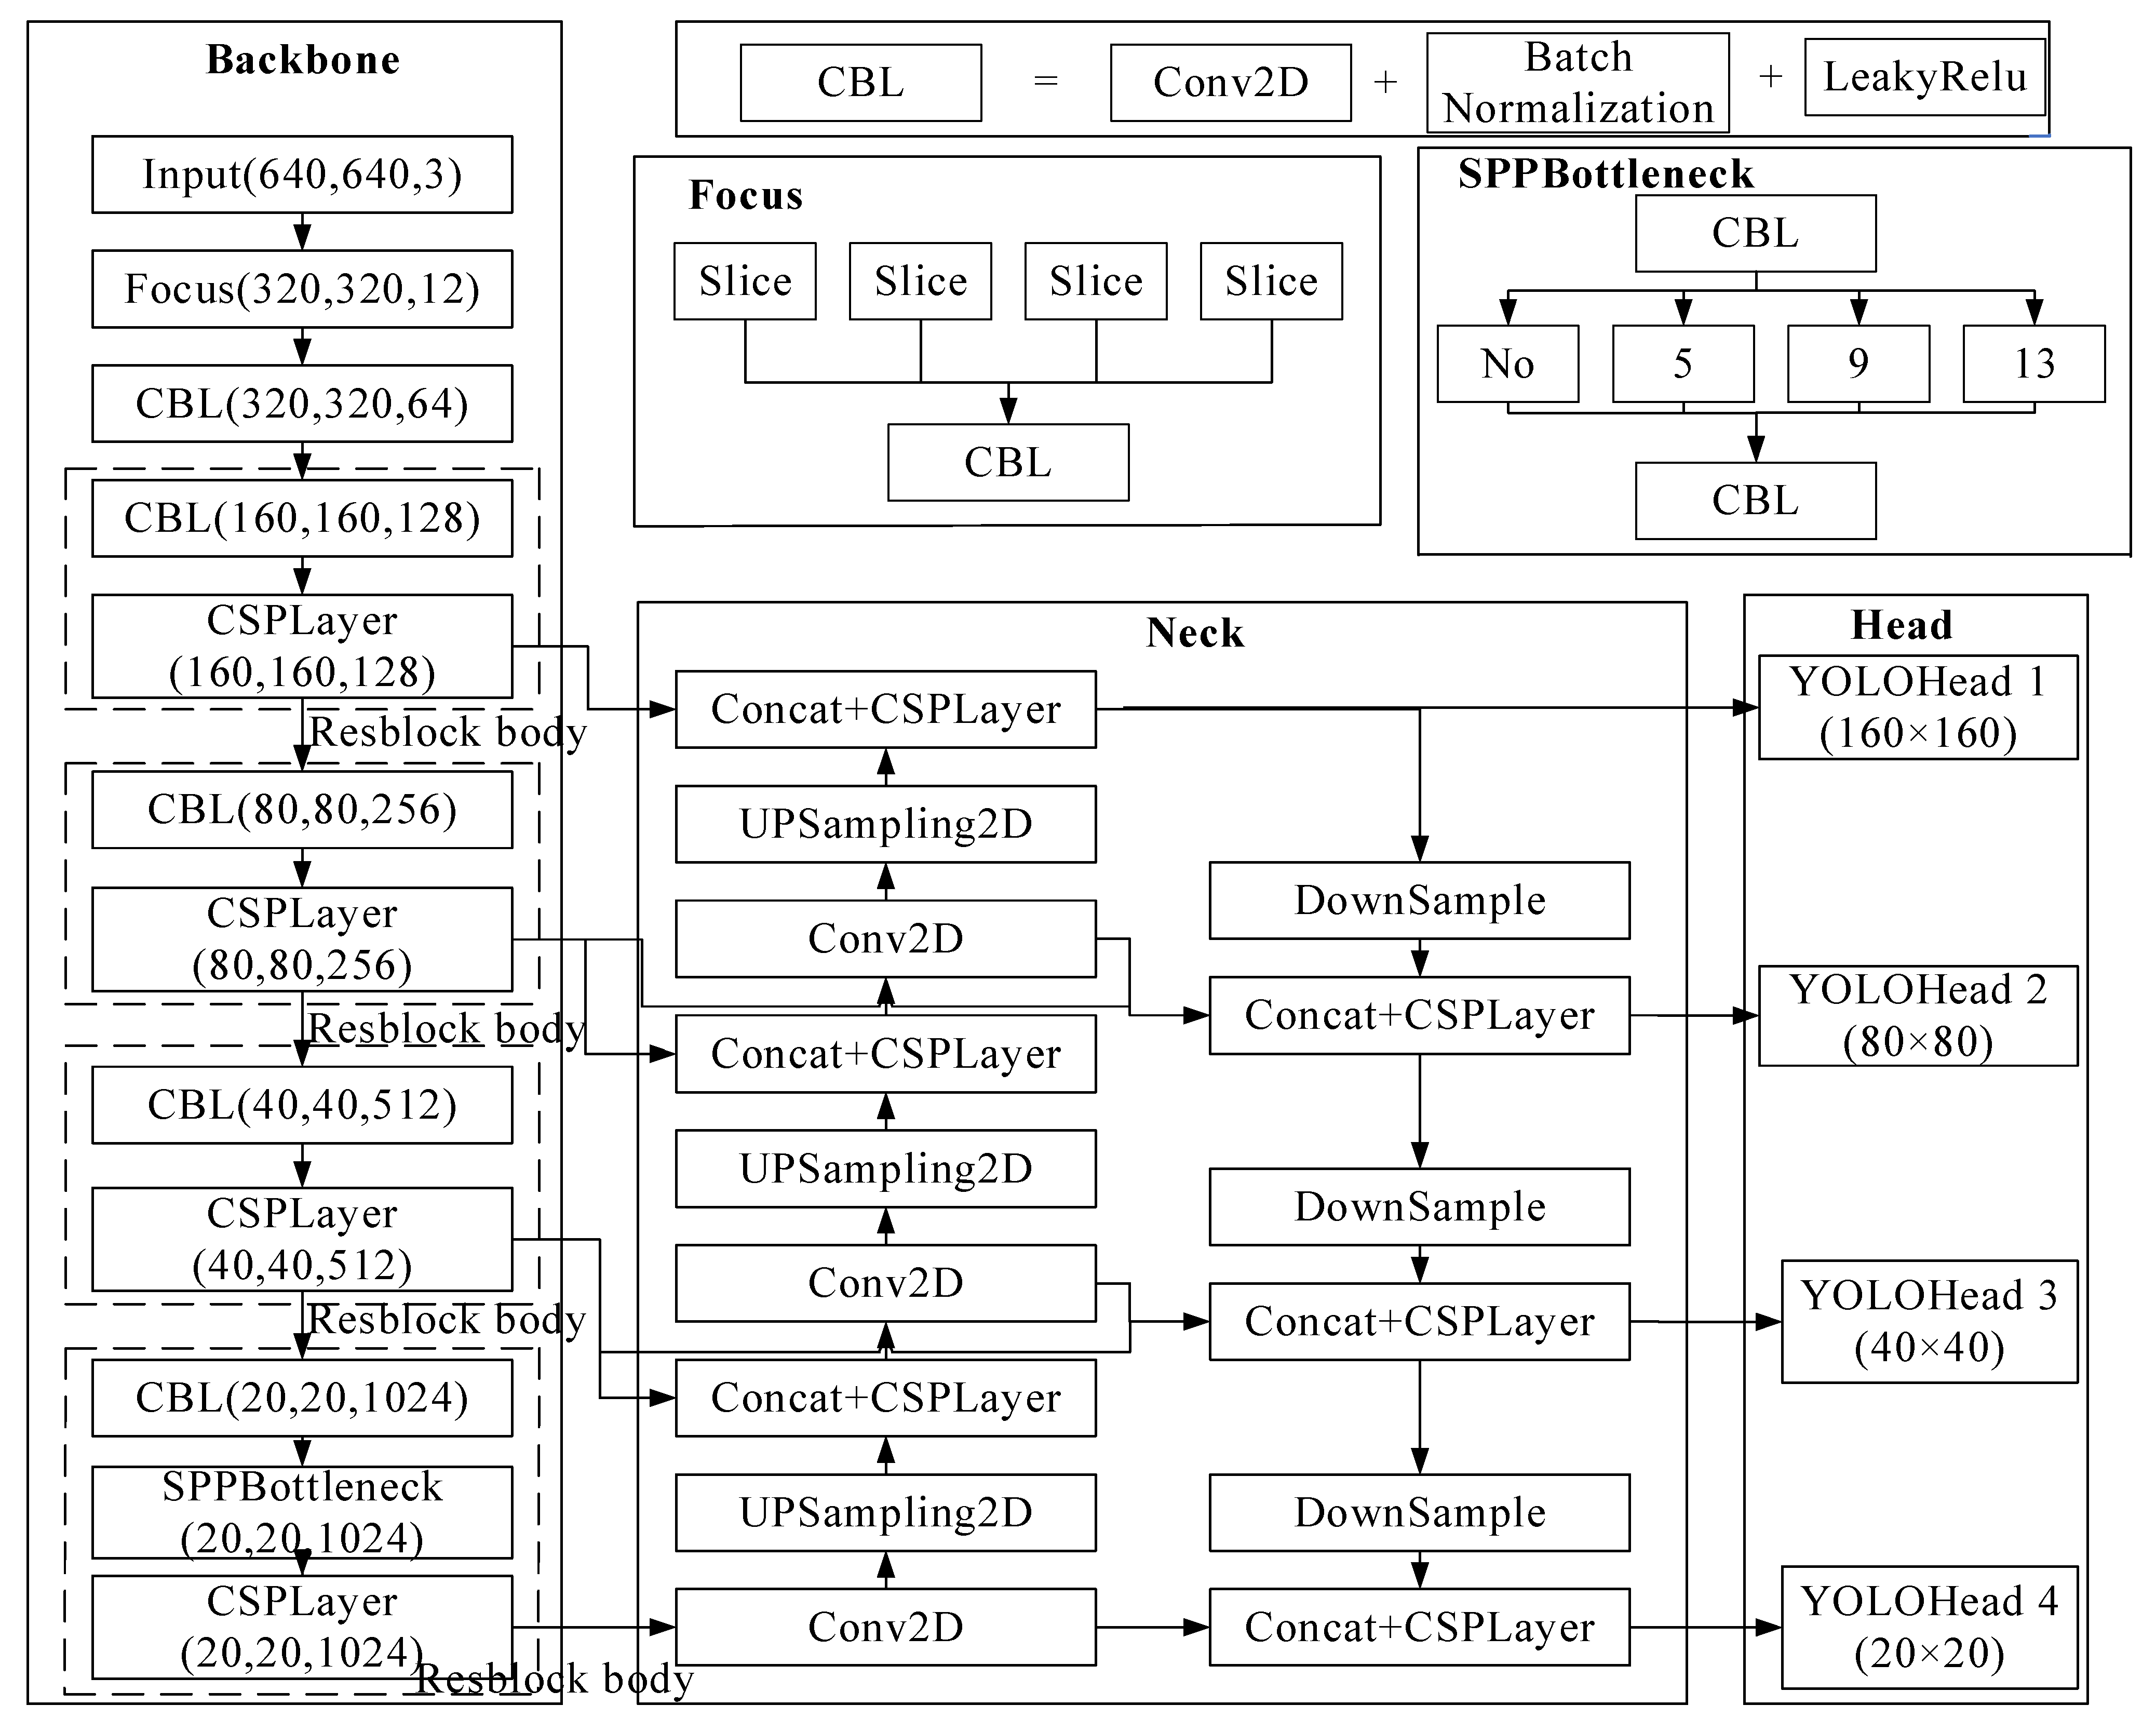
3.4. Microfine Pore Image Recognition Network Model Structure
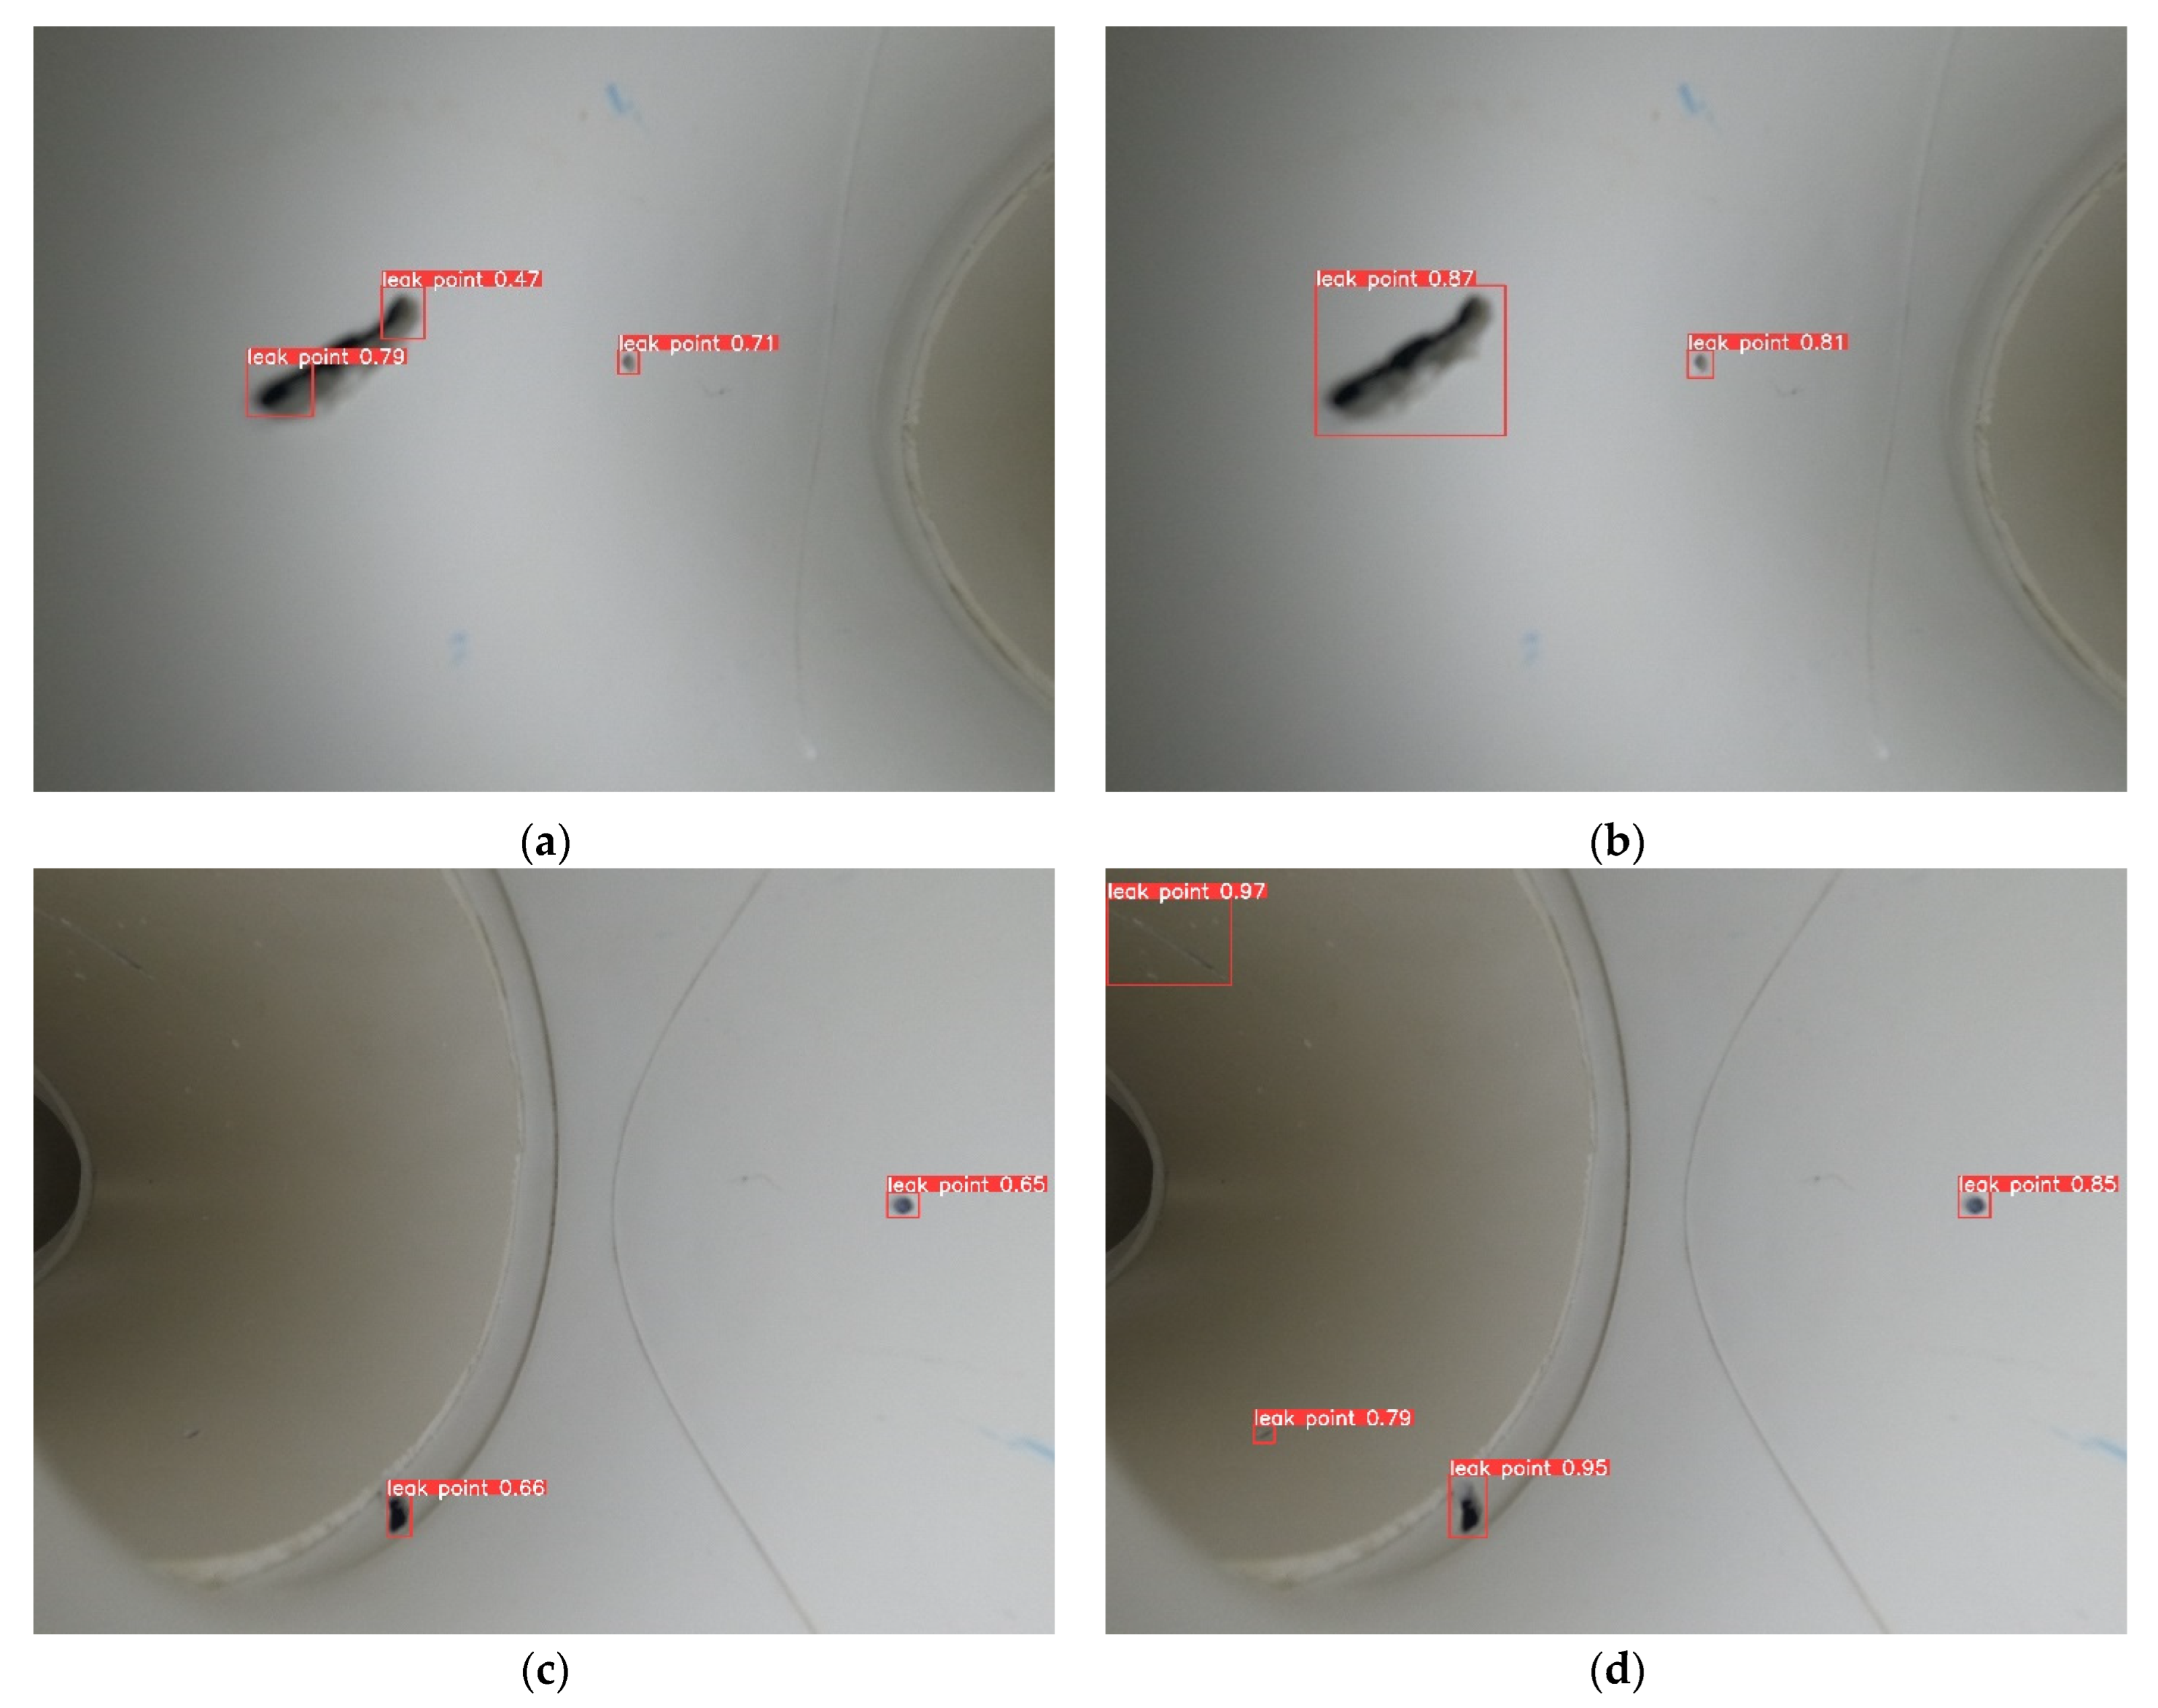
The Backbone of the small gas pipe internal micropore recognition network model constructed in this paper uses the same CSPDarknet network as the YOLOv5s algorithm, which is mainly used to extract features of micropores at different scales and generate feature maps. The Neck layer introduces the BiFPN structure instead of the FPN + PAN structure to achieve adjacent scale and cross-scale micropore features and improve the precision of micropore identification. The small target detection layer is built in the Head layer to identify micropores of tiny size and improve the detection rate of the network model for micropores of size 1 mm.
The micropore image taken inside the pipe that is input to the network model is first passed through Backbone, which extracts the feature information of microfine pores. Second, the microfine pore feature map generated using the Backbone is input to the Neck layer to realize the fusion of micropore feature information at different scales in the feature map. Finally, the micropore feature map output from the Neck layer is fed into the Head layer, and the micropore feature map is classified and predicted to realize the identification of micropores inside small gas pipelines. The structure of the micropore recognition network model for small, buried pipelines proposed in this paper is shown in Figure 13.

4. Results

4.1. Experimental Conditions

4.1.1. Experimental Environment

The PC operating system used in this experiment is Win10, the CPU is Inter Core i5-13600, the GPU is NVIDIA RTX 3060, the programming software is Pycharm2022.2.3, the deep learning framework is Pytorch1.13.0, the programming language is Python3.8, and the experimental environment is shown in Table 1.

4.1.2. Training Parameters

The training parameters for the small gas pipe internal micropore recognition network model include weight, epoch, image size, batch size, optimizer, workers, and warm-up. In this paper, migration learning is not applied, and the initial weights are set to random initial weights. The network model training converges in around 220 rounds, so this paper sets the epoch to 300 rounds. To ensure the quality of the image, this paper sets the image size of the input side to 640 × 640 × 3. As this experiment is carried out on the PC side, the highest PC performance can only support a training batch size of 16, so the experimental training batch size is set to 16. The optimizer selects the SGD. The performance of the PC can only support a maximum of eight workers, so the experimental thread number of workers is set to eight. To prevent the learning rate from being unstable when the model is initially trained, the warm-up training mode is used. The network model training parameters are set as shown in Table 2.

4.1.3. Evaluation Indicators

In this paper, three common evaluation metrics in the field of target detection, precision (P), recall (R), and average precision (AP) were selected as the evaluation metrics for this experiment [23]. Precision is the ratio of the number of correctly identified micropores to the total number of micropores. Recall, which is the detection rate, is the ratio of the number of detected micropores to the total number of micropores. Average precision, which is expressed as a comprehensive measure of precision and recall, has a value of 0–1. The formulas for precision, recall, and average precision are shown in Equations (2)–(4), respectively.
P p r e c i s i o n = T P T P + F P
R r e c a l l = T P T P + F N
AP = 0 1 P ( r ) d r
where TP is the number of correctly identified micropores, FP is the number of undetected micropores, FN is the number of micropores missed, r is the integration variable, which is the integral of the product of precision and recall, and P(r) denotes the P–R curve.

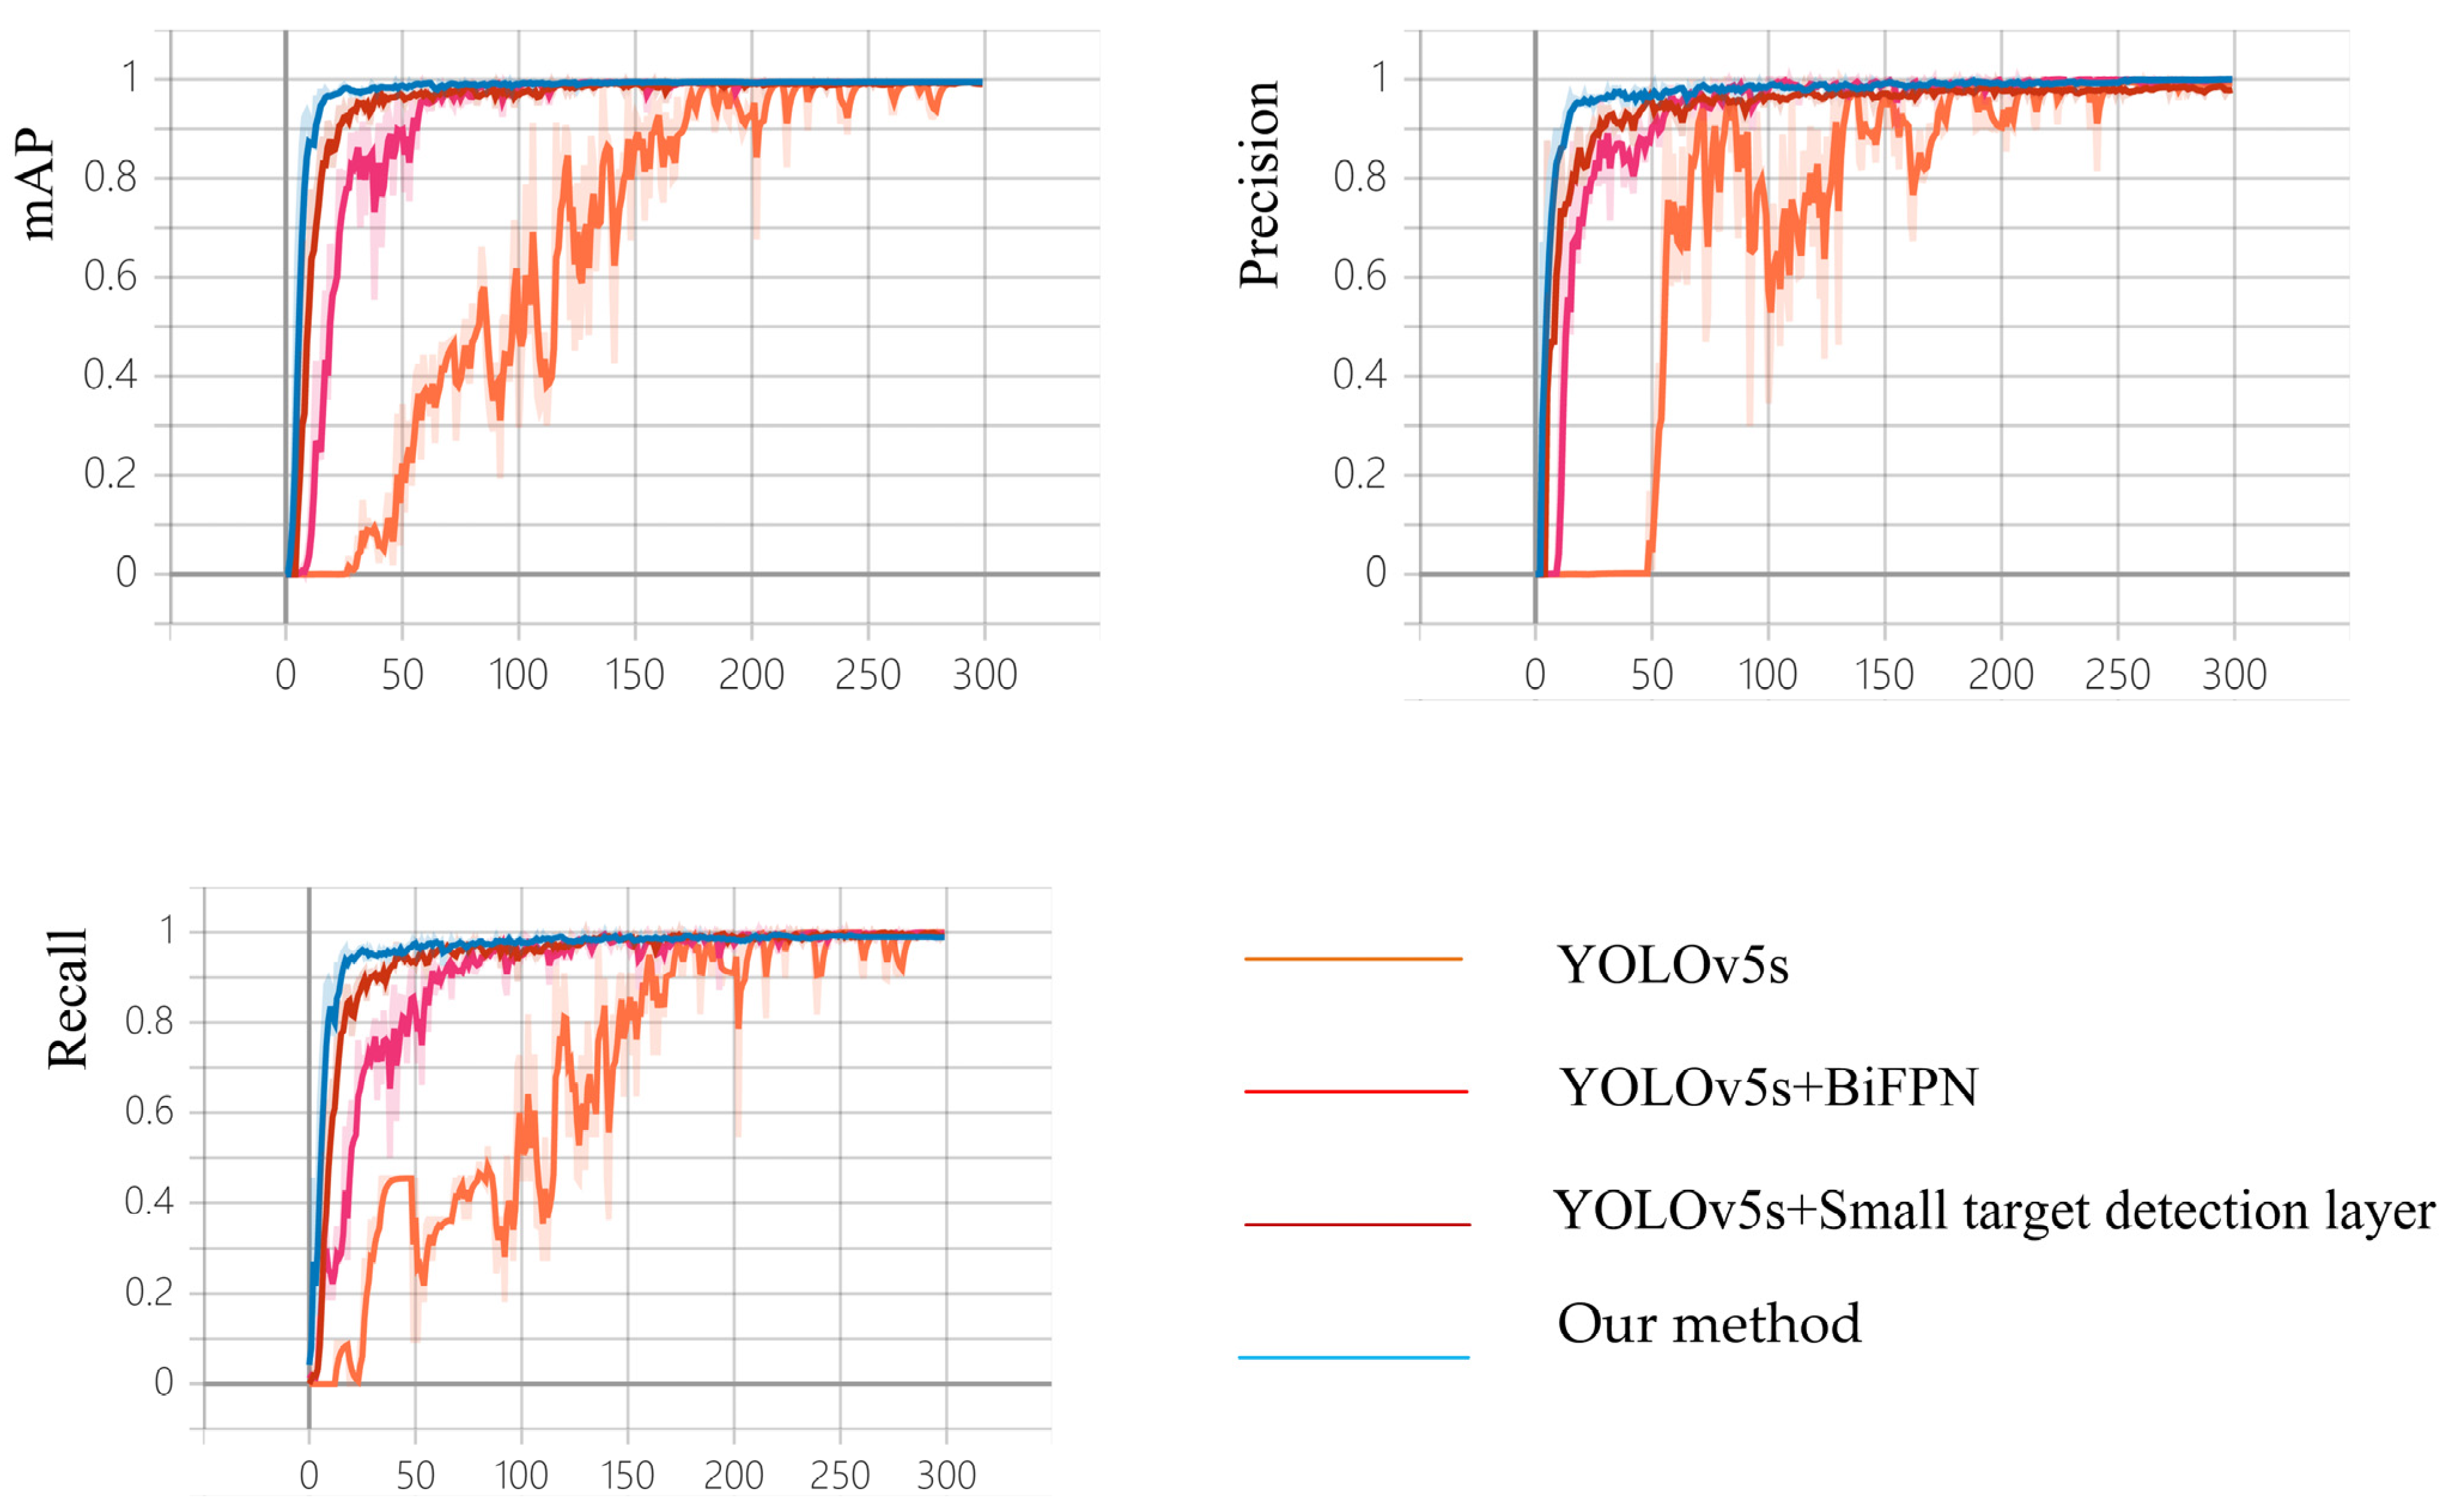
4.2. Training Curve Results and Analysis

The training set was input into a total of four network models: the YOLOv5s network model with BiFPN structure introduced in the Neck layer of the YOLOv5s algorithm (YOLOv5s + BiFPN), the network model with a small target detection layer constructed in the Head layer of the YOLOv5s algorithm (YOLOv5s + small target detection layer), and the network model for the identification of micropores inside small gas pipelines proposed in this paper (our method). These four network models were trained separately with a total of 300 training rounds, and the training curves are shown in Figure 14.
As can be seen in Figure 14, the horizontal coordinates of the three training curves are all the training rounds, and the vertical coordinates are the values of the three evaluation indexes, including AP, P, and R, respectively. The training curves of the YOLOv5s network model have serious oscillations and no significant changes until 30 training rounds, and the curves converge extremely slowly. The training curves of the YOLOv5s + BiFPN network model improve significantly compared with the YOLOv5s network model, and the oscillations are significantly reduced, although there is no significant change until 10 training rounds, and the convergence speed is significantly higher. The YOLOv5s + small target detection layer network model has a slight decrease in the precision training curve compared with the YOLOv5s + BiFPN network model, but there is a further slight increase in the convergence speed and a further small decrease in the frequency of oscillations. The small gas pipeline internal micropores identification network model proposed in this paper has the best result, with a fast response, smooth curve, and fast convergence speed, and it continues until the end of training.

4.3. Analysis of Comparative Experimental Results

To compare the recognition effect of the micropores recognition network model inside the small gas pipeline proposed in this paper with the YOLOv5s network model, the test set was input to the trained micropore recognition network model inside the small gas pipeline and the YOLOv5s network model, respectively, to compare the micropore recognition effect of the two network models. The recognition results are shown in Figure 15.
From Figure 15, it can be seen that there are various leak shapes, such as pore-like structures, strip-like structures, and irregular shapes. Micropores have different sizes, and the smallest size is the pore-like micropores in Figure 15a,b, which reach 1 mm in diameter.
Figure 15a,b show pictures of the results using the YOLOv5s network model and the network model proposed in this paper for the identification of micropores inside a small gas pipe for the same test set image 1, respectively. Figure 15c,d show pictures of the results from the recognition of the same test set image 2 using the YOLOv5s network model and the network model for identifying micropores inside small gas pipes proposed in this paper, respectively.
From the above results, it can be seen that the YOLOv5s network model may mistakenly identify one micropore as two micropores, and the phenomenon of missing detection may occur. However, the proposed small gas pipeline internal micropore identification network model does not have the above situation, and it has a higher confidence level than the YOLOv5s network model when micropores are also identified. Thus, it can be seen that the proposed network model for identifying micropores inside small gas pipelines has a better recognition effect and a greater recognition capability than the YOLOv5s network model.
To prove that the recognition ability of the proposed method is better than the mainstream algorithms in the target domain, comparison experiments were conducted with one-stage target detection algorithms YOLOv5, YOLOv3 [24], and SSD [25] and the two-stage target detection algorithm Faster RCNN [26]. The test sets were input to five network models including the YOLOv5, YOLOv3, SSD, Faster RCNN, and the small gas pipeline internal micropore identification network model proposed in this paper to compare the numerical magnitude of the three evaluation indexes including P, R, and AP. The evaluation indexes of each network model comparison experiment are shown in Table 3.
As can be seen from Table 3, the evaluation metrics of the network model in the table are precision, recall, and average precision, in that order, and the two-stage target detection algorithm is higher than the one-stage target detection algorithm in terms of precision and recall. Among the one-stage target detection algorithms, YOLOv3 has the worst results. SSD is 0.7, 0.4, and 0.5 percentage points higher than YOLOv3 in terms of precision, recall, and average precision, respectively. YOLOv5s is 1.1, 1.3, and 1.2 percentage points higher than SSD in terms of precision, recall, and average precision, respectively, and is the most effective of the one-stage detection algorithms. Compared with YOLOv5s, Faster RCNN is 2.2 percentage points, 5.8 percentage points, and 4.1 percentage points higher in terms of precision, recall, and average precision, respectively. The algorithm in this paper has the highest three evaluation metrics, including precision, recall, and average precision, which are 2.9 percentage points, 3.2 percentage points, and 3.0 percentage points higher compared to Faster CNN, reaching 94.7%, 96.6%, and 95.5%, respectively.

4.4. Ablation Experiments and Analysis of Results

Next, we further prove that the network model proposed in this paper for the identification of micropores inside small gas pipelines is enhanced by introducing the BiFPN structure in the Neck layer of the YOLOv5s network model and building a small target detection layer in the Head layer. For this analysis, ablation experiments were performed again in this paper, and the test sets were input to the YOLOv5s, YOLOv5s + BiFPN, the YOLOv5s + BiFPN, YOLOv5s + small target detection layer, and the method in this paper. The input test sets are identified separately to compare the evaluation index values of different network models. The results of the evaluation indexes of the ablation experiments are shown in Table 4.
From Table 4, we can see that the precision of the YOLOv5s network model is 89.6%, the recall rate is 87.6%, and the average precision is 88.4%. The network model after introducing the BiFPN structure improves the precision by 2.8 percentage points, the recall rate by 3.1 percentage points, and the average precision by 3.0 percentage points compared with the YOLOv5s network model. After constructing the small target detection layer, the network model improves the precision by 2.0 percentage points, the recall rate by 5.3 percentage points, and the average precision by 3.8 percentage points compared with the YOLOv5s network model. The precision, recall, and average precision of this method improved by 5.1 percentage points, 9 percentage points, and 7.1 percentage points, respectively, compared with the YOLOv5s network model, reaching 94.7%, 96.6%, and 95.5%, respectively. Using ablation experiments, this paper demonstrates that the network model for identifying micropores inside small gas pipelines proposed in this paper is enhanced by introducing BiFPN structure in the Neck layer of the YOLOv5s network model and constructing a small target detection layer in the Head layer, which has higher evaluation index and possesses better identification capability.

5. Discussion

The method proposed in this paper solves the problem related to difficulties in the early detection of leaks in small gas pipelines. However, it was found during the experiments that image distortion and blurring may occur when the data set is dynamically collected using a detection robot inside the pipeline, resulting in the inability to identify such images when testing the recognition effect of the network model. In the subsequent work, a video detection-based approach will be investigated to solve the above-mentioned image distortion and blurring problems and to achieve dynamic detection of micropores inside small gas pipelines.

6. Conclusions

In this paper, to address the problem related to difficulties in the early detection of leakage in small gas pipelines, a method is proposed for image recognition of micropores inside small gas pipelines, which is used to recognize leakage signs such as micropores that appear in the early stage of pipeline leakage. The steps included collecting images, building data sets, and introducing the BiFPN structure into YOLOv5s to improve the feature fusion ability of the network model. For the problem of difficult-to-recognize micropores of tiny size, we built a small target detection layer in the Head layer to recognize such tiny micropores as 1 mm. Then, we used the training set to train the network model for recognizing micropores inside small gas pipes and used the test set of micropores with different shapes and sizes to verify the model’s recognition ability. The current mainstream target detection algorithms were compared to prove the superiority of this method. Ablation experiments were carried out to prove that the recognition ability of the method in this paper was improved due to the improvements made. The experiment proved that the small gas pipeline microporosity recognition method proposed in this paper has a better recognition effect on the early leakage characteristics of small gas pipelines and can recognize leakage characteristics at the early stage of pipeline leakage to realize early safety warnings with a precision rate of 94.7%, a detection rate of 96.6%, and an average precision of 95.5%. The experimental results show that this method can avoid the disadvantages of time-consuming and high-cost large-area excavations in the routine maintenance of pipelines for identifying internal micropores in small gas pipelines. The method can still maintain good identification results when other pipeline leakage identification methods have poor identification results.

Author Contributions

Conceptualization, Y.Z., Z.S., H.Z. and J.L.; methodology, Y.Z., Z.S., H.Z., and J.L.; software, Y.Z.; validation, Y.Z., Z.S., H.Z. and J.L.; formal analysis, Y.Z., Z.S., H.Z. and J.L.; investigation, Y.Z., Z.S., H.Z. and J.L.; writing—original draft preparation, Y.Z.; writing—review and editing, Y.Z., Z.S., H.Z. and J.L.; supervision, Y.Z., Z.S., H.Z. and J.L.; project administration, Y.Z., Z.S., H.Z. and J.L.; funding acquisition, Z.S. and H.Z. All authors have read and agreed to the published version of the manuscript.

Funding

This research was funded by the National Key R&D Program of China (Grant No. 2020YFC1511702, 2022YFF0607400), the National Natural Science Foundation of China (61971048), Beijing Science and Technology Project (Z221100005222024), and the Beijing Scholars Program, Key Laboratory of Modern Measurement and Control Technology, Ministry of Education.

Institutional Review Board Statement

Not applicable.

Informed Consent Statement

Not applicable.

Data Availability Statement

Not applicable.

Acknowledgments

The authors would like to express their sincere thanks and appreciation to their supervisor, Z.S., for his support, comments, suggestions, and engagement during the writing of this manuscript. In addition, the authors would like to thank the editor and the anonymous reviewers for their constructive comments on improving the content during the publishing process of this paper.

Conflicts of Interest

The authors declare no conflict of interest.

References

  1. Wang, K.; Qian, X.; Liu, Z. Experimental and numerical investigations on predictor equations for determining parameters of blasting-vibration on underground gas pipe networks. Process Saf. Environ. Prot. 2020, 133, 315–331. [Google Scholar] [CrossRef]
  2. Natalya, V.; Aleksander, S.; Svetlana, K. Possibilities of diagnosis of stress corrosion cracking of main gas pipelines from the point of view of microbiology. Mater. Today Proc. 2020, 38, 1697–1700. [Google Scholar]
  3. Li, X.; Zhang, Y.; Abbassi, R. Dynamic probability assessment of urban natural gas pipeline accidents considering integrated external activities. J. Loss Prev. Process Ind. 2021, 69, 104388. [Google Scholar] [CrossRef]
  4. Malekpour, A.; She, Y. Real-time leak detection in oil pipelines using an Inverse Transient Analysis model. J. Loss Prev. Process Ind. 2021, 70, 104411. [Google Scholar] [CrossRef]
  5. Qiao, Z.; Guo, Q.; Sun, H. An interval gas flow analysis in natural gas and electricity coupled networks considering the uncertainty of wind power. Appl. Energy 2017, 201, 343–353. [Google Scholar] [CrossRef]
  6. Tian, X.; Jiao, W.; Liu, T. Leakage detection of low-pressure gas distribution pipeline system based on linear fitting and extreme learning machine. Int. J. Press. Vessel. Pip. 2021, 194, 104553. [Google Scholar] [CrossRef]
  7. Morteza, Z.; Mehdi, S.; Karim, S. Pipeline leakage detection and isolation: An integrated approach of statistical and wavelet feature extraction with multi-laver perceptron neural network (MLPNN). J. Loss Prev. Process Ind. 2016, 43, 479–487. [Google Scholar]
  8. Xiao, R.; Joseph, P.; Muggleton, J. Limits for leak noise detection in gas pipes using cross correlation. J. Sound Vib. 2022, 520, 116639. [Google Scholar] [CrossRef]
  9. Jia, Z.; Ho, S.; Li, Y. Multipoint hoop strain measurement based pipeline leakage localization with an optimized support vector regression approach. J. Loss Prev. Process Ind. 2019, 62, 103926. [Google Scholar] [CrossRef]
  10. Tariq, S.; Bakhtawar, B.; Zayed, T. Data-driven application of MEMS-based accelerometers for leak detection in water distribution networks. Sci. Total Environ. 2022, 809, 151110. [Google Scholar] [CrossRef]
  11. Meribout, M.; Khezzar, L.; Azzi, A. Leak detection systems in oil and gas fields: Present trends and future prospects. Flow Meas. Instrum. 2020, 75, 101772. [Google Scholar] [CrossRef]
  12. Wang, X.; Lin, J.; Keramat, A. Matched field processing for leak localization in a viscoelastic pipe:an experimental study. Mech. Syst. Signal Process. 2019, 124, 459–478. [Google Scholar] [CrossRef]
  13. Diao, X.; Chi, Z.; Jiang, J. Leak detection and location of flanged pipes: An integrated approach of principle component analysis and guided wave mode. Saf. Sci. 2020, 129, 104809. [Google Scholar] [CrossRef]
  14. Kasai, N.; Tsuchiya, C.; Fukuda, T. Propane gas leak detection by infrared absorption using carbon infrared emitter and infrared camera. Nondestruct. Test. Eval. Int. 2011, 44, 57–60. [Google Scholar] [CrossRef]
  15. Zhang, Z.; Lu, X.; Cao, G. ViT-YOLO: Transformer-Based YOLO for Object Detection. In Proceedings of the IEEE/CVF International Conference on Computer Vision, Montreal, BC, Canada, 11–17 October 2016; pp. 2799–2808. [Google Scholar]
  16. Zhang, K.; Wu, Y.; Wang, J. Semantic context-aware network for multiscale object detection in remote sensing images. IEEE Geosci. Remote Sens. Lett. 2021, 45, 1–5. [Google Scholar] [CrossRef]
  17. Zhang, K.; Cao, Z.; Wu, J. Circular Shift: An Effective Data Augmentation Method for Convolutional Neural Network on Image Classification. In Proceedings of the 2020 IEEE International Conference on Image Processing (ICIP), Abu Dhabi, United Arab Emirates, 25–28 October 2020; pp. 1676–1680. [Google Scholar]
  18. Gupta, A.; Vedaldi, A.; Zisserman, A. Synthetic Data for Text Lacalisation in Natural Images. In Proceedings of the IEEE Conference on Computer Vision and Pattern Recognition (CVPR), Las Vegas, NV, USA, 26 June–1 July 2016; pp. 2315–2324. [Google Scholar]
  19. Zhao, K.; Zhao, L.; Zhao, Y.; Deng, H. Study on Lightweight Model of Maize Seedling Object Detection Based on YOLOv7. Appl. Sci. 2023, 13, 7731. [Google Scholar] [CrossRef]
  20. Cao, L.; Song, P.; Wang, Y.; Yang, Y.; Peng, B. An Improved Lightweight Real-Time Detection Algorithm Based on the Edge Computing Platform for UAV Images. Electronics 2023, 12, 2274. [Google Scholar] [CrossRef]
  21. Tian, Z.; Huang, J.; Yang, Y.; Nie, W. KCFS-YOLOv5: A High-Precision Detection Method for Object Detection in Aerial Remote Sensing Images. Appl. Sci. 2023, 13, 649. [Google Scholar] [CrossRef]
  22. Huang, Y.; Jiang, L.; Han, T.; Xu, S.; Liu, Y.; Fu, J. High-Accuracy Insulator Defect Detection for Overhead Transmission Lines Based on Improved YOLOv5. Appl. Sci. 2022, 12, 12682. [Google Scholar] [CrossRef]
  23. Glučina, M.; Anđelić, N.; Lorencin, I.; Car, Z. Detection and Classification of Printed Circuit Boards Using YOLO Algorithm. Electronics 2023, 12, 667. [Google Scholar] [CrossRef]
  24. Xiao, Q.; Yu, W. Traffic sign detection in complex environment based on improved YOLOV3. Int. Core J. Eng. 2021, 7, 102–108. [Google Scholar]
  25. Liu, W.; Anguelov, D.; Erhan, D. SSD: Single Shot Multibox Detector. In European Conference on Computer Vision; Springer: Berlin, Germany, 2016; pp. 21–37. [Google Scholar]
  26. Ren, S.; He, K.; Girshick, R. Faster R-CNN: Towards Real-Time Object Detection with Region Proposal Networks. Adv. Neural Inf. Process. Syst. 2015, 28, 91–99. [Google Scholar] [CrossRef] [PubMed]
Figure 1. Small gas pipe.
Applsci 13 09697 g001
Figure 2. Early leak characteristics inside small gas pipelines. (a) Irregularly shaped and pore-like structure microfine pores. (b) Strip-like structure and irregularly shaped pore structure microfine pores.
Applsci 13 09697 g002
Figure 3. In-pipe inspection robot.
Applsci 13 09697 g003
Figure 4. Image expansion before and after comparison. (a) Original image. (b) Rotation. (c) Left-right flip. (d) Top-down flip. (e) Clipping. (f) Scaling. (g) Contrast transformation. (h) Color transformation. (i) Brightness transformation.
Applsci 13 09697 g004aApplsci 13 09697 g004b
Figure 5. Micropores labeling results. (a) Image annotation interface. (b) Label Data.
Applsci 13 09697 g005
Figure 6. Structure of the YOLOv5s algorithm.
Applsci 13 09697 g006
Figure 7. The structure of each module in the YOLOv5s algorithm.
Applsci 13 09697 g007
Figure 8. FPN + PAN structure.
Applsci 13 09697 g008
Figure 9. Structure of BiFPN.
Applsci 13 09697 g009
Figure 10. The structure of the Neck layer built in this paper.
Applsci 13 09697 g010
Figure 11. Structure of the original Head layer in the YOLOv5s algorithm.
Applsci 13 09697 g011
Figure 12. Structure of the Head layer in the YOLOv5s algorithm.
Applsci 13 09697 g012
Figure 13. Structure of network model for the identification of micropores inside small, buried pipes.
Applsci 13 09697 g013
Figure 14. Training curves for the four network models.
Applsci 13 09697 g014
Figure 15. Comparison of recognition results between YOLOv5s and the method in this article. (a) YOLOv5s identification results in an irregular shape and pore-like structure of micropores (image 1). (b) The irregular shape and pore-like structure of micropore identification results from the method proposed in this paper (image 1). (c) YOLOv5s identification results showing micropores with striped structure, and irregular shape (image 2). (d) The results showing the identification of strip structure, irregular shape, and strip structure microfine pores using the method proposed in this paper (image 2).
Applsci 13 09697 g015
Table 1. Experimental environment.
Serial NumberEnvironment NameParameters
1Operating systemWin10
2CPUInter Core i5-13600
3GPUNVIDIA RTX 3060
4Programming softwarePycharm2022.2.3
5Deep learning frameworkPytorch1.13.0
6Programming languagePython3.8
Table 2. Network model training parameters.
Serial NumberParameter NameNumerical Size
1WeightRandom
2Epoch300
3Image size640 × 640 × 3
4Batch size16
5OptimizerSGD
6Workers8
7Warm-upYes
Table 3. Evaluation indexes of comparative experiments.
Network ModelPrecision/%Recall/%AP/%
SSD88.586.387.2
YOLOv387.885.986.7
YOLOv5s89.687.688.4
Faster RCNN91.893.492.5
Our method94.796.695.5
Table 4. Evaluation index of the ablation experiment.
Network ModelPrecision/%Recall/%AP/%
YOLOv5s89.687.688.4
YOLOv5s + BiFPN92.490.791.4
YOLOv5s + small target detection layer91.692.992.2
Our method94.796.695.5
Disclaimer/Publisher’s Note: The statements, opinions and data contained in all publications are solely those of the individual author(s) and contributor(s) and not of MDPI and/or the editor(s). MDPI and/or the editor(s) disclaim responsibility for any injury to people or property resulting from any ideas, methods, instructions or products referred to in the content.

