
Decision Support Model for Allocating Maintenance Budgets for Bridges

 , , and
Abstract
:1. Introduction
- Many bridge rating systems depend on subjective data, which reduce the accuracy of the condition assessment;
- Neglecting the actual deterioration of the bridges can significantly shorten their lifespan, hence increase their future repair costs.
2. Literature Review
2.1. Applications of AHP and MAUT in Construction
2.2. Previous Studies
2.3. Identification of Prioritization Criteria at Network Level
2.4. Research Gaps
- The available maintenance budget is allocated only to those bridges with the highest rank, even if all the structural elements of the selected bridges do not require maintenance, since the bridge is considered as one unit. Thus, very limited bridges will be maintained.
- Other important criteria such as the location of bridge are not considered. For example, a bridge located in a critical intersection could be selected for maintenance, while another bridge with a moderate condition assessment may not be selected.
- The review of previous reported models shows a lack of a relationship between the considerations of prioritizing the bridges in the network level and the main goal of the study which is allocating the budget for a set of bridges.
- Some models are simple and consider only one criterion, namely the condition assessment, as in the model reported by Wakchaure and Jha [18].
- Some approaches are not able to handle large networks.
- The uncertainty inherent in the maintenance cost and condition assessment is not considered, despite the fact that the condition assessment is one of the most common criteria, as it depends on the subjective evaluation of the bridge engineer.
- The outputs of the previously developed models are deterministic and do not consider the uncertainties associated with maintenance cost.
- The previously developed models do not provide either the optimal solution or the risk associated with the selected optimal solution.
3. Methodology
4. Proposed Model
4.1. Model Description
- Ranking each bridge in the target network by prioritizing the bridges at the network level through the prioritization of the identified criteria, along with the corresponding utility curves obtained from interviewing nine local experts and the bridge data from the BMS as indicated earlier.
- Identifying and obtaining the weights of the structural elements from the questionnaire using the concept of pairwise comparison of AHP.
- Providing the overall priority along with the estimated maintenance cost of each structural element of each bridge in the target network.
- Defines the overall priority along with the estimated maintenance cost of each structural element.
- Recommends the near-optimum solution for the maintenance plan which is presented to the owner/engineer.
4.2. Pilot Study and Development of the Questionnaire Survey
4.2.1. Weighting the Prioritization Criteria
- The numeric value of 1 is used when the importance of the two compared criteria is equal based on a local expert’s point of view and experience.
- The numeric value of 9 is used when the importance of the criteria in the row is extremely more important than the other criteria being compared with in the column.
- The numeric values of 3, 5, and 7 are used to describe the importance of the criteria, based on the expert’s perceived level of importance for the criterion under consideration.
- Reciprocation of the intensity is used when the criterion in the column is more important than the criteria in the row.
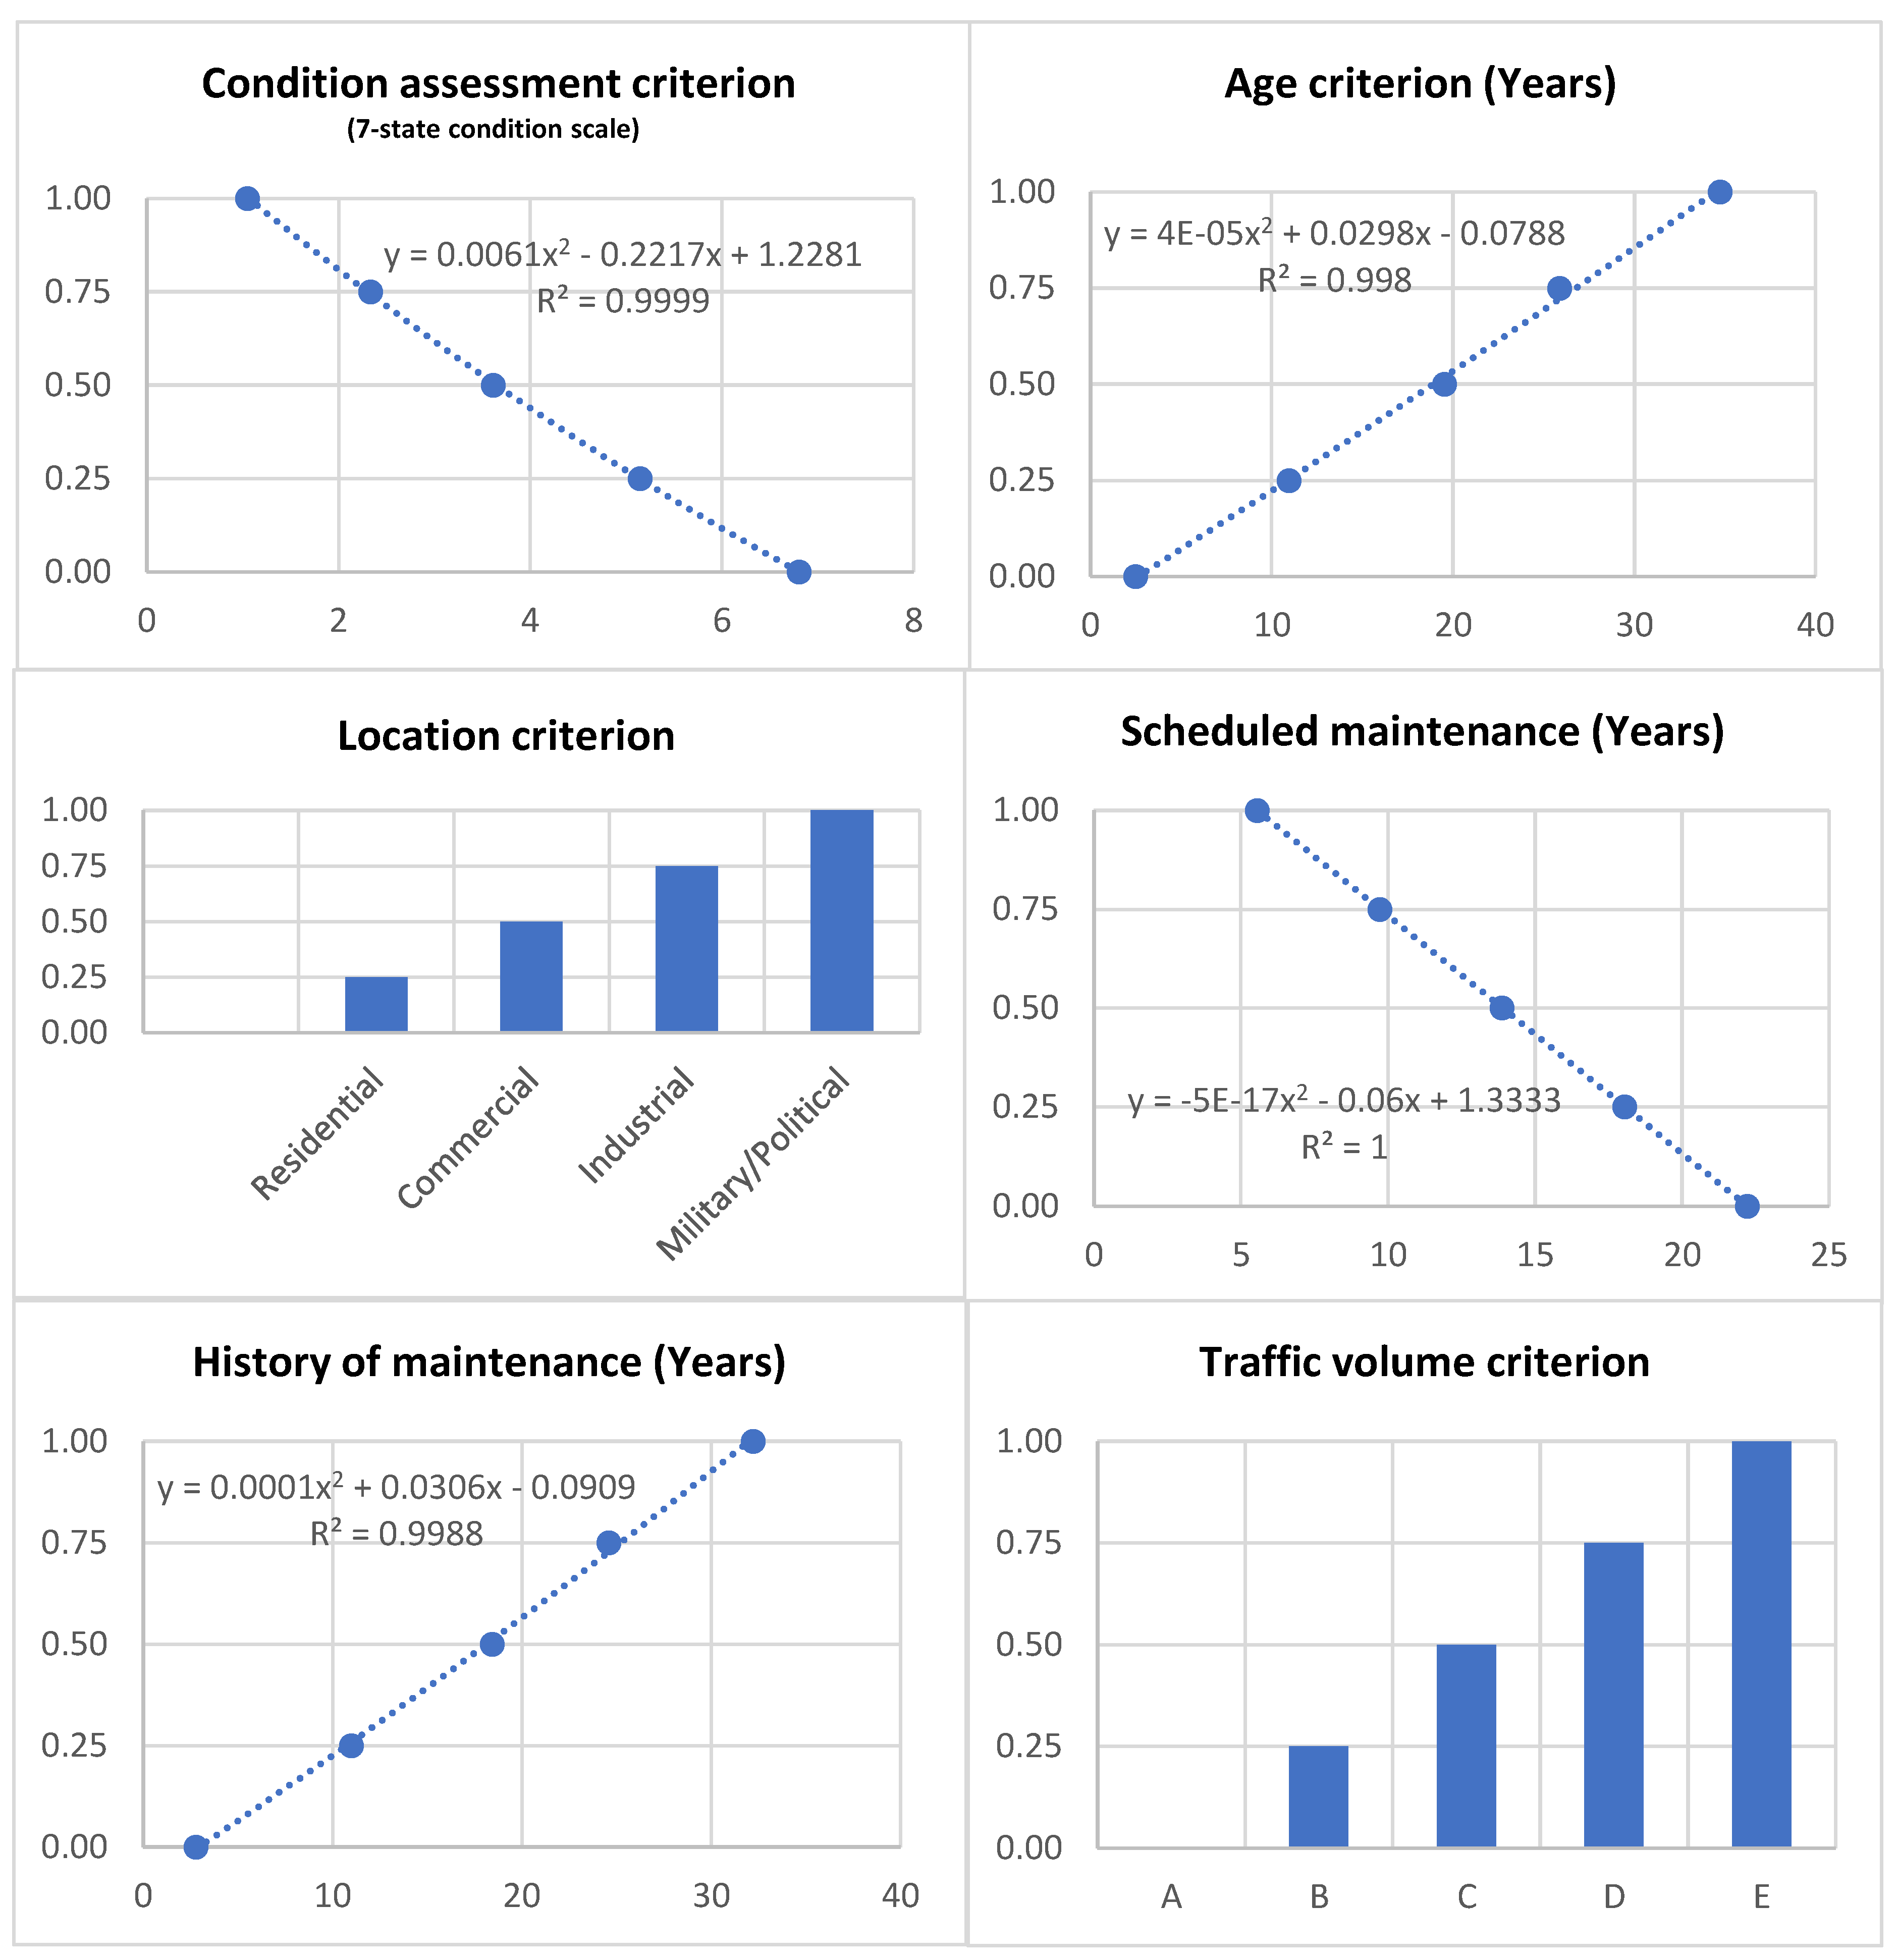
4.2.2. Establishing the MAUT Curves
- The highest and lowest limit are desired to be determined before establishing the midpoints.
- The attributes scale can be either quantitative or qualitative according to the nature of the attributes.
- It is not necessary for qualitative criteria to have midpoints.
Condition Assessment
Traffic Volume
Bridge Location
Bridge Age
Previous and Scheduled Maintenance
4.3. Structural Element Weights from the AHP
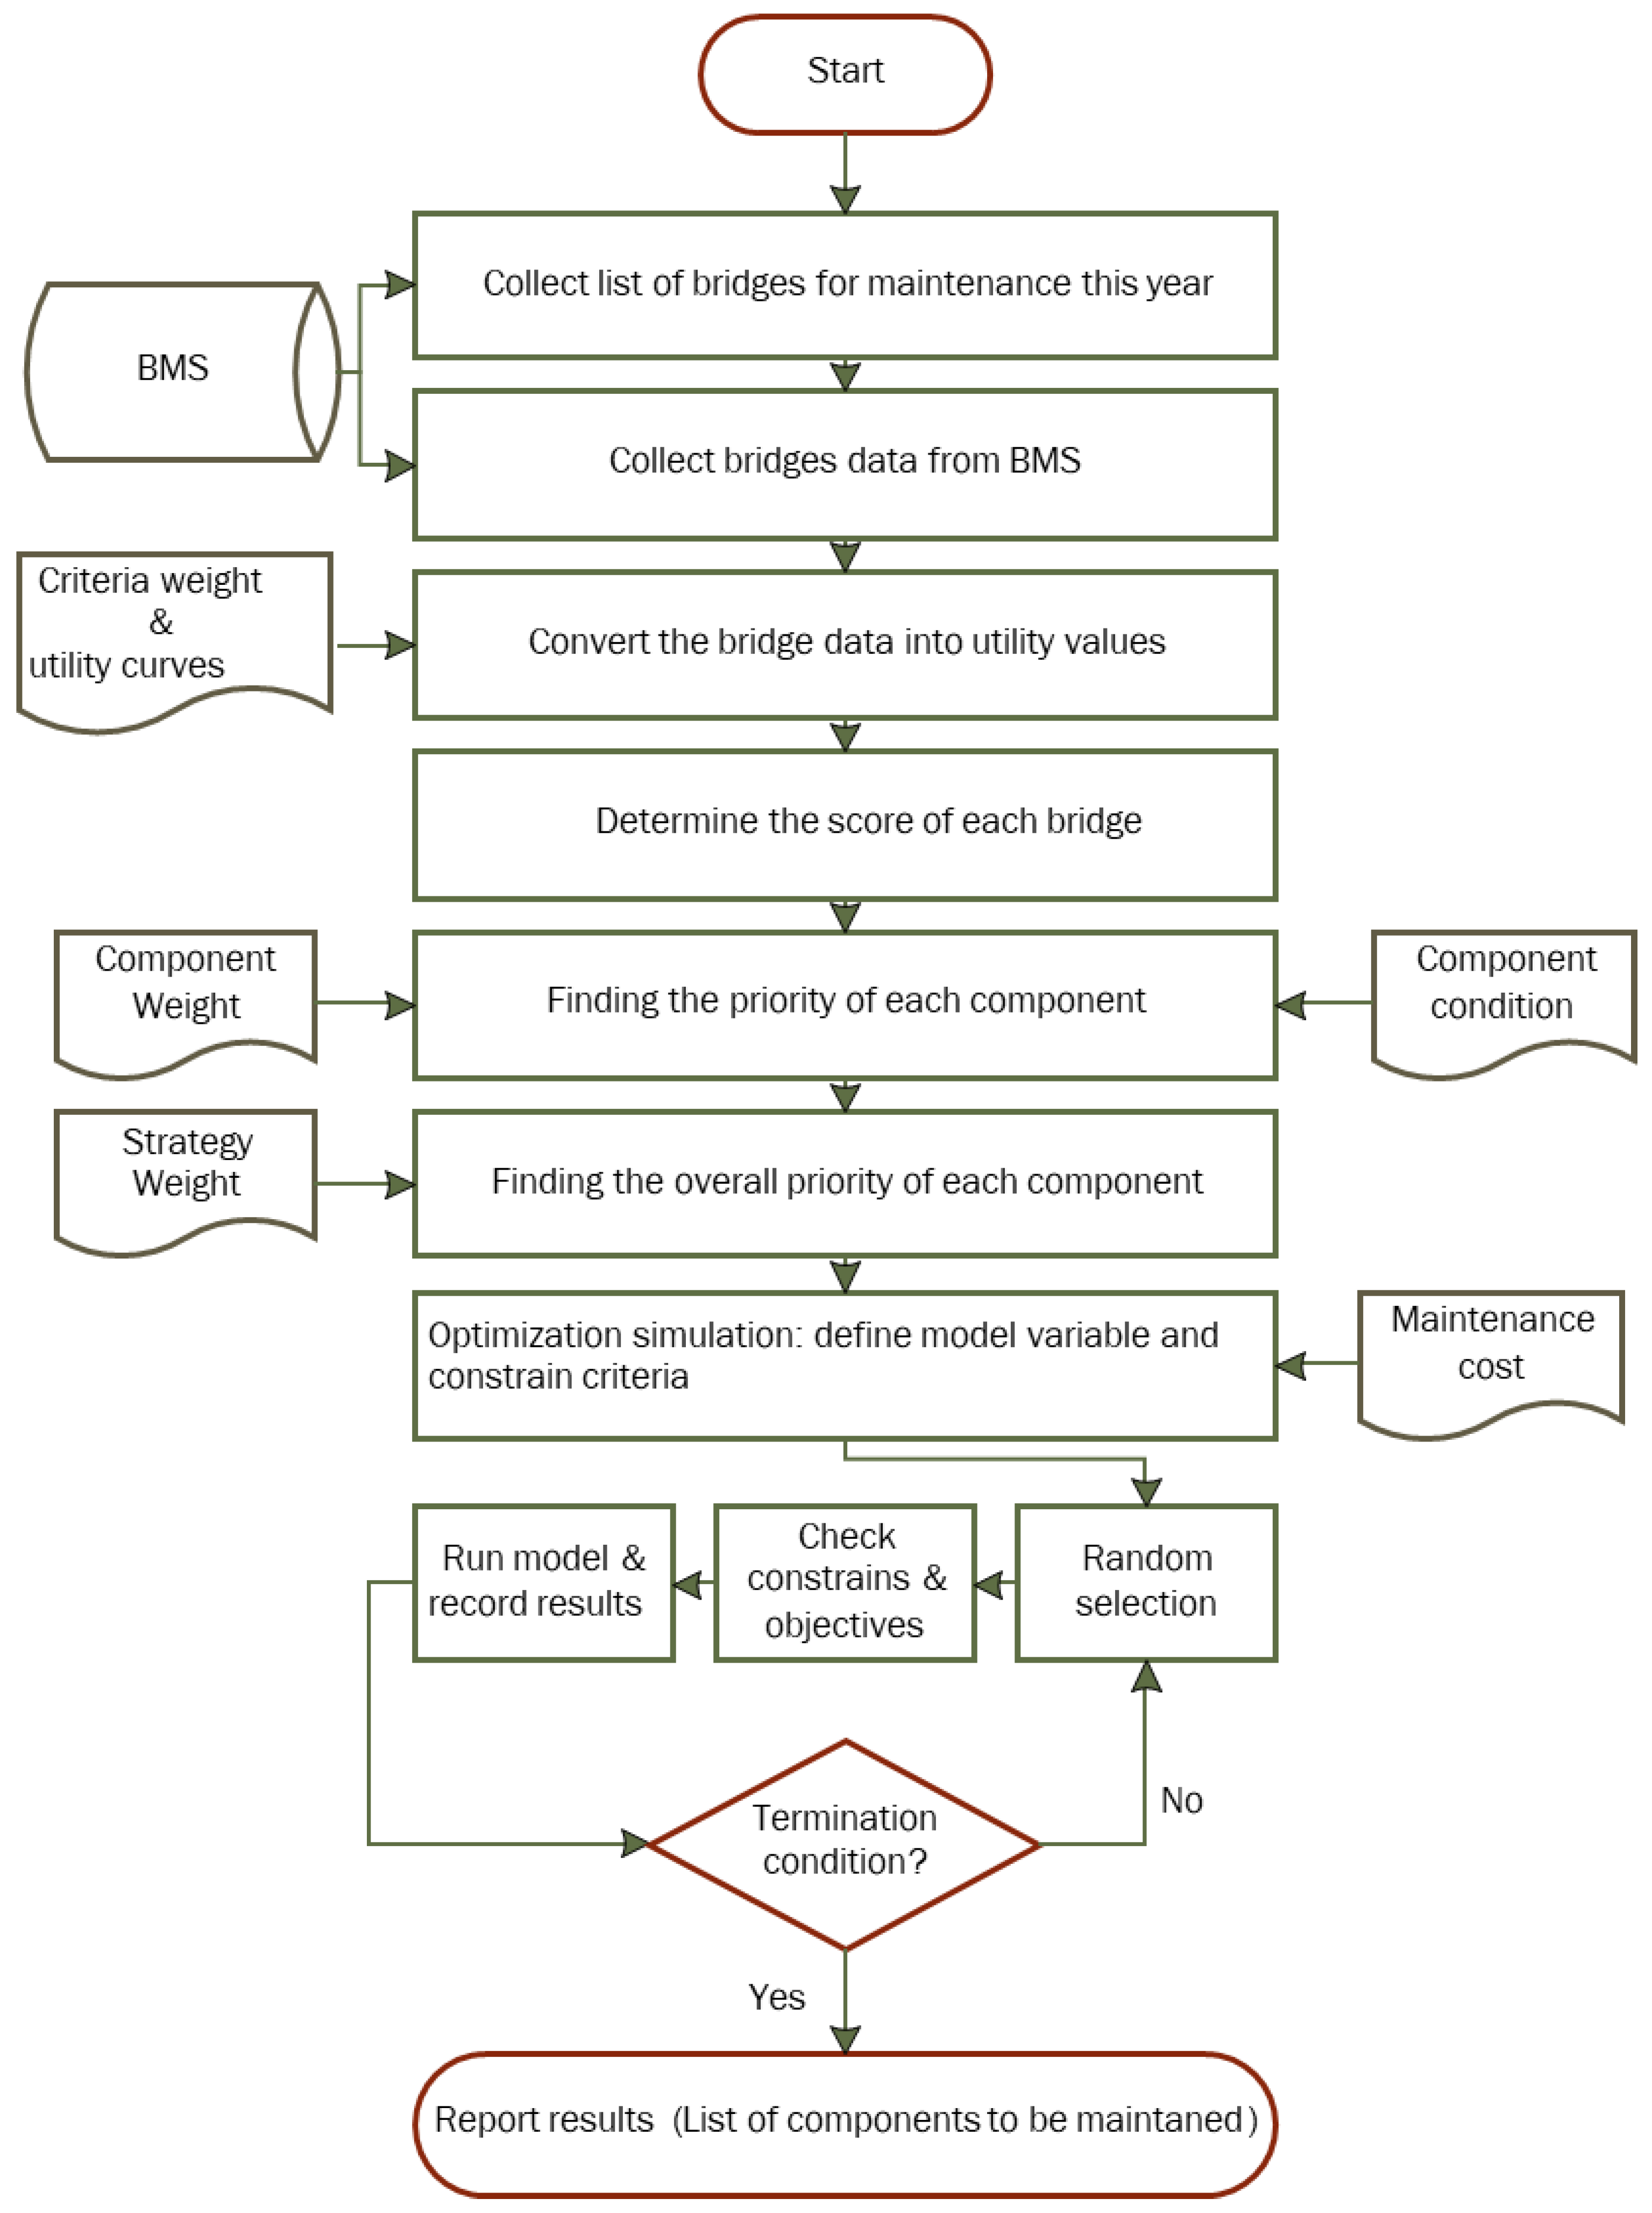
4.4. Computation Process Workflow
- o
- List of bridges to be maintained from the BMS;
- o
- Data related to the prioritization criteria of these bridges (e.g., age of the bridge, condition assessment of each structural element, etc.);
- o
- Pre-defined weight of each prioritization criterion and each structural element from the conducted AHP survey;
- o
- Pre-defined equations of each utility curve as presented in Figure 2;
- o
- The owner (Bridge Management Authority) enters score for each bridge criteria;
- o
- The estimated maintenance cost of each structural element in each bridge;
- o
- The available budget.
- o
- Starting from the Bridge Data, such as Bridge Age for the first bridge (which was taken from the BMS), the bridge age is then substituted in the equation of bridge age criteria to determine the corresponding utility value . b is the bridge number and c is the criteria number;
- o
- The pre-defined Bridge Age criteria weight is already entered in the first step;
- o
- The model starts by multiplying the utility value Ub,c of prioritization criterion C1 for bridge Ba by the weight of C1 which is ;
- o
- The model does the same as previous points for all prioritization criterions for one bridge and records the sum of all products Ub,c × WCn, which will be the bridge rank;
- o
- The model repeats the same previous points for all bridges to determine the rank of each bridge;
- o
- The mathematical expression of determining the bridge rank for certain number of prioritization criterion is shown in the following Equation (1):
- o
- Upon determining the bridge rank, the model will have the following parameters: Bridge Rank BRb, condition assessment of each structural element and the corresponding utility value Ub,se b is the bridge number, se is the structural element number (from BMS) and the pre-defined weight of each structural element Wse;
- o
- The model multiplies the Bridge Rank by the pre-defined weight of the structural element Wse (see Table 5) by the utility value of the condition assessment of the same structural element Ub,se to determine the bridge structure element rank;
- o
- The result obtained from the previous step is then multiplied by the maintenance strategy score to obtain the overall priority of that structural element (optional in case the owner wants to prioritize a certain maintenance strategy according to the condition assessment);
- o
- The higher the score value is, the more eligible the bridge’s structural element for maintenance becomes.
- o
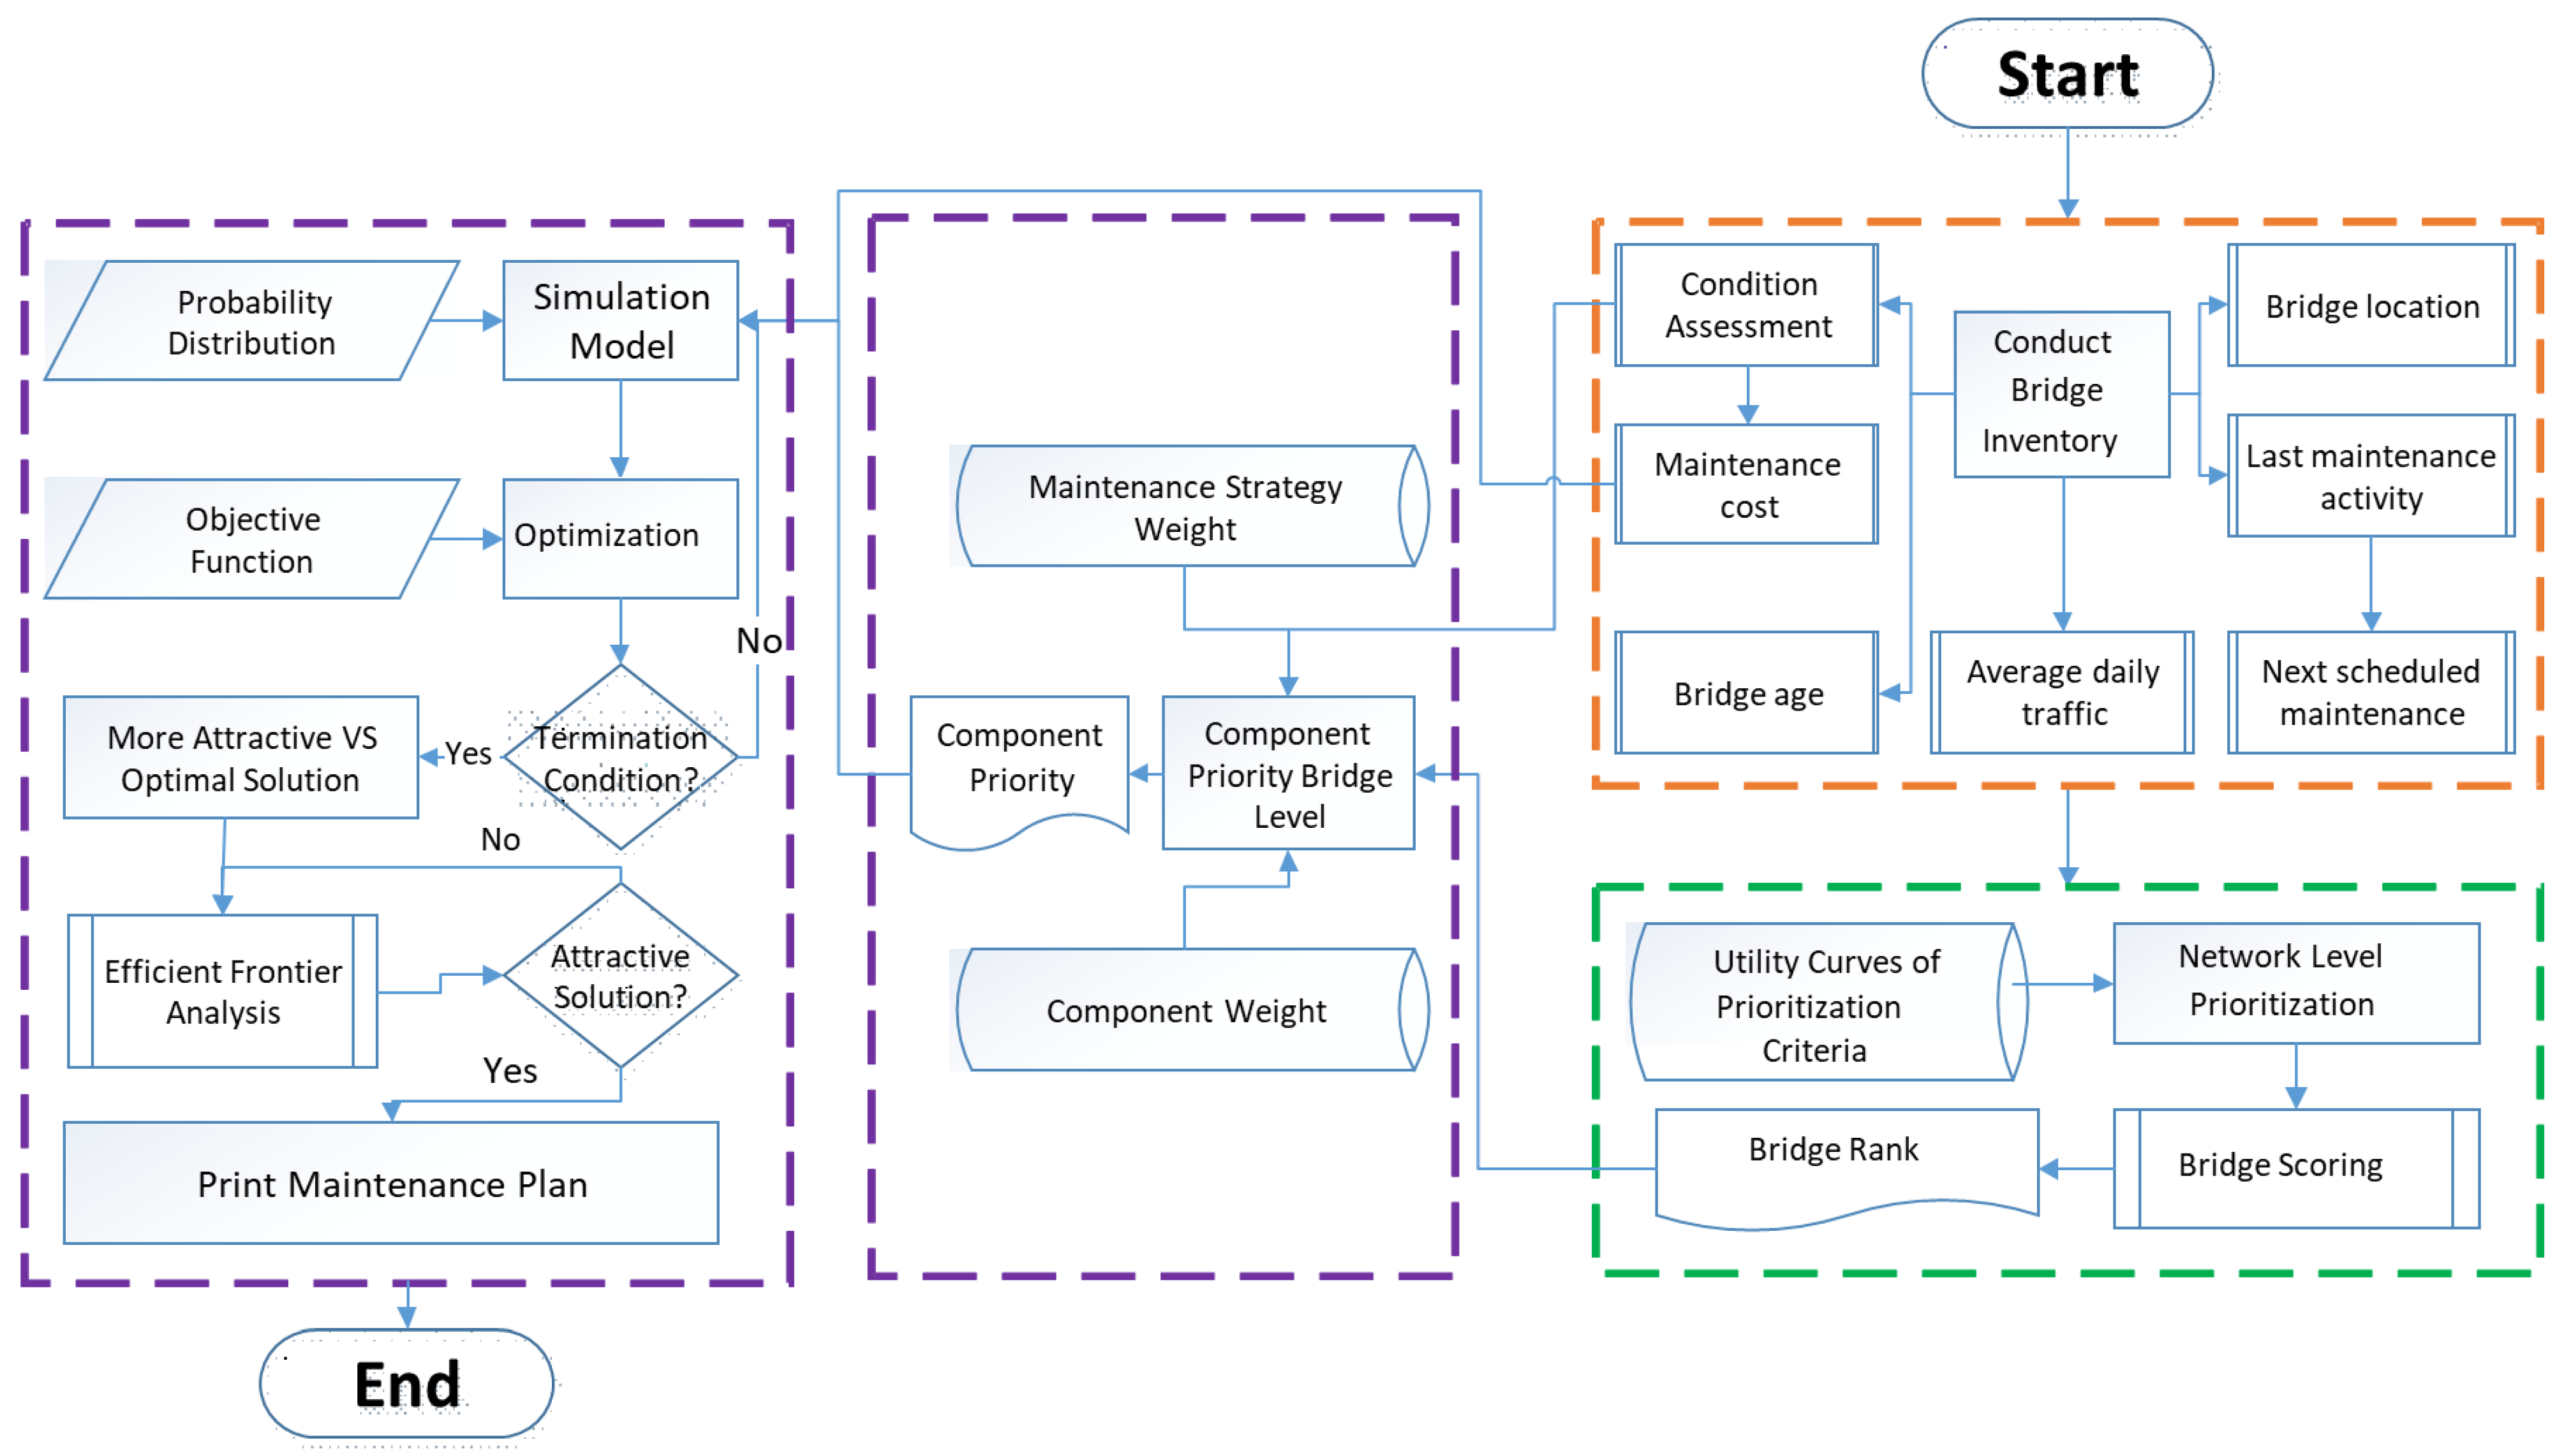
- The overall priority of the structural elements, maintenance costs, and the budget are then used as inputs to the optimization-based simulation in the risk analysis software;
- o
- The probability distribution is defined based on the uncertainty relevant to the two variables (priority and the structural element cost);
- o
- The objective function is set to be the maximum summation of the priorities of the selected structural elements, while the total maintenance cost for the same structural element must be equal to or less than the constraint budget;
- o
- The risk analysis software then randomly selects a set of structural elements between 1 and N (where N is the number of structural elements to be maintained), along with the estimated maintenance cost and its priority;
- o
- The total cost of the selected maintenance plan is compared with the budget;
- o
- If the selected maintenance plan satisfies the budget, the set of selected structural elements is recorded and prioritized;
- o
- The random selection methodology uses the concept of binary decisions. The structural element is either included or excluded from the maintenance plan. If it is to be included, then the decision given a value of 1, and is multiplied by the overall priority;
- o
- If the decision is not to include it, then the decision is given a value of 0. This is performed randomly and iteratively while the model is assigning a decision (1 or 0) for each structural element. The structural element which receives decision 1 means it is included in the maintenance plan and the zeros are excluded;
- o
- The output consists of list of structural elements to be included in the maintenance plan;
- o
- The model will record each list and its total cost and the sum of priority.
- o
- The lists having a total cost less than the budgeted cost will be compared with each other to figure out the list with the maximum sum of priorities;
- o
- The near-optimum solution (maintenance plan) out of these solutions (maintenance plans) is the one with the highest priority and the least cost, which also satisfies the budget.
- o
- The termination condition in the optimization-based simulation is limited to the number of iterations.
- o
- The model reports the set of structural elements (maintenance plan) with the maximum sum of priority, while the sum of the maintenance cost is equal to or less than the budget. Figure 4 illustrates the model, including the major processes and data input.
4.4.1. Constraints
4.4.2. Model Objective Function
5. Example Project
Discussion of the Results
6. Conclusions
- Considers uncertainties associated with the estimated maintenance cost.
- Provides an optimum maintenance plan while taking into account the risk using frontier analysis technique.
- Provides the most feasible solution in which the decision-maker will be more assured that the selected maintenance plan will be achieved with a certain level of confidence.
- Combines AHP and MAUT to obtain their individual benefits and overcome their limitations.
- Considers the rank of the bridge in the network level along with the condition of the structural elements to distribute the available budget.
- Capable of carrying out a risk analysis for the selected maintenance strategy plans by applying efficient frontier analysis. Eventually, the maintenance plan, the output of the model, is a list of prioritized structural elements with their budgeted cost equaling the budget or less.
Author Contributions
Funding
Institutional Review Board Statement
Informed Consent Statement
Data Availability Statement
Acknowledgments
Conflicts of Interest
References
- Abu Dabous, S.; Alkass, S. Decision support method for multi-criteria selection of bridge rehabilitation strategy. Constr. Manag. Econ. 2008, 26, 883–893. [Google Scholar]
- Harding, J.E.; Parke, G.A.R.; Ryall, M.J. Bridge Management: Inspection, Maintenance, Assessment and Repair, 2nd ed.; Springer: New York, NY, USA, 2010. [Google Scholar]
- Arif, F.; Bayraktar, M.E.; Chowdhury, A.G. Decision support model for infrastructure maintenance investment decision making. J. Manag. Eng. 2016, 32, 04015030. [Google Scholar]
- Alsharqawi, M.; Zayed, T.; Dabous, S.A. Common practices in assessing conditions of concrete bridges. Proc. MATEC Web Conf. EDP Sci. 2017, 120, 02016. [Google Scholar]
- Rashidi, M.; Gibson, P. Proposal of a Methodology for Bridge Condition Assessment. In Proceedings of the 43rd Australasian Transport Research Forum, Adelaide, Australia, 28–30 September 2011; pp. 1–15. [Google Scholar]
- Neves, L.A.; Frangopol, D.M.; Cruz, P.J. Probabilistic lifetime-oriented multiobjective optimization of bridge maintenance: Single maintenance type. J. Struct. Eng. 2006, 132, 991–1005. [Google Scholar]
- Radić, J.; Bleiziffer, J.; Tkalčić, D. Maintaining safety and serviceability of concrete bridges in Croatia. Bridge Struct. 2005, 1, 327–344. [Google Scholar]
- Saaty, T.L. The Analytic Hierarchy Process: Planning, Priority Setting, Resource Allocation; McGraw-Hill: New York, NY, USA, 1990. [Google Scholar]
- Jansen, S.J.T. The multi-attribute utility method, Chapter 5. In The Measurement and Analysis of Housing Preference and Choice; Jansen, S.J.T., Coolen, H.C.C.H., Goetgeluk, R., Eds.; Springer: Berlin/Heidelberg, Germany, 2011. [Google Scholar]
- Abu Dabous, S.; Alkass, S. A multi-attribute ranking method for bridge management. Eng. Constr. Archit. Manag. 2010, 17, 282–291. [Google Scholar]
- Velasquez, M.; Hester, P.T. An analysis of multi-criteria decision making methods. Int. J. Oper. Res. 2013, 10, 56–66. [Google Scholar]
- Alshamrani, O.; Alshibani, A.; Alogaili, M. Analytic hierarchy process and multi attribute utility theory based approach for the selection of lighting systems in residential buildings: A case study. Buildings 2018, 8, 73. [Google Scholar]
- Hamida, H.; Alshibani, A. A multi-criteria decision-making model for selecting curtain wall systems in office buildings. J. Eng. Des. Technol. 2021, 19, 904–931. [Google Scholar]
- El-Tourkey, M.; Alshibani, A.; Mohammed, A.; Shash, A.; Tuffaha, F. An integrated decision support system for mobile crane selection. Expert Syst. Appl. 2022, 189, 116053. [Google Scholar]
- Abdullah, A.K.; Alshibani, A. Multi-criteria decision-making Model for selecting sustainable private partners for housing projects. J. Financ. Manag. Prop. Constr. 2022, 27, 112–140. [Google Scholar]
- Bukhsh, Z.; Stipanovic, I.; Klanker, G.; O’Connor, A.; Doree, A.G. Network level bridges maintenance planning using Multi-Attribute Utility Theory. Struct. Infrastruct. Eng. 2019, 15, 872–885. [Google Scholar]
- Rogulj, K.; Kilić Pamuković, J.; Jajac, N. A decision concept to the historic pedestrian bridges recovery planning. Appl. Sci. 2021, 11, 969. [Google Scholar]
- Wakchaure, S.S.; Jha, K.N. Determination of bridge health index using analytical hierarchy process. Constr. Manag. Econ. 2012, 30, 133–149. [Google Scholar]
- Rashid, M.M.; Herabat, P. Multiattribute prioritization Model for bridges, roadside elements, and traffic control devices maintenance. In Proceedings of the 10th International Bridge and Structure Management Conference: Transportation Research Circular E-C128, Buffalo, New York, NY, USA, 20–22 October 2008; pp. 175–188. [Google Scholar]
- Chassiakos, A.P.; Vagiotas, P.; Theodorakopoulos, D.D. A knowledge-based system for maintenance planning of highway concrete bridges. Adv. Eng. Softw. 2005, 36, 740–749. [Google Scholar]
- Rogulj, K.; Kilić Pamuković, J.; Jajac, N. Knowledge-based fuzzy expert system to the condition assessment of historic road bridges. Appl. Sci. 2021, 11, 1021. [Google Scholar]
- Zhang, W.; Wang, N. Bridge network maintenance prioritization under budget constraint. Struct. Saf. 2017, 67, 96–104. [Google Scholar]
- Abu Dabous, S. A Decision Support Methodology for Rehabilitation Management of Concrete Bridges. Ph.D. Thesis, The Department of Building, Civil and Environmental Engineering, Concordia University, Ann Arbor, MI, Canada, 2008. [Google Scholar]
- Abu Dabous, S.; Alkass, S. Managing bridge infrastructure under budget constraints: A decision support methodology. Can. J. Civ. Eng. 2012, 38, 1227–1237. [Google Scholar]
- Rashidi, M.; Samali, B.; Sharafi, P. A new model for bridge management: Part A: Condition assessment and priority ranking of bridges. Aust. J. Civ. Eng. 2016, 14, 35–45. [Google Scholar]
- Rashidi, M.; Samali, B.; Sharafi, P. A new model for bridge management: Part B: Decision support system for remediation planning. Aust. J. Civ. Eng. 2016, 14, 46–53. [Google Scholar]
- Frangopol, D.M.; Liu, M. Bridge network maintenance optimization using stochastic dynamic programming. J. Struct. Eng. 2007, 133, 1772–1782. [Google Scholar]
- Amini, A.; Nikraz, N.; Fathizadeh, A. Identifying and evaluating the effective parameters in prioritization of urban roadway bridges for maintenance operations. Aust. J. Civ. Eng. 2016, 14, 23–34. [Google Scholar]
- Rashidi, M.; Gibson, P.; Ho, T.K. A new approach to bridge infrastructure management. In Proceedings of the International Symposium for Next Generation Infrastructure, Wollongong, Australia, 1–4 October 2013. [Google Scholar]
- Pesti, G.; Khattak, A.; Kannan, V.; McCoy, P.T. Decision aid for prioritizing bridge deck anti-icing system installations. In Proceedings of the 82nd Annual Meeting of the Transportation Research Board, Washington, DC, USA, 12–16 January 2003. [Google Scholar]
- Woodward, R.J.; Cullington, D.W.; Daly, A.F.; Vassie, P.R.; Haardt, P.; Kashner, R.; Astudillo, A.; Velando, C.; Godart, B.; Cremona, C.; et al. Bridge Management Systems: Extended Review of Existing Systems and Outline Model for a European System. Bridge Management in Europe—Final Report, BRIME PL97-2220. A Project Funded by the European Commission under the Transport RTD. Programme of the 4th Framework Programme. Project Duration: 1 January 1998 to 31 December 1999, Deliverable D14; European Commission under Transport RTD: Brussels, Belgium, 2000. [Google Scholar]
- Hai, D.T. Computerized database for maintenance and management of highway bridges in Vietnam. J. Bridge Eng. 2008, 13, 245–257. [Google Scholar]
- Klatter, H.E.; Van Noortwijk, J.M.; van Eck, N.V. Bridge management in the Netherlands. In Prioritisation based on network performance. In Proceedings of the First International Conference on Bridge Maintenance, Safety and Management (IABMAS), Barcelona, Spain, 14–17 July 2002; pp. 14–17. [Google Scholar]
- Elbehairy, H. Bridge Management System with Integrated Life Cycle Cost Optimization. Ph.D. Thesis, Civil Engineering, University of Waterloo, Waterloo, ON, Canada, 2007. [Google Scholar]
- Zhang, Z.; Aki, F.; Hudson, W.R. Developing an Integrated Management System for the Urban Transportation Infrastructure; Southwest Region University Transportation Center, Center for Transportation Research, Report No. SWUTC/02/167511-1; University of Texas: Texas, TX, USA, 2002. [Google Scholar]
- Alikhani, A. Urban Bridges Maintenance Prioritization. Master’s Thesis, Iran Science and Technology University, Tehran, Iran, 2009. [Google Scholar]
- Valenzuela, S.; de Solminihac, H.; Echaveguren, T. Proposal of an Integrated Index for Prioritization of Bridge Maintenance. J. Bridge Eng. 2010, 15, 337–343. [Google Scholar]
- Saaty, T.L. How to make a decision: The analytic hierarchy process. Interfaces 1994, 24, 19–43. [Google Scholar]
- MOMRA. Bridges and Tunnels Maintenance Manual (Parts 1, 2 and 3); MOMRA: Riyadh, Saudi Arabia, 2014. [Google Scholar]


| References | Location | Factors Considered in the Study | Factors Not Considered in This Study | ||||||||||||||||||||||||||||||||||||
|---|---|---|---|---|---|---|---|---|---|---|---|---|---|---|---|---|---|---|---|---|---|---|---|---|---|---|---|---|---|---|---|---|---|---|---|---|---|---|---|
| Condition | Age | Location | Previous Maintenance | Scheduled Maintenance | Traffic Condition | Route | Material Vulnerability | Environmental | Inspection Quality | Load-Bearing Capacity | Vertical Clearance | Width | Bridge Barrier | Drainage | Socioeconomic | Political | Historical | Strategic Importance | Hydraulic Vulnerability | Seismic Risk | Remaining Service Life | Agency Cost | Vehicle Operating Cost | Travel Time Savings | Visibility Distance | Savings in Accident Costs | Danger Due to Bridge Collapse | Maintenance Division facilities | Budget for Maintenance Division | Bridge Structure | Bridge Aesthetics | Construction Quality | Passing Convenience | Weather Information | Disruption of Public Services | Deterioration Prediction | Other Factors * | ||
| [2] | UK | ✔ | ✔ | ✔ | |||||||||||||||||||||||||||||||||||
| [29] | Australia | ✔ | ✔ | ✔ | ✔ | ✔ | ✔ | ✔ | ✔ | ✔ | ✔ | ✔ | ✔ | ✔ | ✔ | ||||||||||||||||||||||||
| [11] | Chile | ✔ | ✔ | ✔ | ✔ | ||||||||||||||||||||||||||||||||||
| [19] | Thailand | ✔ | ✔ | ✔ | ✔ | ✔ | ✔ | ✔ | ✔ | ✔ | ✔ | ||||||||||||||||||||||||||||
| [32] | Vietnam | ✔ | ✔ | ✔ | |||||||||||||||||||||||||||||||||||
| [31] | Belgium | ✔ | ✔ | ✔ | |||||||||||||||||||||||||||||||||||
| [31] | France | ✔ | ✔ | ✔ | ✔ | ✔ | |||||||||||||||||||||||||||||||||
| [31] | Slovenia | ✔ | ✔ | ✔ | |||||||||||||||||||||||||||||||||||
| [20] | Greece | ✔ | ✔ | ✔ | ✔ | ✔ | |||||||||||||||||||||||||||||||||
| [33] | Netherland | ✔ | ✔ | ✔ | ✔ | ✔ | |||||||||||||||||||||||||||||||||
| [31] | BRIME | ✔ | ✔ | ✔ | ✔ | ✔ | ✔ | ✔ | ✔ | ||||||||||||||||||||||||||||||
| [34] | Canada | ✔ | ✔ | ✔ | ✔ | ✔ | |||||||||||||||||||||||||||||||||
| [30] | USA | ✔ | ✔ | ✔ | |||||||||||||||||||||||||||||||||||
| [35] | USA | ✔ | ✔ | ✔ | |||||||||||||||||||||||||||||||||||
| [36] | Iran | ✔ | ✔ | ✔ | ✔ | ✔ | ✔ | ✔ | ✔ | ✔ | ✔ | ✔ | ✔ | ✔ | ✔ | ✔ | |||||||||||||||||||||||
| Local Expert | KSA | ✔ | ✔ | ✔ | ✔ | ✔ | ✔ | ||||||||||||||||||||||||||||||||
| SN | Criteria | References |
|---|---|---|
| 1 | Condition Factor | [2,19,20,29,31,35,37], Local Expert |
| 2 | Age Factor | [20,29,31,35], Local Expert |
| 3 | Location Factor | [2,32], Local Expert |
| 4 | Previous maintenance factor | [31,36], Local Expert |
| 5 | Scheduled maintenance factor | This factor is added by a Local Expert in case the scheduled maintenance is scheduled to be carried out very soon. In this case, the bridge will be more prioritized to be maintained |
| 6 | Traffic condition factor | [19,20,30,31,32,33,34,35,36], Local Expert |
| R1 | Condition Assessment | Bridge Age | Bridge Location | History of Maintenance | Scheduled Maintenance | Traffic Volume | |
|---|---|---|---|---|---|---|---|
| Condition assessment | 1.00 | 5.00 | 2.00 | 4.00 | 3.00 | 1.00 | |
| Bridge age | 0.20 | 1.00 | 0.50 | 0.50 | 0.33 | 0.25 | |
| Bridge location | 0.50 | 2.00 | 1.00 | 2.00 | 2.00 | 1.00 | |
| History of Maintenance | 0.25 | 2.00 | 0.50 | 1.00 | 0.33 | 0.25 | |
| Scheduled Maintenance | 0.33 | 3.00 | 0.50 | 3.00 | 1.00 | 0.50 | |
| Traffic volume | 1.00 | 4.00 | 1.00 | 4.00 | 2.00 | 1.00 | |
| 3.28 | 17.00 | 5.50 | 14.50 | 8.67 | 4.00 | ||
| Normalization | |||||||
| Condition assessment | Bridge age | Bridge location | History of Maintenance | Scheduled Maintenance | Traffic volume | Row Average | Consistency |
| 0.305 | 0.294 | 0.364 | 0.276 | 0.346 | 0.250 | 0.306 | 6.243 |
| 0.061 | 0.059 | 0.091 | 0.034 | 0.038 | 0.063 | 0.058 | 6.117 |
| 0.152 | 0.118 | 0.182 | 0.138 | 0.231 | 0.250 | 0.178 | 6.259 |
| 0.076 | 0.118 | 0.091 | 0.069 | 0.038 | 0.063 | 0.076 | 6.120 |
| 0.102 | 0.176 | 0.091 | 0.207 | 0.115 | 0.125 | 0.136 | 6.254 |
| 0.305 | 0.235 | 0.182 | 0.276 | 0.231 | 0.250 | 0.246 | 6.236 |
| 1.000 | 1.000 | 1.000 | 1.000 | 1.000 | 1.000 | 1.000 | 37.228 |
| # of Comparisons | Average Consistency | CI | RI | Consistency (CI/RI) | Consistent? Less than 0.1 | ||
| 6 | 6.204664 | 0.040933 | 1.24 | 0.03301 | Yes | ||
| Condition Assessment | Bridge Age | Bridge Location | History of Maintenance | Scheduled Maintenance | Traffic Volume | Total | |
|---|---|---|---|---|---|---|---|
| R1 | 0.3057 | 0.0577 | 0.1784 | 0.0758 | 0.136 | 0.2464 | 1 |
| R2 | 0.1509 | 0.0831 | 0.272 | 0.1219 | 0.1951 | 0.1771 | 1 |
| R3 | 0.1809 | 0.0672 | 0.2088 | 0.0997 | 0.1425 | 0.301 | 1 |
| R4 | 0.2519 | 0.182 | 0.2243 | 0.0708 | 0.0935 | 0.1776 | 1 |
| R5 | 0.1758 | 0.1074 | 0.2622 | 0.1993 | 0.0808 | 0.1744 | 1 |
| R6 | 0.235 | 0.1738 | 0.0797 | 0.1729 | 0.1401 | 0.1985 | 1 |
| R7 | 0.2813 | 0.102 | 0.151 | 0.0803 | 0.0973 | 0.2881 | 1 |
| R8 | 0.3614 | 0.2217 | 0.0607 | 0.1229 | 0.0932 | 0.1401 | 1 |
| R9 | 0.3896 | 0.1452 | 0.0929 | 0.068 | 0.0938 | 0.2105 | 1 |
| Median | 0.2519 | 0.1074 | 0.1784 | 0.0997 | 0.0973 | 0.1985 | 0.9331 |
| Mean | 0.2592 | 0.1267 | 0.17 | 0.1124 | 0.1192 | 0.2126 | 1 |
| Mode | 0.2519 | 0.1074 | 0.1784 | 0.0997 | 0.0973 | 0.1985 | 0.9331 |
| SD | 0.0833 | 0.0568 | 0.0789 | 0.047 | 0.037 | 0.0548 | 0.3579 |
| VAR | 0.0062 | 0.0029 | 0.0055 | 0.002 | 0.0012 | 0.0027 | 0.1281 |
| ∑VAR | 0.0204 | ||||||
| Cα | 0.9456 | ||||||
| Weight | 25.9% | 21.3% | 17.0% | 12.7% | 11.9% | 11.2% | 100% |
| Components | Bridge Deck and Parapet | Bearing Pads | Expansion Joint | Abutment Walls | Pier Columns | Foundations |
|---|---|---|---|---|---|---|
| Weights | 17.3% | 20.7% | 16.9% | 13.6% | 16.4% | 15.1% |
| Bridge 1 (B1) | Bridge 2 (B2) | Bridge 3 (B3) | Bridge 4 (B4) | |
|---|---|---|---|---|
| Condition assessment | 4 | 6 | 3 | 5 |
| Age (years) | 15 | 9 | 23 | 26 |
| Location | Industrial | Industrial | Commercial | Political |
| Previous maintenance (years) | 10 year. ago | 0 | 15 | 5 |
| Scheduled maintenance (years) | 5 year. later | 6 | 0 | 10 |
| Traffic volume (ADT) | 78,563 | 89,487 | 54,127 | 104,369 |
| Condition Assessment | |||||
|---|---|---|---|---|---|
| Bridge 1 (B1) | Bridge 2 (B2) | Bridge 3 (B3) | Bridge 4 (B4) | ||
| Bridge Deck and Parapet | M2 | 4 | 6 | 3 | 5 |
| Bearing Pads | EA | 3 | 5 | 4 | 5 |
| Expansion Joint | LM | 5 | 4 | 3 | 4 |
| Abutment Walls | M3 | 4 | 6.5 | 2 | 3 |
| Pier Columns | M3 | 4 | 6.5 | 2 | 6 |
| Foundations | M3 | 4 | 7 | 4 | 6 |
| Quantity | |||||
| Bridge 1 (B1) | Bridge 2 (B2) | Bridge 3 (B3) | Bridge 4 (B4) | ||
| Bridge Deck and Parapet | M2 | 1314 | 2044 | 876 | 1752 |
| Bearing Pads | EA | 44 | 60 | 24 | 60 |
| Expansion Joint | LM | 53.8 | 68.4 | 39.2 | 68.4 |
| Abutment Walls | M3 | 860 | 950 | 685 | 890 |
| Pier Columns | M3 | 350 | 490 | 280 | 420 |
| Foundations | M3 | 900 | 1125 | 675 | 810 |
| Bridge 1 (B1) | Bridge 2 (B2) | Bridge 3 (B3) | Bridge 4 (B4) | ||
|---|---|---|---|---|---|
| Bridge Deck and Parapet | SAR | 394,200.00 | 613,200.00 | 262,800.00 | 525,600.00 |
| Bearing Pads | SAR | 660,000.00 | 900,000.00 | 360,000.00 | 900,000.00 |
| Expansion Joint | SAR | 134,500.00 | 171,000.00 | 98,000.00 | 171,000.00 |
| Abutment Walls | SAR | 645,000.00 | 712,500.00 | 513,750.00 | 667,500.00 |
| Pier Columns | SAR | 262,500.00 | 367,500.00 | 210,000.00 | 315,000.00 |
| Foundations | SAR | 675,000.00 | 843,750.00 | 506,250.00 | 607,500.00 |
| Total | SAR | 2,771,200.00 | 3,607,950.00 | 1,950,800.00 | 3,186,600.00 |
| 11,516,550.00 | |||||
| Prioritization Factor | Weight | Bridge 1 (B1) | Bridge 2 (B2) | Bridge 3 (B3) | Bridge 4 (B4) |
|---|---|---|---|---|---|
| Condition assessment | 25.9% | 0.438 | 0.067 | 0.637 | 0.297 |
| Age (Years) | 12.7% | 0.377 | 0.193 | 0.628 | 0.723 |
| Location | 17.0% | 0.750 | 0.750 | 0.500 | 1.000 |
| Previous of maintenance | 11.2% | 0.225 | 0.000 | 0.391 | 0.065 |
| Scheduled maintenance | 11.9% | 1.000 | 0.973 | 1.000 | 0.733 |
| Traffic volume (ADT) | 21.3% | 0.500 | 0.750 | 0.250 | 1.000 |
| Overall score | 0.540 | 0.445 | 0.546 | 0.646 |
| Bridge | Bridge 1 (B1) | Bridge 2 (B2) | Bridge 3 (B3) | Bridge 4 (B4) | |
|---|---|---|---|---|---|
| Components | Weight | 0.540 | 0.445 | 0.546 | 0.646 |
| Bridge Deck and Parapet | 17.3% | 0.439 | 0.118 | 0.618 | 0.272 |
| Bearing Pads | 20.7% | 0.618 | 0.272 | 0.439 | 0.272 |
| Expansion Joint | 16.9% | 0.272 | 0.439 | 0.618 | 0.439 |
| Abutment Walls | 13.6% | 0.439 | 0.045 | 0.809 | 0.618 |
| Pier Columns | 16.4% | 0.439 | 0.045 | 0.809 | 0.118 |
| Foundations | 15.1% | 0.439 | 0.000 | 0.439 | 0.118 |
| Components Priority | |||||
| Bridge 1 (B1) | Bridge 2 (B2) | Bridge 3 (B3) | Bridge 4 (B4) | ||
| Bridge Deck and Parapet | 40.9 | 9.0 | 58.2 | 30.3 | |
| Bearing Pads | 69.1 | 25.1 | 49.6 | 36.4 | |
| Expansion Joint | 24.8 | 33.0 | 57.1 | 48.0 | |
| Abutment Walls | 32.3 | 2.7 | 60.2 | 54.4 | |
| Pier Columns | 38.8 | 3.3 | 72.4 | 12.4 | |
| Foundations | 35.7 | 0.0 | 36.1 | 11.4 | |
| Recommended Maintenances | Preventive | Remedial/Curative | Rehabilitation | Replacement |
|---|---|---|---|---|
| Score | 0.5 | 0.75 | 1 | 0.25 |
| Condition State | More than 5 | 5 to 4 | 4 to 3 | Less than 3 |
| Utility Value | 0.272 or less | 0.272–0.439 | 0.439–0.618 | 0.618 or more |
| Condition | Code | Name | Structural Elements Priority | Maintenance Plan Priority | Overall Priority | Maintenance Cost |
|---|---|---|---|---|---|---|
| 0.6179 | B1C2 | Bridge 1: Bearing Pads | 69.075 | 1.00 | 69.075 | 660,000.00 |
| 0.6179 | B3C1 | Bridge 3: Bridge Deck and Parapet | 58.212 | 1.00 | 58.212 | 262,800.00 |
| 0.6179 | B3C3 | Bridge 3: Expansion Joint | 57.074 | 1.00 | 57.074 | 98,000.00 |
| 0.6179 | B4C4 | Bridge 4: Abutment Walls | 54.370 | 1.00 | 54.370 | 667,500.00 |
| 0.4389 | B3C2 | Bridge 3: Bearing Pads | 49.625 | 0.75 | 37.218 | 360,000.00 |
| 0.4389 | B4C3 | Bridge 4: Expansion Joint | 47.967 | 0.75 | 35.975 | 171,000.00 |
| 0.4389 | B1C1 | Bridge 1: Bridge Deck and Parapet | 40.882 | 0.75 | 30.661 | 394,200.00 |
| 0.4389 | B1C5 | Bridge 1: Pier Columns | 38.837 | 0.75 | 29.128 | 262,500.00 |
| 0.2721 | B4C2 | Bridge 4: Bearing Pads | 36.401 | 0.75 | 27.301 | 900,000.00 |
| 0.4389 | B3C6 | Bridge 3: Foundations | 36.128 | 0.75 | 27.096 | 506,250.00 |
| 0.4389 | B1C6 | Bridge 1: Foundations | 35.720 | 0.75 | 26.790 | 675,000.00 |
| 0.4389 | B2C3 | Bridge 2: Expansion Joint | 33.021 | 0.75 | 24.766 | 171,000.00 |
| 0.4389 | B1C4 | Bridge 1: Abutment Walls | 32.271 | 0.75 | 24.203 | 645,000.00 |
| 0.2721 | B4C1 | Bridge 4: Bridge Deck and Parapet | 30.330 | 0.75 | 22.748 | 525,600.00 |
| 0.2721 | B2C2 | Bridge 2: Bearing Pads | 25.059 | 0.75 | 18.794 | 900,000.00 |
| 0.2721 | B1C3 | Bridge 1: Expansion Joint | 24.849 | 0.75 | 18.637 | 134,500.00 |
| 0.8091 | B3C5 | Bridge 3: Pier Columns | 72.413 | 0.25 | 18.103 | 210,000.00 |
| 0.8091 | B3C4 | Bridge 3: Abutment Walls | 60.171 | 0.25 | 15.042 | 513,750.00 |
| 0.1175 | B4C5 | Bridge 4: Pier Columns | 12.442 | 0.5 | 6.221 | 315,000.00 |
| 0.1175 | B4C6 | Bridge 4: Foundations | 11.444 | 0.5 | 5.722 | 607,500.00 |
| 0.1175 | B2C1 | Bridge 2: Bridge Deck and Parapet | 9.016 | 0.5 | 4.508 | 613,200.00 |
| 0.044775 | B2C5 | Bridge 2: Pier Columns | 3.264 | 0.5 | 1.632 | 367,500.00 |
| 0.044775 | B2C4 | Bridge 2: Abutment Walls | 2.712 | 0.5 | 1.356 | 712,500.00 |
| 0 | B2C6 | Bridge 2: Foundations | 0 | 0.5 | 0 | 843,750.00 |
| Simulation Parameter | Data Source | Probability Distribution | Parameter Type |
|---|---|---|---|
| Component Priority | Component prioritization—Model | Constant | Assumption |
| Component Maintenance Cost | BMS | Constant | Assumption |
| Decision | Assumed Randomly | Discrete | Decision |
| Total Priority | Calculated | - | Forecast |
| Total Maintenance Cost | Calculated | - | Forecast |
| Case | Case Type | Priority Probability Distribution.it | Cost Probability Distribution.it | Optimal Solution | |
|---|---|---|---|---|---|
| Priority | Cost (SAR) | ||||
| Scenario 1 | Deterministic | NA | NA | 586.38 | 7,858,350.00 |
| Scenario 2 | 2—Variable Uncertainty | Triangular | Gamma | 474.41 | 7,597,540.08 |
| Scenario 3 | 1—Variable Uncertainty | Triangular | NA | 572.4 | 7,770,300.00 |
| Rank | Cost ≤ 8,000,000 | B1C1 | B1C2 | B1C3 | B1C4 | B1C5 | B1C6 | B2C1 | B2C2 | B2C3 | B2C4 | B2C5 | B2C6 | B3C1 | B3C2 | B3C3 | B3C4 | B3C5 | B3C6 | B4C1 | B4C2 | B4C3 | B4C4 | B4C5 | B4C6 |
|---|---|---|---|---|---|---|---|---|---|---|---|---|---|---|---|---|---|---|---|---|---|---|---|---|---|
| 1 | 7,987,228.42 | 1.00 | 1.00 | 1.00 | 1.00 | 1.00 | 1.00 | 1.00 | 0.00 | 1.00 | 0.00 | 0.00 | 0.00 | 1.00 | 1.00 | 1.00 | 1.00 | 1.00 | 1.00 | 1.00 | 1.00 | 1.00 | 1.00 | 1.00 | 0.00 |
| 95 | 7,888,740.30 | 1.00 | 1.00 | 0.00 | 0.00 | 1.00 | 0.00 | 0.00 | 0.00 | 1.00 | 1.00 | 1.00 | 1.00 | 1.00 | 1.00 | 1.00 | 1.00 | 0.00 | 1.00 | 1.00 | 1.00 | 1.00 | 1.00 | 0.00 | 1.00 |
| 170 | 7,063,540.42 | 1.00 | 1.00 | 1.00 | 0.00 | 1.00 | 1.00 | 1.00 | 1.00 | 1.00 | 1.00 | 1.00 | 0.00 | 1.00 | 1.00 | 0.00 | 0.00 | 1.00 | 0.00 | 1.00 | 0.00 | 1.00 | 1.00 | 0.00 | 0.00 |
| 171 | 6,283,555.99 | 1.00 | 1.00 | 1.00 | 0.00 | 1.00 | 1.00 | 1.00 | 1.00 | 1.00 | 0.00 | 1.00 | 0.00 | 1.00 | 1.00 | 0.00 | 0.00 | 1.00 | 0.00 | 1.00 | 0.00 | 1.00 | 1.00 | 0.00 | 0.00 |
| 237 | 7,814,427.77 | 0.00 | 1.00 | 1.00 | 1.00 | 1.00 | 1.00 | 0.00 | 0.00 | 0.00 | 1.00 | 1.00 | 1.00 | 1.00 | 0.00 | 1.00 | 1.00 | 1.00 | 1.00 | 1.00 | 1.00 | 0.00 | 0.00 | 1.00 | 0.00 |
| 291 | 6,437,883.44 | 0.00 | 1.00 | 1.00 | 1.00 | 1.00 | 1.00 | 0.00 | 1.00 | 1.00 | 0.00 | 0.00 | 0.00 | 0.00 | 1.00 | 0.00 | 1.00 | 0.00 | 1.00 | 1.00 | 0.00 | 0.00 | 1.00 | 1.00 | 0.00 |
| 413 | 7,083,628.18 | 1.00 | 1.00 | 1.00 | 0.00 | 1.00 | 0.00 | 0.00 | 1.00 | 1.00 | 1.00 | 1.00 | 1.00 | 1.00 | 0.00 | 0.00 | 1.00 | 1.00 | 0.00 | 0.00 | 1.00 | 0.00 | 0.00 | 0.00 | 1.00 |
| 518 | 5,336,900.08 | 0.00 | 0.00 | 0.00 | 1.00 | 0.00 | 0.00 | 1.00 | 0.00 | 0.00 | 0.00 | 0.00 | 1.00 | 0.00 | 1.00 | 1.00 | 1.00 | 1.00 | 1.00 | 1.00 | 1.00 | 1.00 | 0.00 | 0.00 | 0.00 |
| 569 | 5,174,543.92 | 0.00 | 0.00 | 1.00 | 1.00 | 1.00 | 1.00 | 0.00 | 1.00 | 1.00 | 1.00 | 0.00 | 0.00 | 1.00 | 0.00 | 0.00 | 1.00 | 1.00 | 0.00 | 0.00 | 0.00 | 0.00 | 0.00 | 1.00 | 0.00 |
| 693 | 4,431,149.35 | 0.00 | 0.00 | 0.00 | 0.00 | 0.00 | 1.00 | 0.00 | 0.00 | 0.00 | 1.00 | 1.00 | 1.00 | 1.00 | 0.00 | 0.00 | 0.00 | 0.00 | 1.00 | 0.00 | 0.00 | 0.00 | 1.00 | 1.00 | 0.00 |
| 699 | 3,867,251.25 | 0.00 | 0.00 | 1.00 | 0.00 | 0.00 | 0.00 | 1.00 | 0.00 | 0.00 | 0.00 | 1.00 | 1.00 | 1.00 | 1.00 | 0.00 | 1.00 | 0.00 | 1.00 | 0.00 | 0.00 | 0.00 | 0.00 | 1.00 | 0.00 |
| 730 | 4,297,480.15 | 0.00 | 0.00 | 0.00 | 1.00 | 0.00 | 1.00 | 1.00 | 1.00 | 1.00 | 0.00 | 0.00 | 0.00 | 0.00 | 0.00 | 0.00 | 0.00 | 1.00 | 0.00 | 0.00 | 1.00 | 0.00 | 0.00 | 0.00 | 0.00 |
| 762 | 2,159,454.18 | 0.00 | 0.00 | 0.00 | 0.00 | 0.00 | 1.00 | 0.00 | 0.00 | 0.00 | 0.00 | 1.00 | 0.00 | 0.00 | 0.00 | 1.00 | 1.00 | 0.00 | 0.00 | 1.00 | 0.00 | 0.00 | 0.00 | 0.00 | 0.00 |
| 788 | 2,253,306.44 | 0.00 | 0.00 | 0.00 | 0.00 | 0.00 | 0.00 | 1.00 | 0.00 | 1.00 | 0.00 | 0.00 | 0.00 | 0.00 | 0.00 | 0.00 | 0.00 | 1.00 | 1.00 | 0.00 | 1.00 | 0.00 | 0.00 | 0.00 | 0.00 |
| 823 | 1,283,440.43 | 1.00 | 0.00 | 1.00 | 0.00 | 0.00 | 0.00 | 0.00 | 0.00 | 0.00 | 0.00 | 0.00 | 0.00 | 0.00 | 0.00 | 0.00 | 0.00 | 1.00 | 0.00 | 0.00 | 0.00 | 0.00 | 0.00 | 0.00 | 1.00 |
| 827 | 720,867.37 | 1.00 | 0.00 | 1.00 | 0.00 | 0.00 | 0.00 | 0.00 | 0.00 | 0.00 | 0.00 | 0.00 | 0.00 | 0.00 | 0.00 | 0.00 | 0.00 | 1.00 | 0.00 | 0.00 | 0.00 | 0.00 | 0.00 | 0.00 | 0.00 |
| 862 | 384,422.71 | 1.00 | 0.00 | 0.00 | 0.00 | 0.00 | 0.00 | 0.00 | 0.00 | 0.00 | 0.00 | 0.00 | 0.00 | 0.00 | 0.00 | 0.00 | 0.00 | 0.00 | 0.00 | 0.00 | 0.00 | 0.00 | 0.00 | 0.00 | 0.00 |
| 869 | 1,545,902.48 | 0.00 | 0.00 | 0.00 | 0.00 | 0.00 | 0.00 | 1.00 | 0.00 | 0.00 | 0.00 | 0.00 | 1.00 | 0.00 | 0.00 | 0.00 | 0.00 | 1.00 | 0.00 | 0.00 | 0.00 | 0.00 | 0.00 | 0.00 | 0.00 |
| 873 | 1,612,171.12 | 0.00 | 0.00 | 0.00 | 0.00 | 0.00 | 0.00 | 0.00 | 0.00 | 0.00 | 0.00 | 1.00 | 1.00 | 0.00 | 0.00 | 0.00 | 0.00 | 0.00 | 0.00 | 0.00 | 0.00 | 0.00 | 0.00 | 1.00 | 0.00 |
| 879 | 0.00 | 0.00 | 0.00 | 0.00 | 0.00 | 0.00 | 0.00 | 0.00 | 0.00 | 0.00 | 0.00 | 0.00 | 0.00 | 0.00 | 0.00 | 0.00 | 0.00 | 0.00 | 0.00 | 0.00 | 0.00 | 0.00 | 0.00 | 0.00 | 0.00 |
Disclaimer/Publisher’s Note: The statements, opinions and data contained in all publications are solely those of the individual author(s) and contributor(s) and not of MDPI and/or the editor(s). MDPI and/or the editor(s) disclaim responsibility for any injury to people or property resulting from any ideas, methods, instructions or products referred to in the content. |
© 2023 by the authors. Licensee MDPI, Basel, Switzerland. This article is an open access article distributed under the terms and conditions of the Creative Commons Attribution (CC BY) license (https://creativecommons.org/licenses/by/4.0/).
Share and Cite
Alshibani, A.; Abu Saa, A.S.; Hassanain, M.A.; Bubshait, A.; Shash, A. Decision Support Model for Allocating Maintenance Budgets for Bridges. Appl. Sci. 2023, 13, 9679. https://doi.org/10.3390/app13179679
Alshibani A, Abu Saa AS, Hassanain MA, Bubshait A, Shash A. Decision Support Model for Allocating Maintenance Budgets for Bridges. Applied Sciences. 2023; 13(17):9679. https://doi.org/10.3390/app13179679
Chicago/Turabian StyleAlshibani, Adel, Amin S. Abu Saa, Mohammad A. Hassanain, Abdulaziz Bubshait, and Ali Shash. 2023. "Decision Support Model for Allocating Maintenance Budgets for Bridges" Applied Sciences 13, no. 17: 9679. https://doi.org/10.3390/app13179679
APA StyleAlshibani, A., Abu Saa, A. S., Hassanain, M. A., Bubshait, A., & Shash, A. (2023). Decision Support Model for Allocating Maintenance Budgets for Bridges. Applied Sciences, 13(17), 9679. https://doi.org/10.3390/app13179679