

The Effect of Bodyweight Support and Incline Running on Triceps Surae Electromyographic Activity

 ,
,  ,
,  ,
, 
Abstract
1. Introduction
2. Materials and Methods
2.1. Experimental Design
2.2. Subjects
2.3. Procedures and Running Trials
2.4. Evaluations of Jumping Performance
2.5. Evaluation of Low-Frequency Fatigue
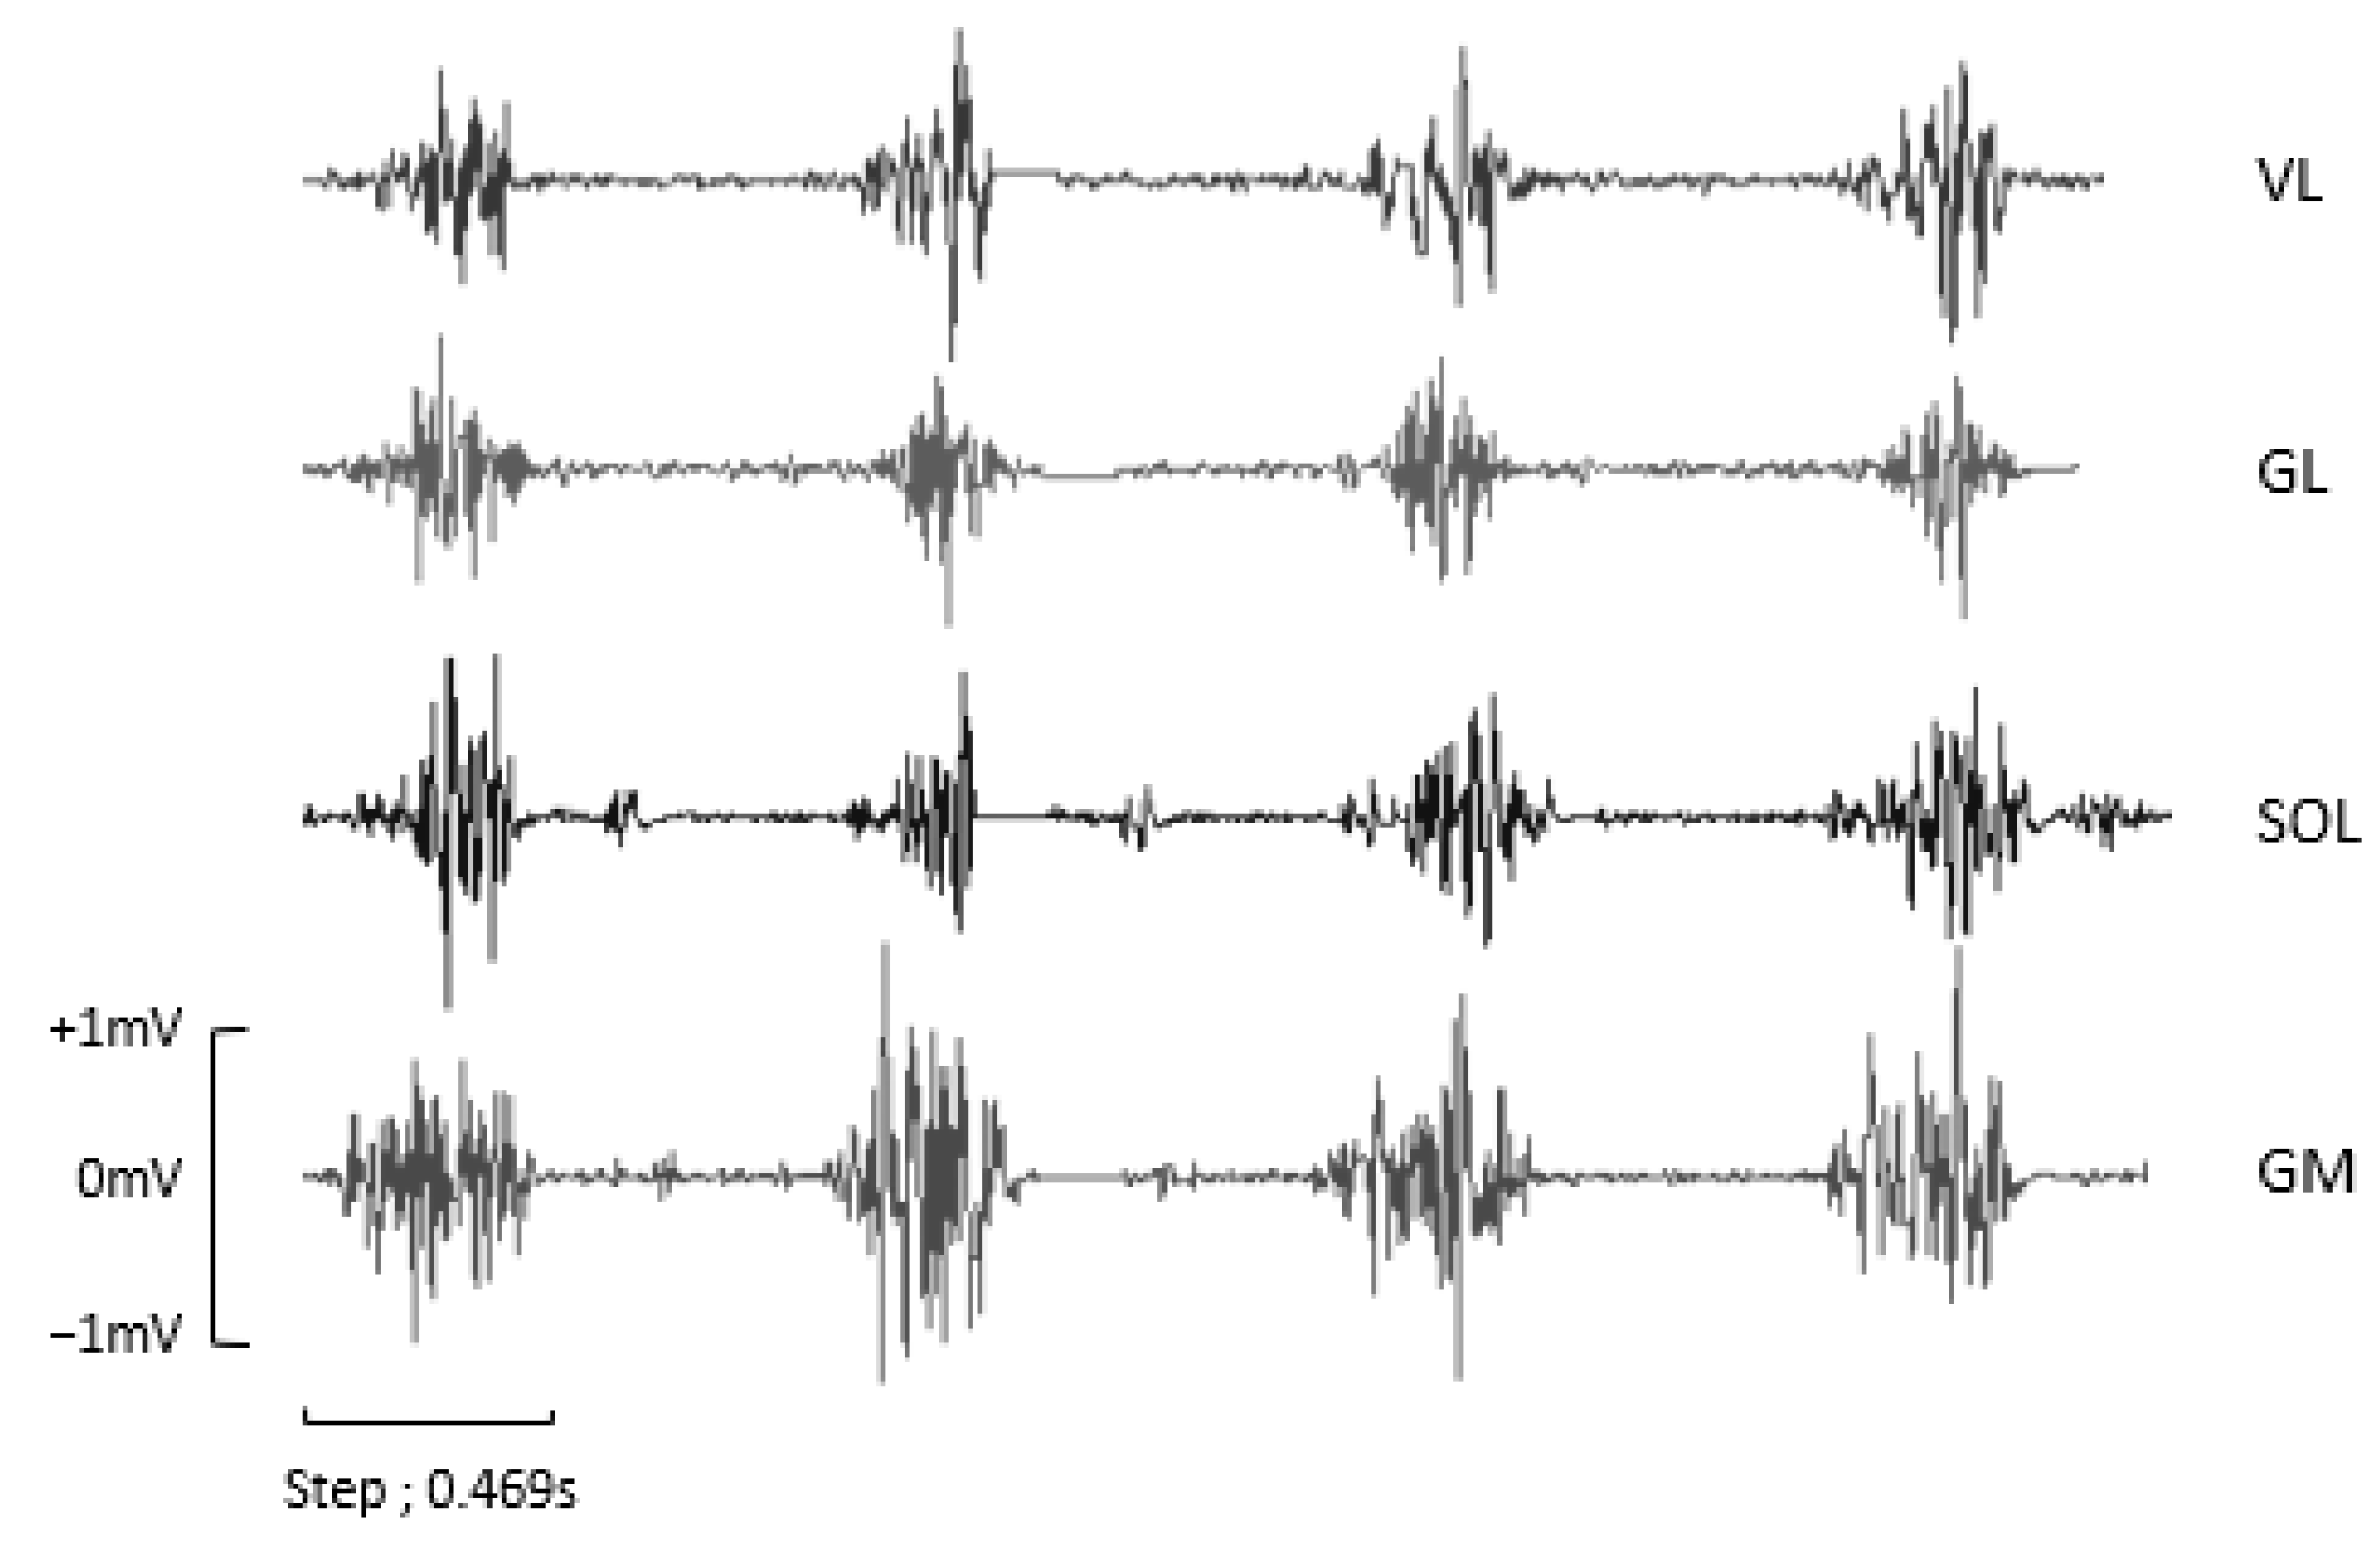
2.6. Electromyographic Activity
2.7. Statistical Analysis
3. Results
4. Discussion
5. Conclusions
Author Contributions
Funding
Institutional Review Board Statement
Informed Consent Statement
Data Availability Statement
Acknowledgments
Conflicts of Interest
References
- Green, B.; Pizzari, T. Calf muscle strain injuries in sport: A systematic review of risk factors for injury. Br. J. Sports Med. 2017, 51, 1189–1194. [Google Scholar] [CrossRef]
- Campbell, J.T. Posterior Calf Injury. Foot Ankle Clin. 2009, 14, 761–771. [Google Scholar] [CrossRef]
- Lantto, I.; Heikkinen, J.; Flinkkilä, T.; Ohtonen, P.; Leppilahti, J. Epidemiology of Achilles tendon ruptures: Increasing incidence over a 33-year period. Scand. J. Med. Sci. Sports 2015, 25, e133–e138. [Google Scholar] [CrossRef]
- Kubo, K.; Kanehisa, H.; Fukunaga, T. Effects of different duration isometric contractions on tendon elasticity in human quadriceps muscles. J. Physiol. 2001, 536, 649–655. [Google Scholar] [CrossRef]
- Rees, J.D.; Maffulli, N.; Cook, J. Management of tendinopathy. Am. J. Sports Med. 2009, 37, 1855–1867. [Google Scholar] [CrossRef]
- Lichtwark, G.A.; Wilson, A.M. Interactions between the human gastrocnemius muscle and the Achilles tendon during incline, level and decline locomotion. J. Exp. Biol. 2006, 209, 4379–4388. [Google Scholar] [CrossRef]
- Padulo, J.; Annino, G.; Migliaccio, G.M.; D’Ottavio, S.; Tihanyi, J. Kinematics of running at different slopes and speeds. J. Strength Cond. Res. 2012, 26, 1331–1339. [Google Scholar] [CrossRef]
- Abe, D.; Fukuoka, Y.; Muraki, S.; Yasukouchi, A.; Sakaguchi, Y.; Niihata, S. Effects of load and gradient on energy cost of running. J. Physiol. Anthropol. 2011, 30, 153–160. [Google Scholar] [CrossRef]
- Padulo, J.; Powell, D.; Milia, R.; Ardigò, L.P. A Paradigm of Uphill Running. PLoS ONE 2013, 8, 69006. [Google Scholar] [CrossRef]
- Järvinen, T.A.H.; Järvinen, T.L.; Kääriäinen, M.; Äärimaa, V.; Vaittinen, S.; Kalimo, H.; Järvinen, M. Muscle injuries: Optimising recovery. Best Pract. Res. Clin. Rheumatol. 2007, 21, 317–331. [Google Scholar] [CrossRef]
- Järvinen, M.J.; Lehto, M.U.K. The Effects of Early Mobilisation and Immobilisation on the Healing Process Following Muscle Injuries. Sports Med. 1993, 15, 78–89. [Google Scholar] [CrossRef] [PubMed]
- Barbeau, H.; Wainberg, M.; Finch, L. Description and application of a system for locomotor rehabilitation. Med. Biol. Eng. Comput. 1987, 25, 341–344. [Google Scholar] [CrossRef] [PubMed]
- Mehrholz, J.; Thomas, S.; Elsner, B. Treadmill training and body weight support for walking after stroke. Cochrane Database Syst. Rev. 2017, 2017. [Google Scholar] [CrossRef] [PubMed]
- Cherni, Y.; Begon, M.; Chababe, H.; Moissenet, F. Use of electromyography to optimize Lokomat® settings for subject-specific gait rehabilitation in post-stroke hemiparetic patients: A proof-of-concept study. Neurophysiol. Clin./Clin. Neurophysiol. 2017, 47, 293–299. [Google Scholar] [CrossRef]
- Gama, G.L.; Gama, G.L.; de Lucena Trigueiro, L.C.; Simão, C.R.; de Sousa, A.V.C.; Galvão, É.R.V.P.; Lindquist, A.R.R. Effects of treadmill inclination on hemiparetic gait: Controlled and randomized clinical trial. Am. J. Phys. Med. Rehabil. 2015, 94, 718–727. [Google Scholar] [CrossRef]
- Meyns, P.; van de Crommert, H.W.A.A.; Rijken, H.; van Kuppevelt, D.H.J.M.; Duysens, J. Locomotor training with body weight support in SCI: EMG improvement is more optimally expressed at a low testing speed. Spinal Cord 2014, 52, 887–893. [Google Scholar] [CrossRef]
- Fenuta, A.M.; Hicks, A.L. Muscle activation during body weight-supported locomotion while using the ZeroG. J. Rehabil. Res. Dev. 2014, 51, 51–58. [Google Scholar] [CrossRef]
- Atan, T.; Taşkiran, Ö.Ö.; Tokçaer, A.B.; Karataş, G.K.; Çalişkan, A.K.; Karaoğlan, B. Effects of different percentages of body weight-supported treadmill training in Parkinson’s disease: A double-blind randomized controlled trial. Turk. J. Med. Sci. 2019, 49, 999–1007. [Google Scholar] [CrossRef]
- Hreljac, A. Etiology, Prevention, and Early Intervention of Overuse Injuries in Runners: A Biomechanical Perspective. Phys. Med. Rehabil. Clin. N. Am. 2005, 16, 651–667. [Google Scholar] [CrossRef]
- Grabowski, A.M.; Kram, R. Effects of Velocity and Weight Support on Ground Reaction Forces and Metabolic Power during Running. J. Appl. Biomech. 2008, 24, 288–297. [Google Scholar] [CrossRef]
- Saxena, A.; Granot, A. Use of an Anti-gravity Treadmill in the Rehabilitation of the Operated Achilles Tendon: A Pilot Study. J. Foot Ankle Surg. 2011, 50, 558–561. [Google Scholar] [CrossRef] [PubMed]
- Luo, Y.; Shen, W.; Jiang, Z.; Sha, J. Treadmill training with partial body-weight support after anterior cruciate ligament reconstruction: A randomized controlled trial. J. Phys. Ther. Sci. 2016, 28, 3325. [Google Scholar] [CrossRef] [PubMed][Green Version]
- Johnson, A.W.; Eastman, C.S.; Feland, J.B.; Mitchell, U.H.; Mortensen, B.B.; Eggett, D. Effect of high-speed treadmill training with a body weight support system in a sport acceleration program with female soccer players. J. Strength Cond. Res. 2013, 27, 1496–1502. [Google Scholar] [CrossRef] [PubMed]
- Liebenberg, J.; Scharf, J.; Forrest, D.; Dufek, J.S.; Masumoto, K.; Mercer, J.A. Determination of muscle activity during running at reduced body weight. J. Sports Sci. 2011, 29, 207–214. [Google Scholar] [CrossRef]
- Mun, K.R.; Lim, S.B.; Guo, Z.; Yu, H. Biomechanical effects of body weight support with a novel robotic walker for over-ground gait rehabilitation. Med. Biol. Eng. Comput. 2016, 55, 315–326. [Google Scholar] [CrossRef] [PubMed]
- Wagner, M.; Dames, K.D. Making the Grade: An Exploration of Incline Running on a Bodyweight-Supportive Treadmill. J Sport Rehabil. 2021, 30, 894–898. [Google Scholar] [CrossRef]
- Swinnen, E.; Baeyens, J.P.; Pintens, S.; Van Nieuwenhoven, J.; Ilsbroukx, S.; Clijsen, R.; Buyl, R.; Goossens, M.; Meeusen, R.; Kerckhofs, E. Trunk muscle activity during walking in persons with multiple sclerosis: The influence of body weight support. NeuroRehabilitation 2014, 34, 323–335. [Google Scholar] [CrossRef]
- Thomson, A.; Whiteley, R.; Hansen, C.; Welzel, J.; Racinais, S.; Wilson, M.G. Effect of speed and gradient on plantar force when running on an AlterG® treadmill. BMC Sports Sci. Med. Rehabil. 2021, 13, 34. [Google Scholar] [CrossRef]
- Fischer, A.G.; Wolf, A. Assessment of the effects of body weight unloading on overground gait biomechanical parameters. Clin. Biomech. 2015, 30, 454–461. [Google Scholar] [CrossRef]
- Minetti, A.E.; Ardigò, L.P.; Saibene, F. Mechanical determinants of the minimum energy cost of gradient running in humans. J. Exp. Biol. 1994, 195, 211–225. [Google Scholar] [CrossRef]
- Telhan, G.; Franz, J.R.; Dicharry, J.; Wilder, R.P.; Riley, P.O.; Kerrigan, D.C. Lower Limb Joint Kinetics During Moderately Sloped Running. J. Athl. Train. 2010, 45, 16. [Google Scholar] [CrossRef] [PubMed]
- Vernillo, G.; Martinez, A.; Baggaley, M.; Khassetarash, A.; Giandolini, M.; Horvais, N.; Edwards, W.B.; Millet, G.Y. Biomechanics of graded running: Part I—Stride parameters, external forces, muscle activations. Scand. J. Med. Sci. Sports 2020, 30, 1632–1641. [Google Scholar] [CrossRef]
- Ridard, J.; Rozand, V.; Millet, G.Y.; Lapole, T. On-field low-frequency fatigue measurement after repeated drop jumps. Front. Physiol. 2022, 13, 1039616. [Google Scholar] [CrossRef] [PubMed]
- Barbero, M.; Merletti, R.; Rainoldi, A. Atlas of Muscle Innervation Zones; Springer: Milano, Italy, 2012. [Google Scholar] [CrossRef]
- Nuckols, R.W.; Takahashi, K.Z.; Farris, D.J.; Mizrachi, S.; Riemer, R.; Sawicki, G.S. Mechanics of walking and running up and downhill: A joint-level perspective to guide design of lower-limb exoskeletons. PLoS ONE 2020, 15, e0231996. [Google Scholar] [CrossRef]
- Neptune, R.R.; Kautz, S.A.; Zajac, F.E. Contributions of the individual ankle plantar flexors to support, forward progression and swing initiation during walking. J. Biomech. 2001, 34, 1387–1398. [Google Scholar] [CrossRef] [PubMed]
- Sainton, P.; Nicol, C.; Cabri, J.; Barthelemy-Montfort, J.; Berton, E.; Chavet, P. Influence of short-term unweighing and reloading on running kinetics and muscle activity. Eur. J. Appl. Physiol. 2015, 115, 1135–1145. [Google Scholar] [CrossRef]
- Fukunaga, T.; Kubo, K.; Kawakami, Y.; Fukashiro, S.; Kanehisa, H.; Maganaris, C.N. In vivo behaviour of human muscle tendon during walking. Proc. R. Soc. B Biol. Sci. 2001, 268, 229. [Google Scholar] [CrossRef]
- Yokozawa, T.; Fujii, N.; Ae, M. Muscle activities of the lower limb during level and uphill running. J. Biomech. 2007, 40, 3467–3475. [Google Scholar] [CrossRef] [PubMed]
- Roberts, T.J.; Belliveau, R.A. Sources of mechanical power for uphill running in humans. J. Exp. Biol. 2005, 208, 1963–1970. [Google Scholar] [CrossRef]
- Wall-Scheffler, C.M.; Chumanov, E.; Steudel-Numbers, K.; Heiderscheit, B. EMG activity across gait and incline: The impact of muscular activity on human morphology. Am. J. Phys. Anthropol. 2010, 143, 601. [Google Scholar] [CrossRef]
- Heidi, R.; Thomas, S.; Armando, R.V.; Hargens, A.R. Oxygen consumption during walking and running under fractional weight bearing conditions. Aviat. Space Environ. Med. 2010, 81, 550–554. [Google Scholar] [CrossRef]
- Hoffman, M.D.; Donaghe, H.E. Physiological responses to body weight-supported treadmill exercise in healthy adults. Arch. Phys. Med. Rehabil. 2011, 92, 960–966. [Google Scholar] [CrossRef]
- Barnes, K.R.; Janecke, J.N. Physiological and Biomechanical Responses of Highly Trained Distance Runners to Lower-Body Positive Pressure Treadmill Running. Sports Med. Open 2017, 3, 41. [Google Scholar] [CrossRef] [PubMed]
- Raffalt, P.C.; Hovgaard-Hansen, L.; Jensen, B.R. Running on a lower-body positive pressure treadmill: VO2max, respiratory response, and vertical ground reaction force. Res. Q. Exerc. Sport 2013, 84, 213–222. [Google Scholar] [CrossRef] [PubMed]
- Dewolf, A.H.; Peñailillo, L.E.; Willems, P.A. The rebound of the body during uphill and downhill running at different speeds. J. Exp. Biol. 2016, 219, 2276–2288. [Google Scholar] [CrossRef] [PubMed]
- Okudaira, M.; Willwacher, S.; Kawama, R.; Ota, K.; Tanigawa, S. Sprinting kinematics and inter-limb coordination patterns at varying slope inclinations. J. Sports Sci. 2021, 39, 2444–2453. [Google Scholar] [CrossRef] [PubMed]


| IR0BWS0 | IR7BWS0 | IR7BWS15 | IR7BWS30 | |
|---|---|---|---|---|
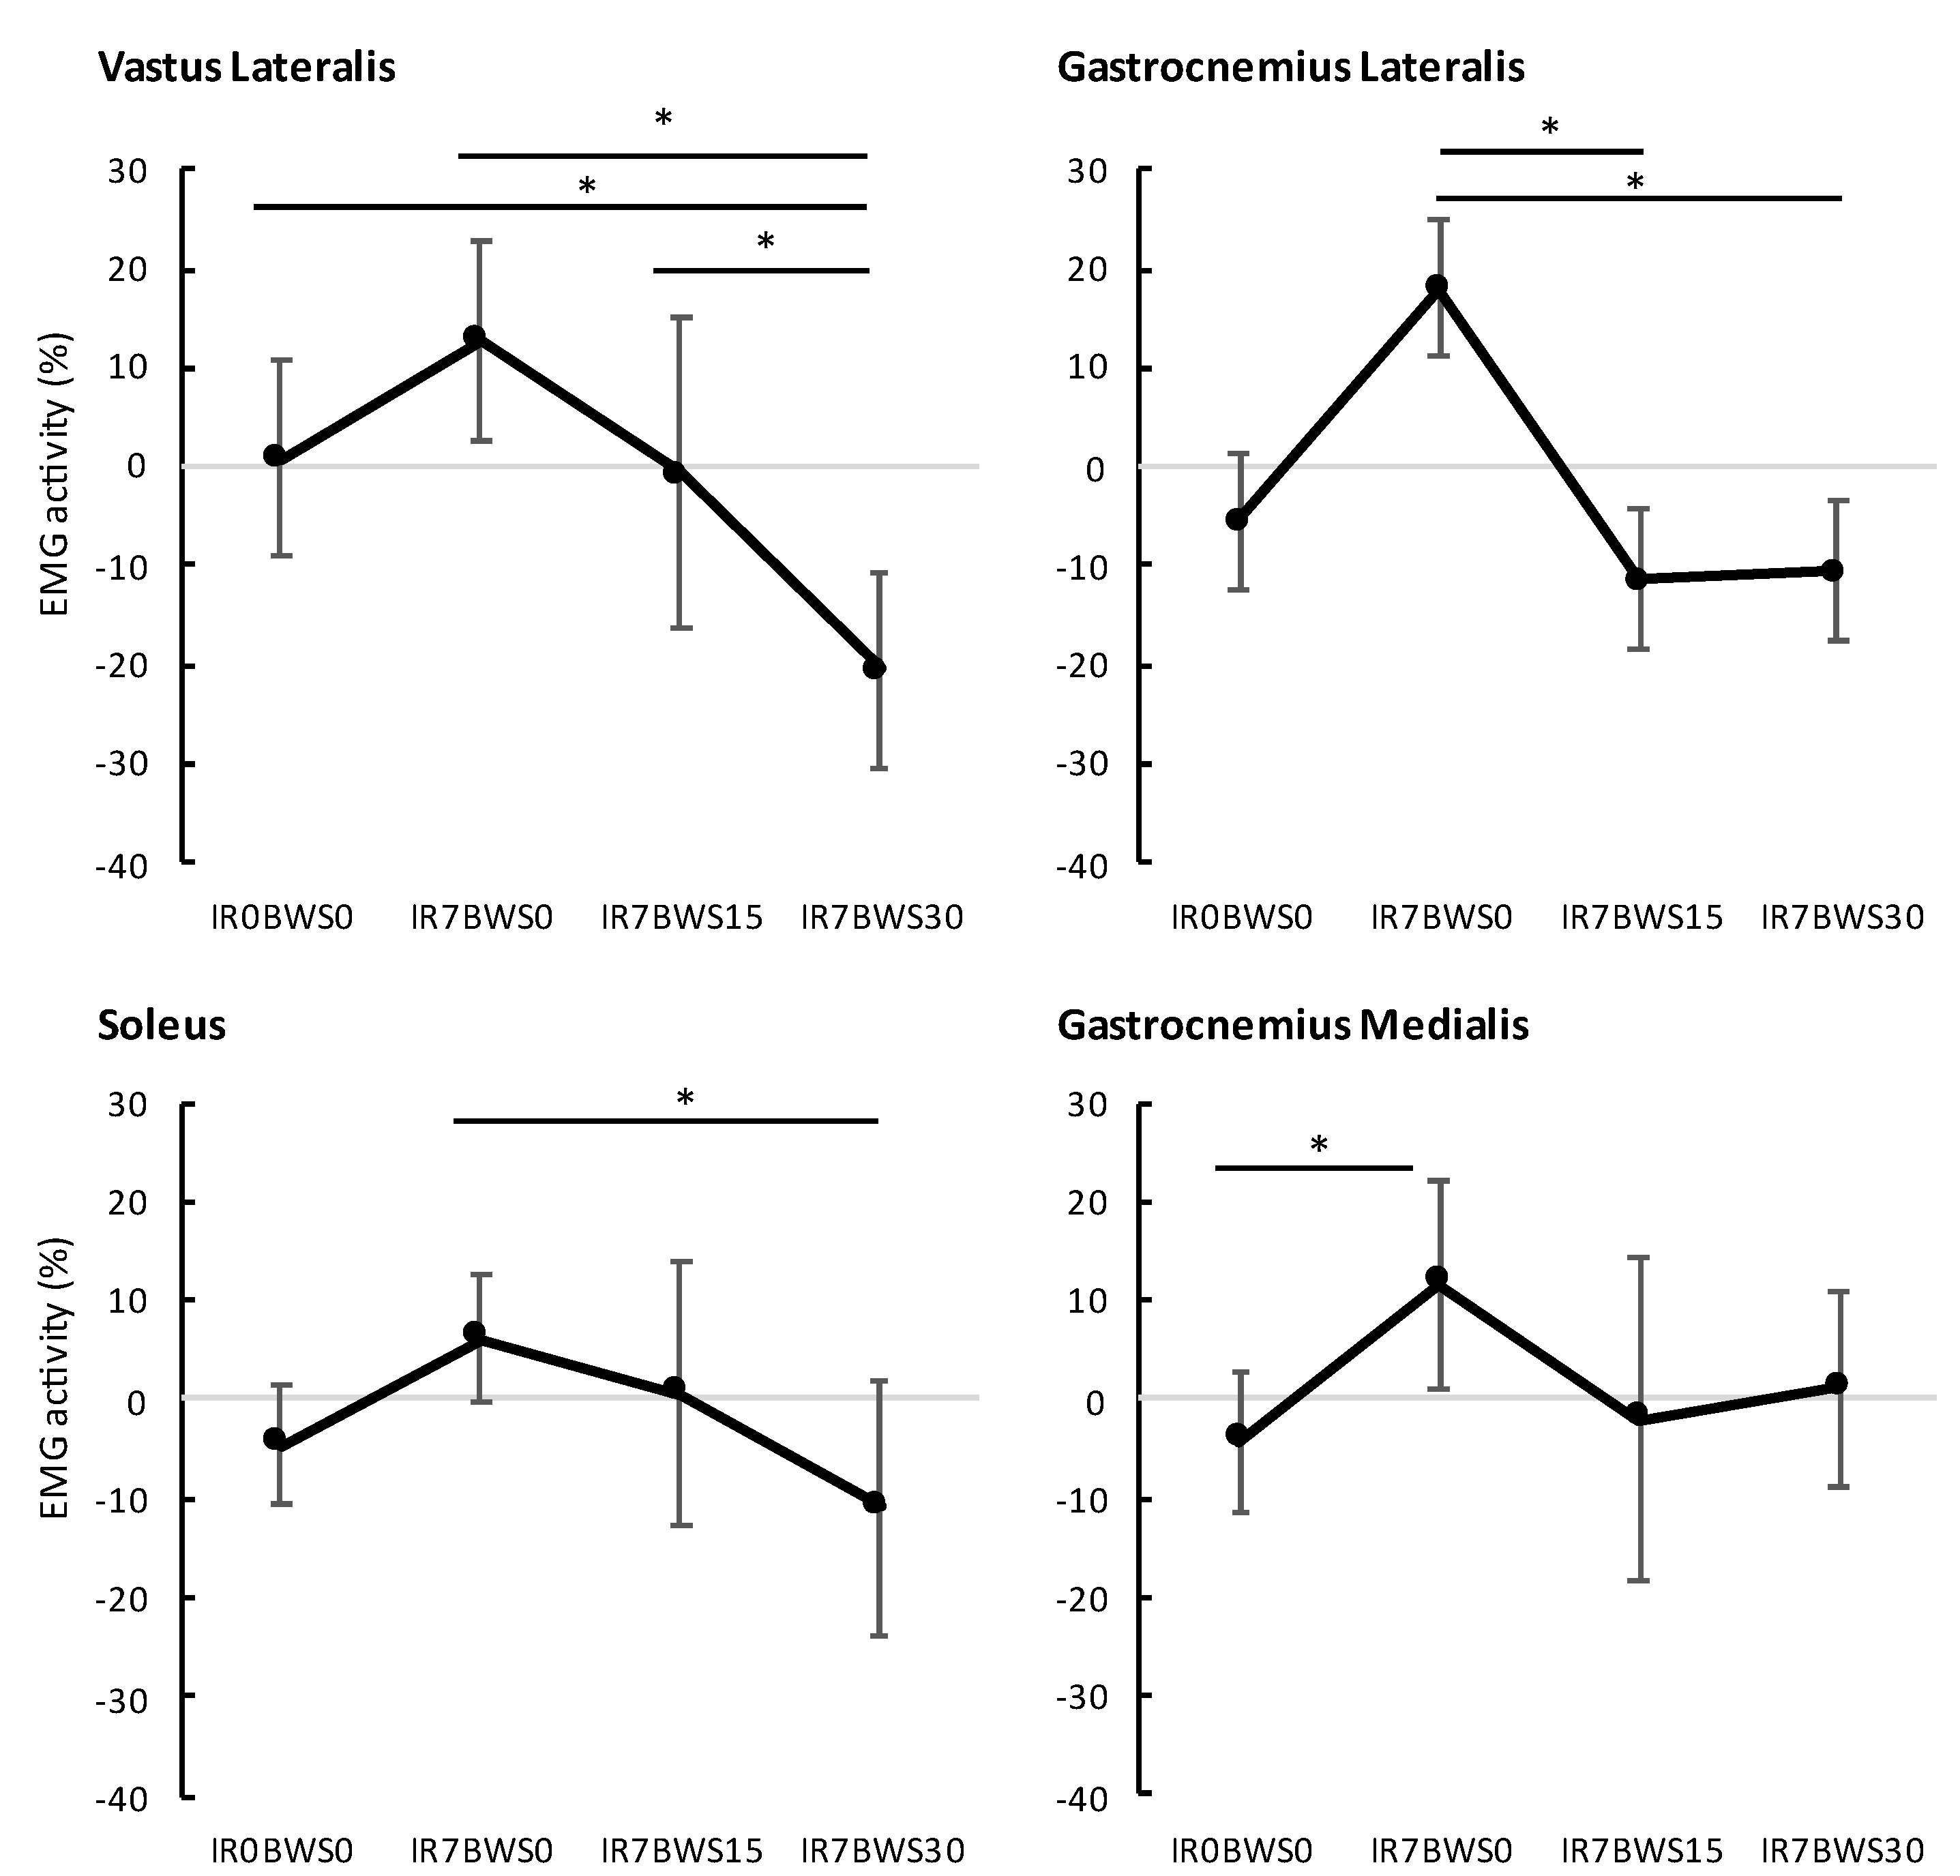
| VL | 0.8% | 12.9% | −0.6% | −20.5% |
| GL | −5.5% | 18.1% | −11.3% | −10.5% |
| SOL | −4.6% | 6.2% | 0.6% | −10.8% |
| GM | −4.3% | 11.7% | −2.1% | 1.1% |
| PRE | POST | Difference | |
|---|---|---|---|
| Mean ± SD | Mean ± SD | Mean ± SD | |
| IR0BWS0 | 75.1 ± 6.7 | 73.3 ± 8.8 | 1.8 ± 3.5 |
| IR7BWS0 | 75.8 ± 8.0 | 71.6 ± 9.8 | 4.1 ± 3.5 |
| IR7BWS15 | 73.5 ± 8.4 | 71.8± 8.6 | 1.7 ± 4.4 |
| IR7BWS30 | 74.0 ± 7.1 | 72.8 ± 6.5 | 1.2 ± 1.7 |
| Contact Time | Flight Duration | Step Frequency | |
|---|---|---|---|
| Condition | 0.306 | 0.001 * | 0.107 |
| Time | 0.344 | 0.208 | 0.641 |
| Interaction | 0.618 | 0.911 | 0.594 |
| Flight Time | Contact Time | Step Frequency | |
|---|---|---|---|
| Mean ± SD | Mean ± SD | Mean ± SD | |
| IR0BWS0 | 47 ± 1.3 *b | 338 ± 29 | 156 ± 9 |
| IR7BWS0 | 35 ± 1.2 *a,d | 340 ± 44 | 161 ± 14 |
| IR7BWS15 | 38 ± 1.3 | 340 ± 36 | 159 ± 12 |
| IR7BWS30 | 47 ± 1.7 *b | 336 ± 27 | 155 ± 9 |
| p < 0.006 | p > 0.05 | p > 0.05 |
Disclaimer/Publisher’s Note: The statements, opinions and data contained in all publications are solely those of the individual author(s) and contributor(s) and not of MDPI and/or the editor(s). MDPI and/or the editor(s) disclaim responsibility for any injury to people or property resulting from any ideas, methods, instructions or products referred to in the content. |
© 2023 by the authors. Licensee MDPI, Basel, Switzerland. This article is an open access article distributed under the terms and conditions of the Creative Commons Attribution (CC BY) license (https://creativecommons.org/licenses/by/4.0/).
Share and Cite
Timbert, T.; Babault, N.; Methenitis, S.; Cometti, C.; Amiez, N.; Paizis, C. The Effect of Bodyweight Support and Incline Running on Triceps Surae Electromyographic Activity. Appl. Sci. 2023, 13, 9620. https://doi.org/10.3390/app13179620
Timbert T, Babault N, Methenitis S, Cometti C, Amiez N, Paizis C. The Effect of Bodyweight Support and Incline Running on Triceps Surae Electromyographic Activity. Applied Sciences. 2023; 13(17):9620. https://doi.org/10.3390/app13179620
Chicago/Turabian StyleTimbert, Tom, Nicolas Babault, Spyridon Methenitis, Carole Cometti, Nicolas Amiez, and Christos Paizis. 2023. "The Effect of Bodyweight Support and Incline Running on Triceps Surae Electromyographic Activity" Applied Sciences 13, no. 17: 9620. https://doi.org/10.3390/app13179620
APA StyleTimbert, T., Babault, N., Methenitis, S., Cometti, C., Amiez, N., & Paizis, C. (2023). The Effect of Bodyweight Support and Incline Running on Triceps Surae Electromyographic Activity. Applied Sciences, 13(17), 9620. https://doi.org/10.3390/app13179620