Abstract
This paper presents a study of magnetoelectric (ME) properties of the PZT/Terfenol-D composite with a varying number of layers. The composite consists of piezoelectric and magnetostrictive phases that are mechanically coupled. The purpose of this setup is to gain control over the electric polarization of a material via an external magnetic field. Unlike most similar composites, our samples utilize a commercial piezoelectric patch instead of pure PZT. At present, researchers face two main problems regarding magnetoelectric materials: (i) the effect is observed far below room temperature for single-phase materials, and (ii) the ME coupling is too weak to be commercially viable. Our research was carried out via the lock-in technique on two PZT/Terfenol-D samples we synthesized. Relatively strong room-temperature magnetoelectric coupling between piezoelectric and magnetostrictive phases was observed for both samples. Two types of characteristics were investigated: (i) ME voltage versus magnetic AC field frequency, and (ii) ME voltage versus magnetic DC field. We detected multiple, grouped signal peaks ascribed to different resonance modes. Uniquely, the peaks form band-like characteristics which might be an important step in bringing the materials closer to wider commercial use.
1. Introduction
Materials with magnetoelectric (ME) coupling have numerous applications and can be utilized as components of electronic and spintronic devices, e.g., transducers, logic gates, and nonvolatile memory. As far as commercial applications are concerned, possible fields of interest include metrology (AC magnetic field sensors), renewable energy engineering (photovoltaics and energy harvesting), computer science, and medicine (drug delivery methods) [1,2]. Currently, the main research goal of many scientific groups in the world is to obtain materials with strong, room-temperature ME effect [2,3,4].
The ME effect is a coupling between the magnetic and ferroelectric order of a material. In the presence of an external magnetic field, such a material becomes electrically polarized. Conversely, an external electric field results in material magnetization [2,3]. The linear ME effect is observed when the field intensity and material property change proportionally. The coupling strength (material response to external stimulus) is then denoted by the linear ME coupling coefficient α [4,5]. In the simplest terms, the magnetoelectric coupling coefficient can be approximated by the formula:
where UOUT denotes the voltage generated across the sample due to magnetoelectric coupling, HAC is the amplitude of the sinusoidal magnetic field, and d is the thickness of the sample.
Materials exhibiting magnetoelectric coupling can be divided into two groups, i.e., (i) multiferroics in which ME is due to the long-range ordering of magnetic moments and electric dipoles, and (ii) composites where ME is the result of magnetostrictive and piezoelectric properties of the components. The search for single-phase multiferroics with a high magnetoelectric coupling coefficient is still ongoing. However, their number is restricted by symmetry laws imposed by Neumann’s principle [5,6]. Additionally, the coexistence of ferroelectric and magnetic order in one phase is mutually exclusive and depends on a number of phenomena (e.g., lone-pair mechanism, geometric ferroelectricity, inverse Dzyaloshinskii–Moriya interaction) [3,7,8]. Ultimately, the key argument against single-phase materials is that the ME effect is generally weak and observable under cryogenic conditions [3,8]. On the other hand, composite materials can be readily produced by joining two ferroic phases, e.g., piezoelectric and magnetostrictive, which are mechanically coupled [3,5,9]. The piezoelectric effect was proven in 1880 by Pierre and Jacques Curie and is caused by the relocation of electric charges under mechanical deformation of the material (direct effect). Magnetostriction is a physical phenomenon defined as a change in material dimensions in one or many directions under the influence of the magnetic field (direct effect discovered by James P. Joule in 1842). Both phenomena can occur in the opposite way. Specifically, when the voltage is applied to the piezoelectric material, it causes its strain (inverse piezoelectric effect, discovered in 1881 by Gabriel Lippman, also named electrostriction). In the case of the inverse magnetostriction effect, i.e., Villari effect or magnetoelastic effect (proven in 1865 by Emilio Villari), the change in the magnetization (magnetic susceptibility) of the material occurs as a result of mechanical deformation. The ME coupling in composites is not limited to low temperatures. Furthermore, the effect can be several orders of magnitude larger in comparison to that in single-phase materials. The coupling coefficient α reaches values from a few to several tens of mVcm−1 Oe−1 in single-phase multiferroics [10], while in composites/laminates it can be up to hundreds of Vcm−1 Oe−1, especially in resonance state [5,11].
Regardless of whether the material is a single-phase multiferroic or a piezoelectric-magnetostrictive composite, it is difficult to obtain a proper ME material due to several persistent challenges. Firstly, the ME effect must be sufficiently strong and easy to manipulate. Secondly, there is an issue of measurement methods used in investigations. The methods can be divided into qualitative (indirect, detection of the ME effect) and quantitative (direct, numerical representation of the coupling strength). The qualitative methods only confirm the existence of the coupling and do not provide any numerical information. On the other hand, most known direct methods require elaborate equipment and do not yield reproducible results. A review of existing measurement techniques can be found in [1].
In the present work, attention is focused on the selected composite material, i.e., multilayered PZT/Terfenol-D. This composite was chosen because PZT and Terfenol-D have among the strongest piezoelectric and magnetostrictive properties, respectively. Its simple synthesis, availability of materials, and reportedly large ME coupling coefficient are behind its unwaning popularity [9,12,13]. In this composite, the magnetic field generates strain via the direct effect of magnetostriction of Terfenol-D. Next, the strain is transferred to the PZT material and, due to the piezoelectric effect, an electric voltage appears at the edges of the sample. Since the composite components are mechanically coupled, the resonance state additionally occurs. As a result, the magnetoelectric coupling effect can be several orders of magnitude larger in comparison to that in single-phase materials or particulate composites. Most conventionally synthesized PZT-based composites exhibit single-frequency resonance characteristics, which makes the materials less useful as active components in magnetoelectric devices. In order to overcome this drawback, some authors have obtained the multiple resonance modes [14,15] or band-like resonance characteristics [16] by creating complex mechanical structures. The goal of our studies was to synthesize and determine magnetoelectric properties of the multilayered PZT/Terfenol-D material. We aimed to achieve multi-frequency response by applying a piezoelectric patch instead of pure PZT. Our samples were investigated via the lock-in technique under different conditions (variable DC magnetic field intensity and AC magnetic field frequency). Particular emphasis was placed on examining properties in the resonance state.
2. Materials and Methods
2.1. Magnetostrictive Material
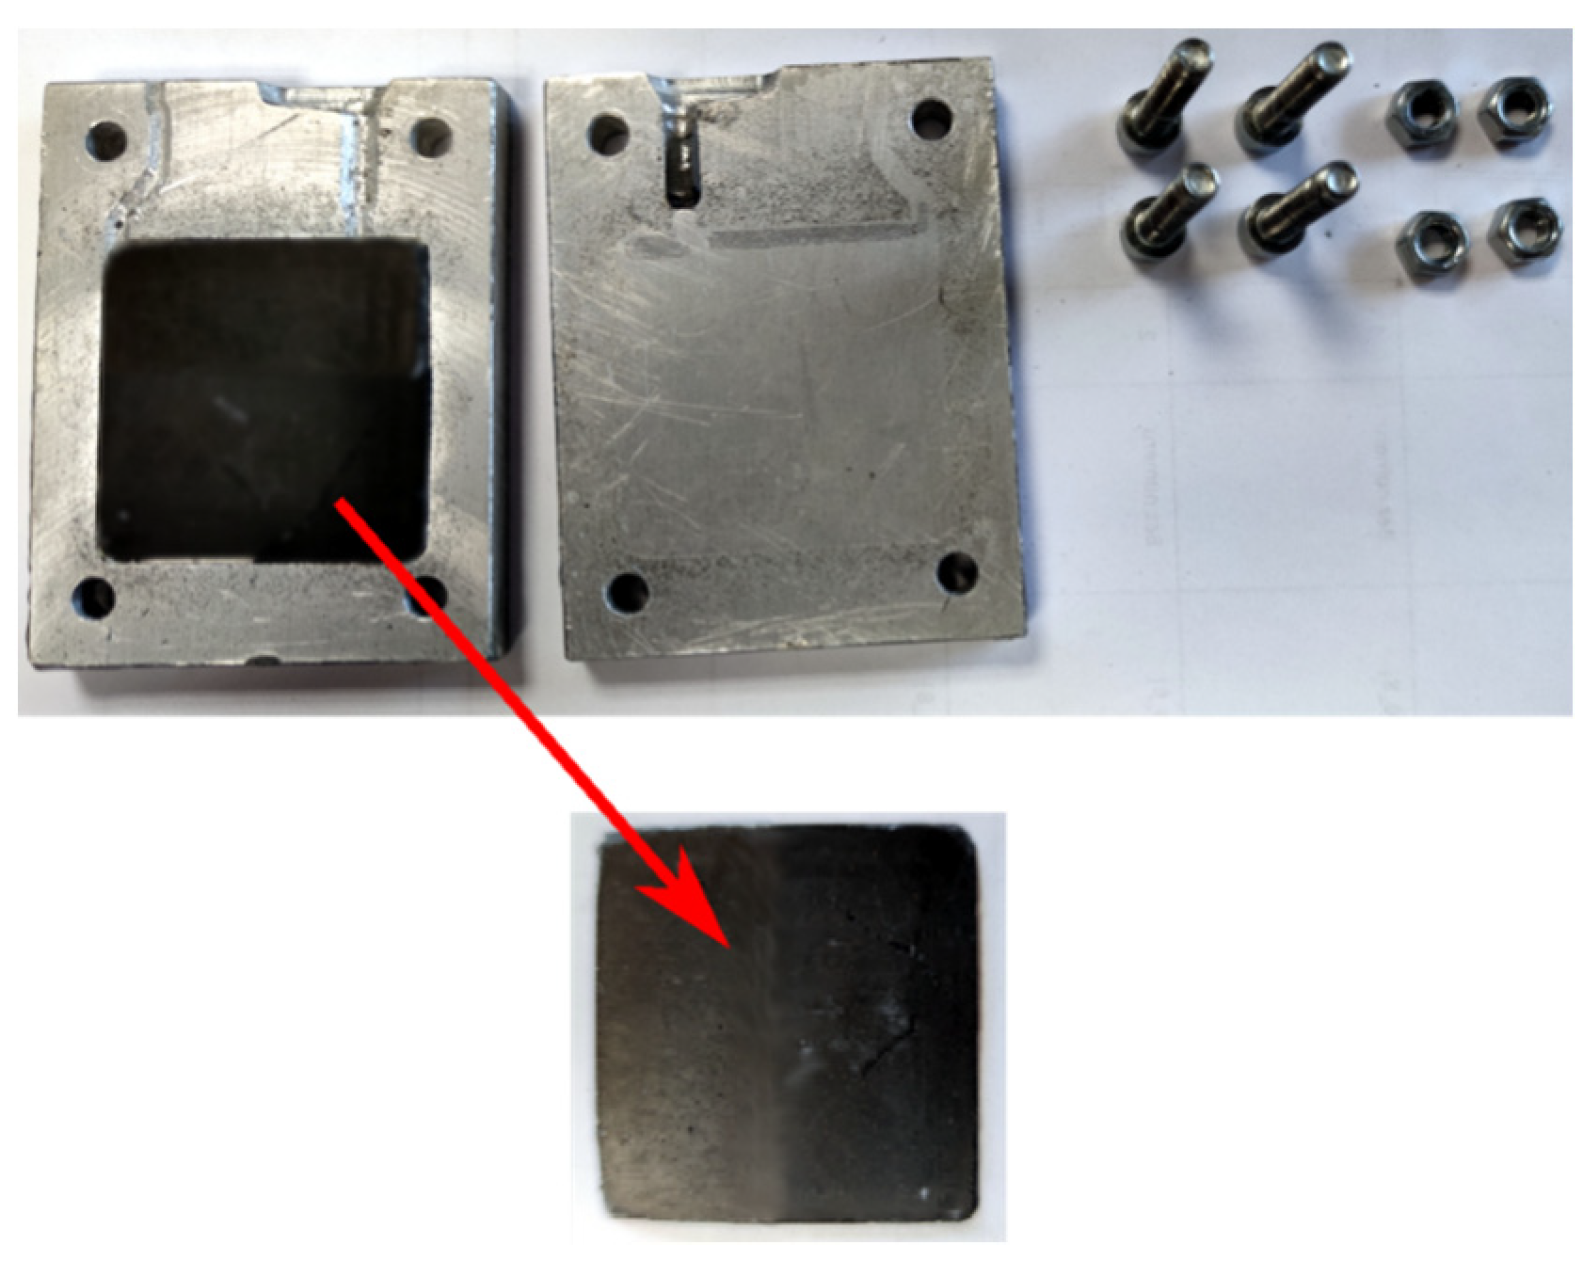
The magnetostrictive part of the composite was specially prepared by combining the epoxy resin and the powder of Tb0.3Dy0.7Fe1.92 alloy, commercially known as Terfenol-D (from TdVib, LLC, Boone, IA, USA). The particle size of the powder was in the range of 5–300 µm. First, the epoxy resin Araldite LY1564 was mixed with the curing agent Aradur 3474 (both were from Huntsman Advanced Materials). Next, the appropriate amount of Terfenol-D powder was added. To prepare the magnetostrictive material, all components were mixed until proper homogenization of the resin and dispersion of the powder in it. The prepared mixture was poured into the form (Figure 1) where it set. After 24 h, the fully cured sample was removed from the form. The dimension of the magnetostrictive material was 50 mm × 50 mm with a thickness of 1 mm.

Figure 1.
Image of the form with manufactured magnetostrictive material.
2.2. Piezoelectric Material
The second part of the composite was made of PZT, lead zirconate titanate, a ceramic perovskite material with the chemical formula Pb[ZrxTi1−x]O3 (0 ≤ x ≤ 1). At present, there are a large number of materials that exhibit the piezoelectric effect; however, most of them are brittle and expensive. In the present paper, PZT oxide ceramic, which exhibits one of the highest piezoelectric coefficients [17], was chosen for the investigations. The material is the commercially available P1-type Micro Fiber Composite (MFC) patch supplied by Smart Material Corporation. Based on the producer information, this type of material is made up of PZT-5 microfibers (130 × 150 μm2), encased between two Kevlar/Kapton sheets and polarized along their length. The P1 type of MFC utilizes the d33 effect for actuation and elongates up to 1800 ppm if operated at the maximum voltage rate of −500 V to +1500 V [18]. A piece of P1 MFC patch serves as a reference sample R in further measurements.
2.3. Magnetoelectric Composite
In order to obtain strong magnetoelectric coupling, we chose the materials with significant magnetostrictive (Terfenol-D) and piezoelectric (PZT) properties. To prepare the magnetoelectric composite, the piezoelectric patch and above-mentioned magnetostrictive material were cut into rectangles with dimensions 15 mm × 10 mm. Both components were joined together in the form of a sandwich with X60 two-component glue (HBK—Hottinger, Brüel&Kjær). We made samples with one and three layers of Terfenol-D, marked as sample S1 and sample S2, respectively. The structure of the prepared sample S2 is shown in Figure 2.
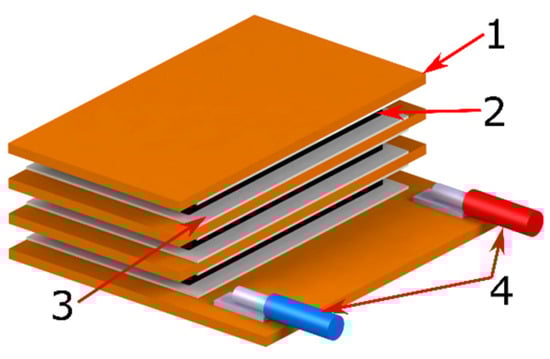
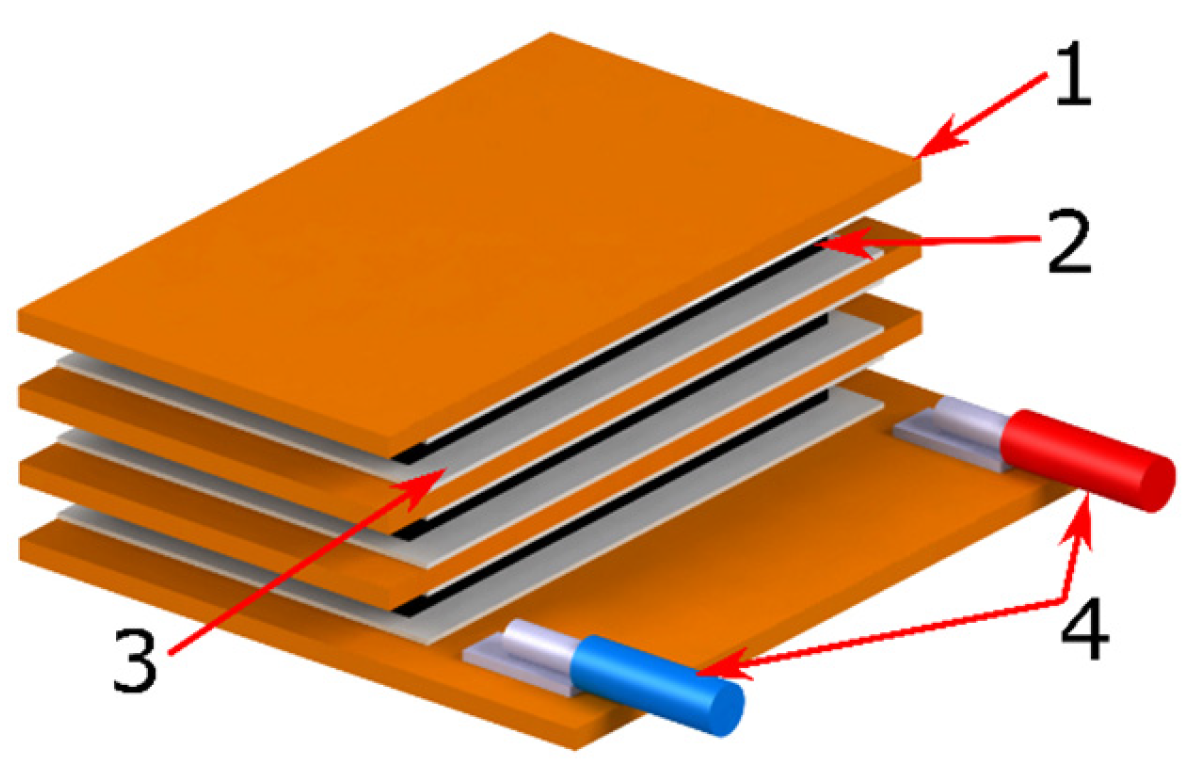
Figure 2.
Model of the prepared magnetoelectric composite with three layers of Terfenol-D (sample S2), where: 1—sheet of a piezoelectric patch, 2—magnetostrictive material (black color), 3—a layer of the X60 glue (gray color), 4—signal wiring.
The magnetoelectric composites in our study follow the concept of product properties originally proposed by van Suchtelen [19]. As described in the introduction, an effect (magnetostriction) occurring in one phase stimulates a different effect (piezoelectricity) in another phase. Thus, we obtain control over electric polarization via the external magnetic field.
2.4. The Lock-In Technique
Magnetoelectric properties of the samples were investigated with the lock-in technique. The technique, also known as the dynamic method, involves exposing a sample to a DC magnetic field with a superimposed AC magnetic field generated by a pair of Helmholtz coils with the sample inside. The voltage induced across the sample is measured with a lock-in amplifier attuned to the frequency of the AC field. Importantly, the sample should be shielded from electromagnetic interference. The magnetoelectric coupling coefficient α can then be calculated from Equation (1). It should be noted that the coupling linearity in this type of measurement is an acceptable approximation. In fact, the measured quantity is the pseudo-linear ME coupling coefficient. The relation between an external field (e.g., magnetic field) and material property (e.g., polarization) depends on several factors, such as composite phase (piezomagnetic/magnetostriction coupling coefficient), strain direction, layer thickness ratio, and magnetic field type. The DC bias is usually required; however, it may influence the linearity of the final ME signal due to higher-order coupling effects [4,20,21]. The experimental setup is shown in Figure 3.
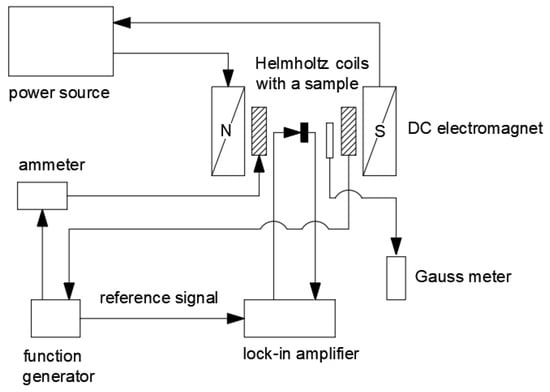
Figure 3.
The lock-in technique experimental setup.
The lock-in amplifier is the key component of the setup. The device is useful in detection and tracking of weak, noisy AC signals. The principle of operation is based on the phase-sensitive detection (PSD). In essence, the amplifier continuously compares the input signal with the external reference signal (used to stimulate the experiment). The signals are said to be phase-locked, so that their frequencies match and the phase difference remains constant. Once the AC input signal from the sample is amplified and passes through a specifically tuned band pass filter, it is multiplied by the reference signal. The resultant signal passes through a low-pass filter which removes the remaining AC components. The DC output signal is proportional to the input and its value can be taken from the device’s front display.
The SR830 DSP lock-in amplifier working in the differential mode was utilized in our experiment. All measurements were carried out at room temperature. Two types of measurement were performed in the present study: (i) magnetoelectric voltage depending on AC field frequency and characteristic UOUT(f) in various DC fields, and (ii) the measurements of magnetoelectric voltage versus DC magnetic field, UOUT(HDC), for selected frequencies. The multilayered PZT/Terfenol-D composite samples were placed inside a pair of Helmholtz coils, between the poles of the DC magnet. To generate the required DC magnetic field, two types of magnets were used. An electromagnet with a fixed gap was employed in the low-field region (up to 0.13 T). In the high-field region (0.3–0.5 T), the samples were examined inside a permanent magnet with a variable gap. The samples were oriented with their flat surface perpendicular to the magnetic field lines. The AC magnetic field was monitored with an ammeter and, based on previous coil calibration, 4 Oe was set throughout all experiments. The DC field was measured with a Gaussmeter. Additionally, the reference characteristics on a sheet of piezoelectric patch (reference sample R) were registered for both types of measurement.
3. Results and Discussion
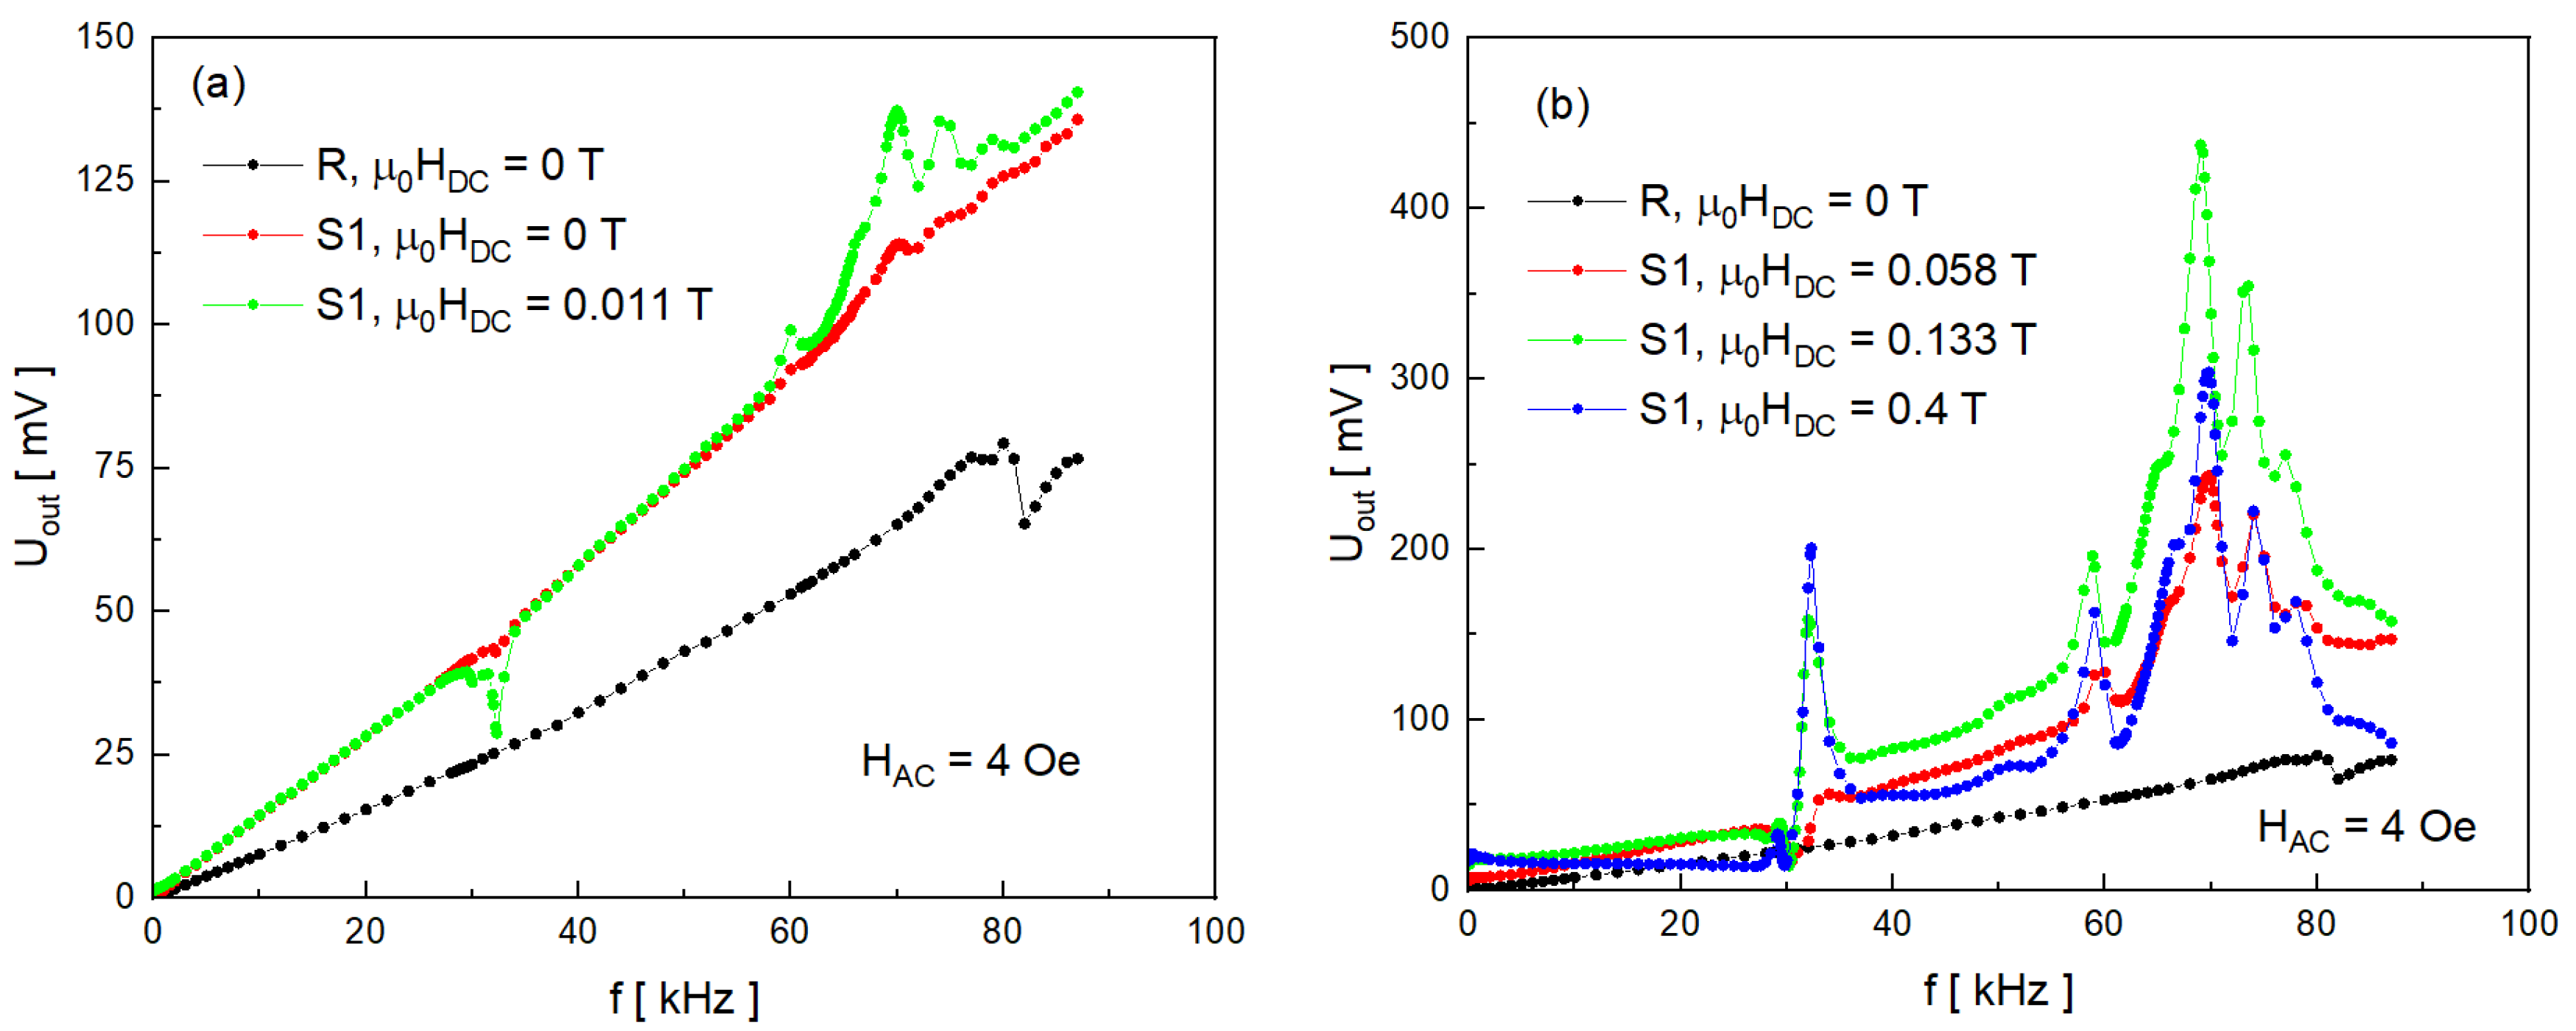
The results of UOUT(f) measurements for sample S1 together with the reference sample R are presented in Figure 4. Measurements were conducted in the frequency range of 0 kHz to 84 kHz. Samples were exposed to DC magnetic field of different intensities: 0, 0.011, 0.058, 0.133, and 0.4 T.
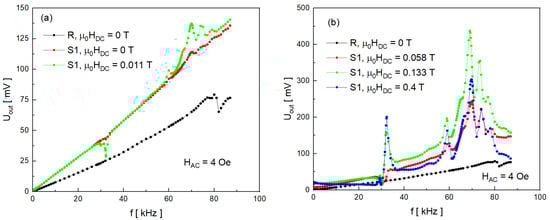
Figure 4.
Magnetoelectric voltage versus AC magnetic field frequency characteristics for sample S1 and reference R: (a) for DC field in the range of 0–0.011 T; (b) for DC field between 0.058 and 0.4 T.
One can readily observe a few general features. Firstly, all characteristics are inclined relative to the horizontal axis (unlike in, e.g., [12,13,22,23,24,25,26], where the characteristics are rather flat). This slope, or base, of the obtained characteristics is associated with Faraday electromagnetic induction as proven by the measurement of the reference sample. The value of recorded voltage on the R sample increases steadily with increasing frequency and has an approximately linear character. Since the sample S1 contains more than one piezoelectric sheet, the Faraday induction contribution is larger. Secondly, the low-frequency (kHz range) resonance state occurs at different frequencies which is observed as resonant peaks in the characteristics. It may be stated that the reference sample does not undergo resonance (the small anomaly around 82 kHz may be connected with the specific structure of the piezoelectric patch). However, numerous resonant peaks are observed for the sample S1. For each value of the DC field, between five and seven resonant peaks may be seen (e.g., for 0.133 T resonance takes place at fres = 32, 58.8, 65.5, 69.2, 73.5, and 77 kHz). All peaks for various DC fields occur at approximately the same frequencies. In comparison to the data published for composites, in which the authors observe one or two separated peaks [12,13,22,23,27,28,29,30], we detect multiple, overlapping resonant peaks (60–80 kHz range). The existence of resonant peaks shown in Figure 4 may be explained by the structure of the S1 composite. The sample consists of mechanically coupled layers and, like all mechanical systems, has its own resonance modes. In general, the resonance state in composite materials is associated with bending, longitudinal, radial, and thickness acoustic modes [12]. Based on criteria such as frequency range, material constituents, and theoretical models found in the literature, it can be inferred that the resonance state observed in our study is due to bending and longitudinal modes. It should be pointed out that the number, nature, and frequency of resonant peaks also depend on mechanical boundary conditions (i.e., whether the sample ends are free or fixed) [22,26,30]. As may be observed from Figure 4, the values of magnetoelectric voltage of sample S1 depend on the external DC field. At 0 and 0.011 T, the recorded UOUT values are similar and reach about 130 mV (Figure 4a). Above 0.011 T, voltage across the sample significantly increases along with the DC field (Figure 4b), especially at resonant frequencies. The maximum value of UOUT (~450 mV) was noted for 0.133 T at fres = 69.2 kHz. Interestingly, at 0.4 T the heights of all peaks above 60 kHz are smaller than those measured at 0.133 T. One possible explanation for such behavior is the competition between mechanical stress and material vibrations. It is known that, as the magnetic field increases in value, the magnetostrictive coefficient of Terfenol-D saturates along with the ME signal [22,29,31]. At the same time, increasing stiffness of the material has the damping effect on oscillations. Moreover, it can be noted that the peak around fres~32 kHz is larger at 0.4 T than at 0.133 T, which suggests its different origin.
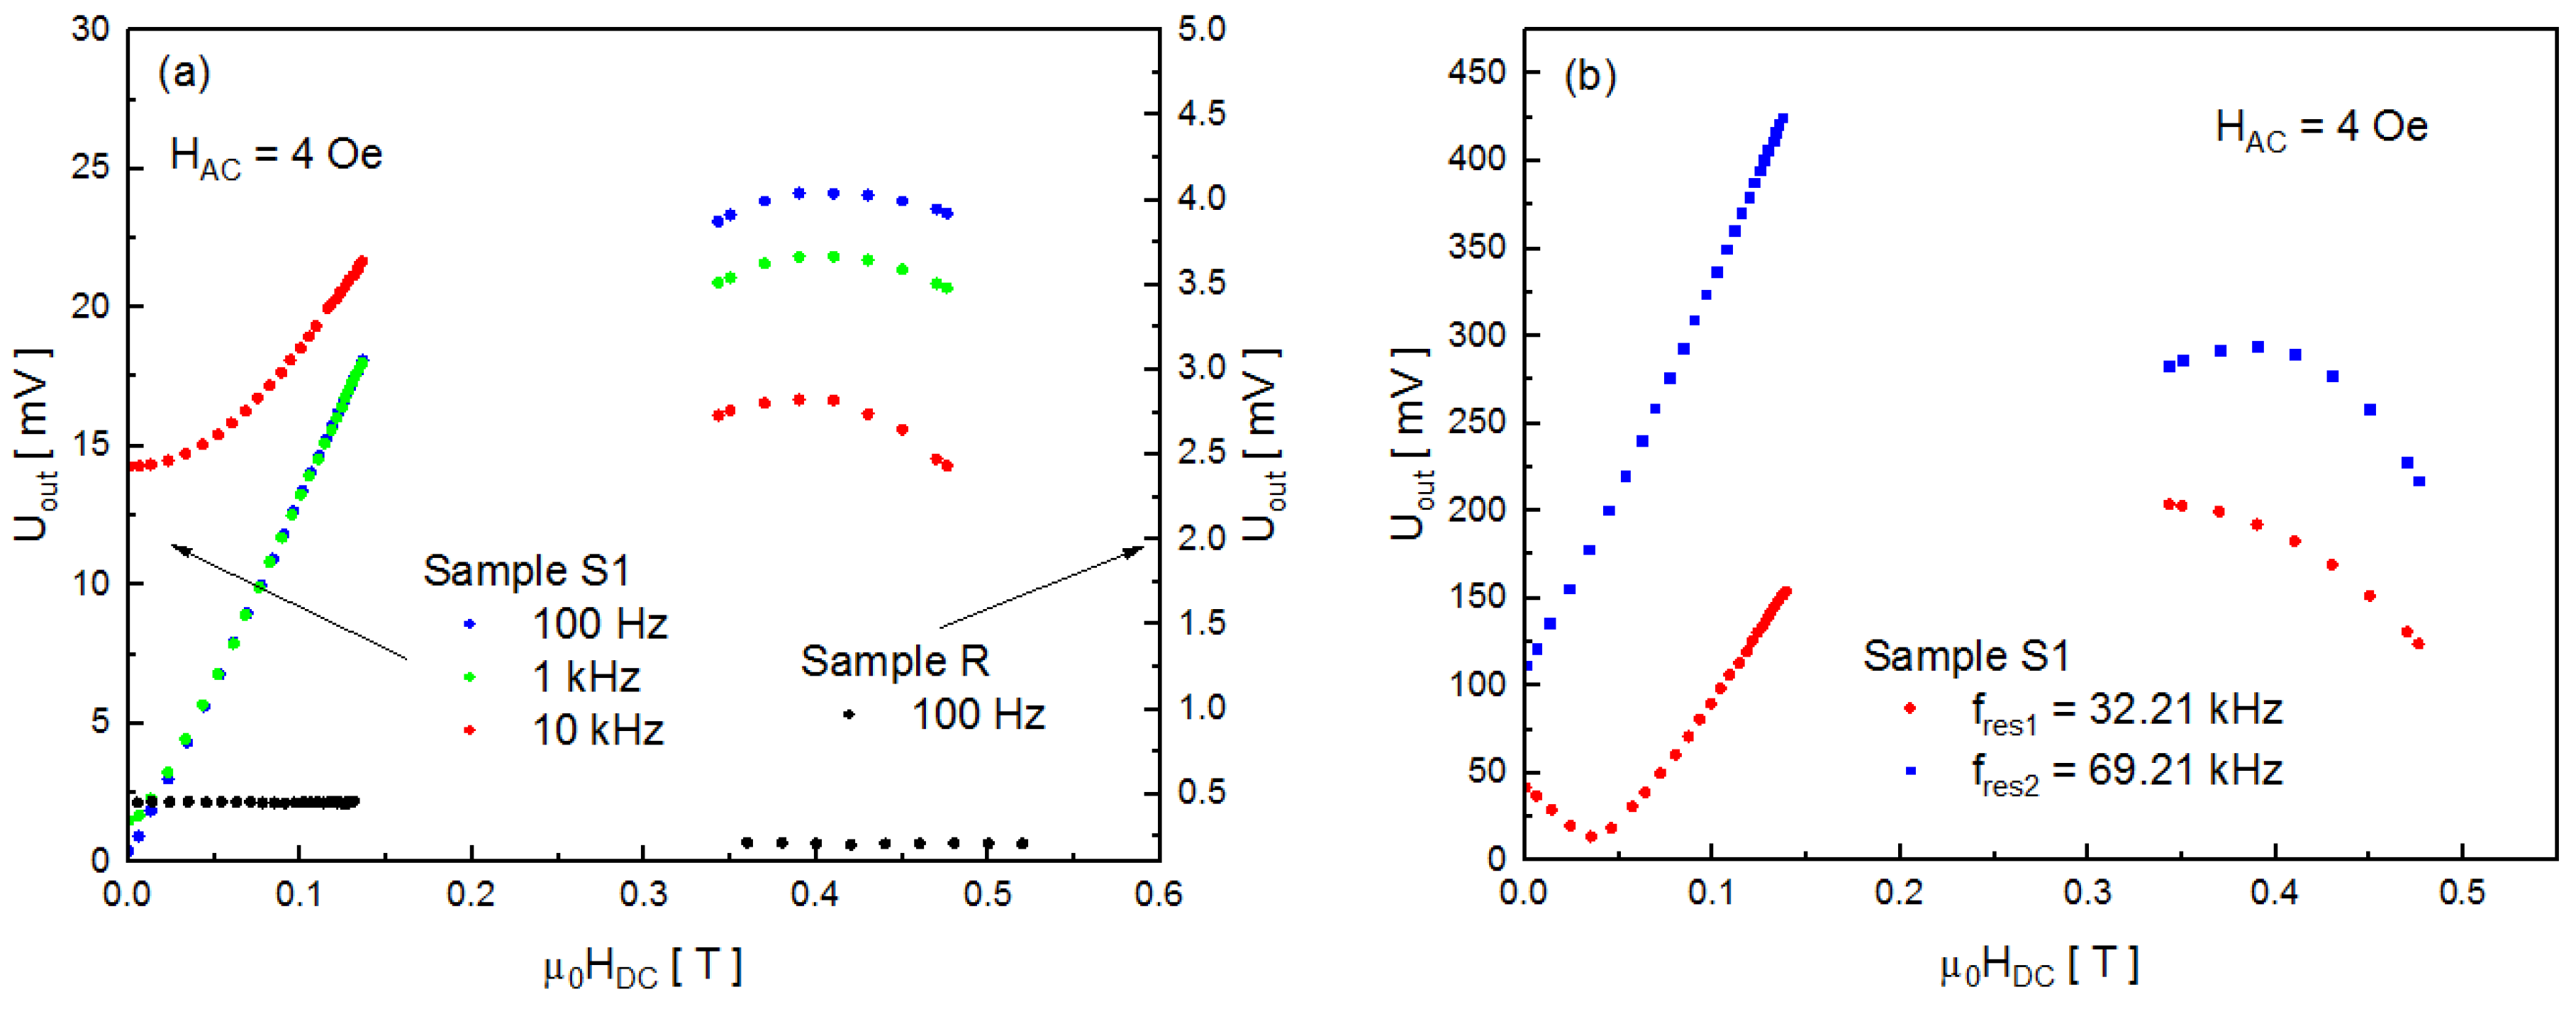
The results of UOUT(HDC) measurements are shown in Figure 5. The gap in the characteristics is connected with the limited capabilities of the magnets used, as described previously. According to predictions, there is no influence of the DC magnetic field on the piezoelectric patch and the measured voltage values are very small (see the black point characteristic in Figure 5a and the scale on the right vertical axis). Changes in UOUT for the sample S1 should therefore be connected with the ME effect.
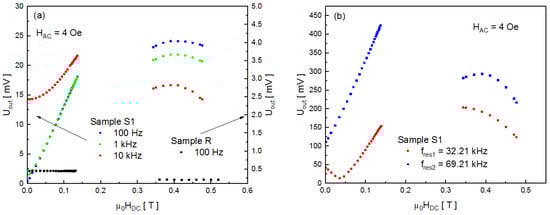
Figure 5.
Magnetoelectric voltage versus DC magnetic field characteristics: (a) for sample S1 and reference R at different frequencies; (b) for sample S1 at two different resonant frequencies.
Measurement frequencies were selected from different regions of characteristics in Figure 4, i.e., 100 Hz, 1 and 10 kHz from the linear part and two resonant frequencies fres1 = 32.21 kHz and fres2 = 69.21 kHz. Figure 5 shows that all characteristics (excluding the one for fres1) have a similar trend. At low DC fields (up to 0.14 T) there is a linear increase of UOUT relative to HDC. Next, the voltage reaches some maximum value and then gradually decreases between 0.34 and 0.45 T. The observed trend corresponds well to published data for PZT/Terfenol-D composites [13,22,23,25,29,30]. The shape of characteristics is related to the dependence of the magnetostrictive coefficient of Terfenol-D on the DC magnetic field, as shown in [22,29,31]. Once the curve reaches saturation, UOUT starts to decrease with the increase in the magnetic field. Of particular note is the characteristic for fres1 = 32.21 kHz (Figure 5b, red color). First, the magnetoelectric voltage drops between 0 and approximately 0.04 T, and then increases similarly to other characteristics. This behavior corresponds to observations in Figure 4, in which the resonant peak at about 32.2 kHz is inverted (directed downwards) up to 0.058 T. The downward orientation may suggest that the ME signal is 180° out of phase with the Faraday electromagnetic induction signal. Above the DC field value of 0.058 T, the peaks are directed upwards. It may be supposed that the origin of the resonant peak at 32.2 kHz is different because the direction of other peaks is not field-dependent.
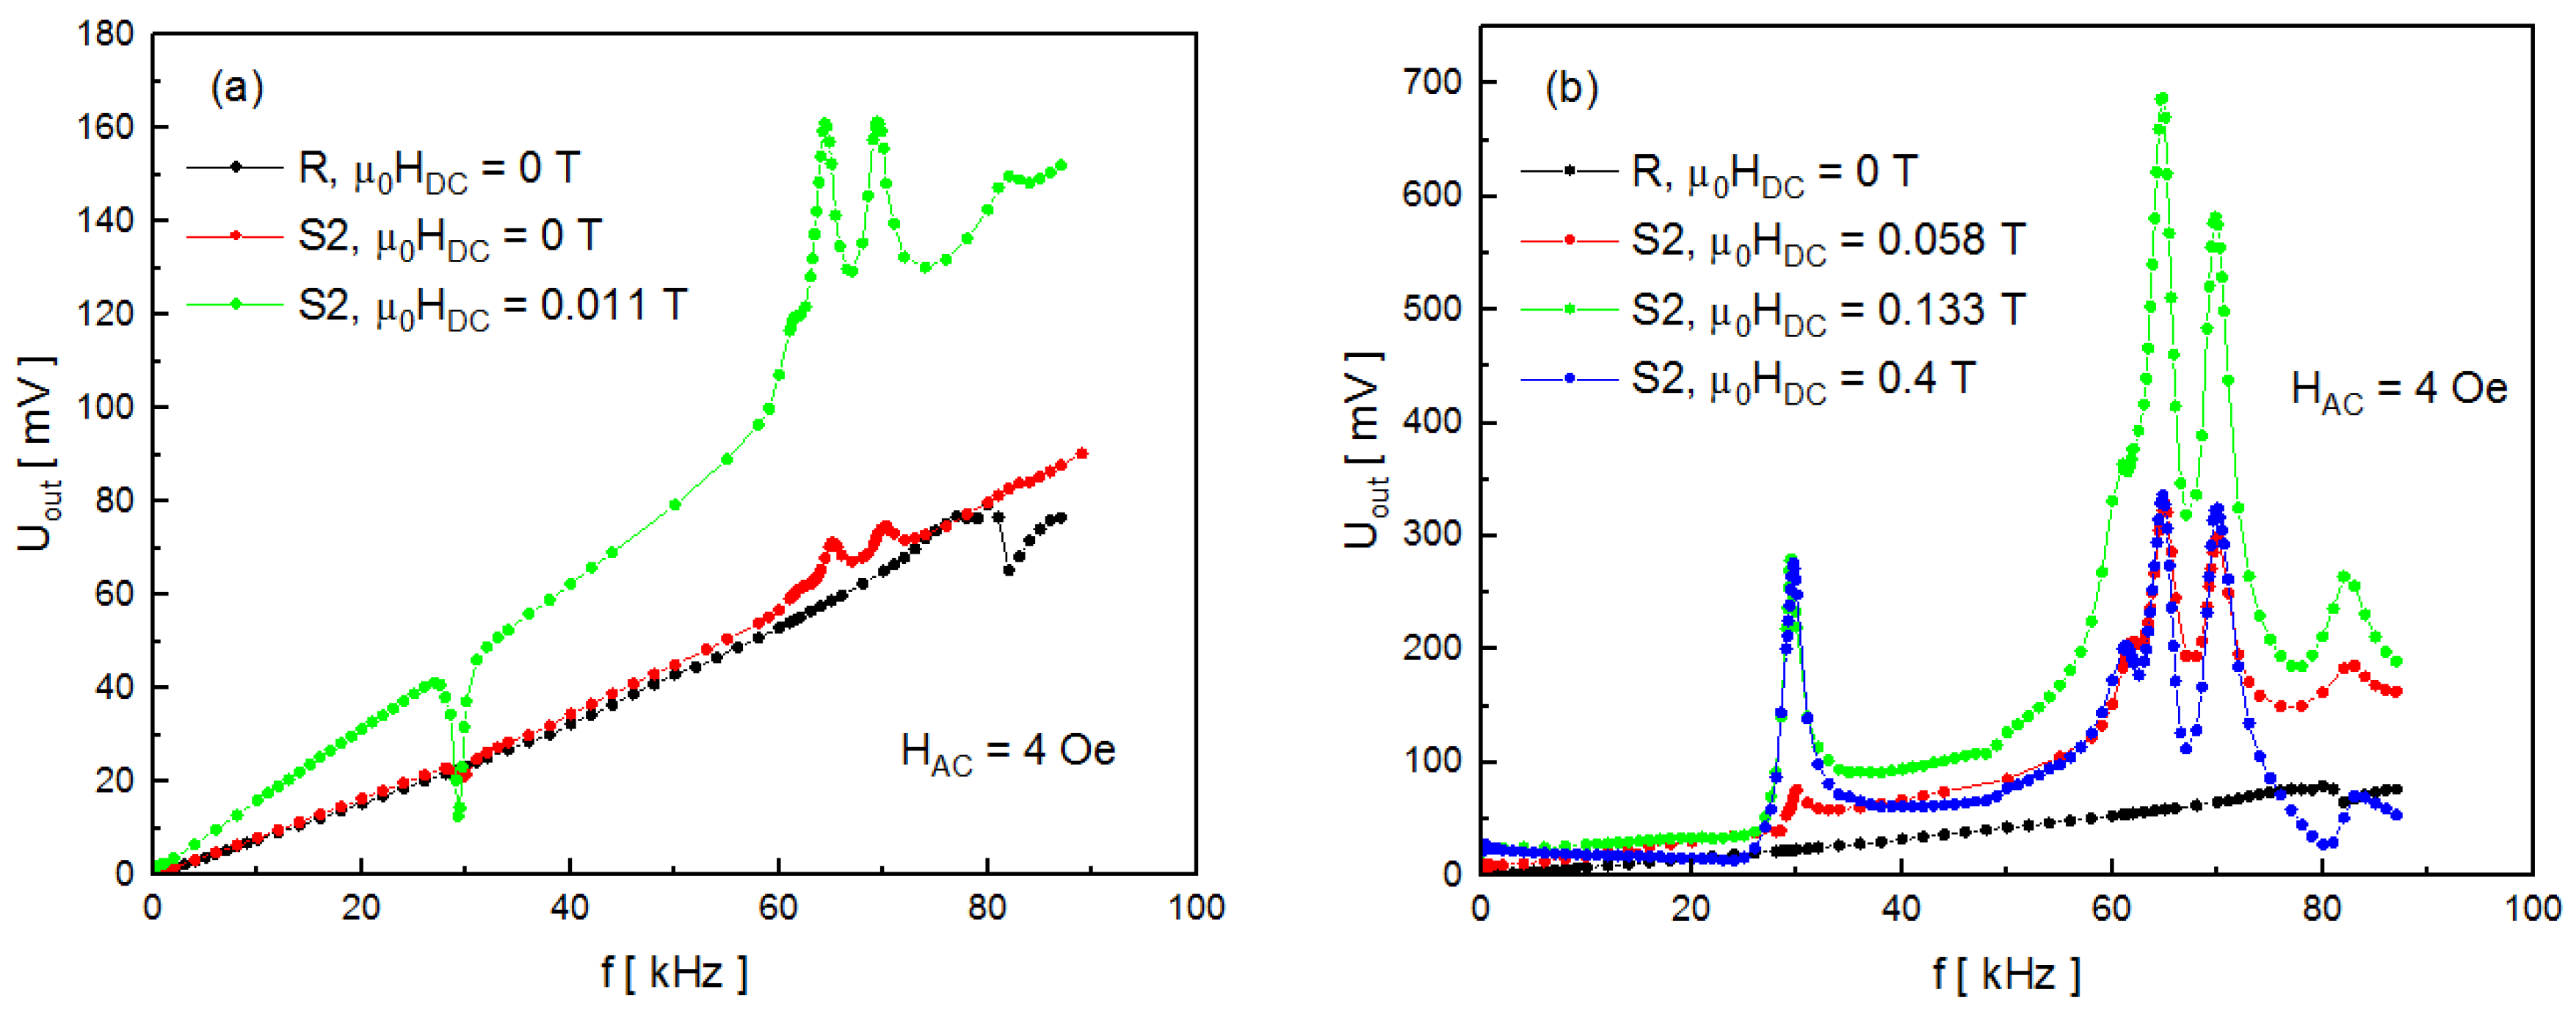
The characteristics of UOUT(f) for the sample S2 and reference sample R are presented in Figure 6. The measurements were taken under the same conditions as for the sample S1. Despite having additional piezoelectric and magnetostrictive layers, the composite exhibits qualitatively similar behavior to that shown in Figure 4. Each characteristic consists of a base ascribed to Faraday electromagnetic induction and a voltage signal due to the ME coupling. Several resonant peaks can also be observed.
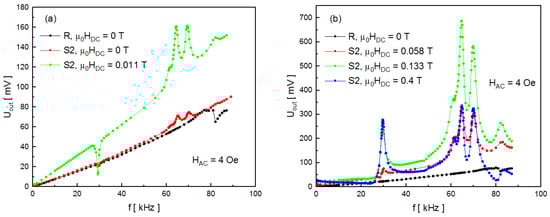
Figure 6.
Magnetoelectric voltage versus AC magnetic field frequency characteristics for sample S2 and reference R: (a) for DC field in the range of 0–0.011 T, (b) for DC field between 0.058 and 0.4 T.
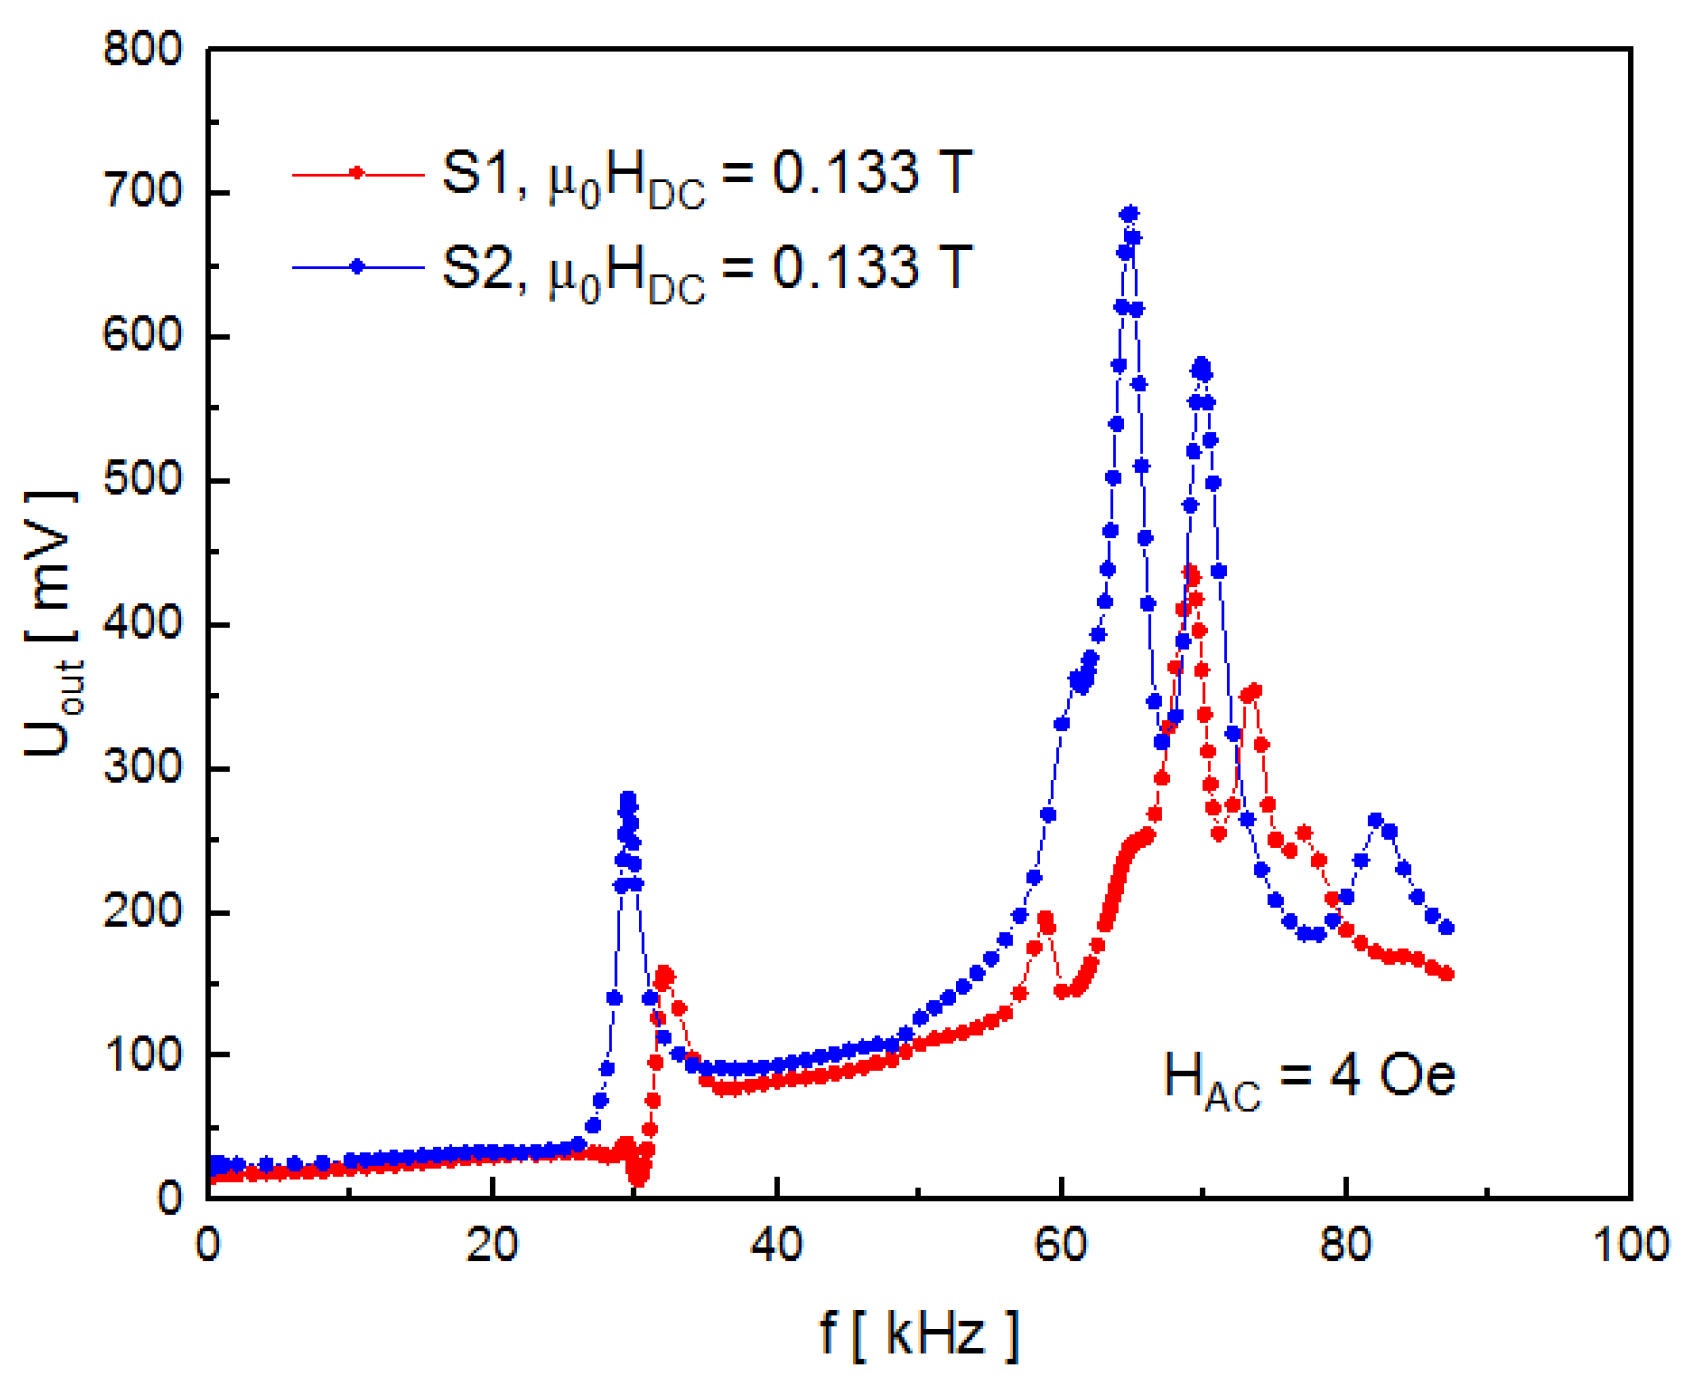
For the DC magnetic field of 0.133 T, resonance occurs at fres = 29.5, 61, 64.8, 69.8, and 82 kHz. For different DC field values, a resonance state in sample S2 is observed at approximately the same frequencies. Figure 6 also shows that the field response of the peaks regarding their direction is consistent with previous observations. The first peak at 29.3 kHz (Figure 6a) is inverted at 0.011 T of the DC field and directed upwards for fields above that value (Figure 6b). The key differences between the results shown in Figure 4 and Figure 6 are the maximum voltage values recorded in the resonance states as well as their frequencies. For the sample S2, the highest observed value was 687 mV for 0.133 T at 64.65 kHz (Figure 6b). Since the composite S2 contains more layers, it is expected that the strain transfer between the components, as well as the Faraday voltage contribution, is greater; hence, the measured UOUT values should be larger. It also can be expected that the resonant frequencies are different for the composites S1 and S2. As an example, a comparison of resonant frequencies for the samples exposed to 0.133 T is shown in Figure 7. It is clearly visible that all the resonant peaks for the sample S2 (higher mass) are shifted towards lower frequencies in comparison with the peaks for the sample S1.
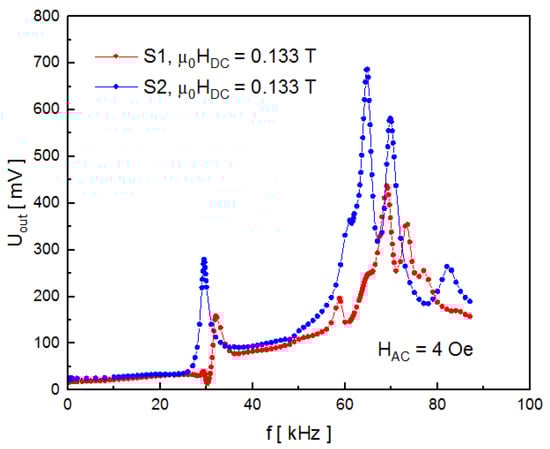
Figure 7.
Comparison of resonant frequencies for samples S1 and S2.
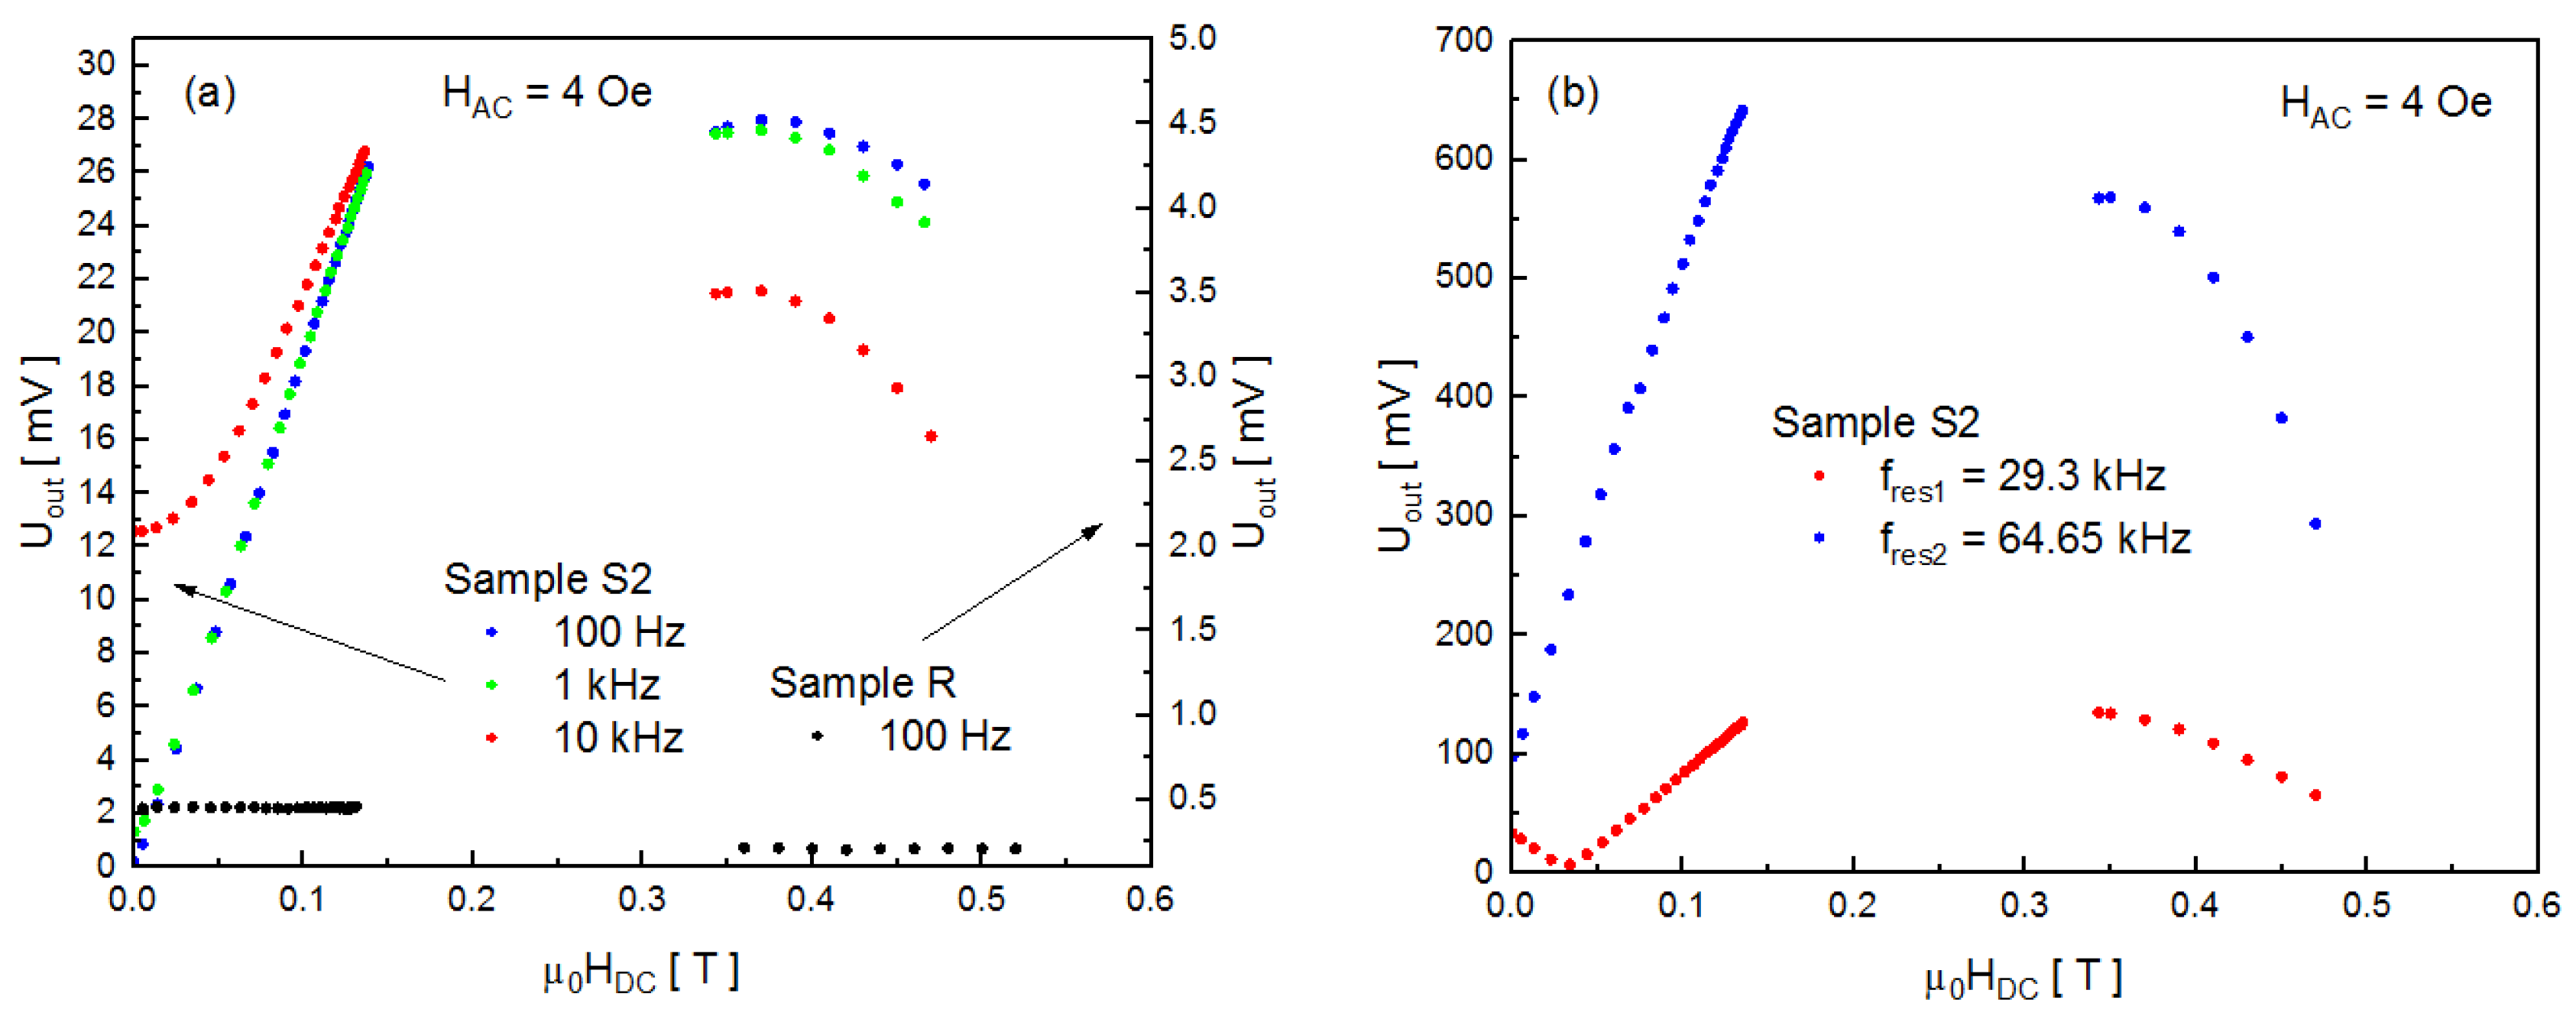
The results of magnetoelectric voltage versus DC magnetic field measurements for the composite S2 are shown in Figure 8. The characteristics follow the same trend as in the case of the sample S1. As expected, UOUT attains larger values when the sample contains multiple Terfenol-D layers. The voltage increases linearly along with the field, reaches a maximum value, and then decreases. The only exception is the measurement at fres1 = 29.3 kHz. At this frequency, which corresponds to the first resonant peak in Figure 6, the magnetoelectric voltage drops as the DC field reaches 0.034 T. The voltage decreases again after reaching a maximum value. This dependence can be observed as the reorientation of the first peak in Figure 6 (downwards for 0 and 0.011 T, upwards for stronger DC fields). In contrast to the sample S1, the first peak for 0.058 T is directed upwards.
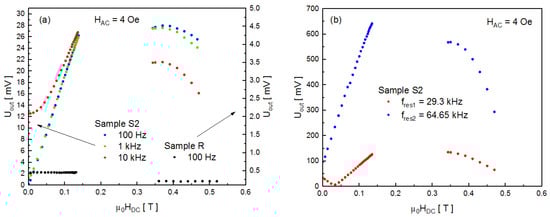
Figure 8.
Magnetoelectric voltage versus DC magnetic field characteristics: (a) for sample S2 and reference R at different frequencies; (b) for sample S2 at two different resonant frequencies.
The magnetoelectric coupling coefficient α was calculated from Equation (1) for selected resonant frequencies for both composite samples. The characteristic UOUT(f) values for 0.133 T were chosen as the largest magnetoelectric voltages recorded for that DC field. The results are collected in Table 1.

Table 1.
Magnetoelectric coupling coefficient for selected resonant frequencies at 0.133 T.
The highest coupling coefficient was observed for the sample S1 (α = 555 mVcm−1 Oe−1) in a resonance state at 69.2 kHz. Despite the larger observed UOUT for the sample S2, the sample S1 is approximately three times thinner, which had a significant impact on the final result. The experimental results were obtained with magnetic field lines perpendicular to the face of the samples (longitudinal ME effect). Available mathematical models show that a much larger α can be expected with AC field and DC bias lines parallel to the sample plane (transverse ME effect) [12,32]. For comparison, values up to 5.9 Vcm−1 Oe−1 for different PZT/Terfenol-D composite setups were reported in the literature [5,11,33].
4. Conclusions
To conclude, we successfully obtained low-cost PZT/Terfenol-D magnetoelectric composites from commercially available materials. The composites utilize a product property of two ferroic phases (magnetostrictive Terfenol-D and piezoelectric PZT). Of particular note is the use of P1MFC piezoelectric sheets as a substitute for chemically synthesized PZT in our study. The final outcome is the ability to measure the voltage signal as a response to magnetic stimulation. The room-temperature ME coupling was examined via the lock-in technique and confirmed in our samples. Resonant peaks were observed for resonance states at different frequencies. Instead of detecting single or separated peaks as shown in the literature, we observed multiple resonant peaks that are grouped together in a band-like fashion in the kHz range. Based on UOUT(HDC) and UOUT(f) characteristics, it can be seen that the first resonant peak (close to 30 kHz) is clearly separated from the group and has a different origin. Its orientation is DC field-dependent. Furthermore, we can observe that the strongest ME effect occurs for a certain magnetic DC bias value and then becomes weaker as the field continues to increase. This behavior can be connected with the interplay of two effects: (i) saturation of the Terfenol-D magnetostrictive properties, and (ii) increasing damping of mechanical vibrations due to stress. Additionally, the number, frequency, and height of resonant peaks observed in our study depend on the sample mass and the number of layers. The resonant frequencies also undergo shifting towards higher values with respect to the rising magnetic bias for each composite. This effect can be ascribed to the growth of stress caused by magnetostriction. Our study shows that the functionality of the commercial P1MFC piezoelectric sheet can be extended by joining it with a magnetostrictive material. As a result, the sheet becomes susceptible to two kinds of stimulus, i.e., strain and magnetic field. Such composite configuration can be of interest in the context of energy harvesting and multifunctional sensors.
Author Contributions
Conceptualization, J.G. and T.P.; methodology, J.G., R.M. and T.P.; software, J.G.; validation, T.P. and R.M.; formal analysis, J.G. and T.P.; investigation, J.G. and T.P.; resources, J.G. and T.P.; data curation, J.G.; writing—original draft preparation, J.G.; writing—review and editing, T.P. and R.M.; visualization, J.G.; supervision, T.P.; project administration, T.P.; funding acquisition, T.P. All authors have read and agreed to the published version of the manuscript.
Funding
This research received no external funding.
Institutional Review Board Statement
Not applicable.
Informed Consent Statement
Not applicable.
Data Availability Statement
Data is contained within the article.
Conflicts of Interest
The authors declare no conflict of interest.
References
- Vopson, M.M. Fundamentals of Multiferroic Materials and Their Possible Applications. Crit. Rev. Solid State Mater. Sci. 2015, 40, 223–250. [Google Scholar] [CrossRef]
- Spaldin, N.A. Multiferroics: Past, present, and future. MRS Bull. 2017, 42, 385–390. [Google Scholar] [CrossRef]
- Fiebig, M.; Lottermoser, T.; Meier, D.; Trassin, M. The evolution of multiferroics. Nat. Rev. Mater. 2016, 1, 16046. [Google Scholar] [CrossRef]
- Vopson, M.M.; Fetisov, Y.K.; Caruntu, G.; Srinivasan, G. Measurement Techniques of the Magneto-Electric Coupling in Multiferroics. Materials 2017, 10, 963. [Google Scholar] [CrossRef] [PubMed]
- Eerenstein, W.; Mathur, N.D.; Scott, J.F. Multiferroic and magnetoelectric materials. Nature 2006, 442, 759–765. [Google Scholar] [CrossRef]
- Schmid, H. Multi-ferroicmagnetoelectrics. Ferroelectrics 1994, 162, 317–338. [Google Scholar] [CrossRef]
- Cheong, S.-W.; Mostovoy, M. Multiferroics: A magnetic twist for ferroelectricity. Nat. Mater. 2007, 6, 13–20. [Google Scholar] [CrossRef] [PubMed]
- Khomskii, D. Classifying Multiferroics: Mechanisms and Effects. Physics 2009, 2, 20. [Google Scholar] [CrossRef]
- Ryu, J.; Priya, S.; Uchino, K.; Kim, H.-E. Magnetoelectric Effect in Composites of Magnetostrictive and Piezoelectric Materials. J. Electroceram. 2002, 8, 107–119. [Google Scholar] [CrossRef]
- Jartych, E.; Pikula, T.; Kowal, K.; Dzik, J.; Guzdek, P.; Czekaj, D. Magnetoelectric Effect in Ceramics Based on Bismuth Ferrite. Nanoscale Res. Lett. 2016, 11, 234. [Google Scholar] [CrossRef]
- Priya, S.; Islam, R.; Dong, S.; Viehland, D. Recent advancements in magnetoelectric particulate and laminate composites. J. Electroceram. 2007, 19, 149–166. [Google Scholar] [CrossRef]
- Srinivasan, G. Magnetoelectric Composites. Annu. Rev. Mater. Res. 2010, 40, 153–178. [Google Scholar] [CrossRef]
- Huang, B.; Zhu, W.; Hua, L.; Wang, J.; Guo, Y. Optimal magnetoelectric coupling performance of Terfenol-D/PZT composites in resonance state under bias magnetic field. Curr. Appl. Phys. 2022, 41, 139–147. [Google Scholar] [CrossRef]
- Wan, J.G.; Li, Z.Y.; Wang, Y.; Zeng, M.; Wang, G.H.; Liu, J.-M. Strong flexural resonant magnetoelectric effect in Terfenol-D∕epoxy-Pb(Zr,Ti)O3Pb(Zr,Ti)O3 bilayer. Appl. Phys. Lett. 2005, 86, 202504. [Google Scholar] [CrossRef]
- Saveliev, D.V.; Glavan, G.; Belan, V.O.; Belyaeva, I.A.; Fetisov, L.Y.; Shamonin, M. Resonant Magnetoelectric Effect at Low Frequencies in Layered Polymeric Cantilevers Containing a Magnetoactive Elastomer. Appl. Sci. 2022, 12, 2102. [Google Scholar] [CrossRef]
- Wen, J.-B.; Zhang, J.-J.; Gao, Y.-W. Multiple broadband magnetoelectric response in Terfenol-D/PZT structure. Chin. Phys. B 2018, 27, 027702. [Google Scholar] [CrossRef]
- Lafont, T.; Gimeno, L.; Delamare, J.; Lebedev, G.A.; Zakharov, D.I.; Viala, B.; Cugat, O.; Galopin, N.; Garbuio, L.; Geoffroy, O. Magnetostrictive–piezoelectric composite structures for energy harvesting. J. Micromech. Microeng. 2012, 22, 094009. [Google Scholar] [CrossRef]
- Available online: https://www.smart-material.com/MFC-product-propertiesV2.html (accessed on 10 May 2023).
- van Suchtelen, J. Product Properties: A New Application of Composite Materials. Philips Res. Rep. 1972, 27, 28–37. [Google Scholar]
- Rivera, J.P. On definitions, units, measurements, tensor forms of the linear magnetoelectric effect and on a new dynamic method applied to Cr-Cl boracite. Ferroelectrics 1994, 161, 165–180. [Google Scholar] [CrossRef]
- Duong, G.V.; Groessinger, R.; Schoenhart, M.; Bueno-Basques, D. The lock-in technique for studying magnetoelectric effect. J. Magn. Magn. Mater. 2007, 316, 390–393. [Google Scholar] [CrossRef]
- Cheng, J.H.; Wang, Y.G.; Xie, D. Resonance magnetoelectric effect in Ni/Pb(Zr,Ti)O3/Terfenol-D trilayered composites with different mechanical boundary conditions. Appl. Phys. Lett. 2014, 104, 252411. [Google Scholar] [CrossRef]
- Xing, Z.; Dong, S.; Zhai, J.; Yan, L.; Li, J.; Viehland, D. Resonant bending mode of Terfenol-D∕steel∕Pb(Zr,Ti)O3 magnetoelectric laminate composites. Appl. Phys. Lett. 2006, 89, 112911. [Google Scholar] [CrossRef]
- Shi, Z.; Ma, J.; Nan, C.-W. A new magnetoelectric resonance mode in bilayer structure composite of PZT layer and Terfenol-D/epoxy layer. J. Electroceram. 2008, 21, 390–393. [Google Scholar] [CrossRef]
- Malleron, K.; Gensbittel, A.; Talleb, H.; Ren, Z. Experimental study of magnetoelectric transducers for power supply of small biomedical devices. Microelectron. J. 2019, 88, 184–189. [Google Scholar] [CrossRef]
- Subhani, S.M.; Arockiarajan, A. Study on axial resonance magneto-electric (ME) effects of layered magneto-electric composites. Eur. J. Mech. A/Solids 2019, 77, 103799. [Google Scholar] [CrossRef]
- Dong, S.; Cheng, J.; Li, J.F.; Viehland, D. Enhanced magnetoelectric effects in laminate composites of Terfenol-D/Pb(Zr,Ti)O3 under resonant drive. Appl. Phys. Lett. 2003, 83, 4812–4814. [Google Scholar] [CrossRef]
- Yao, Y.; Hou, Y.; Dong, S.; Huang, X.; Yu, Q.; Li, X. Influence of magnetic fields on the mechanical loss of Terfenol-D/PbZr0.52Ti0.48O3/Terfenol-D laminated composites. J. Alloys Compd. 2011, 509, 6920–6923. [Google Scholar] [CrossRef]
- Liu, Y.; Yang, C.; Zhou, P.; Srinivasan, G.; Qi, Y.; Liang, K.; Zhang, T.; Filippov, D.A. Resonance magnetoelectric characteristics of Terfenol-D/Pb(Zr0.52Ti0.48)O3/Ni asymmetric three layered composites. IOP Conf. Ser. Mater. Sci. Eng. 2019, 656, 012056. [Google Scholar] [CrossRef]
- Lu, J.; Wang, X.; Wang, J.; Zhou, Y.; Chen, D.; Wang, S.; Zhang, M.; Zeng, X. A Magnetoelectric Coefficient Measurement System with a Free-Stress Sample Holder. J. Miner. Mater. Charact. Eng. 2020, 8, 330–340. [Google Scholar] [CrossRef]
- Cai, N.; Zhai, J.; Nan, C.W.; Lin, Y.; Shi, Z. Dielectric, ferroelectric, magnetic, and magnetoelectric properties of multiferroic laminated composites. Phys. Rev. B 2003, 68, 224103. [Google Scholar] [CrossRef]
- Bichurin, M.I.; Petrov, V.M.; Priya, S. Magnetoelectric Multiferroic Composites. In Ferroelectrics; Mickaël, L., Ed.; IntechOpen: London, UK, 2011; Chapter 12. [Google Scholar]
- Ryu, J.; Priya, S.; Carazo, A.V.; Uchino, K.; Kim, H.-E. Effect of the Magnetostrictive Layer on Magnetoelectric Properties in Lead ZirconateTitanate/Terfenol-D Laminate Composites. J. Am. Ceram. Soc. 2001, 84, 2905–2908. [Google Scholar] [CrossRef]

Disclaimer/Publisher’s Note: The statements, opinions and data contained in all publications are solely those of the individual author(s) and contributor(s) and not of MDPI and/or the editor(s). MDPI and/or the editor(s) disclaim responsibility for any injury to people or property resulting from any ideas, methods, instructions or products referred to in the content. |
© 2023 by the authors. Licensee MDPI, Basel, Switzerland. This article is an open access article distributed under the terms and conditions of the Creative Commons Attribution (CC BY) license (https://creativecommons.org/licenses/by/4.0/).