Article

Factors and Underlying Mechanisms That Influence the Repetitive Breakdown Characteristics of Corona-Stabilized Switches

1
School of Energy and Electrical Engineering, Chang’an University, Xi’an 710064, China
2
School of Communications and Information Engineering and School of Artificial Intelligence, Xi’an University of Posts and Telecommunications, Xi’an 710121, China
*
Author to whom correspondence should be addressed.
Appl. Sci. 2023, 13(17), 9518; https://doi.org/10.3390/app13179518
Submission received: 2 August 2023 / Revised: 19 August 2023 / Accepted: 20 August 2023 / Published: 22 August 2023
(This article belongs to the Special Issue Photonic Devices and Applications)

Abstract

:
The corona-stabilized switch has the potential to be a high repetition rate pulsed-power switching device, but there has been limited investigation into its repetitive breakdown stability and insulation recovery characteristics. Repetitive breakdowns of gas are characterized by a memory effect, where the subsequent breakdown process is inevitably influenced by the preceding one. However, there are still some issues that require further exploration in the current research on the mechanism of memory effect on repetitive breakdown characteristics. To clarify the factors and mechanisms that affect the repetitive breakdowns of corona-stabilized switches, this paper introduced optical observation methods into the experimental investigation. Through optical–electrical coupled diagnosis, the repetitive breakdown stability and insulation recovery performance of corona-stabilized switches under different working conditions and repetition frequencies were analyzed. The monotonic promoting effect of corona stabilization on switch insulation strength recovery is proposed as well as the non-monotonic and complex regulatory mechanism of corona stabilization on repetitive breakdown stability. The research results provide a theoretical and practical basis for clarifying the mechanism of repetitive corona-stabilized breakdowns and optimizing the design of corona-stabilized switches.

1. Introduction

Repetitive gas-discharge plasma has great potential, and the increasing scope of its applications highlights the growing importance of pulsed-power supplies. The performance of these supplies relies on their switching devices, which serve as crucial components while also acting as bottlenecks that prevent the system’s ability to operate repetitively. Gas-discharge closing switches have exceptional voltage and power handling capabilities, a high switching rate, and simple structures, making them the primary option for high-voltage pulsed-power systems [1,2,3,4,5].
The corona stabilization effect accelerates the insulation recovery rate of gas gaps during repetitive breakdowns by suppressing premature breakdown when its insulation strength has not fully recovered. This technique has great potential to improve the upper limit of the PRFs (pulse repetitive frequencies) of the pulsed-power switches [5,6,7]. Macgregor et al. were the first to introduce the corona stabilization effect into pulsed-power switches for repetitive applications and suggested the concept of a corona-stabilized switch [8]. They designed a double-cone [9] and a rod-plane [10] corona-stabilized switch, and validated its excellent repetitive performance through experimental research. Sarkar et al. designed a electromagnetic pulse generator that utilized a self-triggering corona-stabilized switch with a pins-plate electrode, operating in an atmospheric SF6 environment. The generator could reach an operating voltage of 18 kV and had a repetition frequency of 2 kHz [11]. Beveridge et al. [12] proposed a corona-stabilized switch with a multistage structure that could operate at voltages as high as 40–100 kV (adjustable by changing the switch series) and had very low discharge time jitter (~2 ns) at working pressures of 0–0.1 MPa. Li et al. systematically investigated the factors and mechanisms that affect the insulation recovery performance of the corona-stabilized switch, identified the factors causing the repetitive breakdown memory effect and their working principles, and proposed that insulation recovery was subject to a synergistic effect of hydrodynamic processes and memory effects [7,13,14,15].
Consistency and stability of the output repetitive pulsed voltages are important performance parameters for pulsed-power switches operating in high PRF applications, which represent a technical bottleneck to improving the working efficiency and reliability of pulse-power systems. Considering the factors that affect the stability of PRFs of corona-stabilized switches and their mechanisms, MacGregor et al. analyzed how corona discharge influences the breakdown stability of a typical rod-plane switch under DC charging conditions from the perspective of discharge delay. It was found that in the absence of corona activity, the distribution of discharge formation delay is highly dispersed (ranging from 10 to 2000 μs), whereas in the presence of corona, the distribution of the discharge formation time is concentrated (around 1000 μs). Therefore, corona discharge activity can significantly enhance the repetitive breakdown stability of gas switches [8]. Larsson et al. investigated the time jitter of a commercially available corona-stabilized switch and found that the operating pressure greatly influenced the time jitter of breakdown. By adjusting the pressure, the time jitter could be reduced to less than 5 ns [16]. Martin et al. proposed a cascade corona-stabilized switch that integrated the ground electrode of the former switch with the high voltage electrode of the latter. The gap voltage distribution in the switch based on corona stabilization was studied, and it was found that changing the electrode spacing and corona emission area could alter the corona characteristics in the gap, thus improving its stabilization effect [17]. Gao et al. investigated the impact of parameters such as electrode shape, pressure, gap spacing, and repetition frequency on the breakdown voltage in the corona-stabilized switch during low PRFs (<100 Hz). The results were analyzed from the perspective of the critical volume. The findings indicate that a smaller critical volume leads to more concentrated voltage fluctuations and better stabilization effects for corona discharge. Optimizing the critical volume can reduce voltage fluctuations at low repetition rates [18].
Currently, investigations into corona-stabilized switches are primarily focused on its insulation recovery performance. The investigation into the stability of repetitive breakdowns mainly focuses on time delay or voltage dispersity at low frequencies (<100 Hz), however, there are still some issues that need to be solved regarding the factors and mechanisms that affect switch stability. Therefore, this paper systematically investigates the influence of crucial parameters such as electric field inhomogeneity, gas type, operating pressure, and gap spacing on the breakdown voltage and voltage dispersion of the repetitive corona-stabilized breakdowns. The results are analyzed based on both the corona stabilization effect and the memory effect.

2. Experimental Apparatus and Methods

The experimental setup consisted of a corona stabilization switch, a repetitive pulsed-power supply, and observation and diagnostic equipment, as depicted in Figure 1.

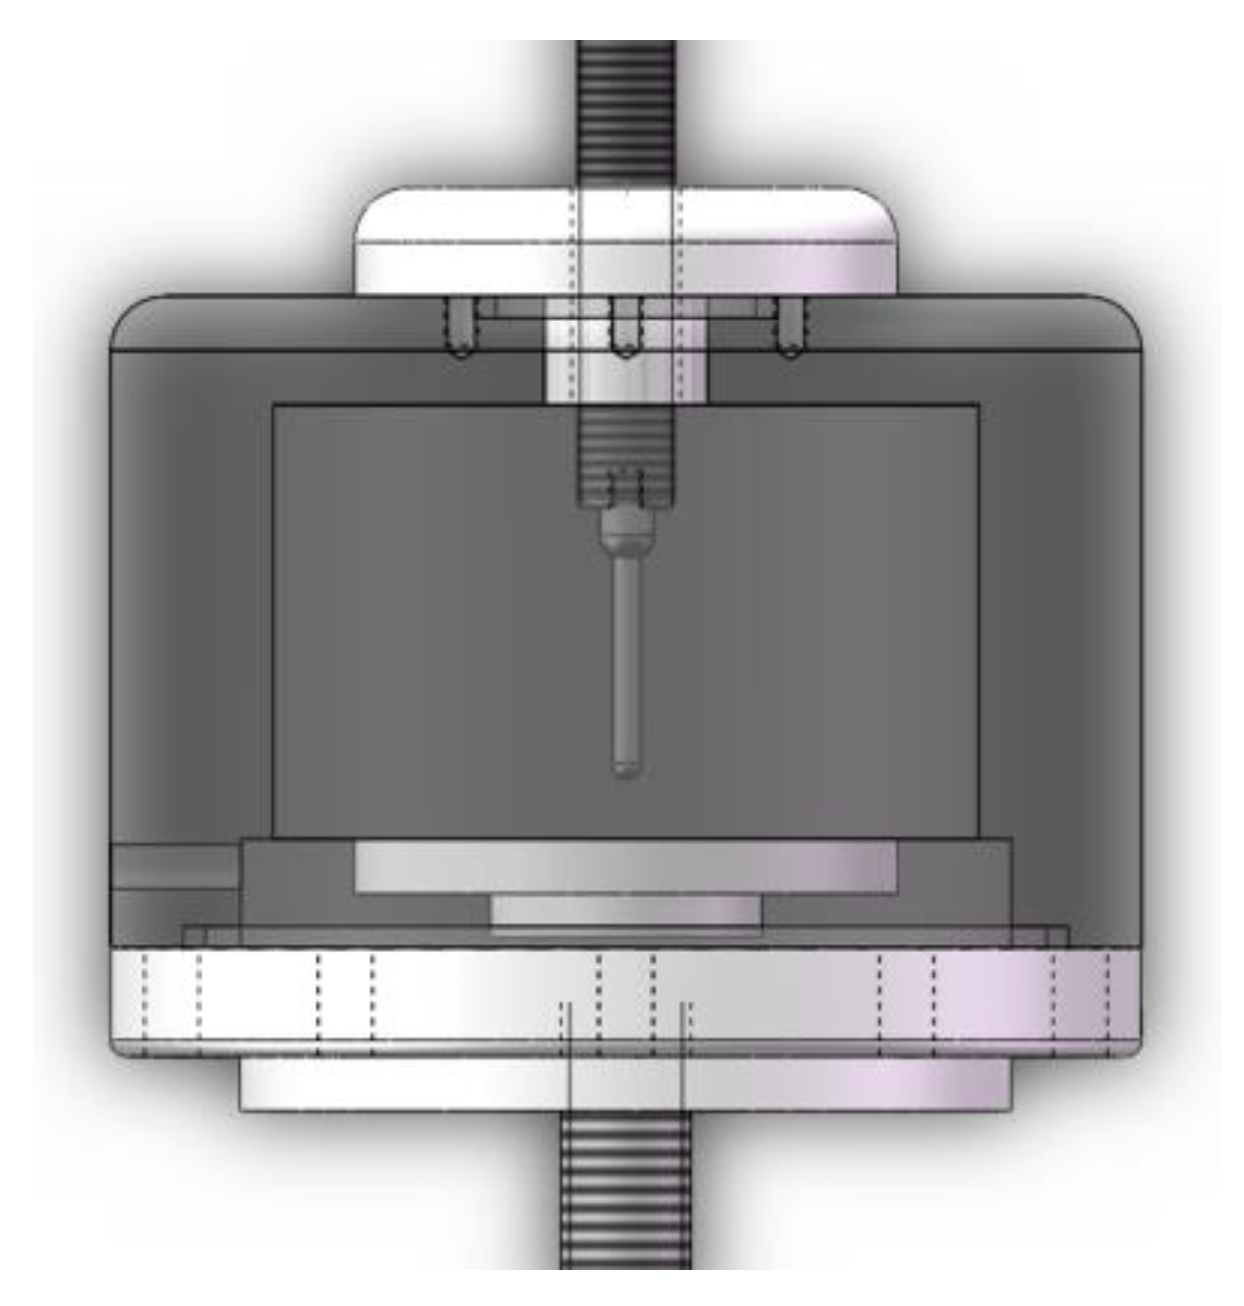
2.1. The Corona-Stabilized Switch

The investigated corona-stabilized switch was a self-triggering device with a single rod-plate electrode configuration that was fabricated in the laboratory and is shown in Figure 2. The plate ground electrode is a disc made of brass that has a radius of 30.0 mm and thickness of 5.0 mm. Brass was chosen for its superior ablative performance at high frequencies.
The parameters that were the focus of this paper include:

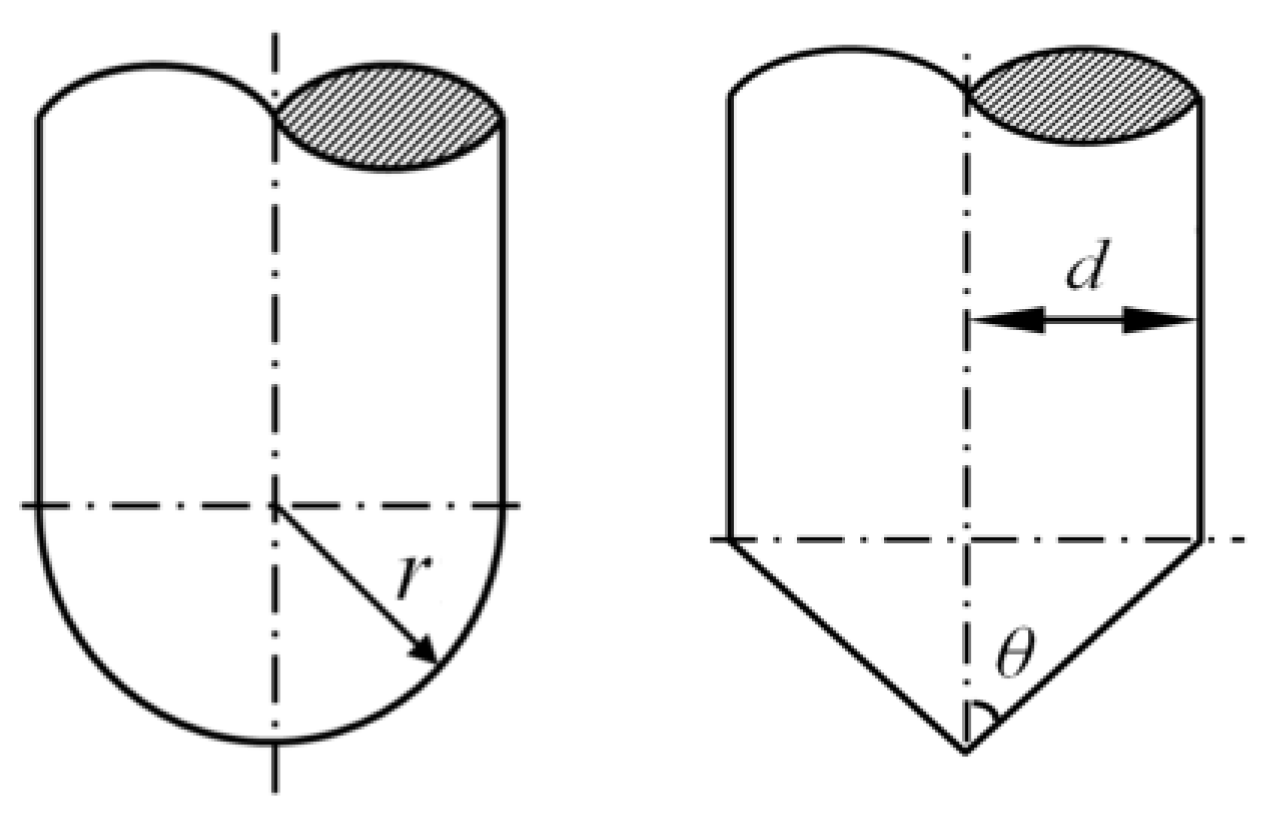
2.1.1. Inhomogeneity of Electric Field

The inhomogeneity of the electric field in a corona-stabilized switch determines the distribution of the electric field in the gas gap and affects both the position and intensity of the corona discharge activity. This is crucial to achieving corona stabilization and is a core parameter in designing such switches. To investigate the influence of inhomogeneous electric fields, high-voltage electrodes (R group) with different rod radii but the same length (50.0 mm) were employed to obtain varying inhomogeneity coefficients of the electric fields. To further investigate the impact of the spatial electric field distribution on corona stabilization, a high-voltage electrode with a sharp (group N) structure was designed, as the inhomogeneity coefficient of an electric field can only reflect the peak property of the electric field strength in the gap. A schematic diagram depicting the structure of the rod electrode and needle electrode is presented in Figure 3. The precise geometric dimensions of the rod electrode and needle electrode are delineated in Table 1 and Table 2, respectively. The field distribution for different electrodes was simulated using commercial finite element analysis software, and the inhomogeneity coefficient of the electric field f = Emax/Eav was calculated. Emax represents the maximum electric field intensity in the electrode gap obtained through simulation analysis, while Eav = U/s represents the average electric field intensity in the gap (U represents the applied voltage and s represents the gap spacing).

2.1.2. Gas Type

The breakdown and insulation recovery characteristics of the gas medium exert a significant influence on the repetition performance of corona-stabilized switches. The gas commonly utilized in corona-stabilized switches is SF6 [7,8,9], which presents excellent electrical and thermophysical properties. However, the use of SF6 in switches can lead to severe electrode erosion and significantly impact the switch lifetime, especially in gas switches with highly inhomogeneous fields [19,20].
The erosion effect of dissociated SF6 particles can be mitigated by diluting SF6 with other gases [14,21]. This study investigated the repetition performance of SF6–N2 and SF6–air mixtures, exploring their potential as replacements for pure SF6 in corona-stabilized switches with high PRFs. Additionally, the SF6–He mixture exhibits significant potential for high-PRF switches [8,22] as it combines the high dielectric strength of SF6 with the superior thermal conductivity and molecular velocity of helium. This is expected to result in a faster insulation recovery rate. Therefore, this paper also investigated the repetitive breakdowns and insulation recovery characteristics of SF6–He mixtures.

2.1.3. Operating Pressure and Gap Spacing

The pressure (p) and gap spacing (s) are important parameters of the gas switch that determine the motion characteristics of corona-generated charge during switch breakdown and the recovery characteristics of neutral gas density during insulation recovery. The breakdown stability of the corona-stabilized switch was experimentally studied in a pressure range of 0.05–0.4 MPa and gap spacings ranging from 1.5 mm to 12.5 mm.

2.2. Pulsed Power Supply

In this investigation, a high-voltage pulsed supply based on the air-core Tesla transformer was utilized, and the power circuit topology is illustrated in Figure 4. The power supply is composed of a rectifier, resonant charging circuit, Tesla transformer, thyristor, and its timing controller. Within the frequency range of 1 to 2000 Hz, the power supply can generate a continuous sequence of pulsed voltages with a voltage amplitude up to ±100 kV and rise time of about 15 kV/μs. Negative polarity pulses were used in the experimental research.

2.3. Diagnostics

We measured the voltage utilizing a self-designed resistance-capacitance divider with a transformer ratio of 1000:1 and a rise time of approximately 5 ns. The Pearson 4997 current monitor, with a bandwidth of 0.5 Hz to 15 MHz, was used to measure and record the current. Additionally, a COMS optical device was used to record the photograph of the breakdown channel.

2.4. Experimental Methods

The repetitive breakdown voltages and voltage dispersions of the corona-stabilized switch were recorded under different parameters and operating frequencies to illustrate the stability of repetitive breakdowns. Five different operating frequencies (1, 10, 100, 1000, and 2000) were employed. For each frequency, at least 50 consecutive breakdown processes were measured for both the breakdown voltage Ui and the breakdown channel image of the switch. Figure 5 shows the typical oscilloscope waveform of the repetitive breakdowns of the switch.
The level of breakdown voltage was characterized by calculating the mathematical expectation (U2a) of these consecutive voltages over a sample size of 49 (from the 2nd to the 50th) and normalizing their standard deviation σu.
U 2 a = 1 49 i = 1 49 U i
σ u = 1 49 i = 1 49 U 2 a U i U 2 a 2
to characterize the breakdown voltage dispersion. Figure 6 displays the superimposed breakdown channels of 50 consecutive breakdowns under a pulse repetition frequency of 100 Hz for a corona-stabilized switch filled with an SF6–N2 gas mixture at 0.1 MPa.

3. Results

In this section, the high-voltage pulse generator with adjustable PRFs (1–2000 Hz) was utilized to investigate the effects of parameters including field inhomogeneity, gas type, operating pressure, and gap spacing on the repetitive breakdown characteristics of the switch. At each condition, there were at least 50 breakdown processes observed during the repetitive breakdowns. The normalized standard deviation σ was used to represent the voltage dispersion of repetitive breakdowns.

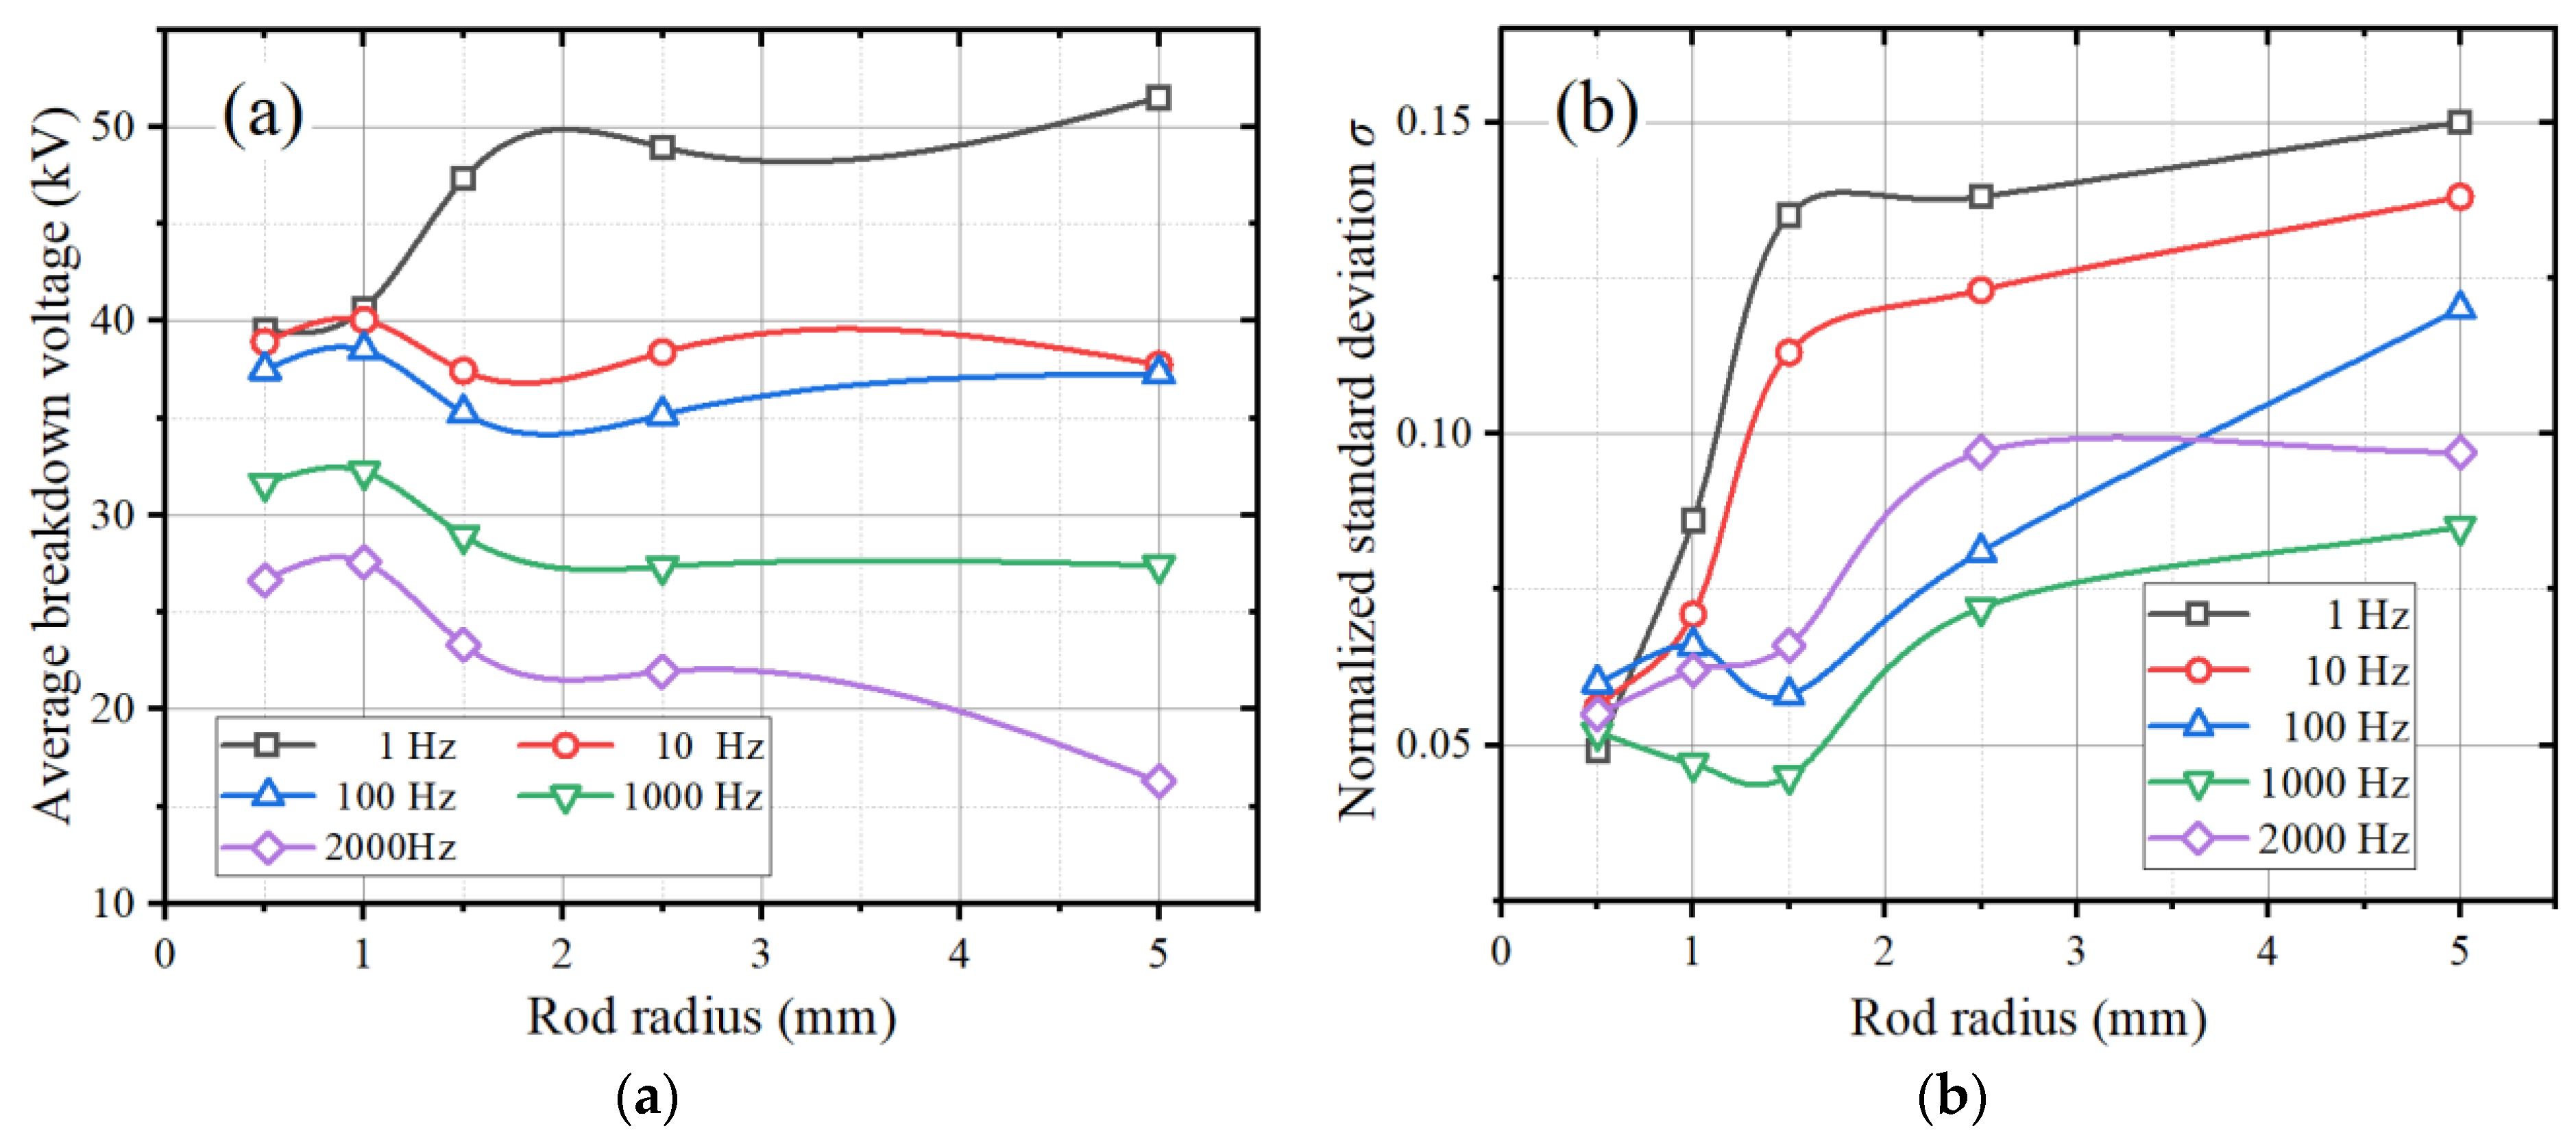
3.1. Field Inhomogeneity
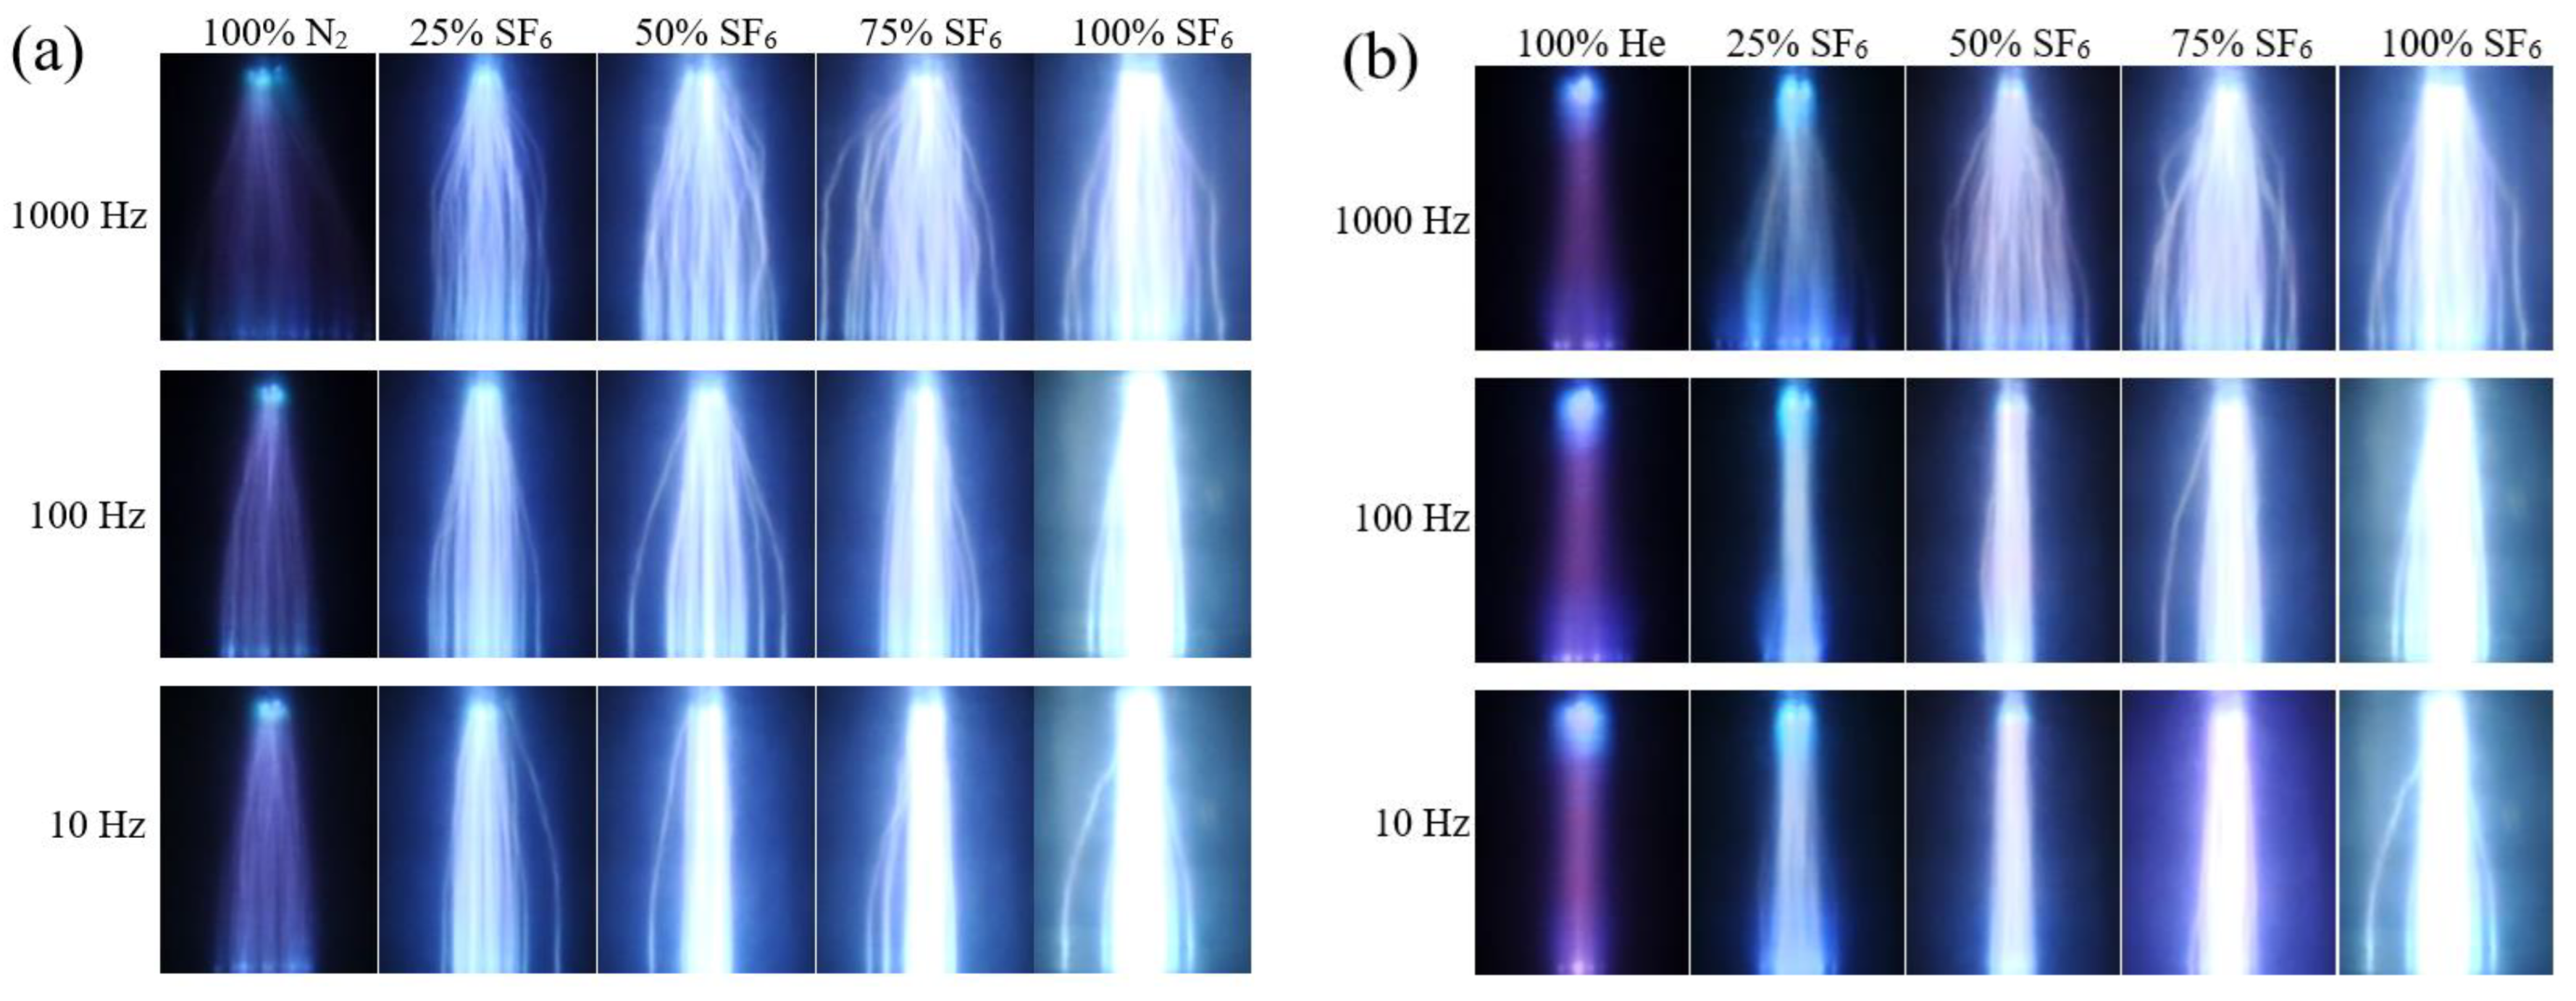
High-voltage electrodes with varying radii were utilized to investigate the impact of the field inhomogeneity degree (represented by inhomogeneity coefficients f) on the stability. Figure 7 displays the mathematical expectation of breakdown voltages and the normalized breakdown voltage dispersion for the corona-stabilized switch using rod electrodes in group R at different PRFs.
The breakdown voltage decreases as the repetition frequency increases. This is due to a shorter recovery interval and lower degree of insulation recovery caused by high frequency. At high frequencies, the breakdown voltage decreases as the degree of field inhomogeneity decreases, while at low frequencies, the breakdown voltage increases with a decrease in the degree of field inhomogeneity. When the insulation recovery time is 1 s (corresponding to the case of 1 Hz), it is generally considered that the insulation strength of the gap has almost fully recovered [14,22,23]. This indicates that improving the homogeneity of the electric field can improve the single breakdown voltage of the switch, but when the recovery time is short, increasing the uniformity of the field will reduce the working voltage, indicating that the insulation recovery performance of the switch in this situation deteriorates. For a switch operating at high frequencies, it is appropriate to use an electrode gap with a higher field inhomogeneity to achieve a higher operating voltage.
Switches with a highly inhomogeneous electric field exhibit minor differences in breakdown voltage between 1 Hz and 2000 Hz, while slightly inhomogeneous switches show significant discrepancies in breakdown voltage at low- and high-repetition frequencies. This may be because a switch with a more inhomogeneous field exhibits a faster rate of insulation recovery. After a preceding breakdown of 500 microseconds, the switch had recovered most of its insulation capacity. It is speculated that the strong corona stabilization effect dominates the insulation recovery when the gas density recovery degree is low, which accelerates insulation recovery [7,24,25]. The use of electrodes with lower inhomogeneity of the electric field will result in a deterioration in the insulation recovery performance of the corona-stabilized switch, and its insulation strength mainly recovers between 0.5 ms and 1.0 s, with a significantly slower recovery rate.
The difference between the two voltage curves in Figure 7a essentially characterizes the recovery in the gap insulation strength within the time interval corresponding to different frequencies. The non-uniform variation in breakdown voltage curves reflects the impact of the high-voltage electrode radius (field inhomogeneity) on the insulation recovery characteristics. The electric field becomes more homogeneous as the radius of the rod electrode increases, resulting in a gradual increase in the difference of the voltage curve at high- and low-repetition frequencies. Based on experience, a typical highly inhomogeneous field switch (r = 0.5 mm) can restore approximately 95% of the insulation strength within about 2.0 ms [13]. This indicates that for switches with a more homogeneous electric field distribution, most of their insulation recovers within a long interval of 5 ms to 1 s (corresponding to 2 kHz and 1 Hz respectively), resulting in a slow recovery rate. If the difference between the voltage curves is very small, it indicates that the insulation has barely recovered within the corresponding time interval [14,22,25]. There may be two reasons for this phenomenon: (1) the insulation strength of the switch has almost fully recovered before this time interval; (2) there is a mechanism that prevents the continuous restoration of insulation capability during this interval. A detailed analysis of the reasons for the phenomena will be conducted in Section 4.1.
On the other hand, as the inhomogeneity decreases, the stability of the corona-stabilized switch deteriorates. The switch that utilized electrode R1 (r = 0.5 mm) exhibited the best stability in terms of average breakdown voltage dispersion and dispersion fluctuation, while using the rod electrode R5 (r = 5.0 mm) resulted in the worst stability. This is because the electrode with a smaller radius had a more inhomogeneous electric field, resulting in stronger corona discharge activity around the high-voltage electrode and a more effective corona stabilization effect. As the radius of the rod increases, the field distribution becomes more uniform, the corona intensity during breakdown decreases, and the corona stabilization effect weakens.
The effect of corona stabilization in the switch is not only influenced by the intensity of corona discharge, but also by the distribution of the stable corona layer, which provides a shielding effect on the high-voltage electrode [13,14,15]. Therefore, this paper also investigated the mathematical expectation and normalized breakdown voltage dispersion of needle electrodes in group N at different repetition frequencies, as illustrated in Figure 8. The rod electrode R3 (r = 1.5 mm) was compared to the electrodes in group N, considering that the electrode R3 had the same rod radius as group N but a different tip structure.
The variation in the breakdown voltage of needle electrodes was generally smaller than that of the rod electrode R3, as shown in Figure 8a. Although the field inhomogeneity coefficient of needle electrodes is not very high and they all belong to slightly inhomogeneous field gaps (f ≤ 4) [26], needle electrodes with different cone angles exhibit similar and excellent insulation recovery performance. The voltage dispersions of the electrodes N1, N2, and N3 were similar to those of electrode R1, which performed the best among the rod electrodes (about 4–6%). The voltage dispersion of the electrode N4 with the largest cone angle was slightly higher than that of the other needle electrodes, but it still exhibited good breakdown stability compared to electrode R3.
In summary, the higher the inhomogeneity of the electric field in the corona stabilization switch, the faster its insulation recovery rate, and the better its repetitive breakdown stability. This may be due to the more effective corona stabilization effect caused by a stronger corona discharge. The effect of corona stabilization can not only improve the insulation recovery performance of the switch, but also effectively enhance the stability of repetitive breakdowns. However, to achieve an excellent corona stabilization effect, it is not necessary to solely rely on constantly reducing the radius of the rod electrode. Excellent repetitive breakdown stability and insulation recovery performance can also be achieved through cleverly designing the electrode structure such as using a needle electrode with multiple locations for concentrated fields.

3.2. Gas Type

Figure 9 displays the breakdown voltage and voltage dispersion of the corona-stabilized switch filled with various gas mediums at different frequencies.
Pure SF6 exhibits the optimal electrical strength performance, but diluting it with other gases that have a lower electrical strength can significantly reduce the switch’s withstand voltage level. In other words, adding SF6 to other gases can significantly improve the withstand voltage level of the mixtures. The variation in breakdown voltage curves at different frequencies indicates the insulation recovery characteristics of the gas media. The variation trends and amplitudes of the breakdown voltage for SF6–air and SF6–N2 mixtures at different repetition frequencies were similar to those of pure SF6, indicating that their insulation recovery characteristics are comparable after 500 μs of breakdown. The insulation recovery of air was slightly better than that of pure N2, which may be due to the presence of weakly electronegative gas O2. Considering its weak electronegativity, O2 can absorb the free electrons generated by the previous breakdown to form a few negative residual charges. These negative charges can also produce electrons to enhance the corona stabilization effect on subsequent breakdowns. However, it is obvious that the improvement in the insulation recovery performance of N2 by adding O2 is very limited. In SF6–He gas mixtures, the influence of SF6 content on the variation in the breakdown voltage at different repetition frequencies was greater than that of SF6–air and SF6–N2, indicating that the insulation recovery performance of SF6–He gas mixtures are more sensitive to the content of SF6.
The breakdown voltage dispersion of pure SF6 gas was generally lower than that of other gases (N2, air, and He), the voltage dispersion of N2 and air was similar, while helium had the maximum voltage dispersion. The difference in breakdown voltage dispersion of SF6 was minimal at different repetition frequencies. The dispersion of SF6–N2 and SF6–air was very similar, which may be attributed to the weak impact of O2, a gas with low electronegativity, on the repetitive breakdown stability of the mixture. In these two mixtures, the voltage dispersion did not decrease monotonously with the content of SF6. When the content of SF6 reached about 50%, there was a sudden increase in voltage dispersion, especially noticeable in the SF6–air mixture. As the SF6 content increased in the SF6–He mixture, there was initially a decrease and then an increase in the breakdown voltage dispersion.
It is worth noting that during the breakdown with high-repetition frequencies (≥1000 Hz), the dispersion of repetitive breakdown voltages in air and N2 was slightly higher than that in SF6. As the frequency decreased, the breakdown dispersion of N2 and air increased, and the stability of breakdown at lower frequencies worsened. However, the addition of SF6 to these two gases could improve their breakdown stability. The improvement effect became more obvious with an increase in the SF6 content. The breakdown stability of helium was very good during high-repetition frequency (≥1000 Hz) breakdown, comparable to that of pure SF6. However, as the frequency decreased, the breakdown stability of helium deteriorated sharply. The addition of SF6 to helium could also significantly reduce the breakdown voltage dispersion and improve stability.
In summary, the pure SF6 and SF6–He mixture exhibited the best stability for repetitive breakdowns. When the frequency reached 1000 Hz, SF6 exhibited the best breakdown stability, followed by SF6–He. When the frequency was <1000 Hz, SF6–He exhibited the best breakdown stability, followed by pure SF6 gas. The breakdown stability of SF6 deteriorated when it was diluted with air and N2. Additionally, the stability of the SF6 mixture deteriorated further as the concentration of diluted gas increased. These, once again, prove that the corona stabilization effect can significantly enhance switch stability during repetitive breakdowns.

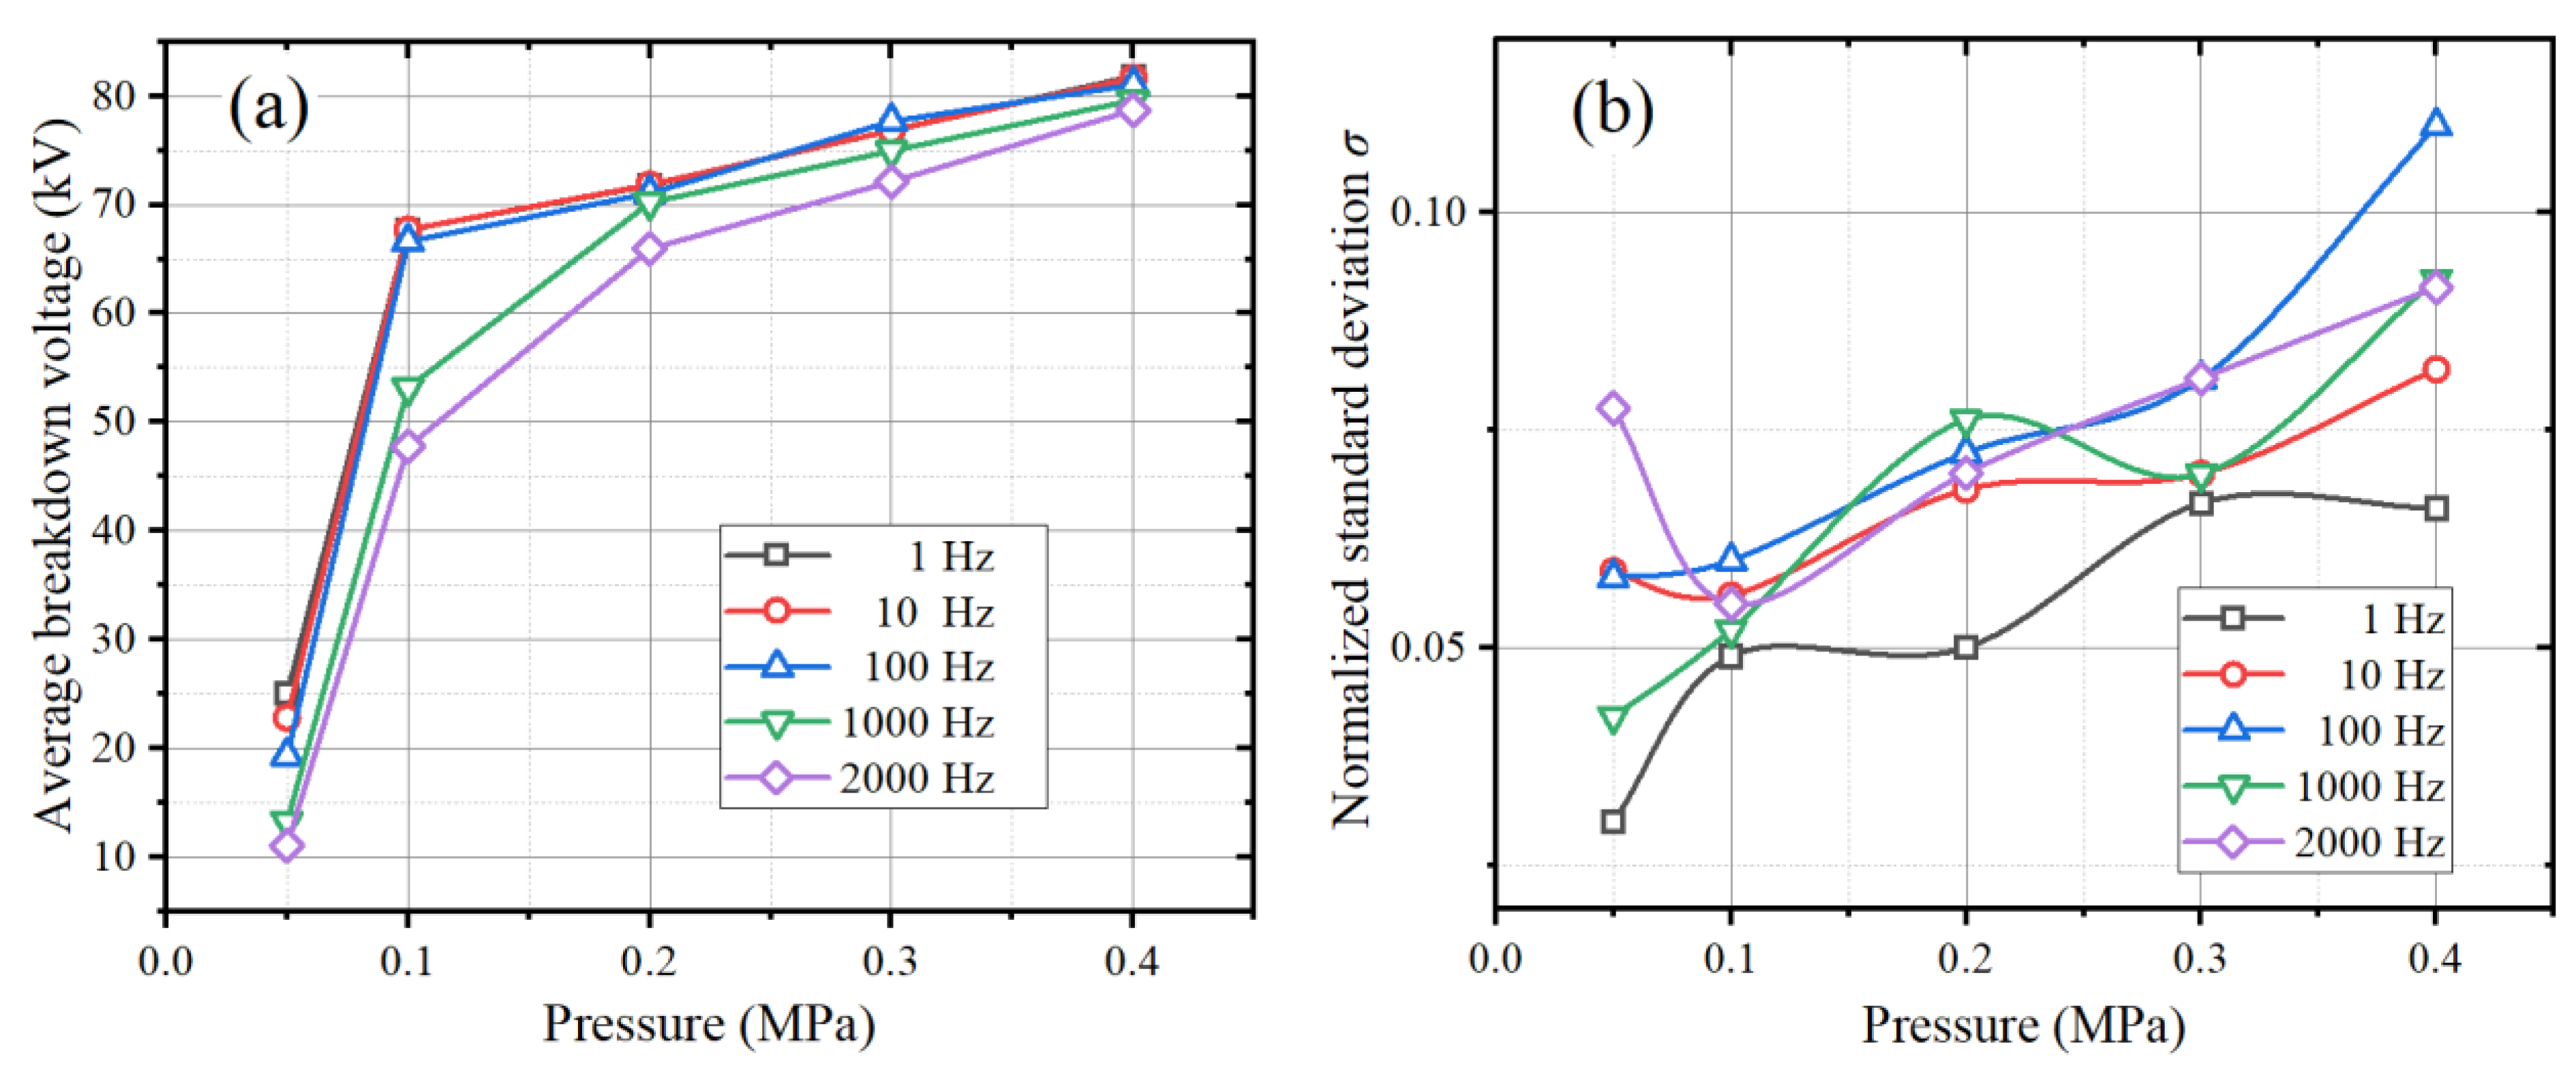
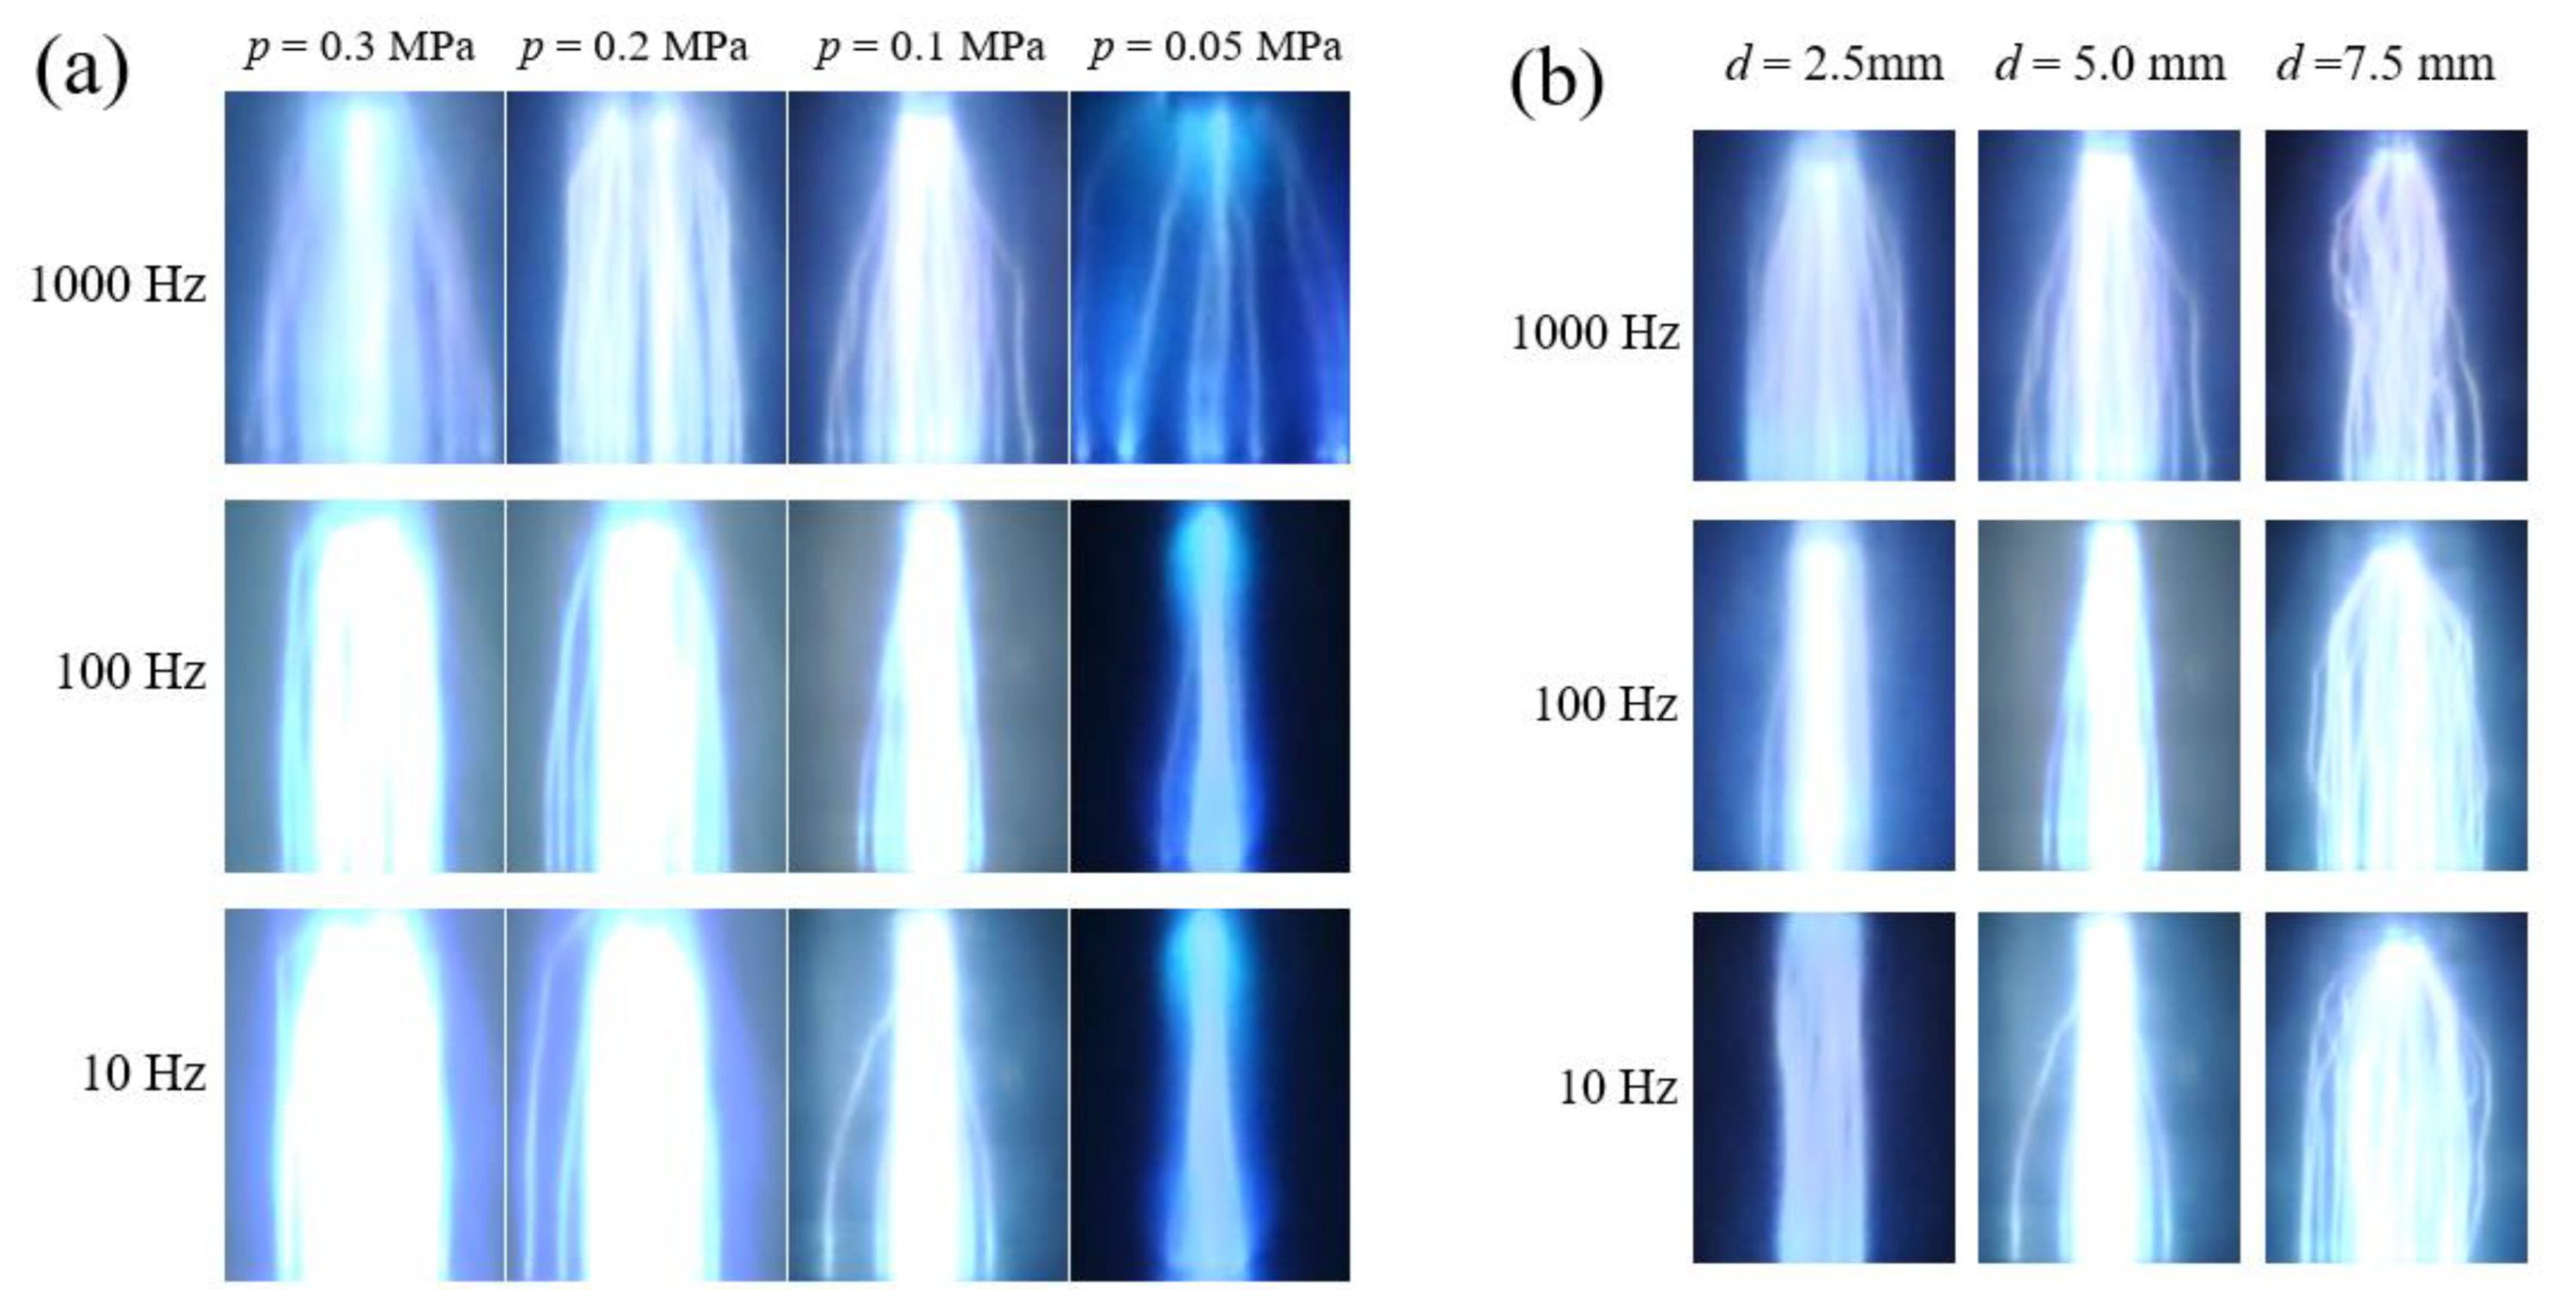
3.3. Operating Pressure
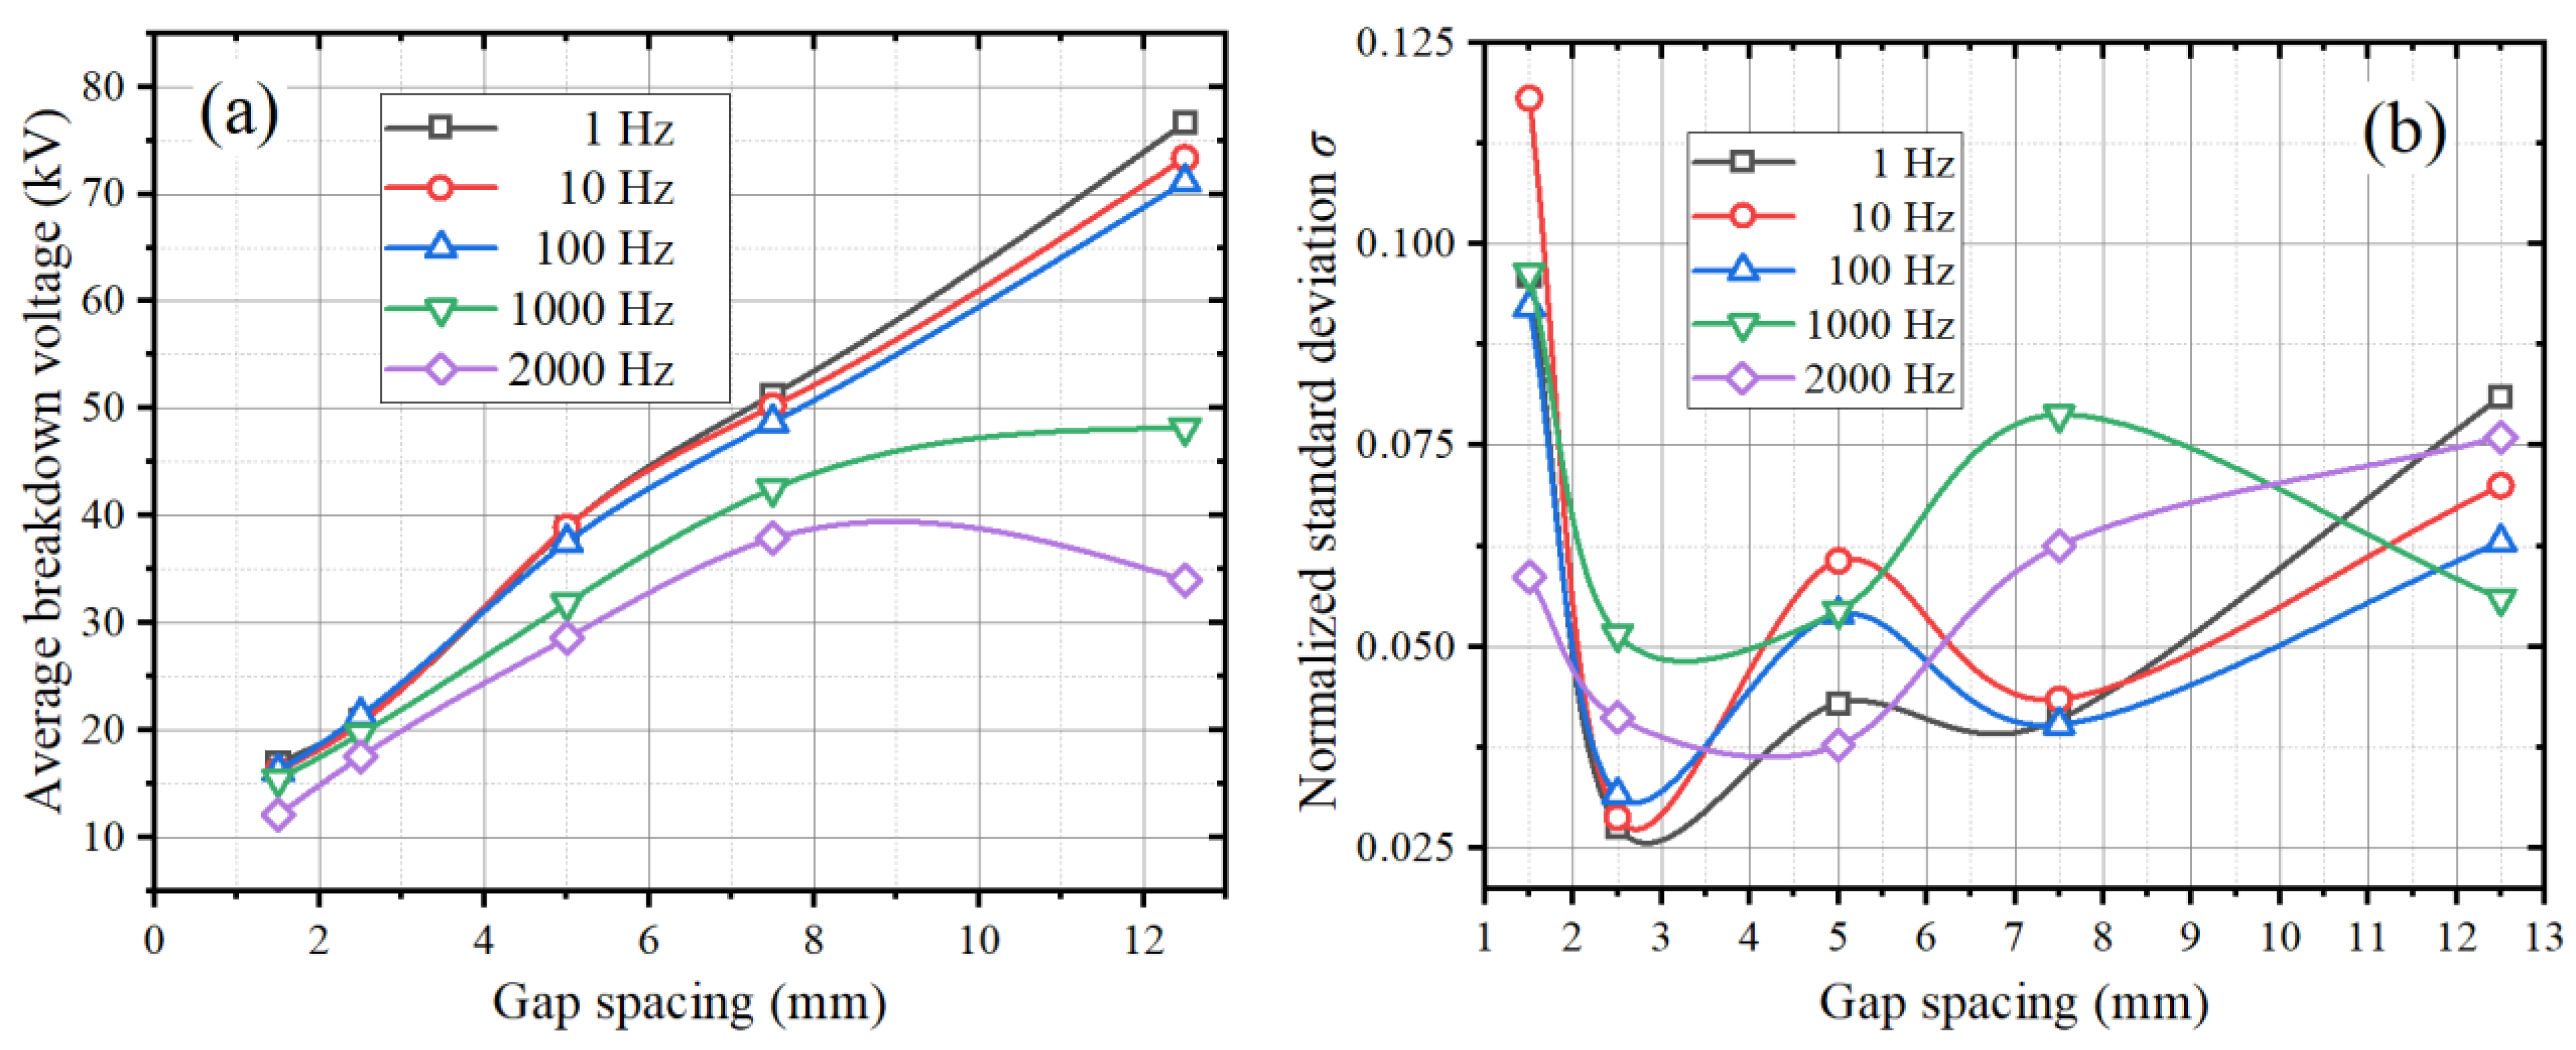
The influence of operating pressure on the breakdown voltage and voltage dispersion of the corona-stabilized switch is depicted in Figure 10. The higher the pressure of the switch, the less variation in breakdown voltage at different frequencies. This suggests that the insulation recovery degree of the switch changes less over time within a range of 500 μs to 1 s, indicating that most of the insulation capacity may have been recovered within 500 μs. The difference in breakdown voltage between switches with lower operating pressure at high- and low-repetition frequencies was significant, indicating that the insulation recovery time of the switch is longer and the recovery rate is slower.
The effect of pressure on the stability of repetitive breakdowns in a corona-stabilized switch can be summarized as follows: (1) high pressure can cause an increase in voltage dispersion and reduce the stability of the switch; (2) as the operating frequency decreases, there will be a slight improvement in the stability of repetitive breakdowns for the corona-stabilized switch with high pressure.

3.4. Gap Spacing

Figure 11 illustrates the impact of gap spacing on both the breakdown voltage and voltage dispersion of the corona-stabilized switch. When the gap spacing is very small (1.5 mm), the difference in breakdown voltage between different frequencies is minimal, but this difference gradually increases as the gap spacing increases. As the gap spacing increases, there is an approximately linear growth trend in the breakdown voltage of the switch. However, as the gap distance continues to increase, the difference between the breakdown voltage of the switch at high- and low-repetition frequencies becomes larger. This indicates that the insulation recovery performance of the switch gradually deteriorates with increasing gap distance.
When the gap spacing is small, the stability of repetitive breakdowns is generally poor, possibly due to the dominant factor being neutral gas density recovery rather than the corona-stabilization effect. The stability of repetitive breakdowns is slightly improved with an increase in gap spacing. In general, a small gap distance can lead to severe repetitive breakdown voltage dispersion. The large gap distance, although it has a certain improvement effect on repetitive breakdown stability, can also lead to poor insulation recovery performance of the switch. Therefore, the gap spacing selection of the switch needs to be moderate.

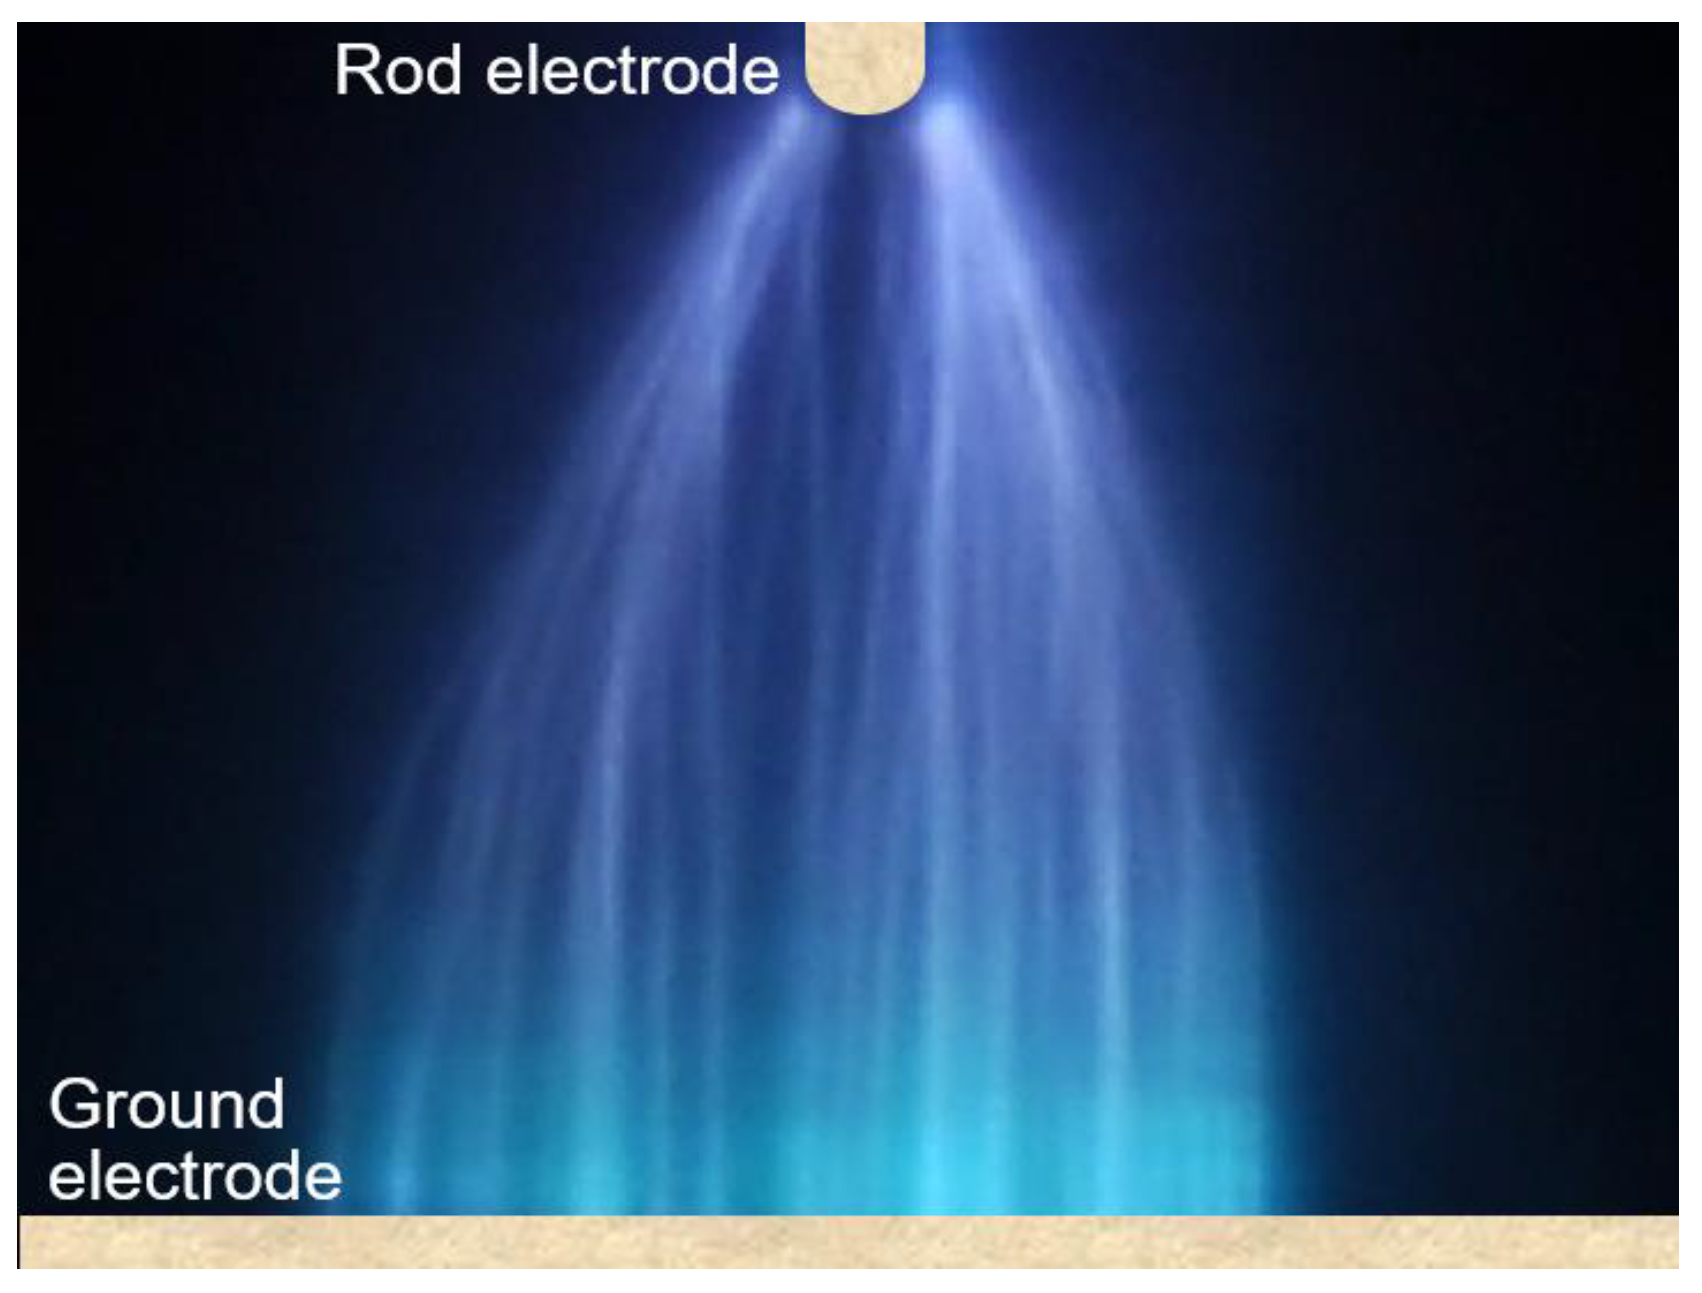
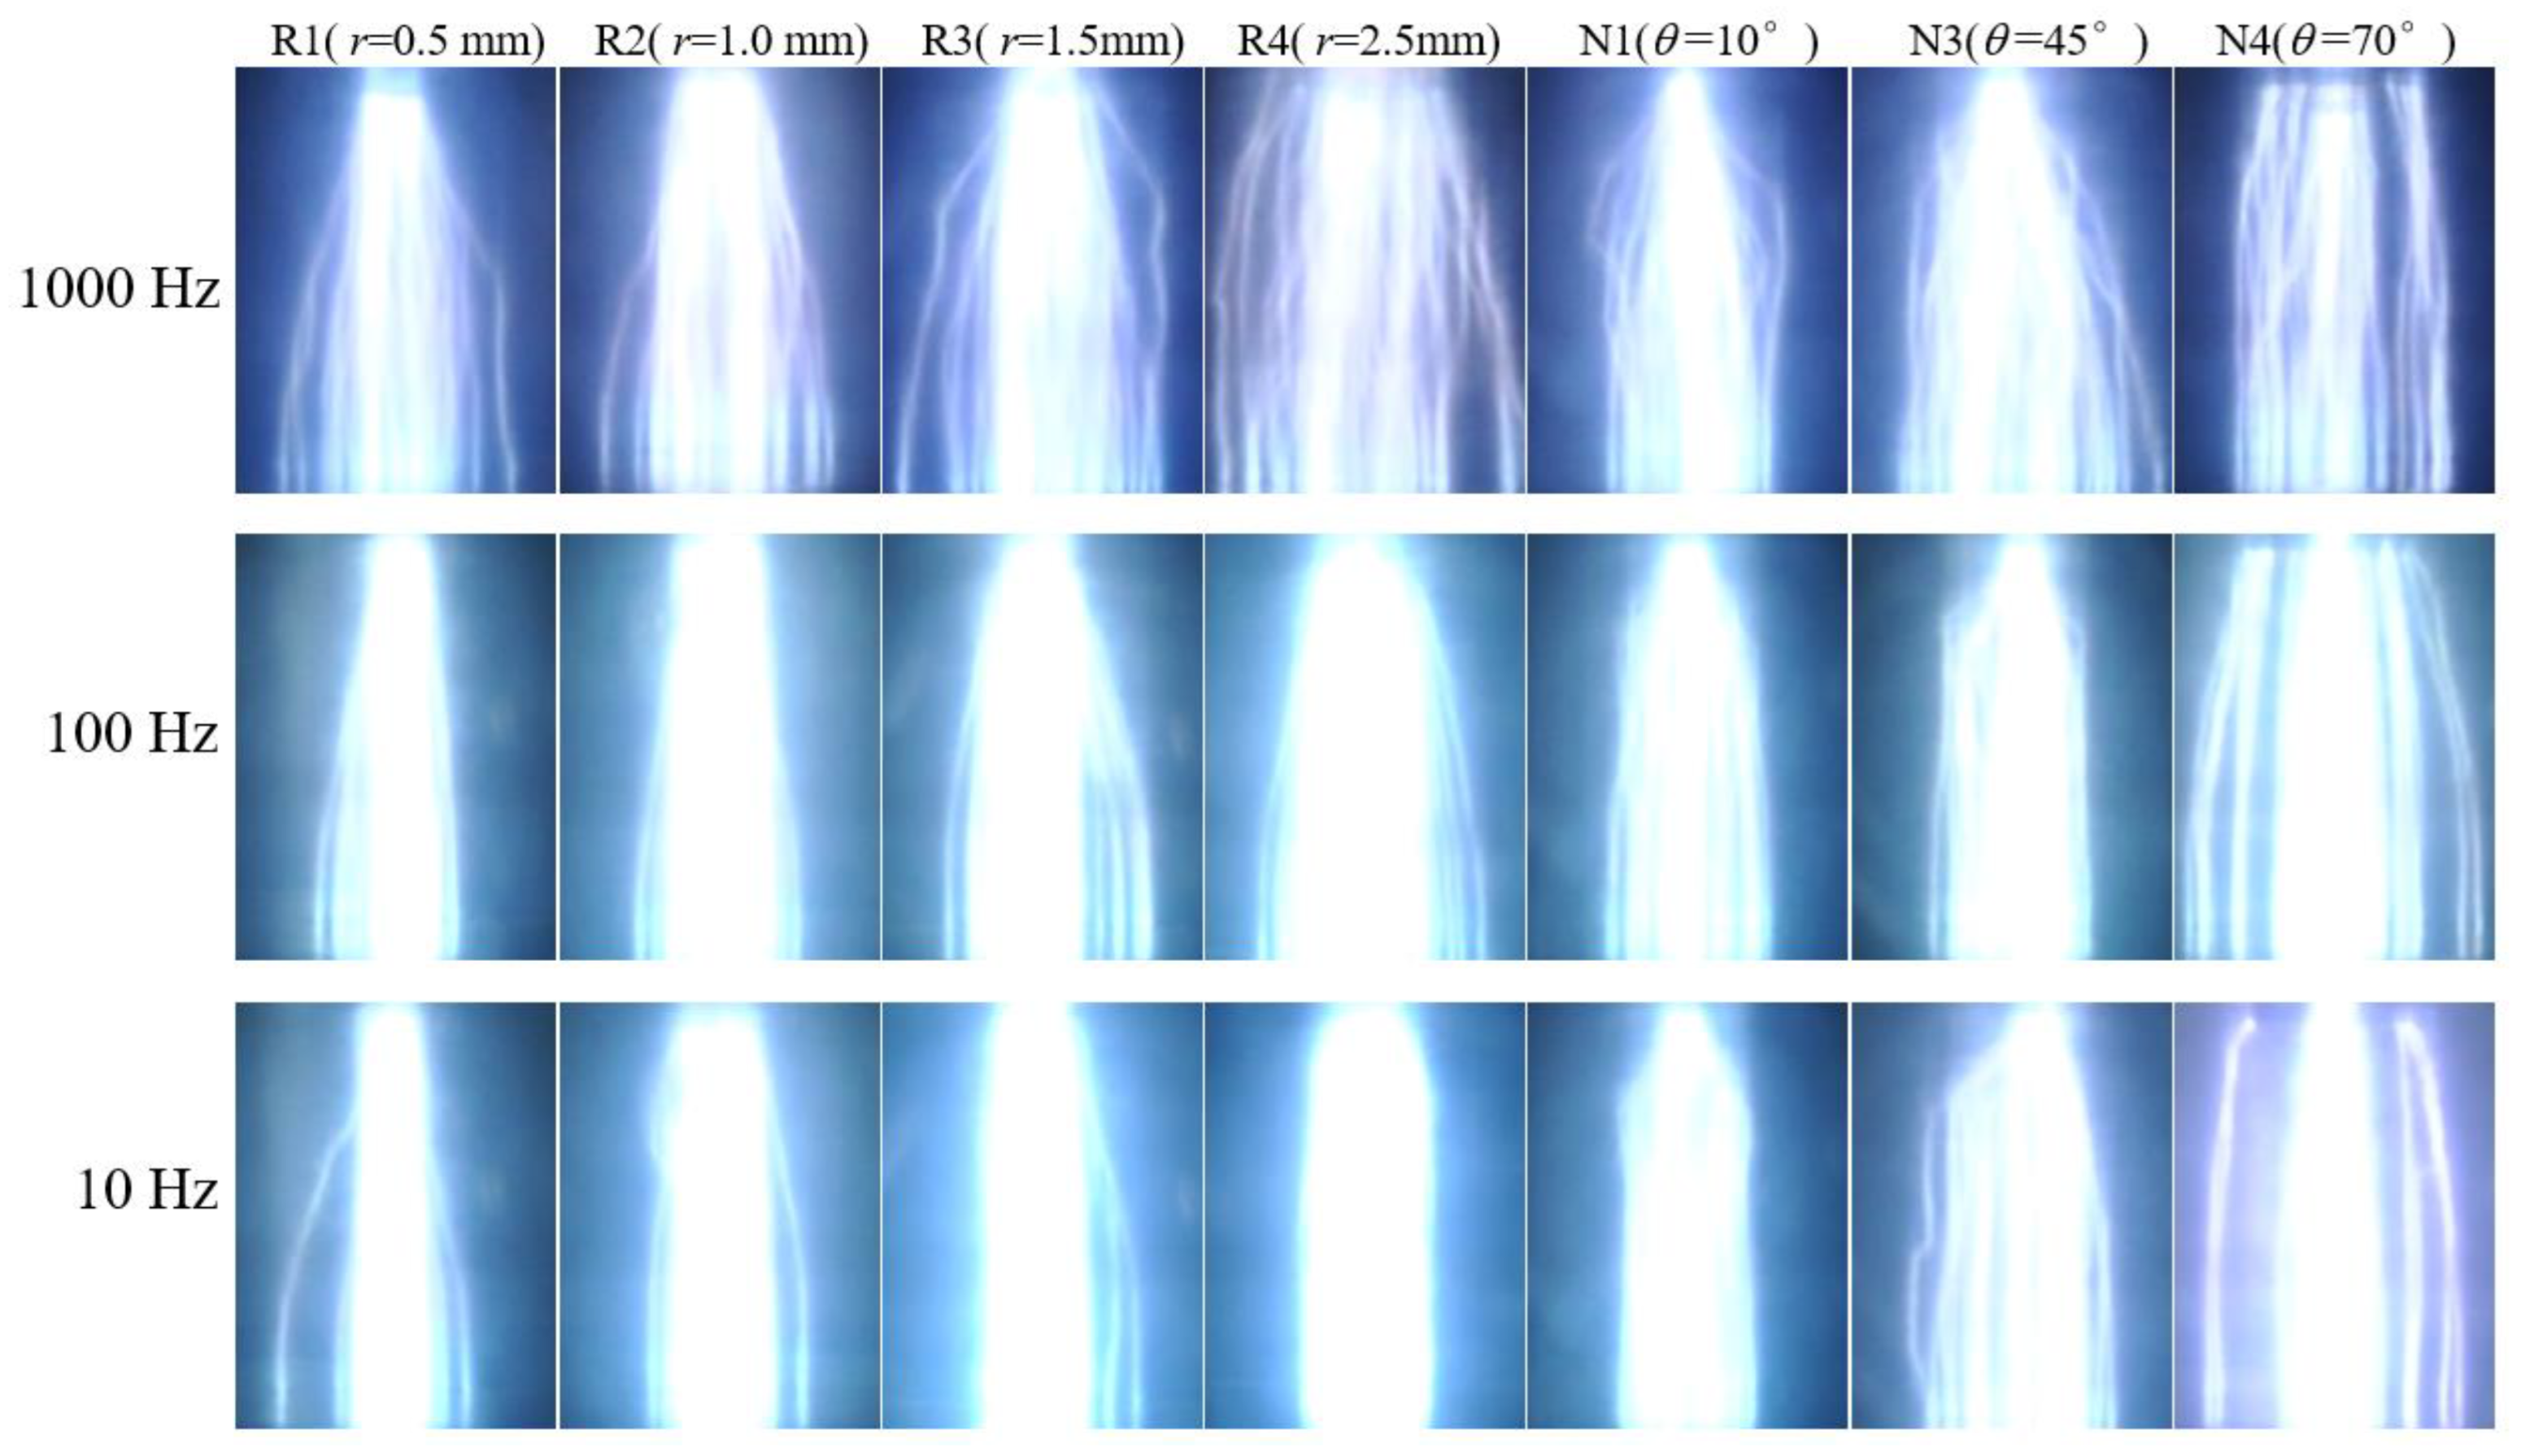
3.5. Optical Image of Discharge Channels

The subsequent process during repetitive breakdowns is inevitably influenced by the preceding one, as evidenced by changes in the morphology and distribution of the discharge channel. Therefore, the optical image of repetitive breakdowns in the corona-stabilized switch is analyzed under different working conditions in this section. The channels of 50 consecutive breakdown processes are superimposed on each photograph.
Figure 12 displays the optical images of the breakdown channels in a corona-stabilized switch with high-voltage electrodes of varying geometric structures at PRFs of 10, 100, and 1000 Hz. The most obvious pattern in optical imaging is that as the repetition frequency decreases, the breakdown channels become more concentrated near the electrode axis. In other words, breakdowns are more likely to develop along the axis of the electrode gap at low frequencies, while at higher operating frequencies, they may develop from multiple directions and paths.
The channel images of the corona-stabilized switch using different gas media at various repetition frequencies are shown in Figure 13. Regardless of whether the medium was pure gas (nitrogen, helium, and SF6) or a mixture (SF6–N2, SF6–He), the distribution of breakdown channels followed a similar pattern: at low-repetition frequencies, repetitive breakdown channels tended to concentrate in the axis direction of the electrode gap and its vicinity. As the operating frequency increased, the channels became more widely spread out. The trend is consistent with that of switches employing varying high-voltage electrodes. In addition, in mixtures of SF6–N2 and SF6–He, the channel became more dispersed as the content of SF6 gas increased under the same repetition frequency. This may be because the concentration of residual SF6 negative ions in the gap increases with a higher SF6 content, resulting in subsequent breakdowns occurring from multiple directions and a more dispersed distribution of the breakdown channels.
Figure 14 illustrates the impact of operating pressure and gap spacing on the distribution of the breakdown channels. The distribution of channels was more scattered at high-repetition frequency than at low-repetition frequency, which is consistent with the trend observed in switches with different electrode structures and gas media.

4. Discussion

The operating process of corona-stabilized switches involves the repetitive breakdown of highly inhomogeneous field gaps and the recovery of gas density within these gaps. Additionally, it is necessary to consider the impact of residual space charges generated during previous breakdowns on subsequent ones, which is known as the memory effect. Therefore, this section explores the underlying mechanisms of repetitive breakdowns in corona-stabilized switches from the perspectives of memory effects and electrostatic field characteristics. The memory effect mechanism was theoretically analyzed based on the behavior characteristics of residual charges, and simulation calculations were used to analyze the influence of switch parameters on the electrostatic field characteristics.

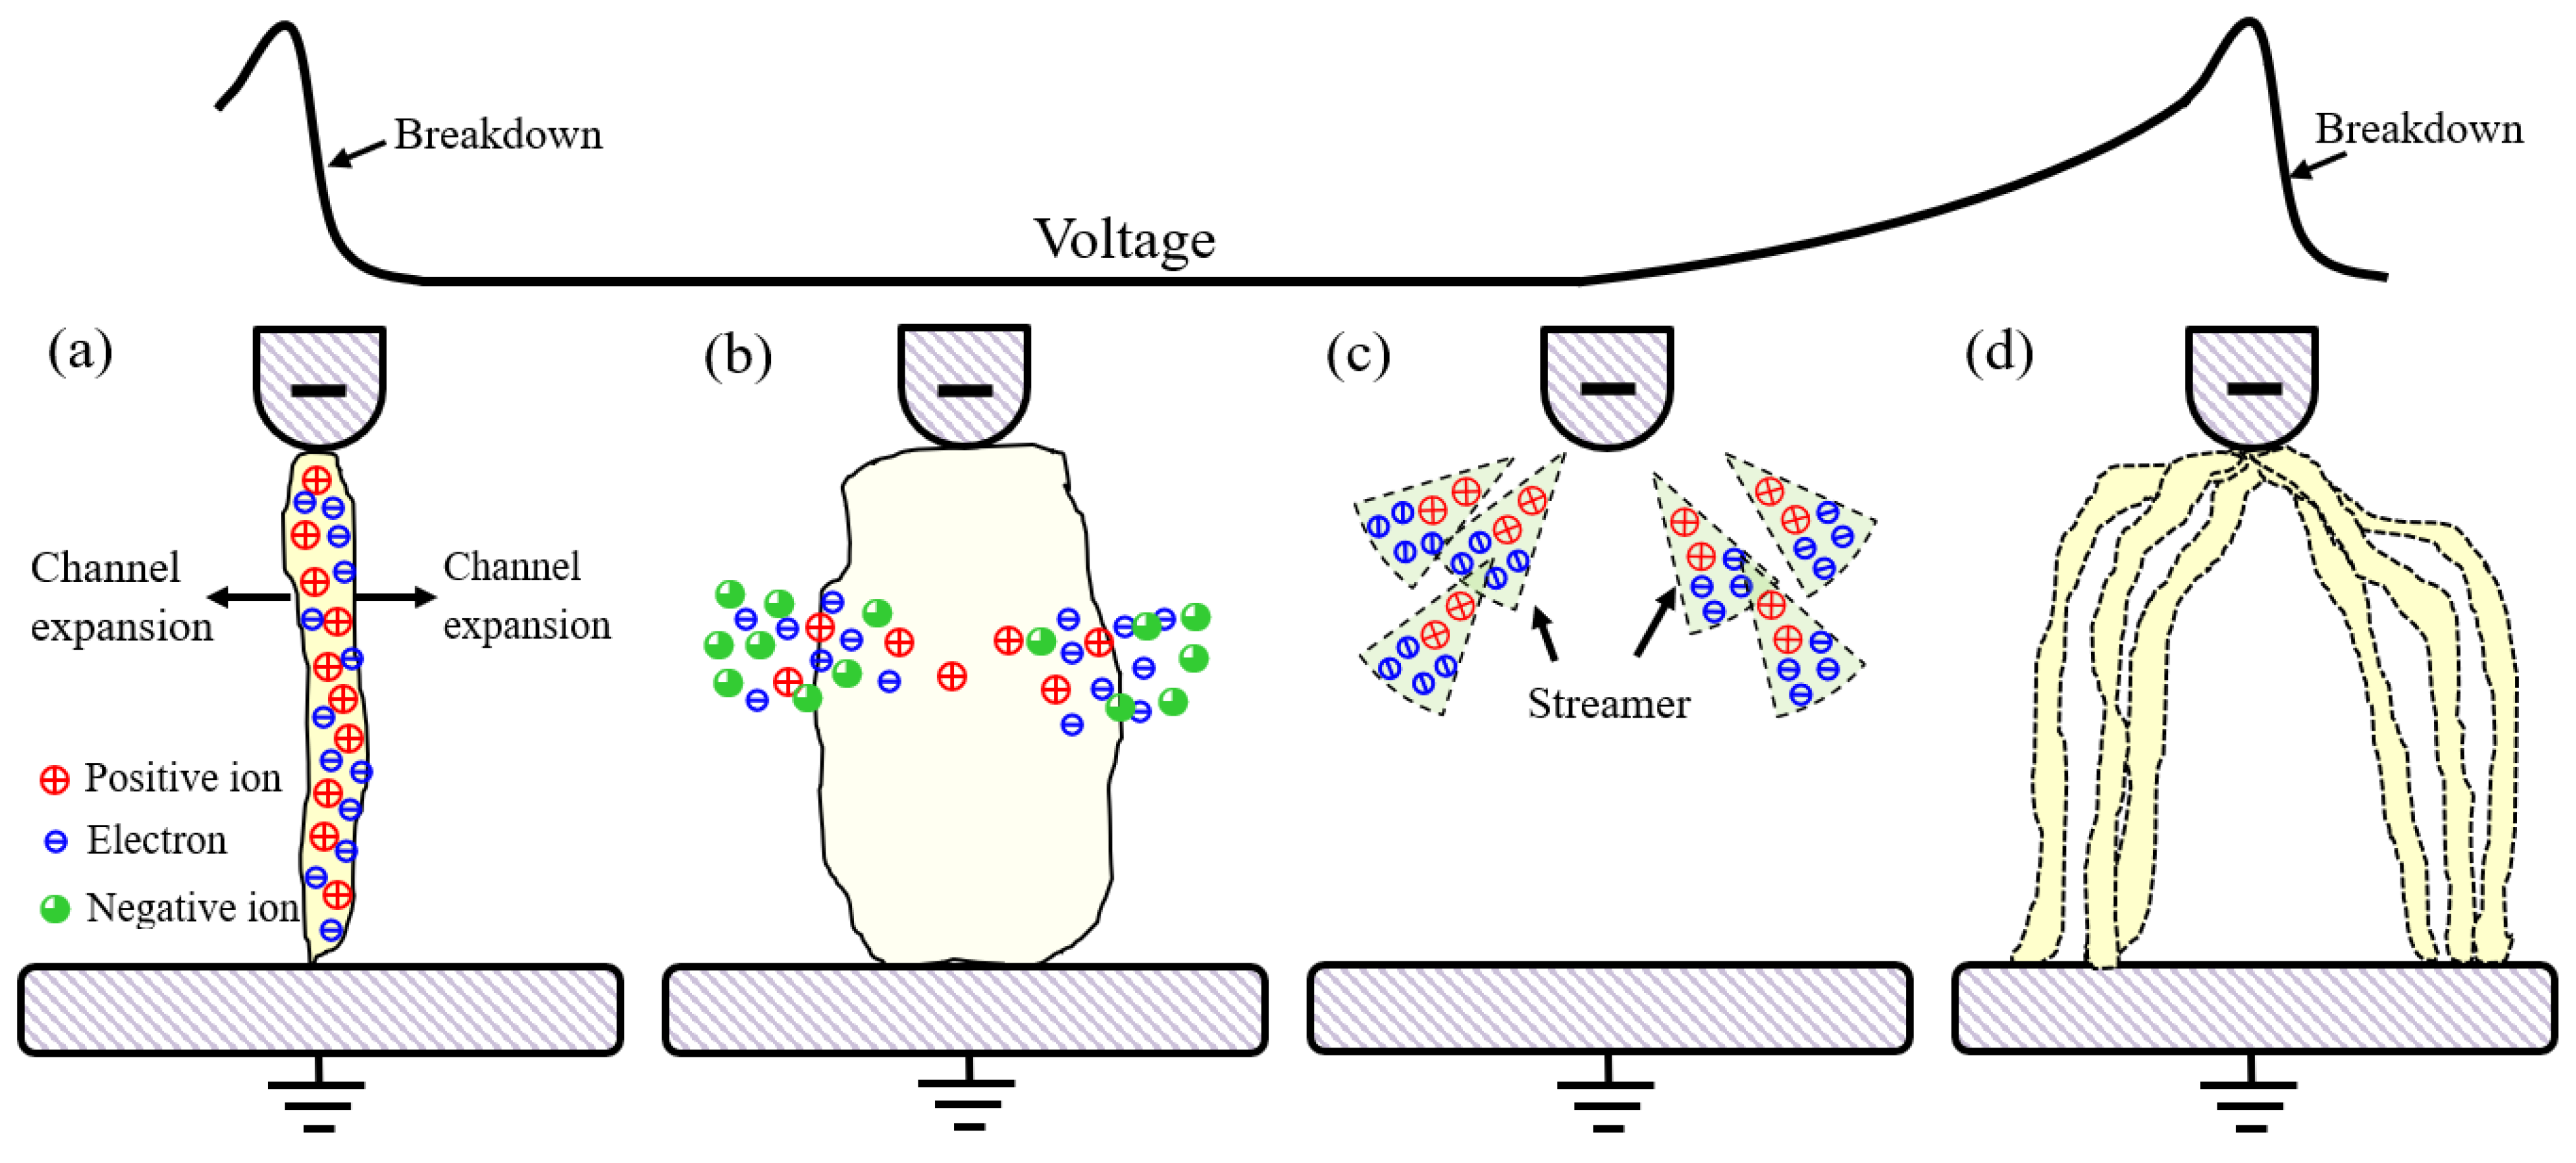
4.1. Behavior of Residual Space Charges

The main difference between repetitive breakdowns and single ones is that numerous residual space charges generated during the preceding discharge remain in the electrode gap, thereby affecting subsequent breakdown processes [13,14,15,27,28,29]. The impact of residual space charges on subsequent breakdown can be roughly divided into two aspects: (1) distorting the re-applied electric field, and (2) affecting the initiation and development of streamers [30,31]. Therefore, this section analyzes the impact of switch parameters on repetitive breakdowns based on these two aspects as follows.

4.1.1. Electric Field Inhomogeneity

Under pulsed voltage, gas switches equipped with a uniform-field electrode exhibited the poorest repetitive breakdown stability, as depicted in Figure 7. The reason for this is that in the switch using SF6 as the insulation medium, many negative SF6 ions were generated during the preceding breakdown due to the strong electronegativity of SF6 gas molecules. SF6 negative ions have a relatively long lifetime (hundreds of milliseconds) and can provide numerous initial electrons for subsequent breakdown through collision-induced de-attachment [14,24,32]. This greatly increases the probability of subsequent breakdown initiation, resulting in a lower breakdown voltage and poor insulation recovery of the switch.
The stability of gas switches with highly inhomogeneous fields is better under the same conditions because residual space charges play a different role in the breakdown process compared to homogeneous gap breakdown. Local corona discharge occurs prior to complete breakdown in the gap with a highly inhomogeneous field. The residual SF6 negative ions do not directly contribute to the complete breakdown of the gap by providing initial electrons through collision detachment. Instead, they preferentially participate in corona discharge, enhancing the corona-stabilization effect and improving the repetitive breakdown stability of the switch [13,14]. Therefore, switches with highly inhomogeneous electric field gaps exhibit better stability in repetitive breakdown and insulation recovery rate than those with uniform or slightly non-uniform electrode gaps due to their corona-stabilization effect under the same experimental conditions.
The field inhomogeneity of corona-stabilized switches using rod electrodes increases as the electrode radius decreases. A higher level of field inhomogeneity results in accelerated insulation recovery and enhanced stability of repetitive breakdowns due to the intensified field intensity surrounding the rod electrode during subsequent pulsed voltage. The electrons in neutral gas molecules and SF6 negative ions are more easily desorbed, resulting in a larger number of initial free electrons. This leads to a stronger corona discharge [33,34,35]. The corona space charges provide better shielding for the rod electrode and a stronger corona stabilization effect, resulting in improved repetitive breakdown stability and insulation recovery of the switch.
When the field inhomogeneity of the corona-stabilized switch is low, its repetitive breakdown voltage hardly recovers within 10–100 ms. This phenomenon, known as the “plateau” of insulation recovery, means that the withstand voltage level does not recover significantly over time, as shown in Figure 15. This is because when the inhomogeneity of the electric field is low, the intensity of corona discharge and the accumulation of space charges weaken, and the corona-stabilization effect during the breakdown is very weak or even negligible. In this case, the initial electrons provided by the residual space charge will directly serve the subsequent complete breakdown rather than the corona activity. Therefore, the relative difficulty of subsequent breakdown mainly depends on the concentration of residual space charges. As a result, during the residual SF6 negative ions existing, the relative breakdown difficulty will remain at a nearly constant level, corresponding to the “plateau” in the insulation recovery curve. As the recovery time increases, the residual space charge dissipates, and its impact on the subsequent breakdown weakens until it disappears. Consequently, the insulation ability of the switch continues to recover.

4.1.2. Gas Type

The insulation recovery performance and repetitive breakdown stability of N2 and air were poorer compared to the strong electronegative gas SF6. This is because N2 and air have weak electronegativity, resulting in a low ability to absorb electrons and form negative ions during the preceding breakdown [36,37]. The enhancement in the residual space charges in the strong electronegative gas SF6 during corona discharge was almost non-existent in N2 and air. Therefore, the relative difficulty of subsequent breakdown compared to the first breakdown did not significantly increase, and the insulation recovery characteristics of the switch were not significantly improved. In addition, due to the weak corona-stabilization effects of N2 and O2, the repetitive breakdown stability of corresponding gas switches was also inferior to that of SF6.
A “plateau” was also observed in the insulation recovery curves of N2 and air (see Figure 15). Since the electronegativity of these gas media was weaker than SF6, the mechanism behind this “plateau” was also different from that of SF6. Taking air as an example, residual space charges (positive and negative ions) and metastable particles will be generated in the electrode gap during the preceding breakdown. The lifetime of residual positive and negative ions is relatively short, and the recombination coefficient between ions is about 106 cm3/s under atmospheric pressure and room temperature [22,38,39]. Therefore, ions will quickly disappear through diffusion and recombination. However, the lifetime of metastable particles of N2 and O2 is very long (in seconds), and they are retained in the gaps even after almost all of the residual space charges have decayed [40]. These low-energy particles can release photons by colliding with other particles, causing the photoelectric effect on the cathode, or directly colliding with the cathode to release many initial electrons [38]. This improves the probability of discharge initiation for subsequent breakdown and reduces the level of breakdown voltage. Therefore, the relative difficulty of subsequent breakdown of the switch mainly depends on the concentration of metastable particles in the gap. During the existence of these metastable particles, the insulation recovery level (relative breakdown difficulty) will be maintained at a stable level, leading to the occurrence of the “plateau” phenomenon.

4.1.3. Pressure and Gas Spacing

The motion characteristics of space charges during a single breakdown is illustrated in Figure 16. Under pulsed voltage, the medium adjacent to the rod electrode undergoes collision ionization and forms streamer discharges. Positive SF6 ions generated by collision ionization slowly move toward the rod electrode and enter it under the influence of applied voltage, while electrons rapidly move toward the plate ground electrode. As the applied voltage increases, the number of streamer channels increases, leading to the formation of a stable corona layer that envelops the rod electrode. Due to their large volume and mass as well as poor mobility, positive SF6 ions tend to accumulate in significant quantities near the rod electrode rather than entering it. However, due to their high mobility, electrons quickly move toward the plane electrode, resulting in the formation of space-charge fields EI, EII, and EIII, as shown in Figure 16d. The space-charge field causes significant distortion to the distribution of the electric field in the gap, thereby affecting the breakdown process. The positive space charges generate an electric field EI in region I, which enhances the field intensity and facilitates meeting the conditions for self-sustaining discharge. Consequently, the initial electron avalanche can easily develop into a streamer discharge, resulting in corona formation. The electric field EII generated by positive space charges and electrons weakens the field intensity in region II, making it difficult for streamer corona to extend toward the plate electrode and cause breakdown. Therefore, the presence of space charge makes the negative rod-plate electrode more susceptible to corona discharge while making complete breakdown of the gap more difficult [41,42]. As a result, it exhibits a good corona-stabilization effect, repetitive breakdown stability, and excellent insulation recovery performance.
In the switch filled with SF6, the residual space charge is more difficult to move under high-pressure conditions. Therefore, more residual space charges remain in the discharge gap. As a result, when the subsequent voltage is applied, more initial free electrons will be generated through collision de-attachment, triggering more intense corona discharge. This effect enhances the corona stabilization during the subsequent breakdown, improving both the breakdown stability and insulation recovery performance of the switch. For a corona-stabilized switch operating at a pressure of 0.05 MPa, the density of the gas molecules decreases, causing space charges to enter the electrode more quickly. This results in a weakened distortion effect of space charges on the external electric field and leads to a deterioration in the switch’s insulation recovery (see Figure 15).
The relationship between gas pressure and breakdown voltage exhibited a saturation characteristic, as shown in Figure 10a. The transport and accumulation of space charges may be the primary cause of this phenomenon. When the pressure is low, space charges can easily move to a suitable position, resulting in a good corona-stabilization effect. Therefore, as the pressure increases (from 0.05 to 0.1 MPa), the electrical strength of the gap rapidly increases. However, as the pressure further increases (from 0.1 to 0.4 MPa), the mobility of the space charges deteriorates, as does the corona-stabilization effect. Consequently, the withstand voltage of the switch exhibits saturation characteristics [43,44].
The saturation characteristics of the breakdown voltage at 2 kHz were less apparent than those at 1 Hz. This may be because there could still be residual space charges remaining from the preceding breakdown within a recovery time of 0.5 ms. These residual charges will participate in the subsequent breakdown development, enhancing the corona-stabilization effect and causing significant changes in the breakdown voltage with gas pressure, thereby weakening the saturation characteristics. When the operating frequency decreased, the residual space charges almost completely disappeared, and their corona-enhancement effect on subsequent breakdown became very weak. Therefore, the saturation characteristic of the breakdown voltage-pressure curve becomes more pronounced.
The breakdown stability of the switch is optimal at low-pressure conditions; however, it gradually deteriorates with an increase in operating pressure. This trend contradicts that of insulation recovery performance. This may be because as the working pressure increases, the gas density also increases, leading to a decrease in space charge mobility. Meanwhile, the rate of the applied voltage increase remains unchanged. Therefore, during breakdown in a high-pressure gas switch, it becomes difficult for space charges to move to appropriate positions and fulfill their role in improving the spatial electric field distribution. Furthermore, under high pressure, a significant number of positive space charges accumulate around the rod electrode and form a well-defined corona layer. Although this increases the electric field in area I and further strengthens the intensity of corona discharge, the corona hinders breakdown from occurring along the shortest distance (axis) of the electrode gap and forces it to bypass the stable corona layer. Consequently, channels of breakdown develop with a more tortuous morphology and over a longer path, as shown in Figure 14a.
When the gap spacing is very small (1.5 mm), the difference in breakdown voltage between different frequencies is minimal, but this difference gradually increases as the gap spacing increases. The small gap spacing may hinder the formation of a stable corona layer around the high-voltage electrode, thereby limiting the effectiveness of corona discharge in preventing premature breakdown. As a result, gas density replaces the corona-stabilization effect and dominates the recovery of insulation strength within 500 μs. The stabilization effect of corona discharge gradually becomes more prominent and dominates the insulation strength of the gap with increasing gap spacing, resulting in an approximate linear increase trend in breakdown voltage. However, as the gap spacing increases further, the distance between the corona layer and plate electrode (i.e., low-field region) also increases correspondingly, as shown in Figure 17. This results in an electric field that is more inhomogeneous in the low-field region, which weakens the corona-stabilization effect and leads to a decrease in repetitive breakdown voltage.

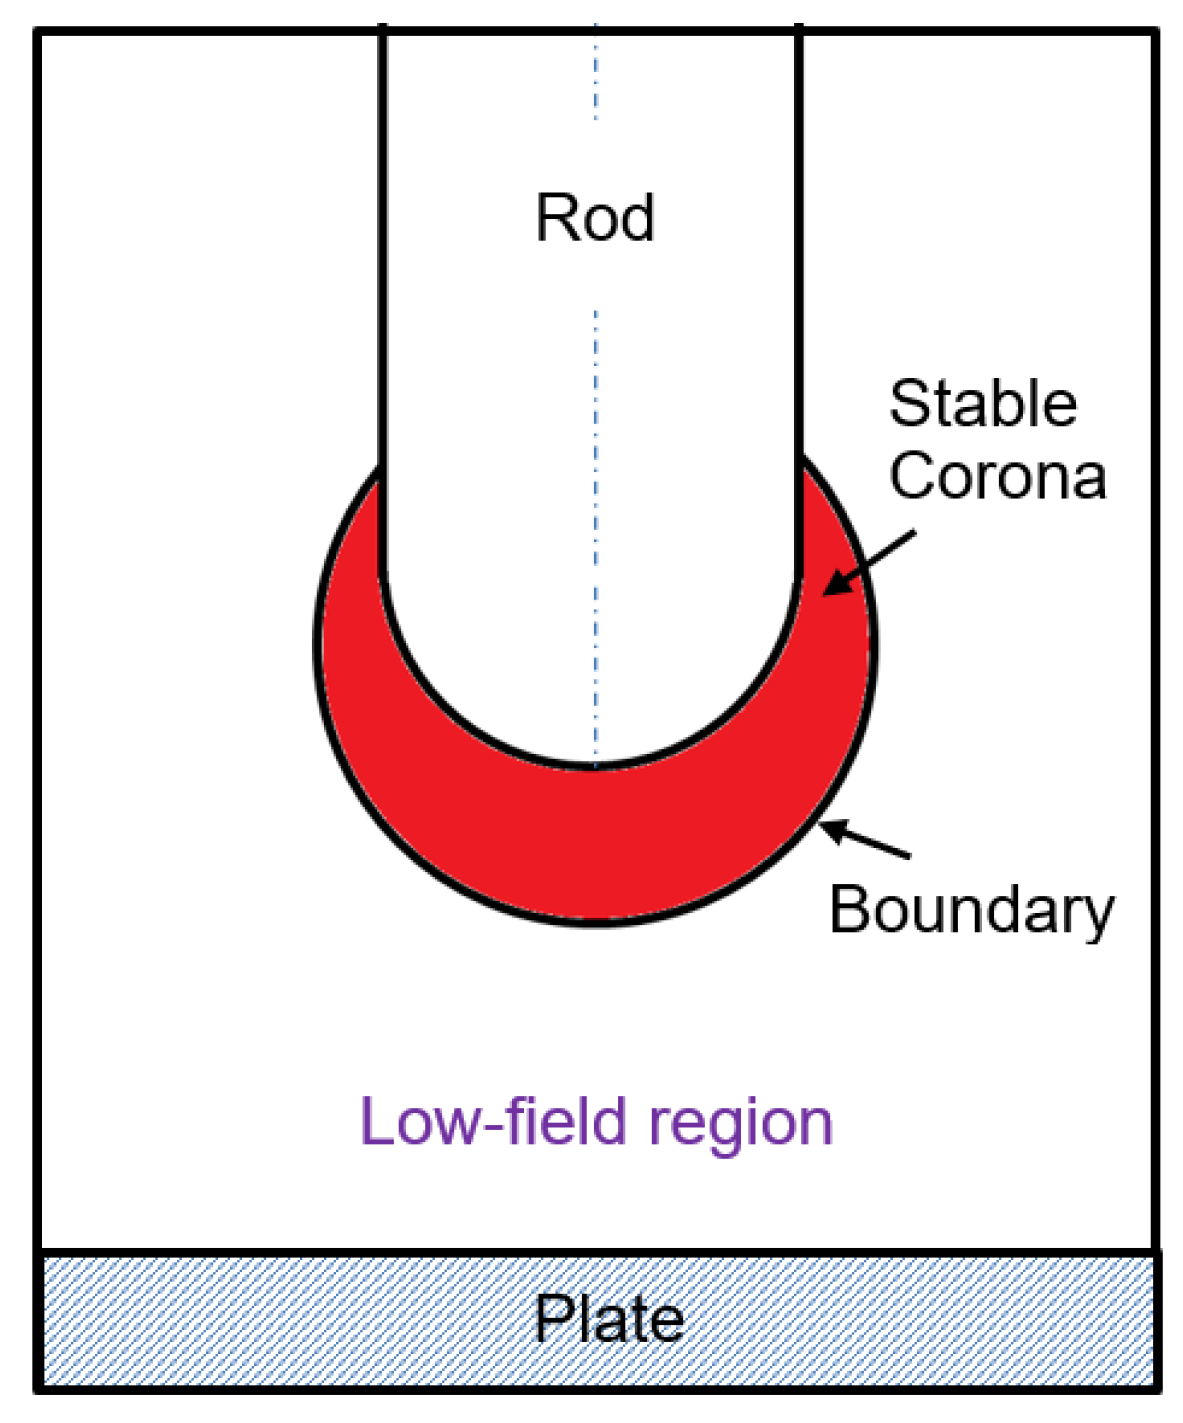
4.2. Distribution of Discharge Channels

Residual space charges have a significant impact on the initiation and development of subsequent breakdowns [45,46]. Therefore, the distribution characteristics of discharge channels for repetitive breakdowns in corona-stabilized switches can be explained by the diffusion mechanism of residual space charges.
After the breakdown is completed, many residual space charges remain in the channel. The HTHP (high-temperature and high-pressure) discharge plasma expands outward as a cylindrical shock wave, causing the diffusion of residual charges toward both sides of the channel, as illustrated in Figure 18a. Due to the strong electronegativity of SF6 gas molecules, the residual charges mainly consist of SF6 negative ions in corona-stabilized switches. During repetitive breakdowns with a high-repetition frequency, numerous SF6 negative ions migrate to both sides of the channel and disperse in the electrode gap, as shown in Figure 18b. The subsequent voltage causes electron desorption from SF6 negative ions, providing a significant number of initial free electrons for subsequent breakdown events. Due to the dispersed distribution of negative ions, the initial electrons are also scattered throughout, resulting in an electron avalanche that can initiate and propagate from various directions (see Figure 18c). As a result, the channel distribution of repetitive corona-stabilized switch exhibits dispersion.
In cases where the repetition frequency is low, most residual SF6 negative ions dissipate before the next voltage arrives due to a longer recovery time of the switch after the previous discharge has ended. This weakens their influence on subsequent breakdown and makes it easier for a breakdown channel to develop along the shortest distance (axis) of the electrode gap. As a result, there is a more concentrated distribution of discharge channels during breakdown processes with low-repetition frequency, while they are significantly more dispersed during high repetition frequency breakdowns.
As the radius of high-voltage electrodes increases in corona-stabilized switches, the distribution of repetitive breakdown channels becomes more dispersed. The larger surface area of the thicker rod electrode may limit the expansion of the HTHP plasma channel, resulting in the almost radial development of shock waves along the discharge channel and migration of residual space charges to both sides of the electrode axis. A smaller electrode radius leads to a more dispersed diffusion direction of shock waves, a faster dissipation of residual charges, and a faster recovery rate for neutral gas density. Therefore, axial development tends to occur in the breakdown channel.
From Figure 13, it can be observed that whether pure gases (N2, He, and SF6) or mixed gases (SF6–N2, SF6–He) were utilized, the distribution of repetitive breakdown channels followed a consistent pattern: at low repetition rates, multiple channels tend to concentrate along the axis direction of the electrode gap. As the frequency increases, the distribution of breakdown channels becomes more dispersed. This pattern is consistent with the channels for switches with different electrode shapes. Additionally, in the SF6–N2 and SF6–He mixtures, at the same repetition frequency, the higher the SF6 content in the mixture, the more dispersed its breakdown channels become. This phenomenon is related to the concentration of residual SF6 negative ions in the discharge gap. The higher the SF6 content, the greater concentration of residual SF6 negative ions after breakdown occurs, leading to the possibility of subsequent breakdown developing in multiple directions and resulting in a more dispersed distribution of channels.
The effect of operating pressure on the distribution of repetitive breakdown channels in corona-stabilized switches is shown in Figure 14a. The dispersion of channel distribution at high-repetition frequency is greater than that at low-repetition frequency, which is consistent with the pattern of the switch with different electrodes and gas types. In addition, the higher the operating pressure, the more dispersed the channel distribution is, and the larger the gap distance, the more dispersed the channels. Based on the analysis in Figure 18 and Section 4.1.3, these phenomena are also easy to explain, that is, the higher the pressure, the worse the mobility of the residual space charges, and the better their shielding effect on the high-voltage electrode. A discharge cannot easily turn into breakdown passing a strong corona region, so it can only occur by bypassing the corona region. The larger the gap distance, the faster the shock waves diffuse in the channel. Therefore, a larger distribution range of residual space charges leads to greater breakdown dispersion.

4.3. Electrostatic Field Characteristics

The motion and distribution of space charges are insufficient to reveal the repetitive breakdown stability of needle electrodes. Therefore, this section further analyzes how the electrostatic field characteristics of the gap influence repetitive corona-stabilization breakdown by introducing the critical volume. It has been revealed that the propagation of streamer corona in SF6 gaps is mainly influenced by the electrostatic field conditions [47,48]. The critical volume is generally utilized to characterize the electrostatic field of highly inhomogeneous field gaps [15,47]. It refers to a region near the high-curvature electrode: the electrons present in this region will trigger electron avalanches, causing them to reach the critical size and form a stable corona layer. In theory, the critical volume should be formed by two curved surfaces. The initial electrons accelerate from the inner surface that are close to the high curvature electrode, and their acceleration distance is just enough to form an electron avalanche of critical size. The outer surface of the critical volume is where the effective collision ionization coefficient is zero. The internal surface has little impact on the working performance of the corona-stabilized switch. Therefore, this article mainly focused on the external surface characteristics.
This section analyzes the influence of the spatial electric field distribution on the repetitive breakdown stability and insulation recovery of corona-stabilized switches from an electrostatic field perspective. The field distribution of the switch with different needle electrodes was simulated using commercial software, and the boundary of the stable corona layer was defined based on the critical breakdown field strength Ec = 885 kV/(cm·MPa) [49,50]. Figure 19 shows the corona envelope of needle electrodes with different structural features.
Based on the results of the electrostatic field, the needle electrode exhibited good stability in repetitive breakdown and insulation recovery due to its unique geometry, which created a concentrated electric field not only at the tip, but also at the connection location between the tip and rod. A smaller cone angle of the needle electrode leads to a higher inhomogeneity of the electric field at its tip, resulting in stronger corona discharge intensity and a better stabilization effect on breakdown. When the cone angle of the electrode increases, although the electric field at its tip becomes more uniform, the electric field at the connection location between the tip and rod will also increase accordingly. This results in a corona layer forming over a larger area around the tip of the electrode, which still provides good shielding and stabilization effects (such as N4).

5. Conclusions

In this paper, the effects of crucial parameters of the corona-stabilized switch including electric field inhomogeneity, gas type, operating pressure, and gap spacing on the breakdown voltage and voltage dispersion of repetitive breakdowns were investigated. The main conclusions are as follows:
(1)
The electrode with a higher field inhomogeneity results in less voltage dispersion and better stability of the switch during repetitive breakdowns. The voltage dispersion of repetitive breakdowns increases as the electric field becomes more homogeneous, and this pattern is particularly noticeable at low-repetition frequencies. The pure SF6 and SF6–He mixtures had the smallest voltage dispersion and the best breakdown stability. The stability of SF6 deteriorated after being diluted with air and N2 and will continue to worsen as the SF6 content decreases. The dispersion of the breakdown voltage increased as the operating pressure increased. The voltage dispersion changed with the gap spacing in a nonlinear trend. There was an optimal gap spacing to ensure optimal breakdown stability, as a too large or too small gap spacing will lead to poor breakdown stability.
(2)
The corona-stabilization effect, in general, is the core factor that determines the stability of the switch. The highly inhomogeneous field and the presence of a strong electronegative gas medium can improve the stability of the switch, as these parameters enhance the corona-stabilization effect during repetitive breakdowns. Corona stabilization can not only improve the stability during repetitive breakdowns, but also enhance the insulation recovery performance of the switch.
(3)
The effect of corona stabilization on insulation recovery is basically monotonic, but its impact on repetitive breakdown stability is relatively complex. For switches with different levels of electric field inhomogeneity, a better corona-stabilization effect leads to better repetitive breakdown stability. In switches with different gas media, the stronger the corona stabilization effect, the better the repetitive breakdown stability. In these two types of switches, the stronger the corona-stabilization effect, the faster the insulation recovery of the switch. However, operating at high pressures can accelerate insulation recovery in the switch, but it may also decrease its stability. For switches with different gap spacings, it is not necessary that the better the corona-stabilization effect, the better the insulation recovery and repetitive breakdown stability. Instead, there exists an optimal distance at which the switch can achieve good breakdown stability and insulation recovery performance. Therefore, considering only the intensity of corona stabilization is insufficient for understanding the underlying mechanism for repetitive breakdown in the switch. The influence of the memory effect caused by residual spatial transport characteristics must be fully considered. This view is supported by the experimental results using different needle electrodes.

Author Contributions

Conceptualization, L.L. and C.Y.; Methodology, L.L.; Software, Y.F.; Validation, G.X., X.X. and B.W.; Formal analysis, B.W.; Investigation, L.L.; Resources, B.W.; Data curation, G.X.; Writing—original draft preparation, L.L.; Writing—review and editing, Y.F.; Visualization, C.Y.; Supervision, B.W.; Project administration, X.X.; Funding acquisition, L.L. All authors have read and agreed to the published version of the manuscript.

Funding

This work was supported by the National Natural Science Foundation of China (Program No. 62201457), the Natural Science Basic Research Program of Shaanxi (Program Nos. 2022JQ-588 and 2022JM-404 & 2023-JC-QN-0490), and the Fundamental Research Funds for the Central Universities, CHD (Program Nos. 300102322102, 300102383203).

Institutional Review Board Statement

Not applicable.

Informed Consent Statement

Not applicable.

Data Availability Statement

Data are contained within the article.

Acknowledgments

The authors thank the anonymous reviewers and editors who reviewed an earlier version of part of this work.

Conflicts of Interest

The authors declare no conflict of interest. The funders had no role in the design of the study; in the collection, analyses, or interpretation of data; in the writing of the manuscript; or in the decision to publish the results.

References

  1. Zhang, C.; Wang, R.; Yan, P.; Shao, T. Atmospheric-pressure pulsed discharges and plasmas: Mechanism, characteristics and applications. High Volt. 2018, 3, 14–20. [Google Scholar]
  2. Jinno, R.; Komuro, A.; Yanai, H.; Ono, R. Antitumor abscopal effects in mice induced by normal tissue irradiation using pulsed streamer discharge plasma. J. Phys. D Appl. Phys. 2022, 55, 17LT01. [Google Scholar] [CrossRef]
  3. Zhao, Z.; Huang, Z.; Zheng, X.; Li, C.; Sun, A.; Li, J. Evolutions of repetitively pulsed positive streamer discharge in electronegative gas mixtures at high pressure. Plasma Sources Sci. Technol. 2022, 31, 075006. [Google Scholar] [CrossRef]
  4. Wang, X.; Gao, Y.; Zhang, S.; Sun, H.; Shao, T. Nanosecond pulsed plasma assisted dry reforming of CH4: The effect of plasma operating parameters. Appl. Energy 1999, 243, 132–144. [Google Scholar] [CrossRef]
  5. Li, L.; Zhao, Z.; Liu, Y.; Li, C.; Ren, J.; Li, J. Repetitive gas-discharge closing switches for pulsed power applications. IEEE Trans. Plasma Sci. 2019, 47, 4237–4249. [Google Scholar] [CrossRef]
  6. Larsson, A. Gas-discharge closing switches and their time jitter. IEEE Trans. Plasma Sci. 2012, 40, 2431–2442. [Google Scholar] [CrossRef]
  7. Li, L.; Li, J.; Zhao, Z. Effect of switch parameters and polarity on the repetitive performance of a corona-stabilized switch viewed from behavior of space charge. Phys. Plasmas 2020, 27, 043509. [Google Scholar] [CrossRef]
  8. MacGregor, S.J.; Turnbull, S.M.; Tuema, F.A.; Farish, O. Factors affecting and methods of improving the pulse repetition frequency of pulse-charged and DC-charged high-pressure gas switches. IEEE Trans. Plasma Sci. 1997, 25, 110–117. [Google Scholar] [CrossRef]
  9. Macgregor, S.J.; Tuema, F.A.; Turnbull, S.M. The operation of repetitive high-pressure spark gap switches. J. Phys. D Appl. Phys. 1999, 26, 954–958. [Google Scholar] [CrossRef]
  10. Koutsoubis, J.M.; MacGregor, S.J. Effects of gas type on high repetition rate performance of a triggered, corona stabilized switch. IEEE Trans. Dielectr. Electr. Insul. 2003, 10, 245–255. [Google Scholar] [CrossRef]
  11. Sarkar, P.; Smith, I.R.; Novac, B.M.; Miller, R.A.; Graven, R.M. A high-average power self-break closing switch for high repetition rate applications. In Proceedings of the 2006 IET Pulsed Power Symposium, Warrington, UK, 11–12 October 2006; pp. 62–65. [Google Scholar]
  12. Beveridge, J.R.; MacGregor, S.J.; Given, M.J.; Timoshkin, I.V. A corona-stabilised plasma closing switch. IEEE Trans. Dielectr. Electr. Insul. 2009, 16, 948–955. [Google Scholar] [CrossRef]
  13. Li, L.; Li, J.; Zhao, Z.; Li, C. Effect of pressure on repetitive performance a corona-stabilized plasma closing switch. Phys. Plasmas 2020, 27, 023508. [Google Scholar] [CrossRef]
  14. Li, L.; Huang, Z.; Li, J. Effect of gas type on insulation recovery performance and repetitive breakdown stability of a corona-stabilized plasma closing switch. J. Appl. Phys. 2020, 128, 073302. [Google Scholar] [CrossRef]
  15. Li, L.; Huang, Z.; Yang, Y. The influence of electric field inhomogeneity on repetitive performance of a corona-stabilized Switch. IEEE Access 2020, 8, 195515–195527. [Google Scholar] [CrossRef]
  16. Larsson, A.; Yap, D.; Lim, Y.W. Time Jitter Study of a Corona-Stabilized Closing Switch. IEEE Trans. Plasma Sci. 2012, 40, 749–754. [Google Scholar] [CrossRef]
  17. Given, M.J.; Timoshkin, I.V.; Wilson, M.P.; Macgregor, S.J.; Lehr, J.M. A novel design for a multistage corona stabilized closing switch. IEEE Trans. Dielectr. Electr. Insul. 2011, 18, 983–989. [Google Scholar] [CrossRef]
  18. Gao, P.C.; Zeng, B.; Chen, J.; Su, J.; Li, R.; Zhao, L. Experimental investigation on the breakdown voltage dispersion of corona-stabilized switch at low repetition rate. IEEE Trans. Plasma Sci. 2017, 45, 2351–2357. [Google Scholar] [CrossRef]
  19. Maller, V.N.; Naidu, M.S. Advances in High Voltage Insulation and Arc Interruption in SF6 and Vacuum; Pergamon Press: New York, NY, USA, 1981. [Google Scholar]
  20. Koutsoubis, J.M.; Thoma, K.; MacGregar, S.J. Electrode erosion and lifetime performance of a triggered corona-stabilized switch in SF6 at a repetition rate of 1 kHz. IEEE Trans. Dielectr. Electr. Insul. 2016, 23, 1985–1995. [Google Scholar] [CrossRef]
  21. Clalmers, I.D.; Qui, X.Q.; Coventry, P. The study of SF6 mixtures with buffer gases. In Gaseous Dielectrics IX; Christiophorou, L.G., Olthoff, K., Eds.; Pergamon Press: New York, NY, USA, 1998. [Google Scholar]
  22. Cai, X.; Zou, X.; Wang, X.; Wang, L.; Guan, Z.; Jiang, W. Recovery of gas density in a nitrogen gap after breakdown. Appl. Phys. Lett. 2010, 97, 101501. [Google Scholar] [CrossRef]
  23. Zhao, Z.; Huang, D.; Wang, Y.; Li, C.; Li, J. Volume and surface memory effects on evolution of streamer dynamics along gas/solid interface in high-pressure nitrogen under long-term repetitive nanosecond pulses. Plasma Sources Sci. Technol. 2019, 29, 103182. [Google Scholar] [CrossRef]
  24. Zhao, Z.; Dai, Z.; Sun, A.; Li, J. Streamer to precursor transition in N2–SF6 mixtures under positive repetitive sub-microsecond pulses. High Volt. 2022, 7, 382–389. [Google Scholar] [CrossRef]
  25. Lu, Y.; Fan, Y.; Shi, L.; Qiao, H.; Xia, W.; Zhu, Y. Experiment research of high voltage nanosecond gas switch’s insulation recovery. High Volt. Eng. 2015, 14, 1852–1856. (In Chinese) [Google Scholar]
  26. Nijdam, S.; Teunissen, J.; Ebert, U. The physics of streamer discharge phenomena. Plasma Sources Sci. Technol. 2020, 29, 103001. [Google Scholar] [CrossRef]
  27. Zhao, Z.; Li, J. Repetitively pulsed gas discharges: Memory effect and discharge mode transition. High Volt. 2020, 5, 569–582. [Google Scholar] [CrossRef]
  28. Akishev, Y.S.; Aponin, G.; Balakirev, A.; Grushin, M.; Karalnik, V.; Petryakov, A.; Trushkin, N.I. ‘Memory’ and sustention of microdischarges in a steady-state DBD: Volume plasma or surface charge? Plasma Sources Sci. Technol. 2011, 20, 024005. [Google Scholar] [CrossRef]
  29. You, H.; Zhang, Q.; Ma, J.; Qin, Y.; Wen, T.; Guo, C.; Zhang, Y. Follow phenomenon of breakdown voltage in SF6 under lightning impulse. IEEE Trans. Dielect. Electr. Insul. 2016, 23, 2677–2684. [Google Scholar] [CrossRef]
  30. Cheng, X.; Yang, P.; Ge, G.; Wu, Q.; Xie, W. Dynamic dielectric recovery performance of serial vacuum and SF6 gaps in HVDC interruption and its regulation method. Plasma Sci. Technol. 2019, 21, 074010. [Google Scholar] [CrossRef]
  31. Hayakawa, N.; Hatta, K.; Okabe, S.; Okubo, H. Streamer and leader discharge propagation characteristics leading to breakdown in electronegative gases. IEEE Trans. Dielectr. Electr. Insul. 2006, 13, 842–849. [Google Scholar] [CrossRef]
  32. Wang, W.; Yan, J.; Rong, M.; Mruphy, A.B.; Spencer, J.M. Theoretical investigation of the decay of an SF6 gas-blast arc using a two-temperature hydrodynamic model. J. Phys. D Appl. Phys. 2013, 46, 065203. [Google Scholar] [CrossRef]
  33. Nam, S.H.; Rahaman, H.; Heo, H. Empirical analysis of high pressure SF6 gas breakdown strength in a spark gap switch. IEEE Trans. Dielectr. Electr. Insul. 2009, 16, 1106–1110. [Google Scholar] [CrossRef]
  34. Hinterholzer, T.; Boeck, W. Breakdown in SF6 influenced by corona-stabilization. In Proceedings of the 2000 Annual Report Conference on Electrical Insulation and Dielectric Phenomena, Victoria, BC, Canada, 15–18 October 2002; p. 416. [Google Scholar]
  35. Wang, F.; Liu, W.; Lin, X.; Xia, Y.; Xu, J. Study on the mathematical model of dielectric recovery characteristics in high voltage SF6 circuit breaker. Plasma Sci. Technol. 2016, 18, 223–229. [Google Scholar]
  36. Wang, W.; Rong, M.; Wu, Y. Transport coefficients of high temperature SF6-He mixtures used in switching applications as an alternative to pure SF6. Plasma Chem. Plasma Process. 2014, 34, 899–916. [Google Scholar] [CrossRef]
  37. Ghorui, S.; Heberlein, J.V.R.; Pfender, E. Thermodynamic and transport properties of two-temperature nitrogen-oxygen plasma. Plasma Chem. Plasma Process. 2008, 28, 553–582. [Google Scholar] [CrossRef]
  38. Shao, T.; Sun, G.; Yan, P.; Wang, J.; Yuan, W.; Sun, Y.; Zhang, S. An experimental investigation of repetitive nanosecond-pulse breakdown in air. J. Phys. D Appl. Phys. 2006, 39, 2192–2197. [Google Scholar]
  39. Shao, T.; Sun, G.; Yan, P.; Wang, J.; Yuan, W.; Sun, Y.; Zhang, S. Breakdown phenomena in nitrogen due to repetitive nanosecond-pulses. IEEE Trans. Dielectr. Electr. Insul. 2007, 14, 813–819. [Google Scholar] [CrossRef]
  40. Hartmann, G.; Gallimberti, I. The influence of metastable molecules on the streamer progression. J. Phys. D Appl. Phys. 1975, 8, 670–680. [Google Scholar] [CrossRef]
  41. Zhao, Z.; Li, C.; Guo, Y.; Zheng, X.; Sun, A.; Li, J. Streamer dynamics and periodical discharge regime transitions under repetitive nanosecond pulses with airflow. Plasma Sources Sci. Technol. 2023, 32, 015002. [Google Scholar] [CrossRef]
  42. Starikovskiy, A.Y.; Aleksandrov, N.L. How pulse polarity and photoionization control streamer discharge development in long air gaps. Plasma Sources Sci. Technol. 2020, 29, 075004. [Google Scholar] [CrossRef]
  43. Chen, Z.; Jia, W.; Guo, F.; Li, J. Variation and Saturated Phenomena of Polypropylene Film Flashover Voltage under Different SF6 Pressures. IEEE Trans. Plasma Sci. 2019, 47, 4553–4559. [Google Scholar] [CrossRef]
  44. Zhang, L.; Huang, G.; Wu, J.; Zhang, Q.; Guo, A.; Yang, H. Hump Phenomena and Mechanism of SF6 Gas Discharge under Impulse Voltages. High Volt. Eng. 2018, 44, 527–533. (In Chinese) [Google Scholar]
  45. Pejović, M.M.; Živanović, E.N.; Pejovic, M.; Karamarkovic, J. Analysis of processes responsible for the memory effect in air at low pressures. Plasma Sources Sci. Technol. 2010, 19, 04502. [Google Scholar] [CrossRef]
  46. Kazemi, M.R.; Sugai, T.; Tokuchi, A.; Jiang, W. Study of pulsed atmospheric discharge using solid-state LTD. IEEE Trans. Plasma Sci. 2017, 45, 2323–2327. [Google Scholar] [CrossRef]
  47. Zhao, X.; Yao, X.; Guo, Z.; Li, J.; Si, W.; Li, Y. Characteristics and development mechanisms of partial discharge in SF6 gas under impulse voltages. IEEE Trans. Plasma Sci. 2011, 39, 668–674. [Google Scholar] [CrossRef]
  48. Han, S.; Choi, E.; Cho, G. Breakdown temperature of electrons in SF6 gas. Appl. Phys. Lett. 2010, 97, 161501. [Google Scholar]
  49. Han, S.; Byeon, Y.; Song, K.; Choi, E.; Ryu, H.; Lee, J. Analytical investigation of electrical breakdown properties in a nitrogen-SF6 mixture gas. Phys. Plasmas 2010, 17, 113510. [Google Scholar]
  50. Yang, F.; Chen, Z.; Wu, Y. Two-temperature transport coefficients of SF6-N2 plasma. Phys. Plasmas 2015, 22, 103508. [Google Scholar] [CrossRef]
Figure 1. Schematic diagram of the experimental setup.
Applsci 13 09518 g001
Figure 2. Schematic diagram of the corona-stabilized switch.
Applsci 13 09518 g002
Figure 3. Schematic diagram of the rod (R) and needle (N) high-voltage electrodes.
Applsci 13 09518 g003
Figure 4. Schematic diagram of the high-repetition-frequency pulse generator. C0 is the filter capacitor. Capacitor C1 is the resonant charged by thyristor S1 and inductor L0. Tesla is the pulse transformer. C2 is the secondary oscillating capacitor C2 and D is the filter diode.
Applsci 13 09518 g004
Figure 5. The voltage waveforms of the repetitive breakdowns in a rod−plate electrode gap were measured at a PRF of 2 kHz in 0.1 MPa SF6.
Applsci 13 09518 g005
Figure 6. Typical time integral image of the breakdown channel during repetitive breakdowns (PRF is 100 Hz, SF6–N2, 0.1 MPa, gap spacing of 5.0 mm) recorded by the COMS optical device. The exposure time was 1000 ms.
Applsci 13 09518 g006
Figure 7. The influence of rod radii on the repetitive breakdown voltage and its dispersion of the switch (SF6, 0.1 MPa, gap spacing is 5.0 mm): (a) breakdown voltage; (b) voltage dispersion.
Applsci 13 09518 g007
Figure 8. The influence of tip structure on the repetitive breakdown voltage and its dispersion of the switch (SF6, 0.1 MPa, gap spacing of 5 mm): (a) breakdown voltage; (b) voltage dispersion. The last column shows the results of rod electrode R3.
Applsci 13 09518 g008
Figure 9. The effect of gas type on the repetitive breakdown voltage and its dispersion of the switches (electrode R1, 0.1 MPa, gap spacing of 5.0 mm): (a) Breakdown voltage of SF6–N2; (b) voltage dispersion of SF6–N2; (c) breakdown voltage of SF6–air; (d) voltage dispersion of SF6–air; (e) breakdown voltage of SF6–He; (f) voltage dispersion of SF6–He.
Applsci 13 09518 g009
Figure 10. The influence of operating pressure on the repetitive breakdown voltage and its dispersion of the switch (electrode R1, SF6, gap spacing of 5 mm): (a) breakdown voltage; (b) voltage dispersion.
Applsci 13 09518 g010
Figure 11. The influence of gap spacing on the repetitive breakdown voltage and its dispersion of the switch (electrode R1, SF6, 0.1 MPa): (a) breakdown voltage; (b) voltage dispersion.
Applsci 13 09518 g011
Figure 12. Optical images of breakdown channels for repetitive breakdowns with different electrodes. The first through seventh columns display the channel images of various high-voltage electrodes, while the first through third rows depict images at frequencies of 1000, 100, and 10 Hz respectively.
Applsci 13 09518 g012
Figure 13. Optical images of the breakdown channels for repetitive breakdowns with different gas types: (a) SF6–N2; (b) SF6–He.
Applsci 13 09518 g013
Figure 14. Images of discharge channels from repetitive breakdowns with different operating pressures and gap spacings: (a) operating pressure; (b) gap spacing.
Applsci 13 09518 g014
Figure 15. Insulation recovery curve of the corona-stabilized switches under different parameter conditions.
Applsci 13 09518 g015
Figure 16. Schematic diagram for the motion of space charges during the breakdown process in a rod-plate gap: (a) stage 1; (b) stage2; (c) stage 3; (d) stage 4.
Applsci 13 09518 g016
Figure 17. Schematic diagram of the corona discharge in a rod-plate electrode.
Applsci 13 09518 g017
Figure 18. Schematic diagram illustrating the propagation of shock waves and the transport mechanism of residual spatial charges in breakdown channels: (a) stage 1; (b) stage 2; (c) stage 3; (d) stage 4.
Applsci 13 09518 g018
Figure 19. Numerical simulation of different needle electrodes wrapped by a stable corona layer.
Applsci 13 09518 g019
Table 1. Parameters of the rod electrodes in group R.
R1R2R3R4R5
r (mm)0.51.01.52.55.0
f8.134.673.472.461.69
Table 2. Parameters of the needle electrodes in group N.
N1N2N3N4
θ (°)10254570
f4.023.613.263.13
d (mm)1.5
Disclaimer/Publisher’s Note: The statements, opinions and data contained in all publications are solely those of the individual author(s) and contributor(s) and not of MDPI and/or the editor(s). MDPI and/or the editor(s) disclaim responsibility for any injury to people or property resulting from any ideas, methods, instructions or products referred to in the content.

