Article

Frequency Ratio Model as Tools for Flood Susceptibility Mapping in Urbanized Areas: A Case Study from Egypt

by
Hanaa A. Megahed
1,
Amira M. Abdo
1,
Mohamed A. E. AbdelRahman
2,3,*,
Antonio Scopa
4,* and
Mohammed N. Hegazy
1
1
Division of Geological Applications and Mineral Resources, National Authority for Remote Sensing and Space Sciences (NARSS), Cairo 1564, Egypt
2
Division of Environmental Studies and Land Use, National Authority for Remote Sensing and Space Sciences (NARSS), Cairo 1564, Egypt
3
State Key Laboratory of Efficient Utilization of Arid and Semi-Arid Arable Land in Northern China, Institute of Agricultural Resources and Regional Planning, Chinese Academy of Agricultural Sciences, Beijing 100081, China
4
Scuola di Scienze Agrarie, Forestali, Alimentari ed Ambientali (SAFE), Università degli Studi della Basilicata, Via dell’Ateneo Lucano 10, 85100 Potenza, Italy
*
Authors to whom correspondence should be addressed.
Appl. Sci. 2023, 13(16), 9445; https://doi.org/10.3390/app13169445
Submission received: 22 June 2023 / Revised: 7 August 2023 / Accepted: 19 August 2023 / Published: 21 August 2023
(This article belongs to the Special Issue GIS and Spatial Planning for Natural Hazards Mitigation)

Abstract

:
The occurrence of flash floods is a natural yet unavoidable occurrence over time. In addition to harming people, property, and resources, it also undermines a country’s economy. This paper attempts to identify areas of flood vulnerability using a frequency ratio approach. The frequency ratio (FR) model was used to produce flood prediction maps for New Cairo City, Egypt. Using field data and remote sensing data, 143 spatial flooded point sites were mapped to build a flood inventory map. The primary driving criteria for flash floods were determined to be elevation, slope, aspect, Land Use Land Cover (LULC), lithology, stream distance, stream density, topographic wetness index (TWI), surface runoff, and terrain ruggedness index (TRI), in that order of importance. A flood susceptibility map (FSM) has been created using the FR model, which combines geographical flooded sites and environmental variables. Our findings from FSM, roughly a fifth of the city is very highly susceptible to flooding (19.32%), while the remaining 40.09% and 13.14% of the study area rank very low and low risk, respectively. The receiver operating characteristic curve (ROC) technique was also used to validate the FSM, and the resulting results showed an area under the curve (AUC) of 90.11%. In conclusion, decision makers can employ models to extract and generate flood risk maps in order to better understand the effects of flash floods and to create alternative measures to prevent this hazard in similar regions. The results of this study will aid planners and decision makers in developing some likely actions to reduce floods vulnerability in this area.

1. Introduction

The occurrence of flash floods is a natural yet unavoidable occurrence over time. In addition to harming people, property, and resources, it also undermines a country’s economy. In terms of social, economic, and environmental perspectives, floods have been one of Egypt’s worst natural disasters in recent years. The magnitude of a flash flood is the most important factor in determining its impact. Flood-related direct or indirect damages can be divided into materialistic and non-materialistic effects when calculating overall effects [1,2,3,4,5,6,7].
Climate change has become one of the most serious threats facing the planet. Global warming and the consequent problems of drought, desertification, and floods is perhaps the most prominent form of that change, which affects all continents of the world [2,3,4,5,6]. Even the Arab region, the heart of the world, has become the epicenter of climate change. At the global level, 2010 was the hottest year since the beginning of temperature monitoring in the late nineteenth century, as nineteen countries recorded record temperatures, five of which were Arab countries, in addition to the fact that the Middle East region, in general, is considered the poorest water area. Across the world, the per capita share of fresh water is less than half of the global rate of water poverty, 1000 m3 per year, according to the World Bank 2014 report. Climate change is tangible, and the ability to deal with it differs according to the material and technical capabilities of countries, but the danger lies in the change of rain regimes in the Arab countries, and thus the drowning of some small cities due to floods, and this is so far because we have reached a temperature increase of 1.1 °C. Ways to confront climate change include building flood protection systems by evaluating the current risks resulting from floods, as in this work, and thus building scenarios to overcome the problems arising from those risks.
Urbanized areas are currently more susceptible to flooding if human activity and environmental factors change streamflow systems and precipitation patterns [8]. Additionally, a number of negative effects of flash floods can be observed, including disruptions to peoples’ life, harm to urban traffic, housing failure, and the spread of pollutants [9]. As a result, it is crucial to locate places that frequently flood and direct natural drainage systems into metropolitan areas [10,11].
Concerning the modelling of flash floods, previous studies used various physical or statistical models to provide precise mapping for flood-prone zones. Physical models include the Hydrological Simulation Program-FORTRAN (HSPF) [12], Storm Water Management Model (SWMM) [13], and HEC-RAS [14,15], while statistical models include logistic regression, generalized linear models, entropy, frequency ratio (FR), Random Forest (RF), k-nearest neighbours (KNN), weighting factors, weights of evidence, and flexible discriminant analysis [16,17]. These models can be used to determine the connections between the location of an FSM-appropriate or inappropriate area and its conditioning elements. Maps of landslides, groundwater, and floods have all been successfully created using FR, RF, and KNN, as well as some further innovative data mining techniques (e.g., [18,19,20,21,22,23,24]). The FR model is easier to understand and provides more details on the connections between the conditions for FSM and the area’s suitability for FSM [25,26].
In Egypt, rainfall caused flash floods frequently during 1994, 2010, and 2016 [27,28,29]. Many Egyptian researchers have recorded and studied flash floods in some of Egypt’s urbanized regions [16,30,31,32,33,34]. In the northern part of the country in October 2016, 73 individuals were killed, and 30 were injured [35,36,37]. Additionally, numerous floods devastated the city of New Cairo in the years 2018 and 2019 due to, as reported by the Egyptian Meteorological Authority, an increase in the rate of rainfall, displacing a sizable number of citizens, destroying property, costing a sizable amount of money, and taking the lives of seven people [38,39,40]. At least six and twenty-five fatalities occurred in Alexandria and Beheria, respectively, in 2015. Therefore, an early flash flood warning is required to control and lessen the potential impact of such disasters. The significance of this study lies in applying recent statistical models to create a map of flood susceptibility to predict which urban areas may experience flash floods. The outcomes offer a trustworthy addition to the detection and evaluation of flash floods.
New Cairo City is one of the most prestigious cities in Egypt. Meanwhile, it was founded in 2000 to alleviate the overcrowding in Cairo City and boasts an area of 267 km2. It is one of Egypt’s most attractive and populous cities since it contains six international universities and many economical and luxurious residential buildings. Furthermore, the region of New Cairo city has been witnessing periodic devastating flash floods every year. Therefore, this study sheds light on the surface runoff process and its various risks by using an applied scientific method to study and analyze the runoff risks and conduct a hydrological analysis to identify the areas affected by heavy rains. The importance of this study stems from the fact that it discusses one of the most important risks that threaten urban communities in general and in the study area in particular. This risk affects the security and stability of the population and their property. The dangers of runoff can be studied through the application of geospatial techniques and ArcGIS geographic information systems software in order to support the decision maker in making development decisions to develop the region and similar areas in a way that preserves the lives of its inhabitants.
Remote sensing (RS) and ArcGIS 10.8.1 software tools have become increasingly popular in recent years because they offer a fresh perspective on vulnerability assessments with the necessary justification. As it provides faultless information about a place, the analysis of satellite imageries on the RS and GIS platforms produces good findings for flood susceptibility and vulnerability mapping [41]. The environment it generates is incredibly pleasant, allowing a wide range of models to operate and alter data to assess flood risk, and the outcomes become more plausible and acceptable. The application of RS and GIS approaches for assessing flood susceptibility is currently widespread and very successful [1]. There are numerous models and methods that can be employed in place of one another for mapping flood vulnerabilities. One of the widely acceptable and extremely accurate strategies for hazard assessment is the frequency ratio (FR) model [42]. One type of bivariate statistical analysis (BSA) is frequency ratio (FR), which assigns values to each class of each parameter and assesses its influence on flood occurrence [43,44]. The FR model is an easy technique to use in a GIS setting and may provide a map of flood vulnerability that is scientifically valid [45,46]. The preparation of flood susceptibility mapping using the FR model is made simple by sophisticated software that is similar to RS and GIS. The primary goal of the current study is to create a flood vulnerability map for the Kulik River basin using the FR model. Critical analysis of the area’s possible flood risk zone is the work’s main goal.

2. Materials and Methods

2.1. Problem Definition

Before and during the process of urban planning for any urban gatherings, it is necessary to take into account the topographical nature of the region in terms of slopes (degree—direction) which are known as dry basins. Unfortunately, the urban planning for the Fifth Settlement district in New Cairo did not take into account the drainage network form, especially during street planning and linking roads (Figure 1a). This has led to the obstruction of the movement of rainwater, which has had a negative effect on the movement of water as well as the safety of that area as a result of rainwater collected in specific areas of streets and residential buildings, destroying roads, streets, and some facilities (Egyptian Street, 2018 (https://egyptianstreets.com/2018/04/26/heavy-rains-cause-chaos-in-Cairo/, accessed on 30 December 2022), and Youm7 (2020) (http://www.youm7.com/4668611, accessed on 30 December 2022) (Figure 1b–d).

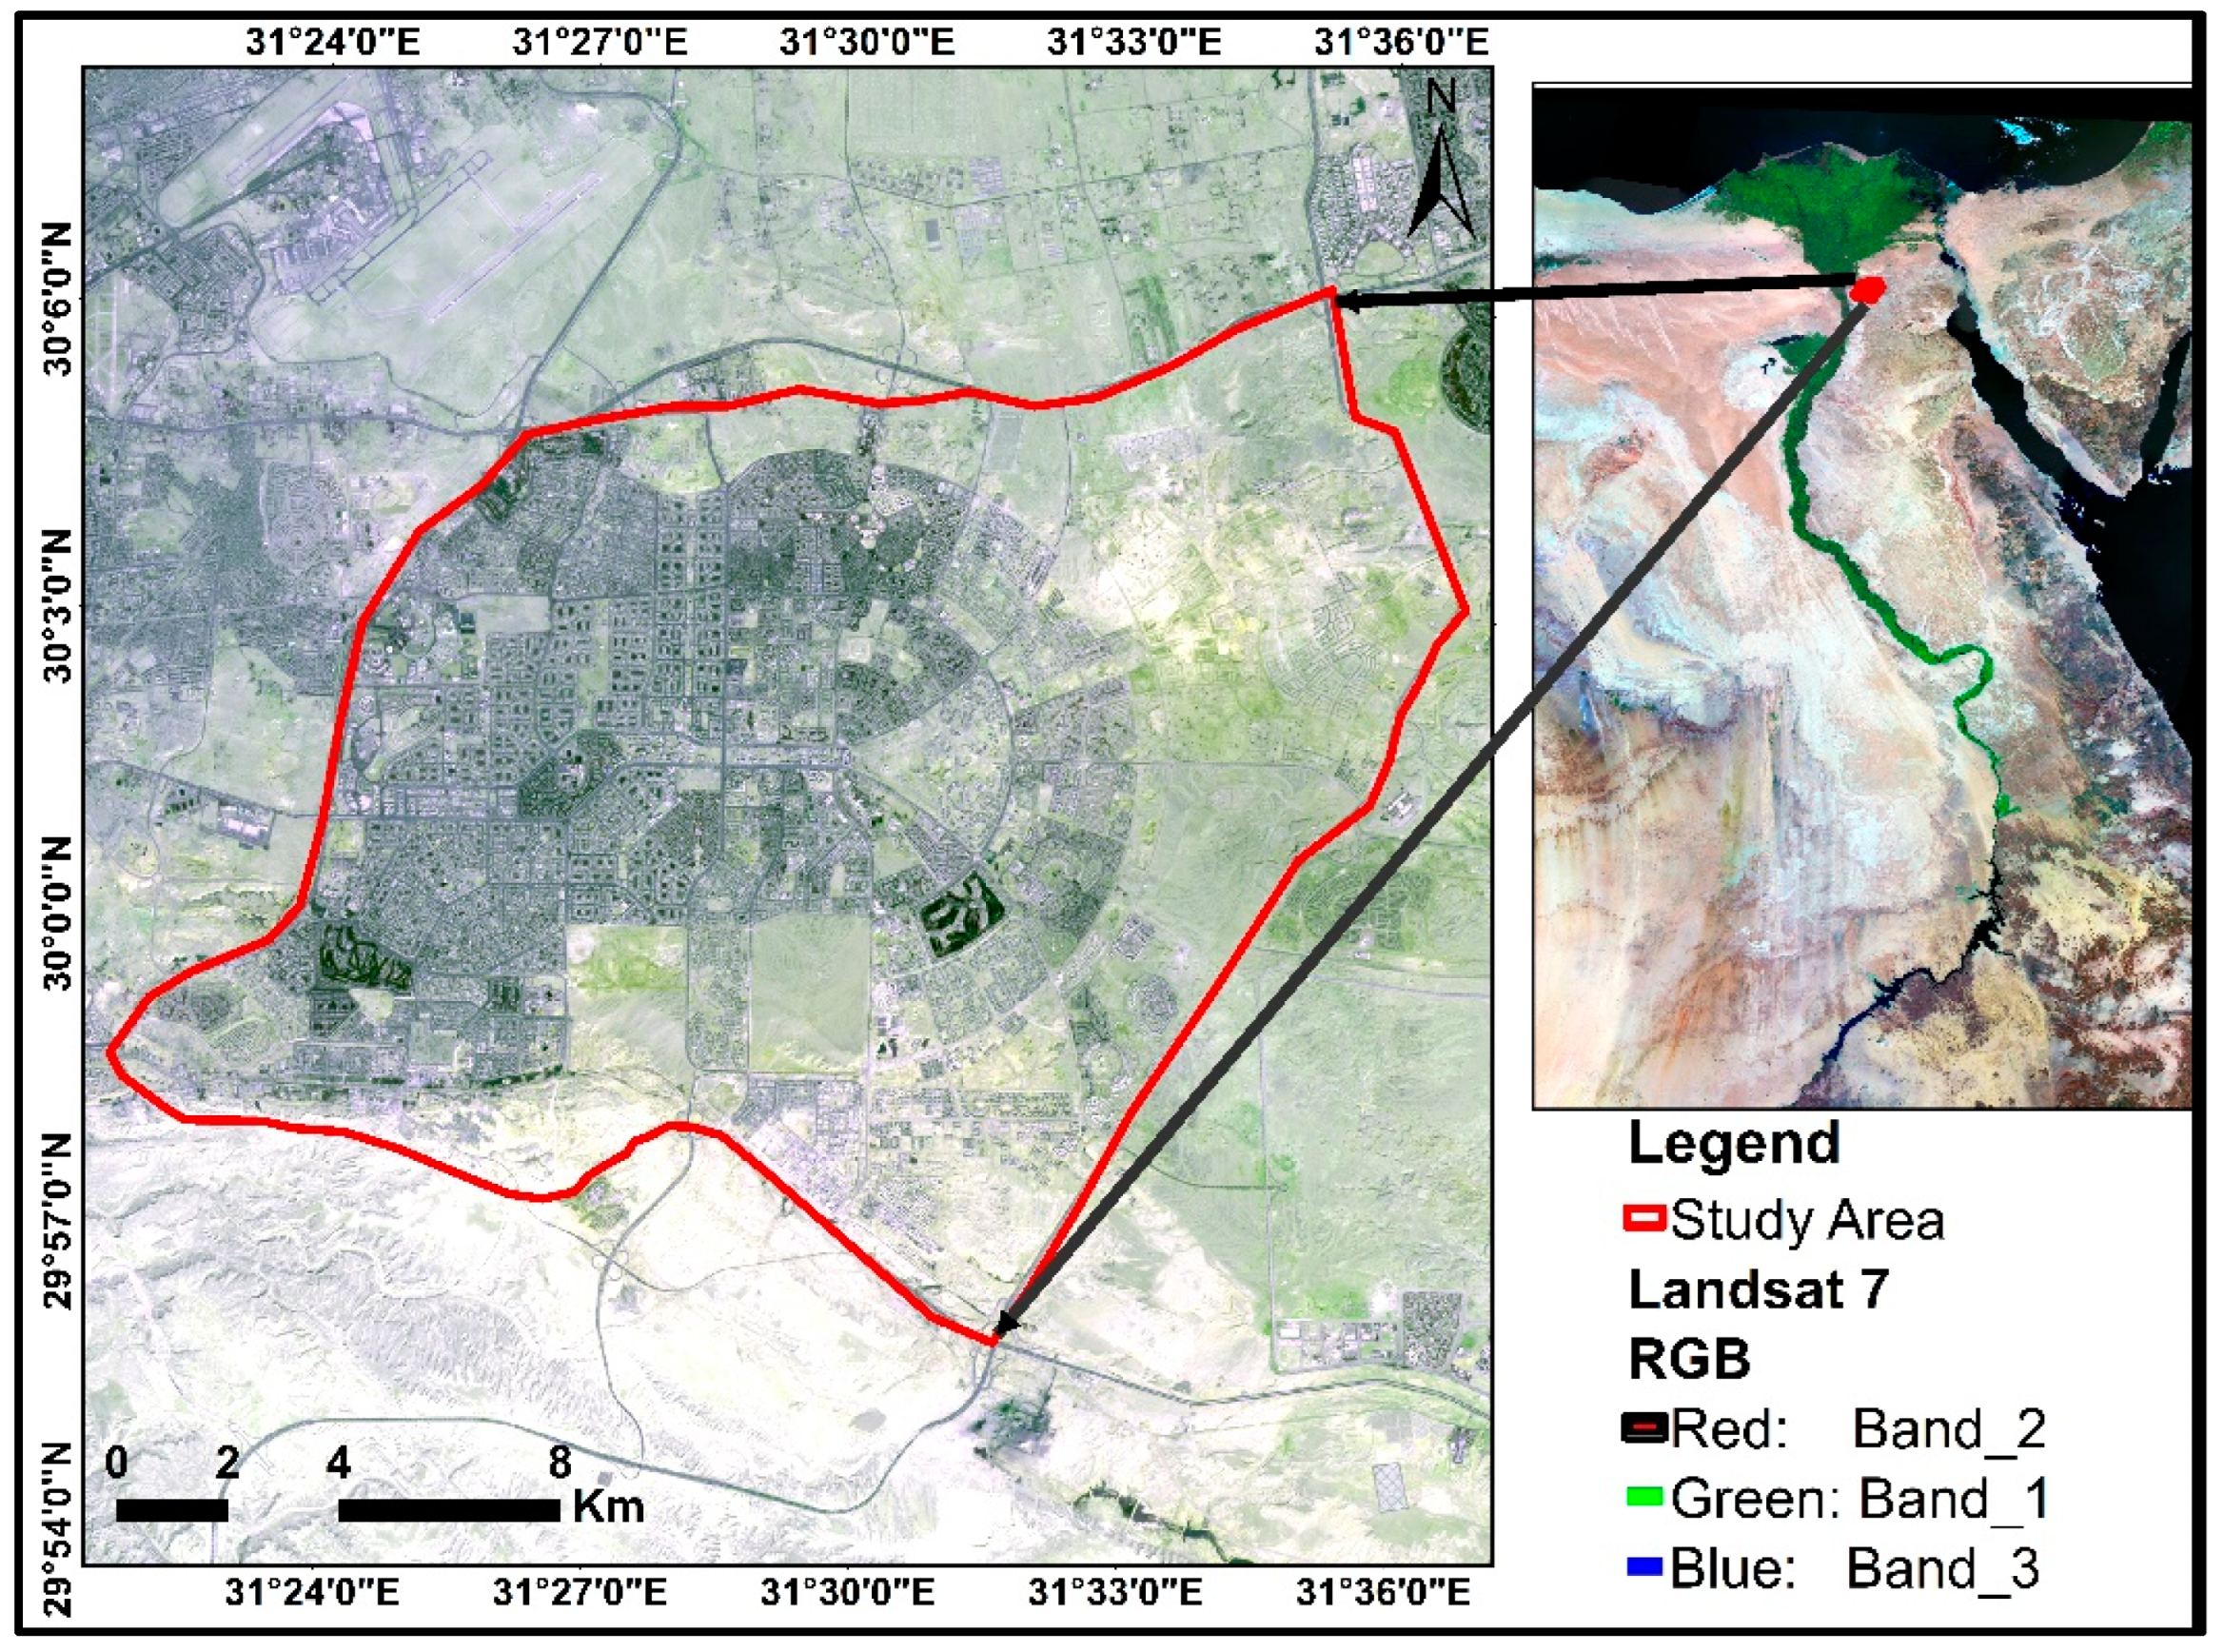
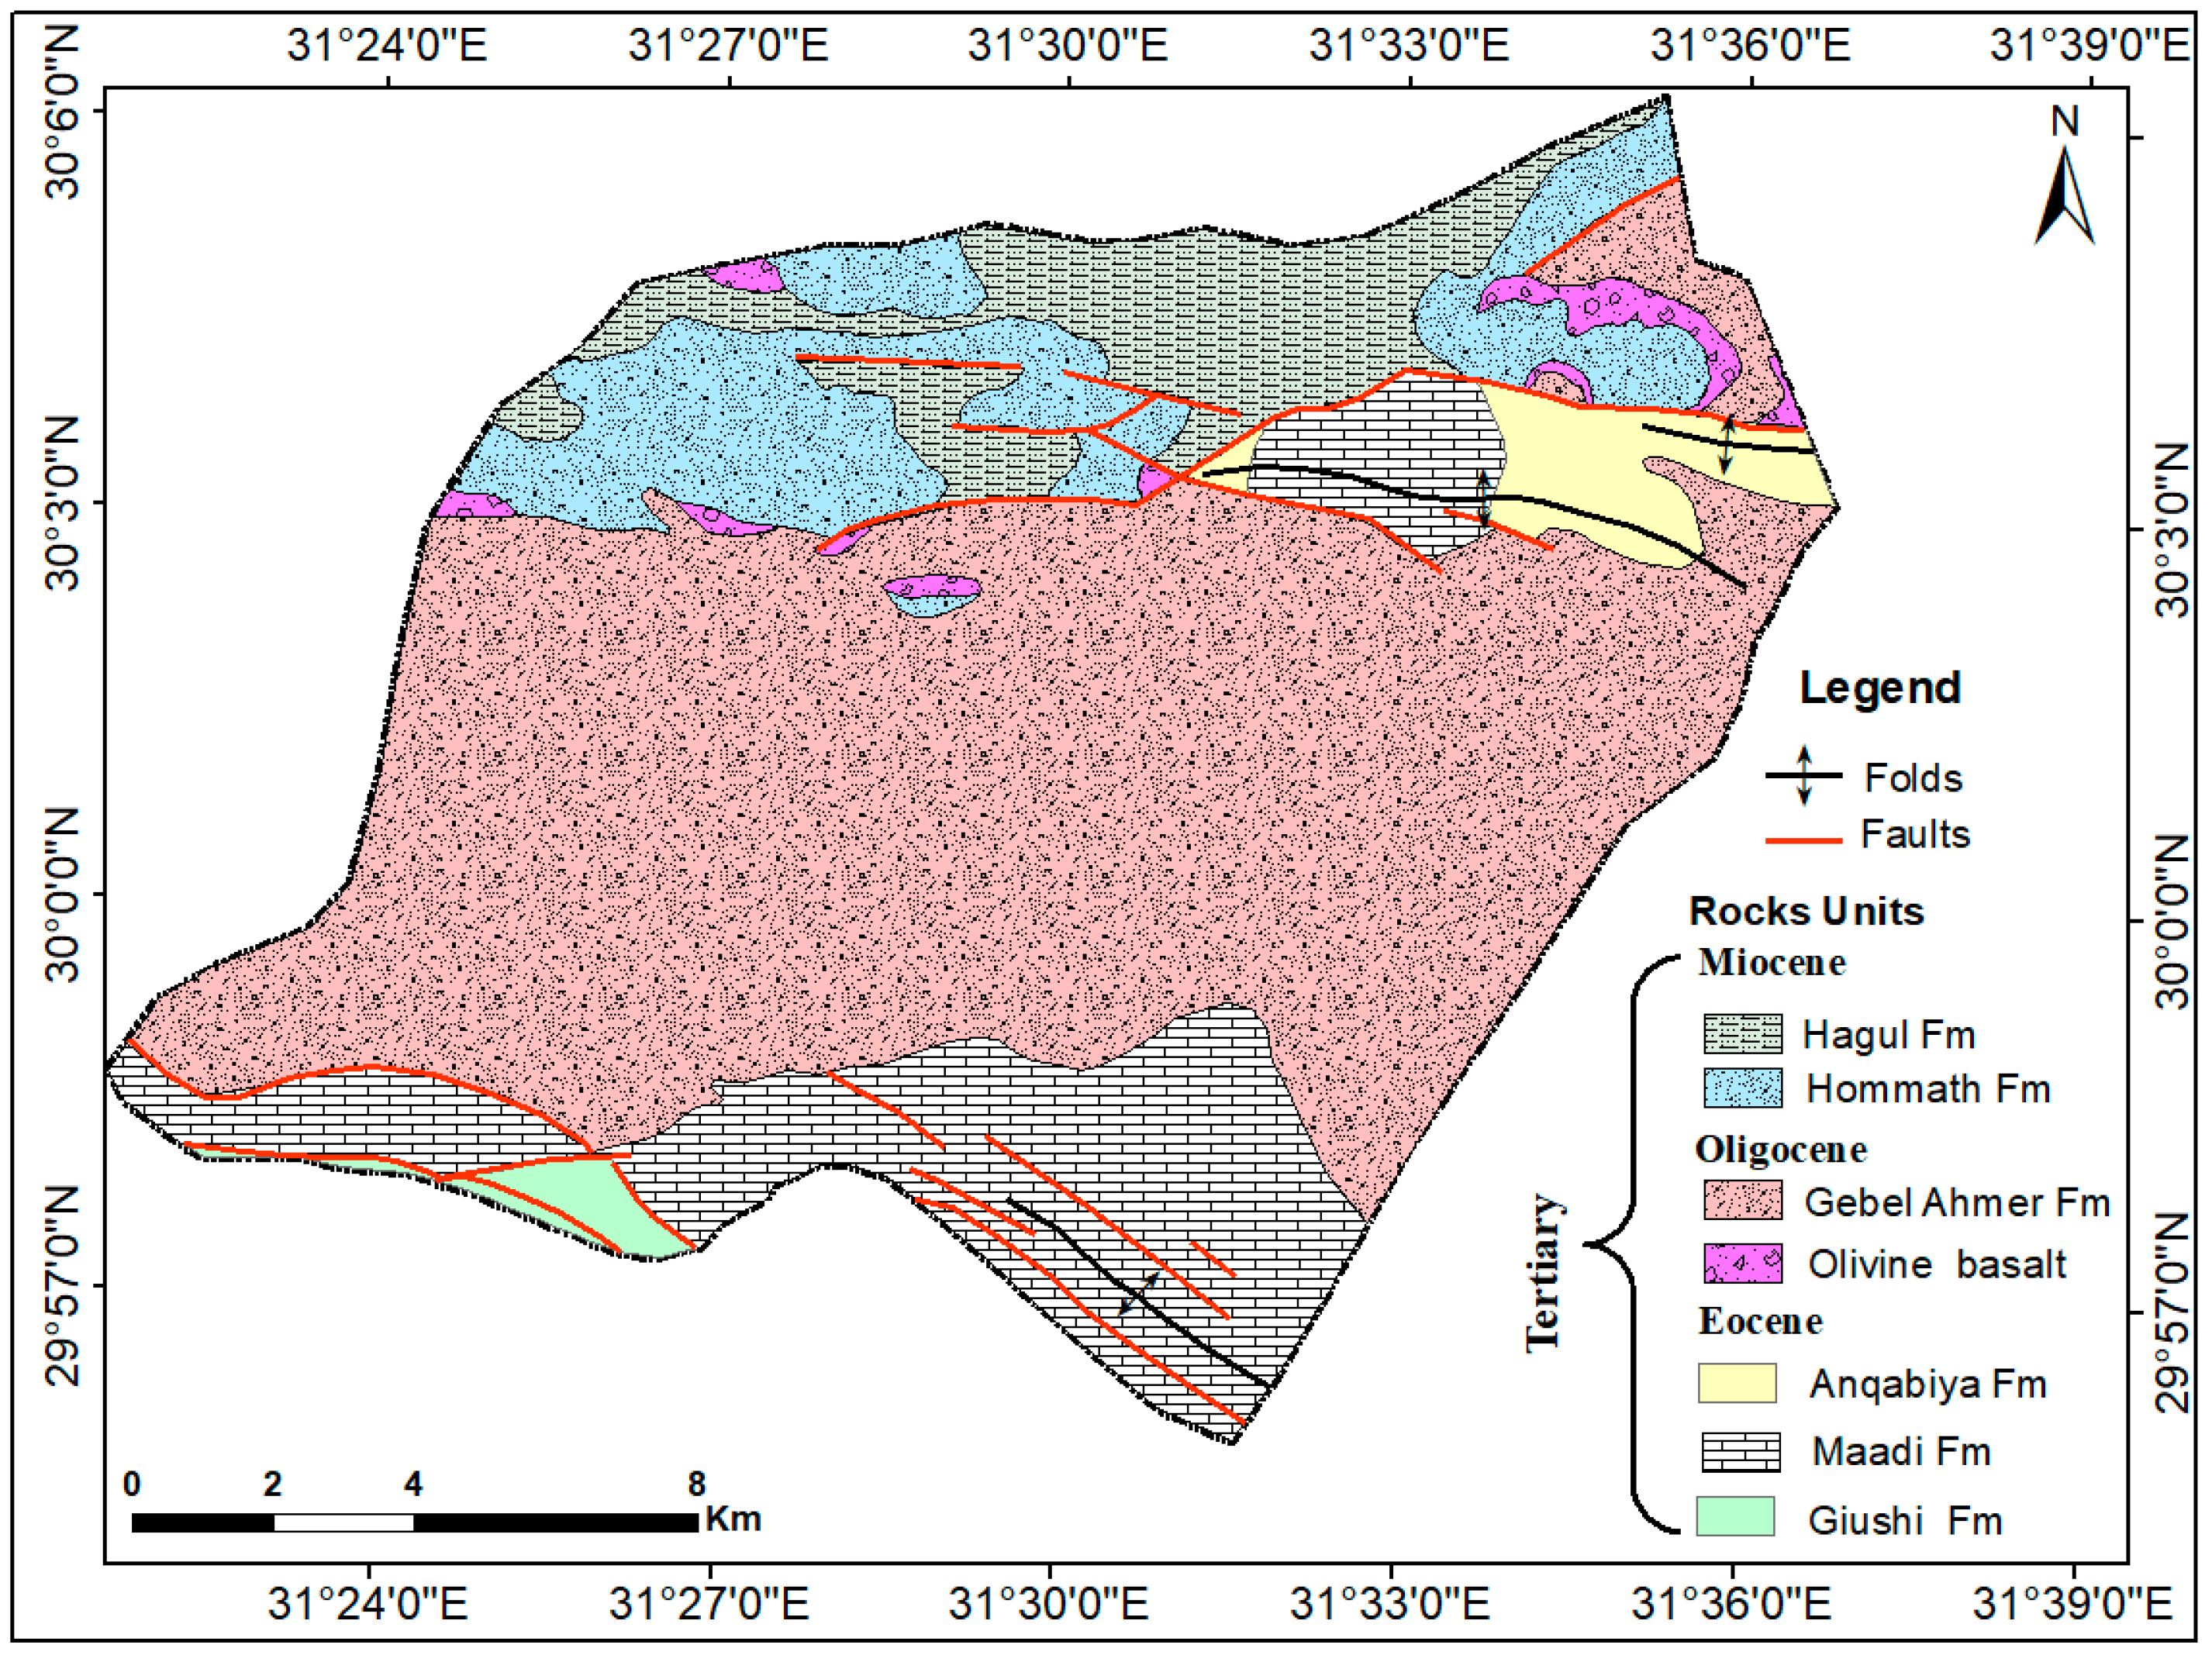
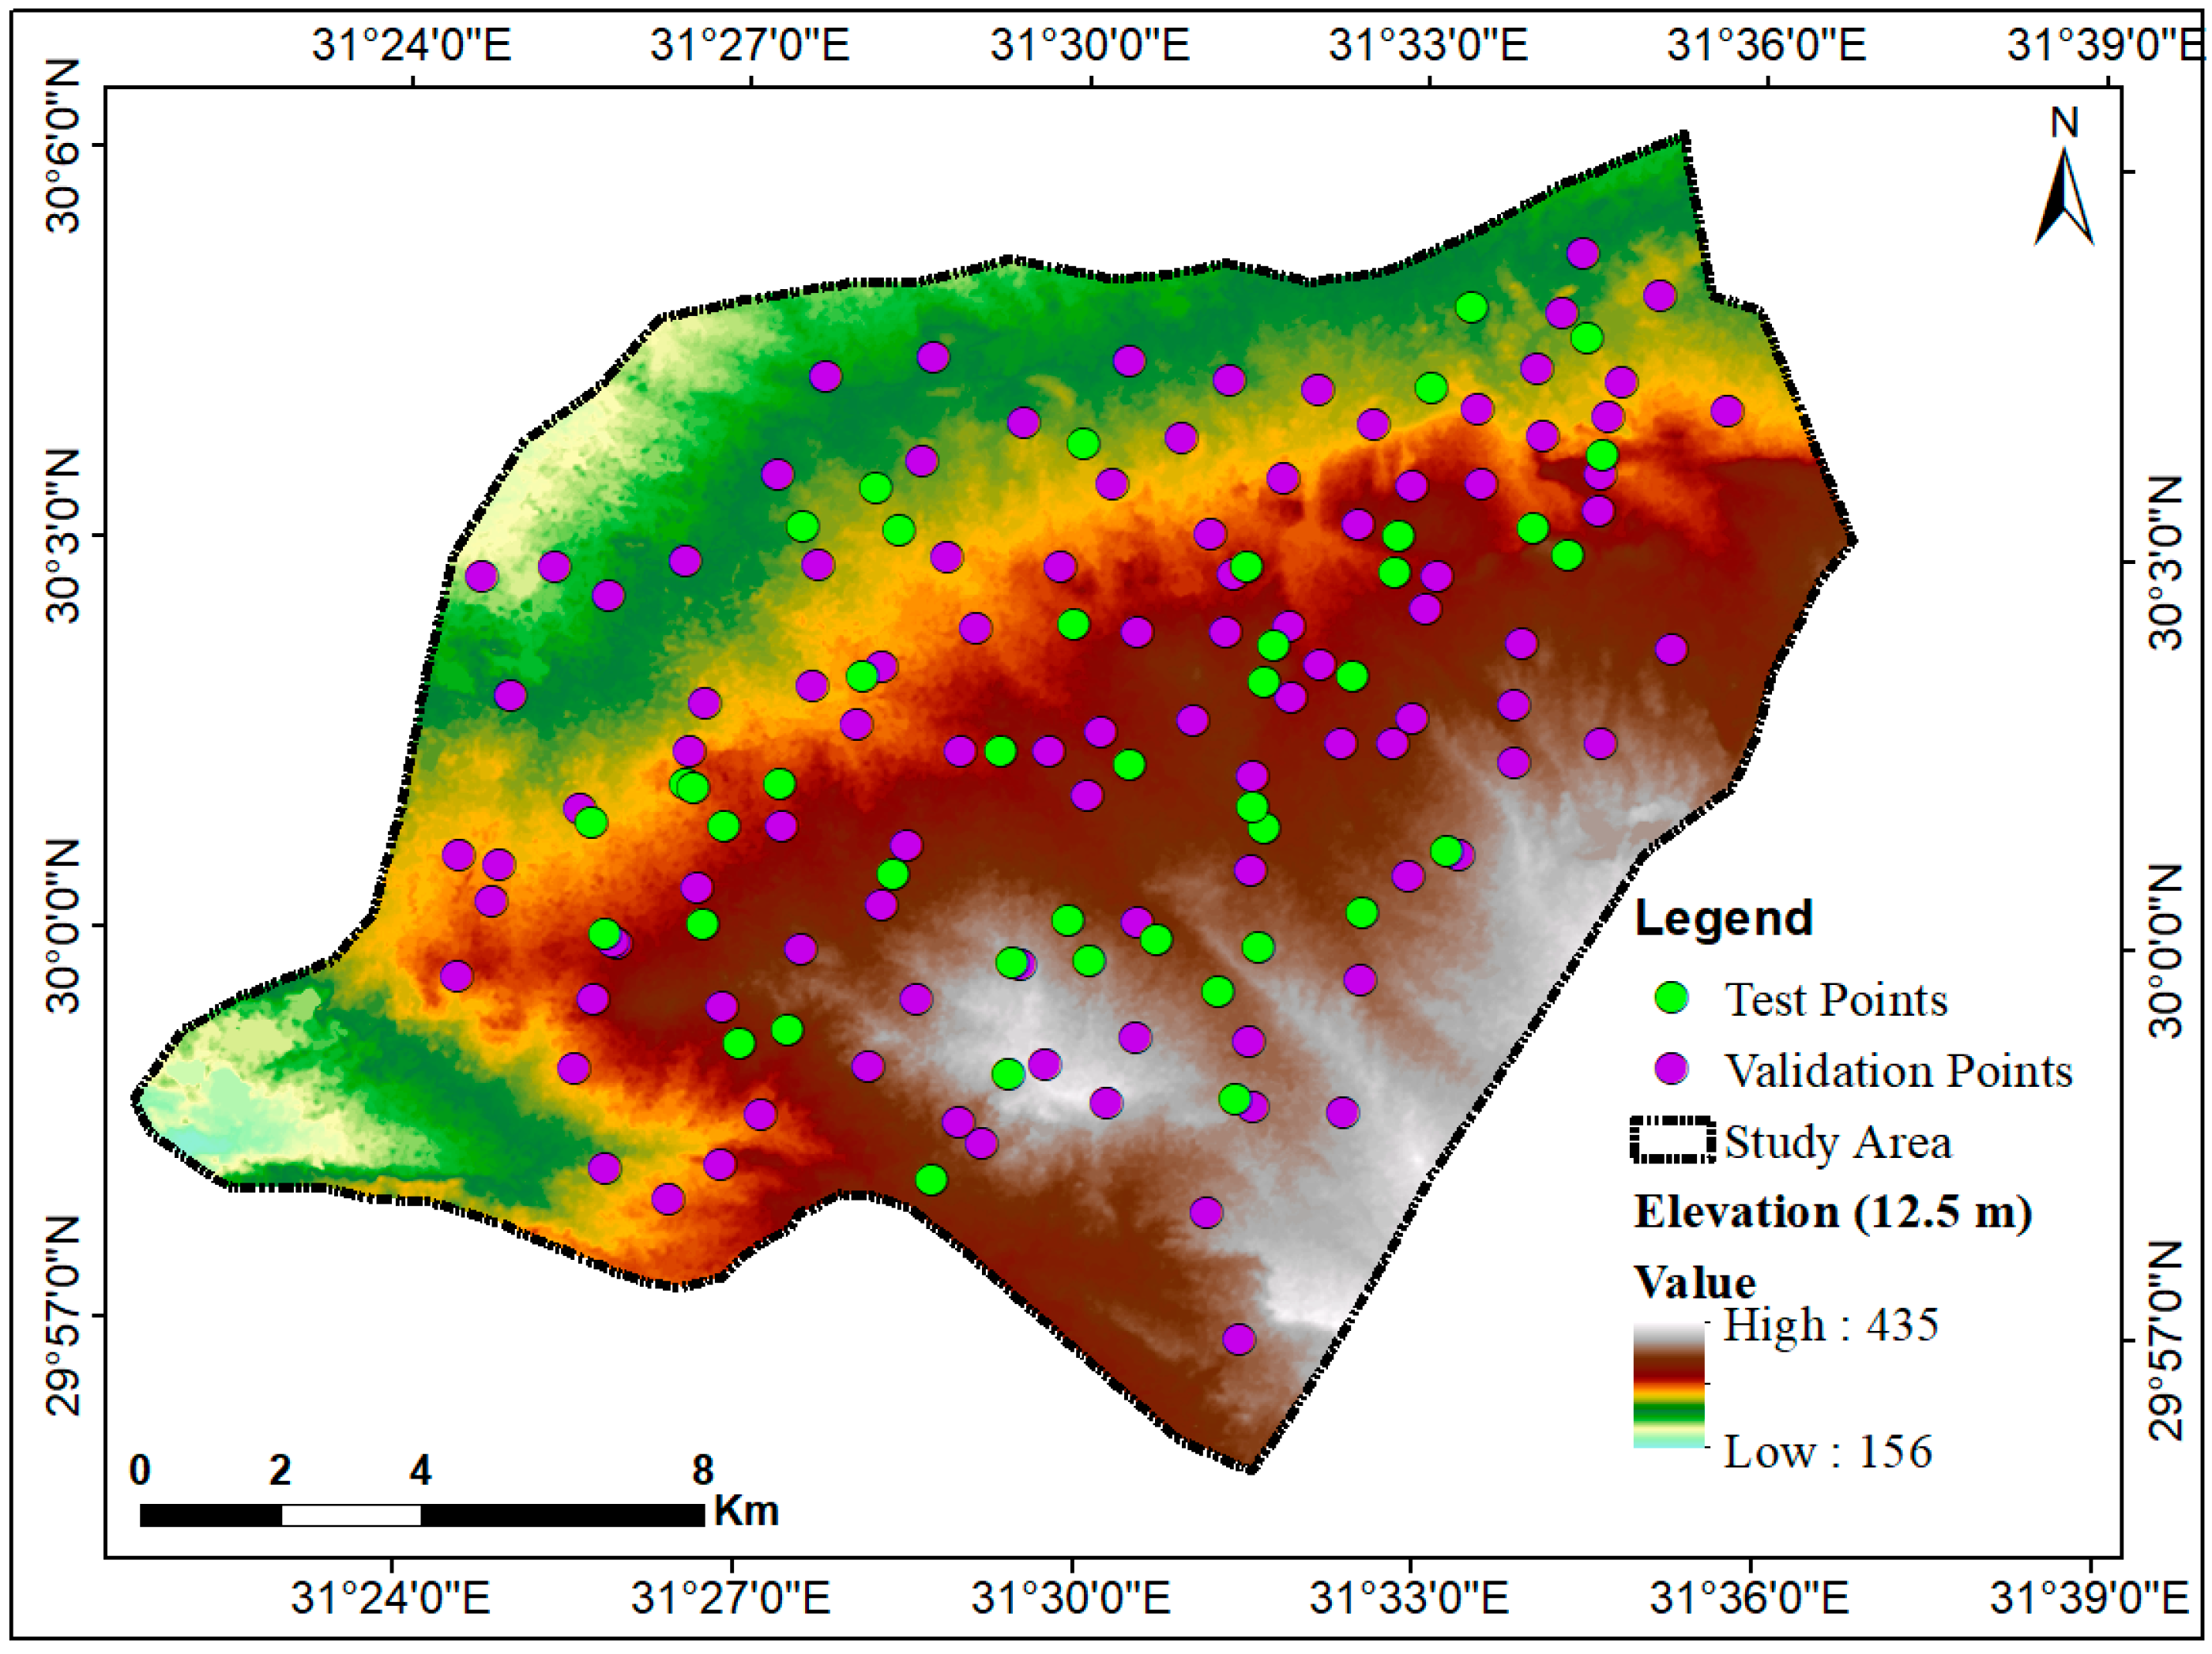
2.2. Area of Study and Geological Context

The region is located east of the Greater Cairo region and contains the largest new city in the Republic, which is “New Cairo City”. The research region is part of the Cairo-Suez District area in the Northern Eastern Desert and is situated southeast of the Nile Delta (Figure 2). The stratigraphy of the study area has been studied by several authors [47,48,49,50,51,52,53]. The exposed sequence in the study area consists of sedimentary and volcanic rocks ranging in age from upper Miocene to middle Eocene. According to the geological map of Greater Cairo simplified from the (EGS) [54] scale 1.100,000, the rock units (Figure 3) in order of oldest to youngest consist of 1-Giashi Formation, 2-Maadi Formation, 3-Anqabiya Formation, 4-Gebel Ahmer Formation (Oligocene age), 5-Basalt flows (Oligo-Miocene age), 6-Marine Miocene sediments (Early to Middle Miocene age, Hommath Formation), and 7-Non-marine sediments (Late Miocene age, Hagul Formation). This demonstrates that tertiary-aged sedimentary rocks predominated in northern areas of the Eastern Desert, as well as in the areas east of the Nile Delta. The oldest rock unit of the middle Eocene age is the Giashi Formation, which is exposed in the southwestern corner of the map area. It consists of white limestone with Qprculina pyramidum and is 52 m thick. The Maadi Formation bed is of the upper Eocene age and is visible in the southern and eastern corners of the map region. It is 59 m thick, mostly made of fossiliferous sands and sandstone with clay and marl at the base. The top is covered in a 6 m thick brown fossiliferous sand limestone. The northeastern corner of the map region exposes beds from the Upper Eocene Anqabiya Formation. It is 61 m thick and primarily made of sand and sandstone with fossiliferous clay intercalations.

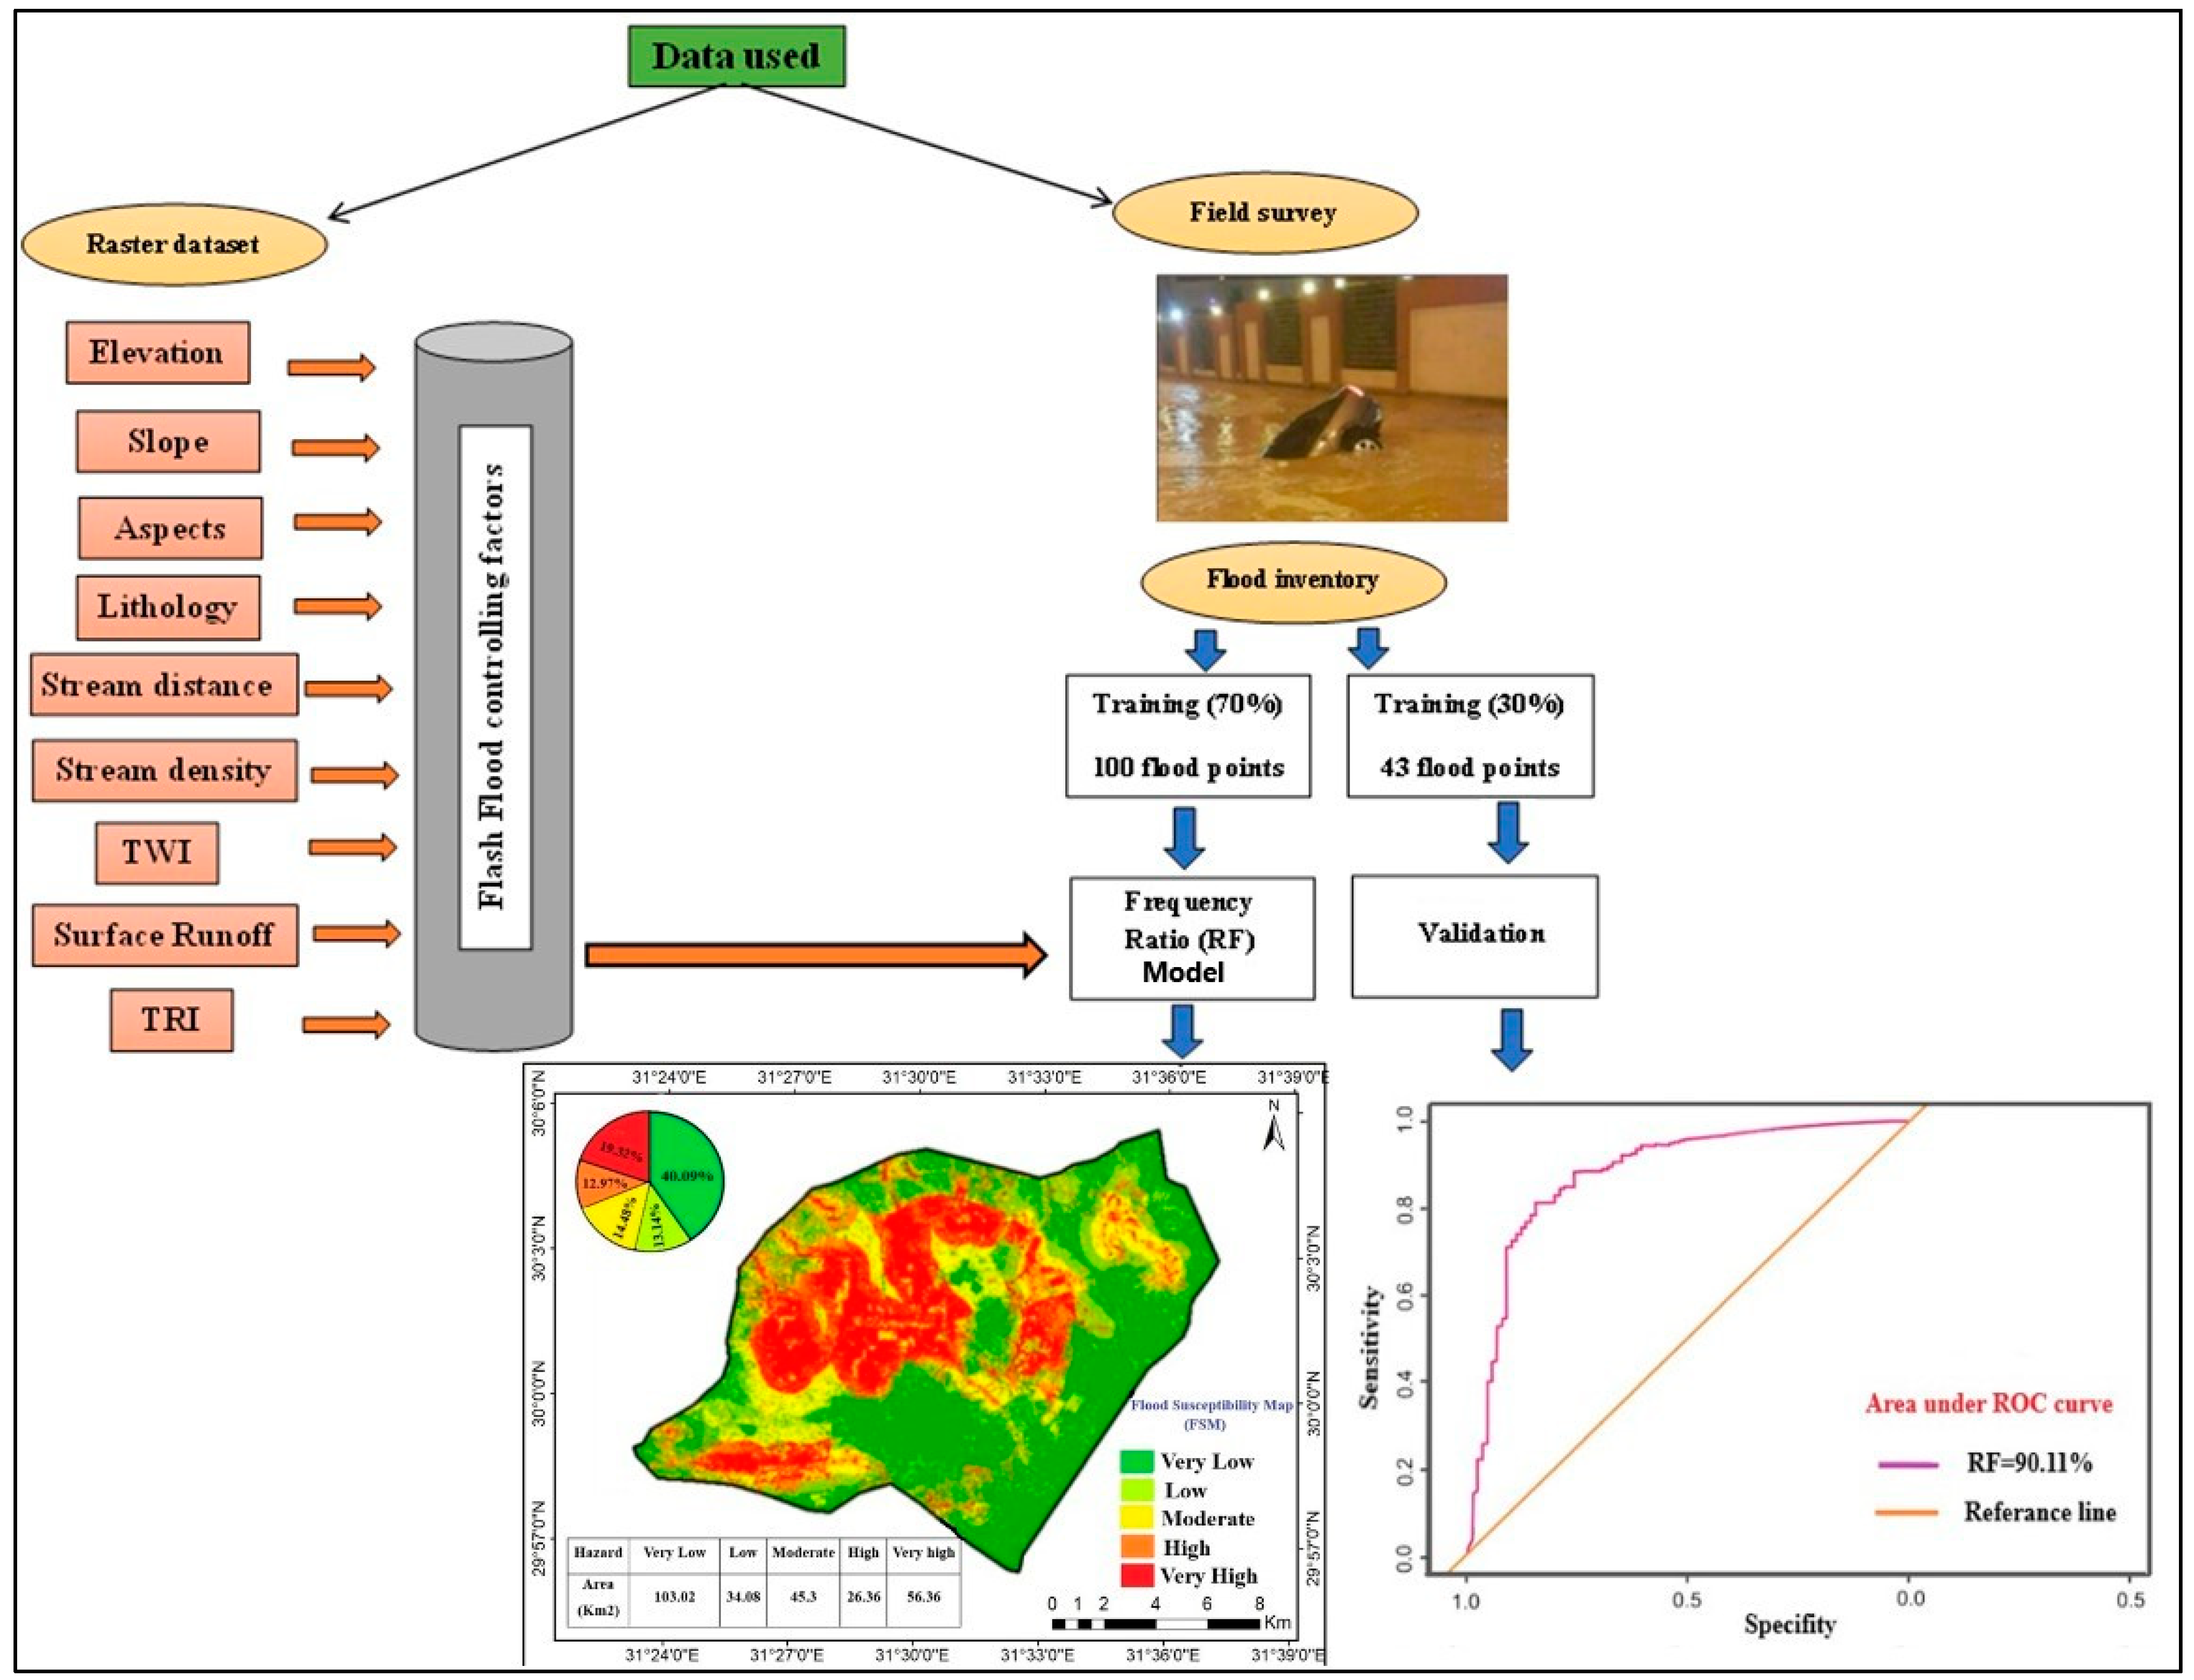
2.3. Data and Method

The Digital Elevation Model (DEM) was obtained from the website (http://www.usgs.gov/, accessed on 30 December 2022). According to Xu et al. [55], DEMs are critical for flood inundation mapping and hydrologic and hydraulic modelling. Additionally, five land use bands from the Earth Explorer website (https://earthexplorer.usgs.gov/, accessed on 30 December 2022) were composited and categorized using ArcMap to generate the land use/ land cover map. The NASA Power website (https://power.larc.nasa.gov/data/, accessed on 30 December 2022) also provided precipitation data that was downloaded. Following that, a number of FSM conditioning factors were acquired and taken into consideration during FR modelling operations. The results were then validated using the receiver operating characteristics (ROC) curve. Figure 4 depicts a flowchart of the general process used for flood susceptibility mapping.
In the flood susceptibility mapping, the capacity of the sewer system, being limited, was not taken into account.

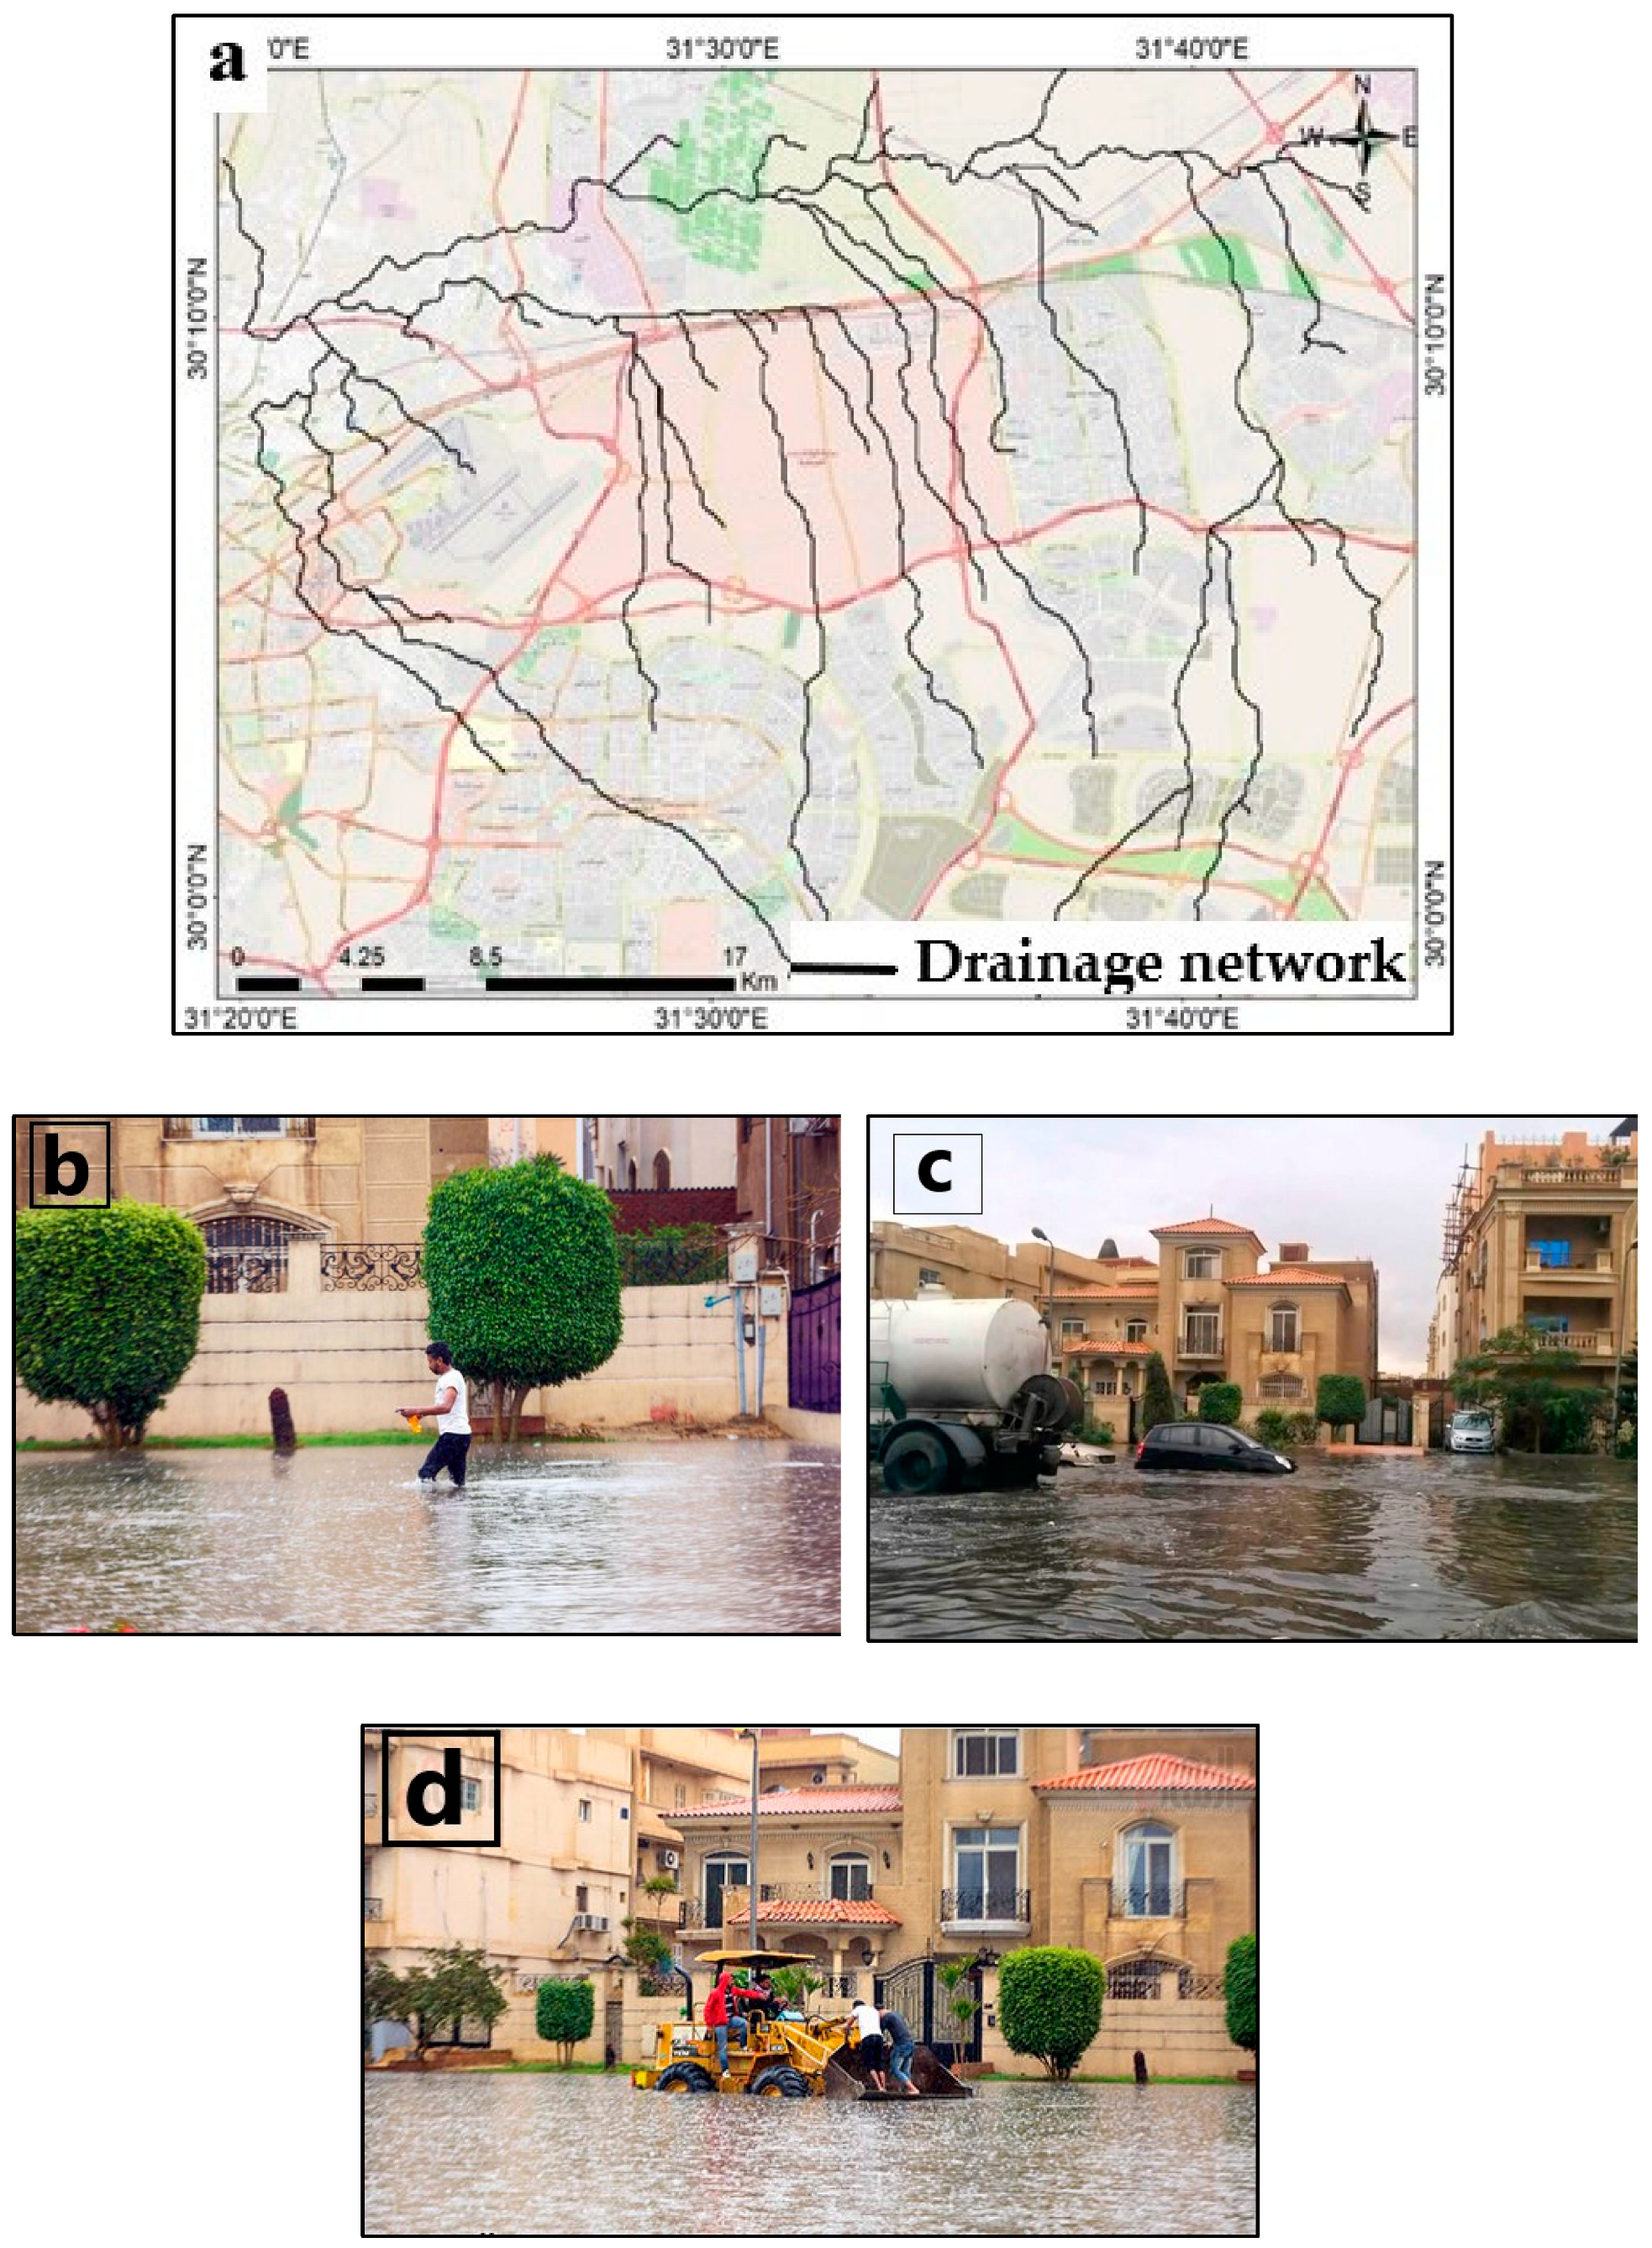
2.4. Flood Inventory Map

The flood inventory map is one of the primary maps used to evaluate flood susceptibility [19,56]. In addition, the accuracy of the flood hazard map can be enhanced as we add more flooded points that are seen during different flood events using QGIS 3.32.1 software [57]. The majority of this data came from field surveys and research completed in the past to identify the accumulation points in New Cairo city [58]. In the study area, 143 flooded points were found; 100 flooded points (representing 70%) were used for training, while the remaining 43 points (representing 30%) were used for model validation (Figure 5). The percentages of training and testing points were chosen in accordance with [59,60,61,62].

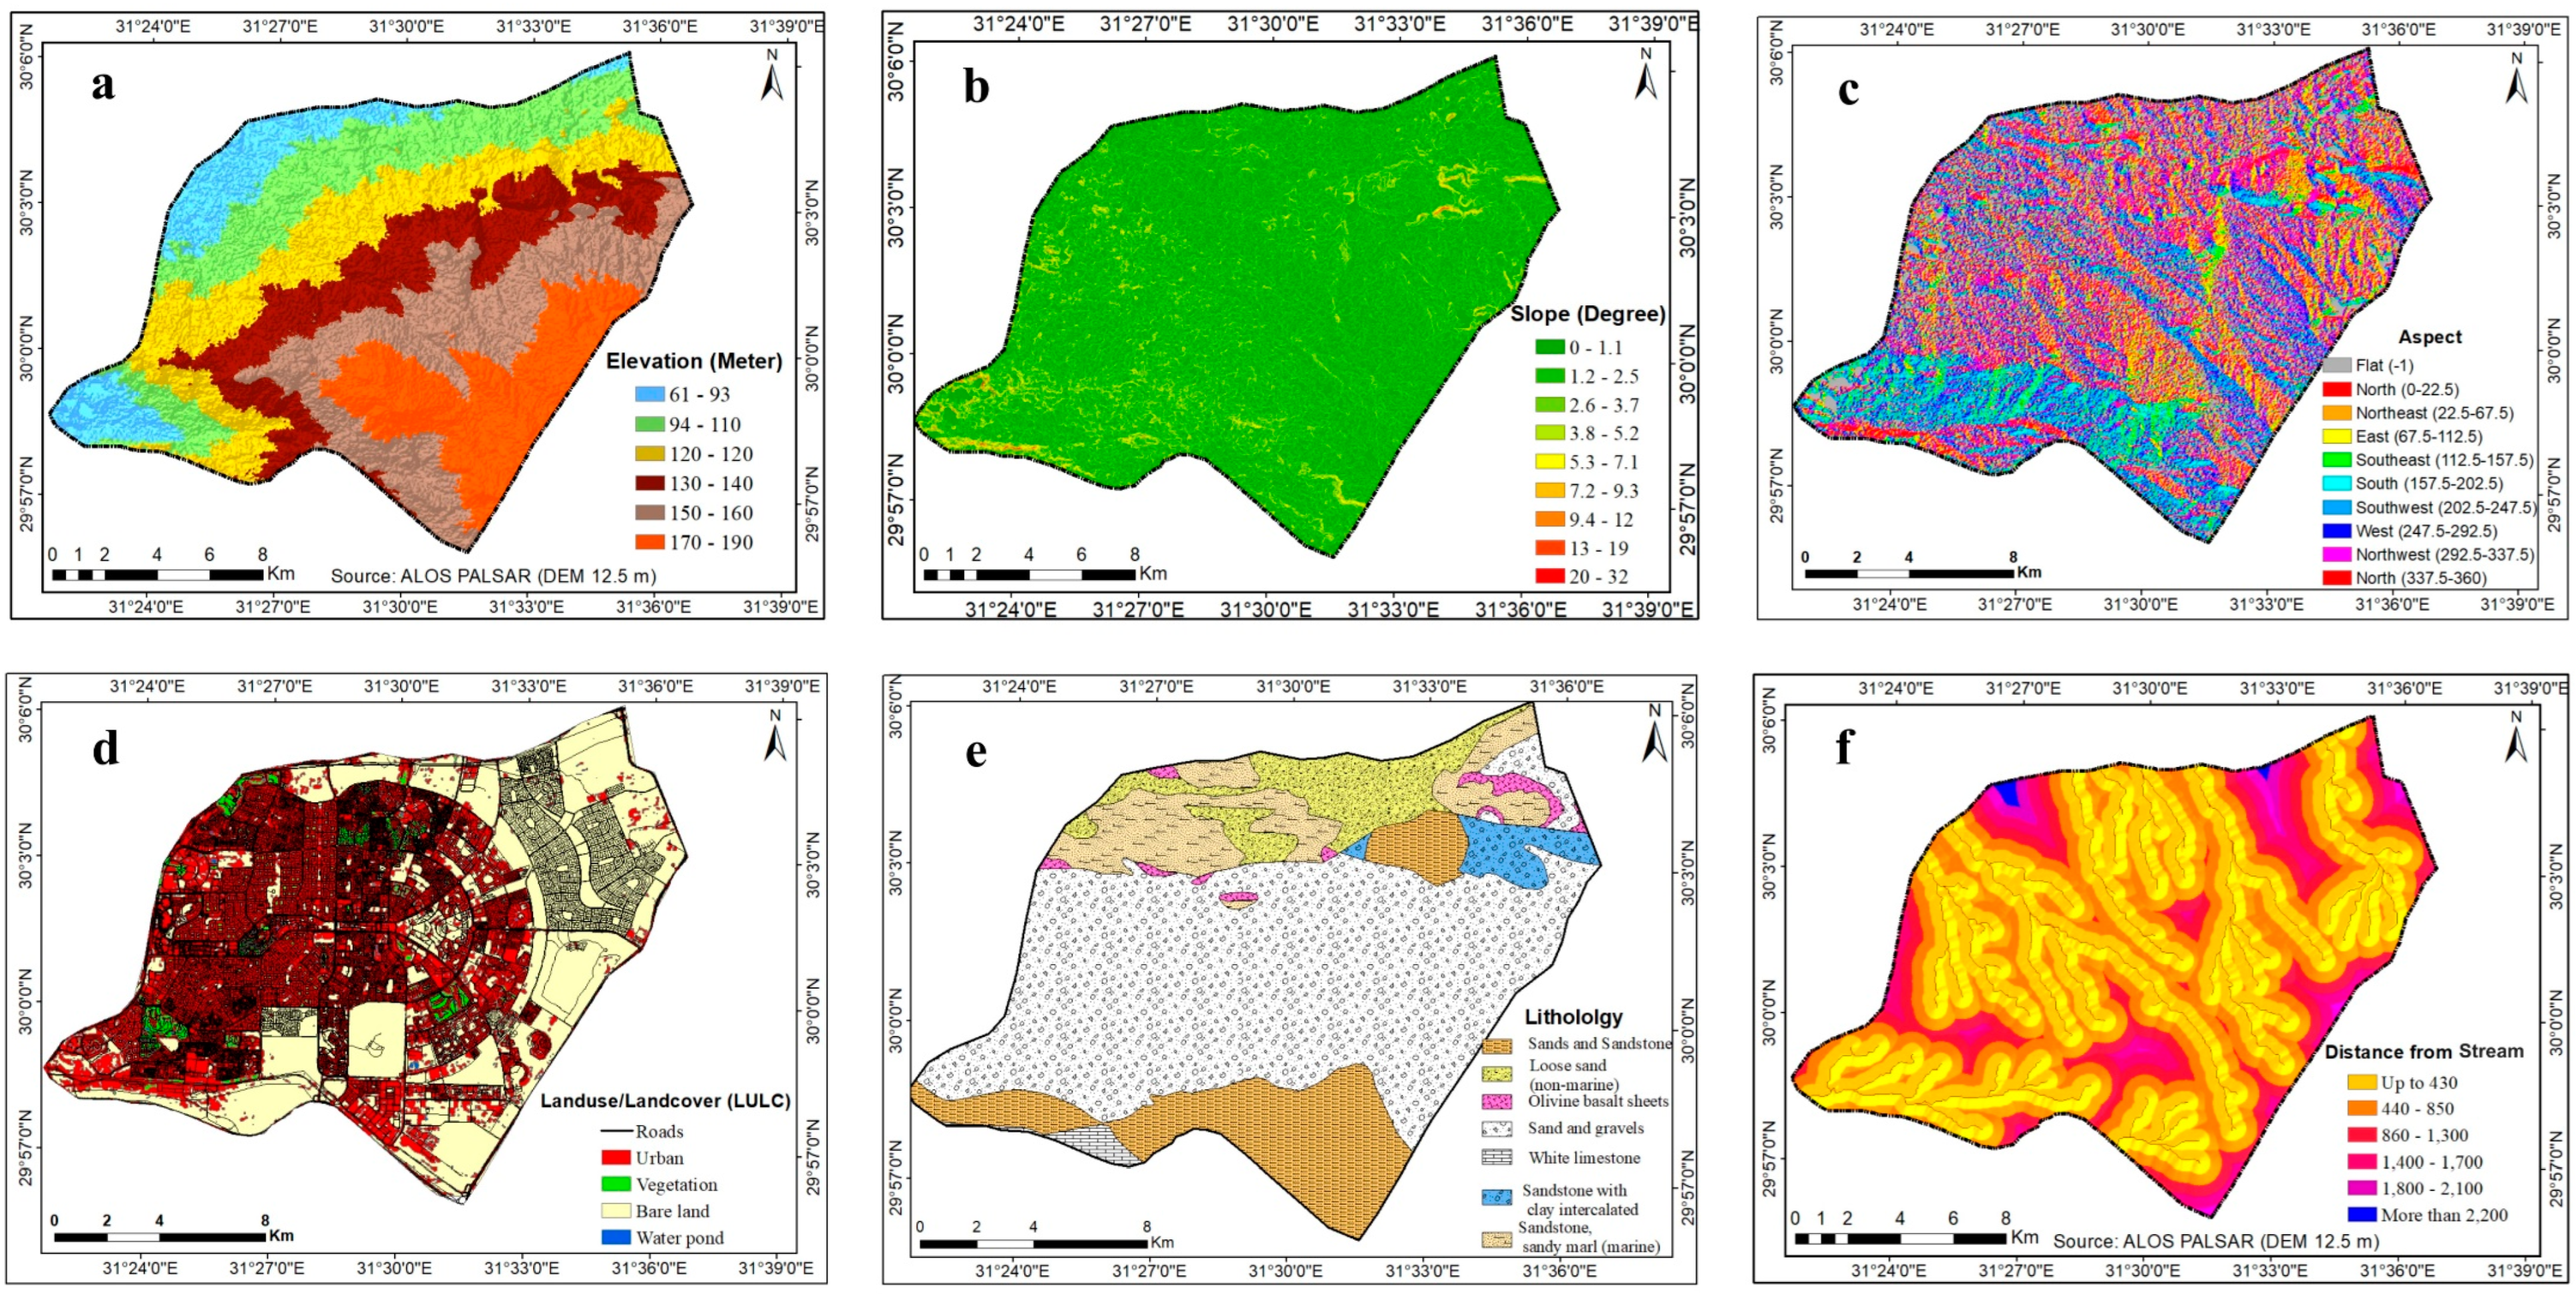
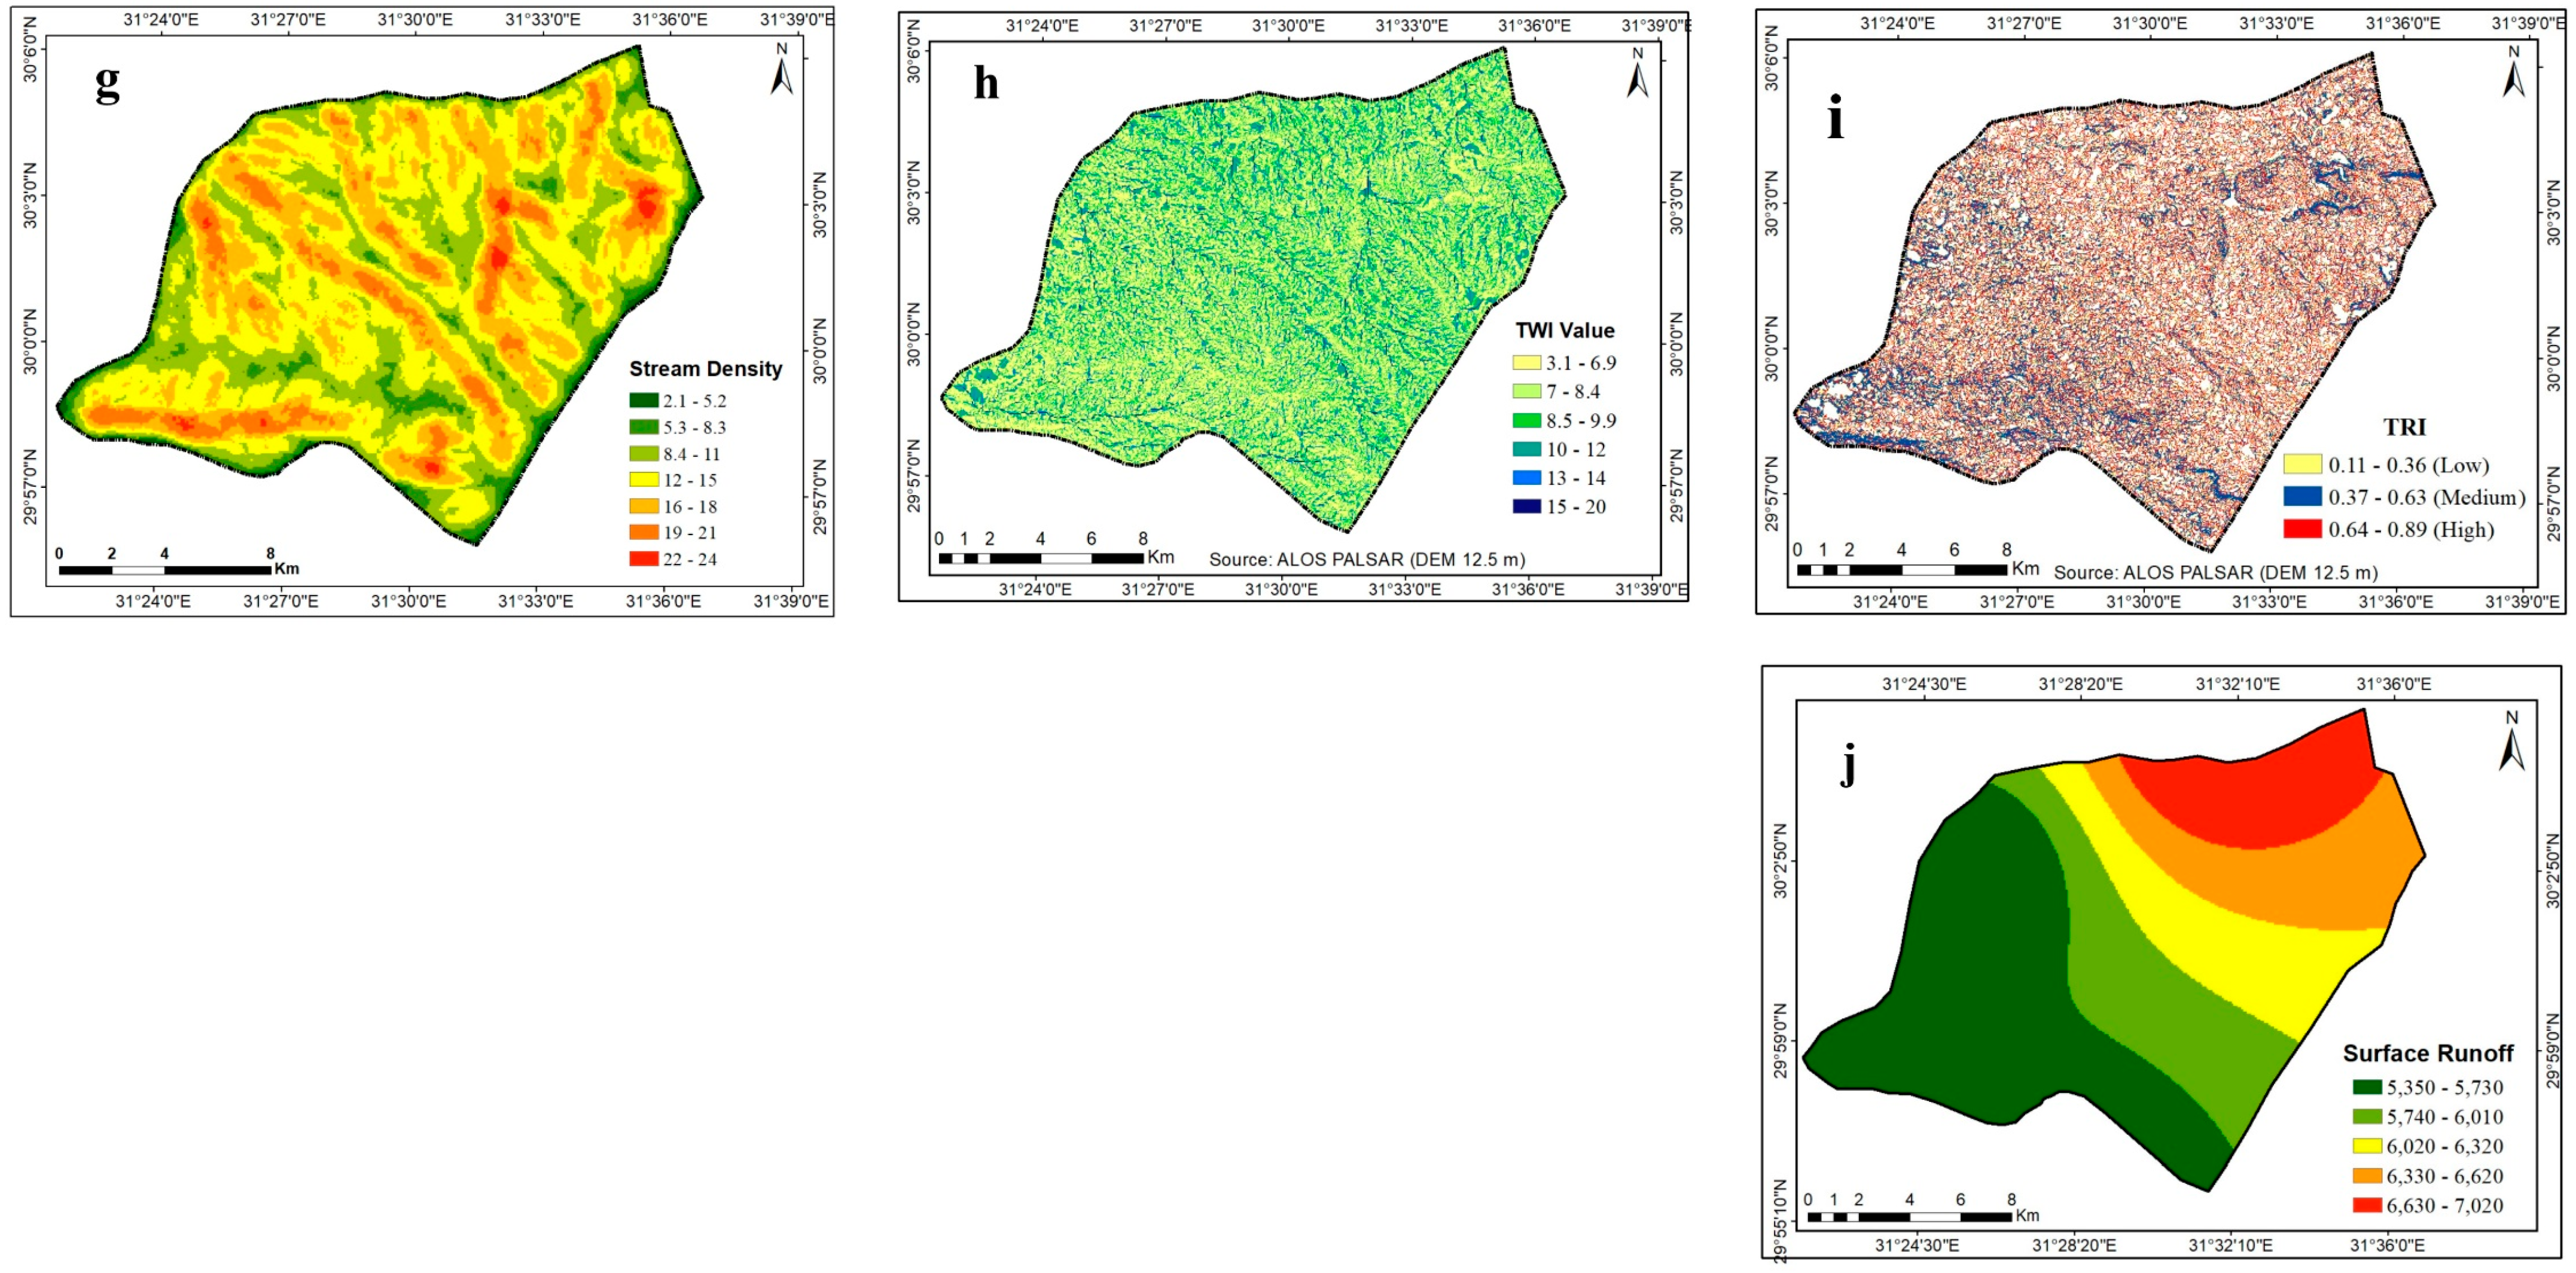
2.5. Flood Conditioning Factors

The flood susceptibility map was generated utilizing ten environmental criteria, including elevation, slope, aspect, LULC, lithology, stream distance, stream density, TWI, surface runoff, and TRI. According to Bui et al. [63], elevation has a significant impact on flood vulnerability because there is a negative correlation between elevation and floods. In other words, flash floods have less of an impact as elevation rises [64]. DEM elevations in the research region ranged from 61 to 190 m a.s.l (Figure 6a), with greater elevations found in the area’s east and southeast. Flooding is a physiographic event that is closely tied to slope since water tends to build up in lower slope areas [63,65]. ArcGIS 3-D analysis methods were used to prepare a slope map using ASTER data (Figure 6b). The slope aspect can have a significant impact on the direction of rainfall, and the significance of aspect is found in its relationship to the direction of prevalent meteorological phenomena [32]. The aspect thematic layer was also created in ArcMap using spatial analysis tools (Figure 6c). Landuse/Landcover (LU/LC) is a crucial factor impacting flood susceptibility [66,67]. LULC affects infiltration, evapotranspiration, and surface runoff generation directly or indirectly. Supervised classification from Landsat-8 OLI imagery was employed to build the LULC map [68] (Figure 6d). Additionally, lithology is essential in causing floods because impermeable rock units increase runoff by decreasing infiltration rates. The lithological units of the study area were digitized at a scale of 1:500,000 from CONOCO [69] (Figure 6e). In addition, stream distance is the main pathway for flood discharge; thus, places near streams are more vulnerable to flooding [70]. Stream networks in the research area were identified using Arc Hydro tools that are part of ArcMap. Data from the stream network was used to create thematic layers that show the stream distance and stream density (Figure 6f,g). The topographic wetness index (TWI) and terrain ruggedness index (TRI) are determined to identify high topographic areas and wet areas at high risk of flash flooding. Spatial distribution maps of TWI and TRI were created using ArcGIS, with values ranging from 3.1 to 20 and from 0.11 to 0.89, respectively (Figure 6h,i). Due to a lack of infiltration surfaces, surface runoff is typically reinforced in urban regions, which leads to destructive urban flooding. Forecasting floods, which occur suddenly, flashily, and for a brief period of time, heavily depends on surface runoff caused by storm rainfall [71]. Based on a soil conservation service (SCS) model, a surface runoff database was created (Figure 6j).

2.6. Frequency Ratio Method

The FR technique, which represents the likelihood of the occurrence of a particular feature, was first introduced by Bonham-Carter [72,73,74]. It should be noted that under the FR model, a class with a higher value indicates a class’s greater potential for an incident (such as a flash flood, landslide, or groundwater potentiality). In the context of this study, it suggests that a place is more susceptible to artificial recharging through FSM. FR is calculable as follows:
F R = F S N F S total / A A total
where FSN indicates the total number of FSM locations, FS total displays all FSM locations, A shows the total number of FSM points in each category of variables, and total displays all cells in the region under study. The term FR denotes the frequency ratio for various FSM conditioning factor classes. The following equation is used to determine each pixel’s final FR value [25,75,76]:
FSMR = ∑ (FR)j (j = 1, 2, …… n)
where j is various FSM conditioning factors, and FSMR is the final FR value for each individual pixel.
Each controlling factor’s FR value was calculated using ArcGIS and Microsoft Excel and its importance in flood susceptibility (Table 1). Accordingly, elevation, slope, aspect, LULC, lithology, stream distance, and stream density had the highest importance values in the modelling process. On the other hand, TWI, TRI, and surface runoff had the least important values. Using ArcMap 10.7, the FSM map was produced using the FR approach by integrating the FR layers of the controlling parameters (Equation (3)).
G F S M = i = 1 n F R

3. Results and Discussion

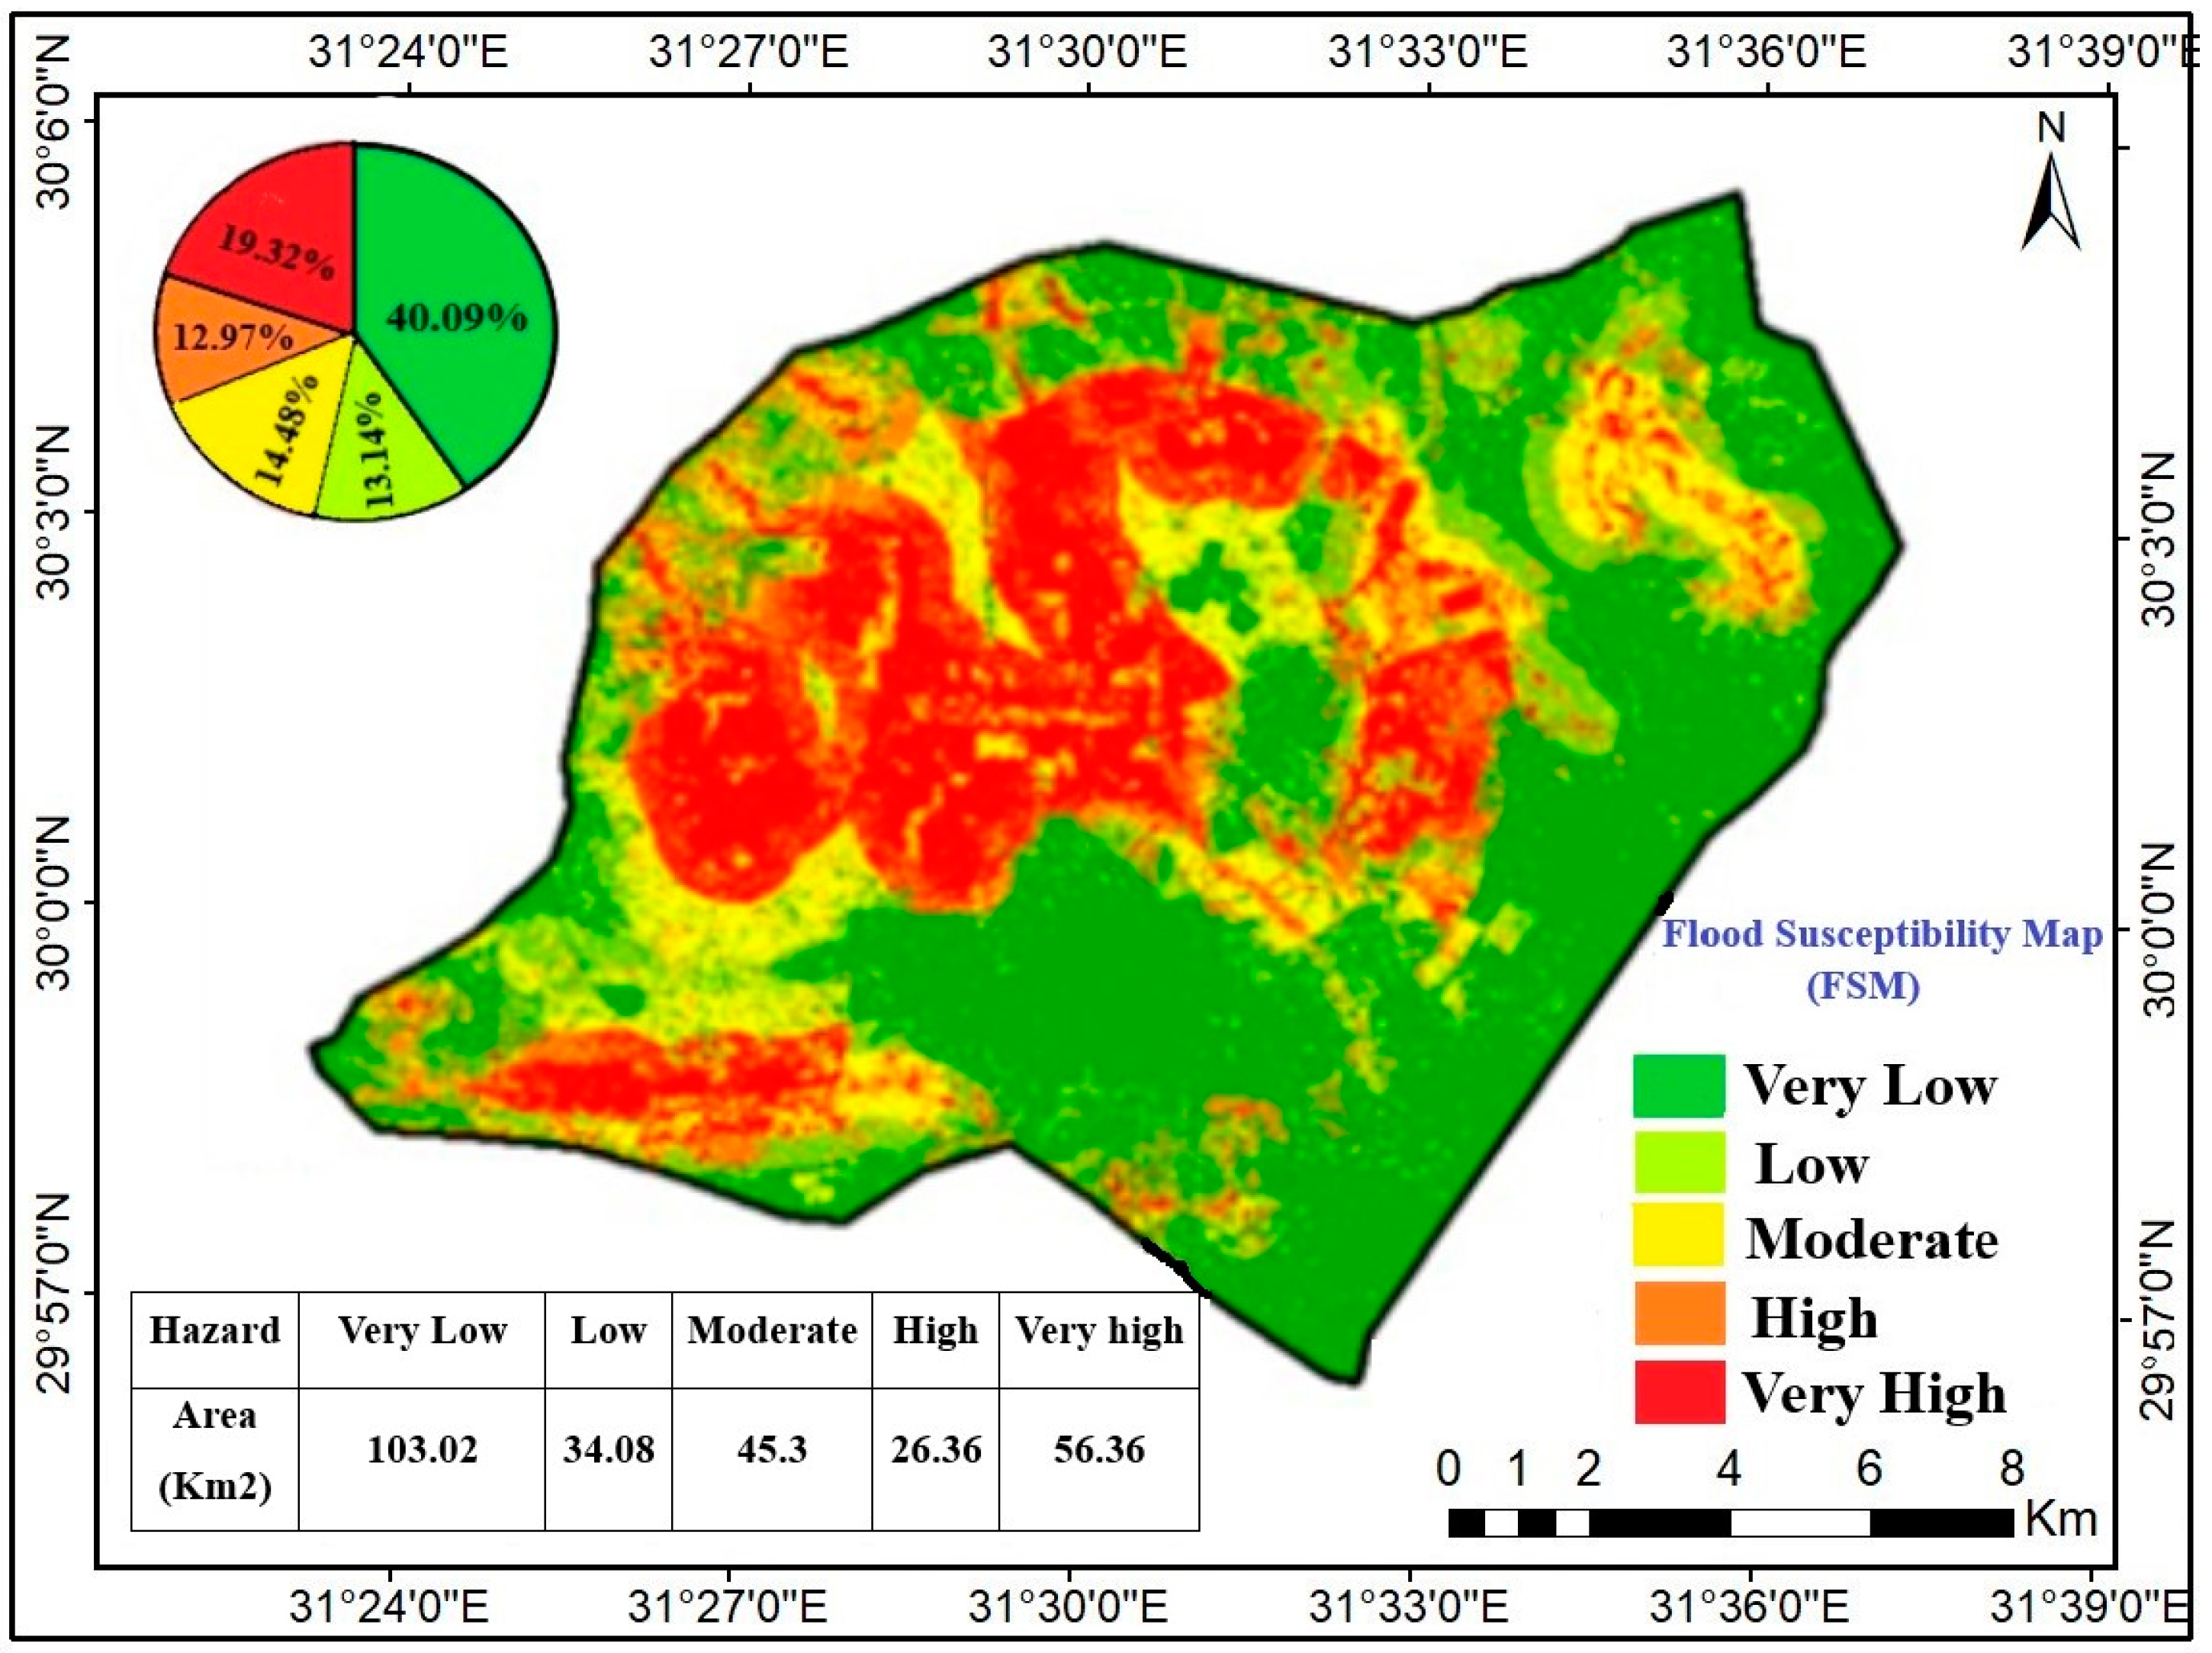
3.1. Flood Susceptibility Map (FSM)

Depending on the FR values and the previously indicated approach applied to the top ten thematic layers, the flood vulnerability zones were estimated. According to the findings, classes 170–190, 10–20, and 18.8 had the lowest values of FR for elevation, slope, and aspect (0.2, 4.8, and 0.3, respectively). The FR values were inversely correlated with high elevation, slope, and aspect values, resulting in the lowest flood probability. With FR values more than 2, locations closer than 430 m from a stream had a higher likelihood of experiencing flash floods. Additionally, the analysis of the stream density showed that classes with densities greater than >22 km km−2 had the greatest value of FR (2.2), followed by classes with densities between 8.4 and 11 km km−2. (1.5). The class of sandstone and gravel deposits had the lowest FR value (1.2) and a high chance of flash floods, whereas the class of limestone formations had the highest FR value (5.6) and a high probability of flash floods. The areas with the largest frequency ratio (FR = 3.6, respectively) and the highest values of TWI and TRI (>19 and 0.64–0.89), respectively, demonstrate high vulnerability to flooding threats. The surface runoff parameter indicated that the areas with the highest frequency ratio (3.3) and, consequently, the highest likelihood of flooding were those with the highest surface runoff rate (6.6–7 m). According to the FSM, places with a large concentration of structures are the ones most in danger of flooding, whilst open spaces are less vulnerable. This finding supports the idea that metropolitan areas with low infiltration values are more susceptible to flooding. According to the findings, 20% of the research region is classified as having a very high risk of flash flood hazards (Figure 7). Contrarily, more than 50% of the area under investigation is less in danger of flooding (40.09% is classified as having extremely low risk, and 13.14% as having low-risk levels, respectively).
The area, with that extension, is threatened by the danger of runoff due to the flow of water that collects in the stomachs of the main valleys and descends according to the directions of the various slopes and at a speed that varies according to the slope angles, causing torrential torrents that destroy the human activities that obstruct their path, and increase the risk of water erosion in the region due to the presence of dense drainage networks with tributaries Figure 6g.

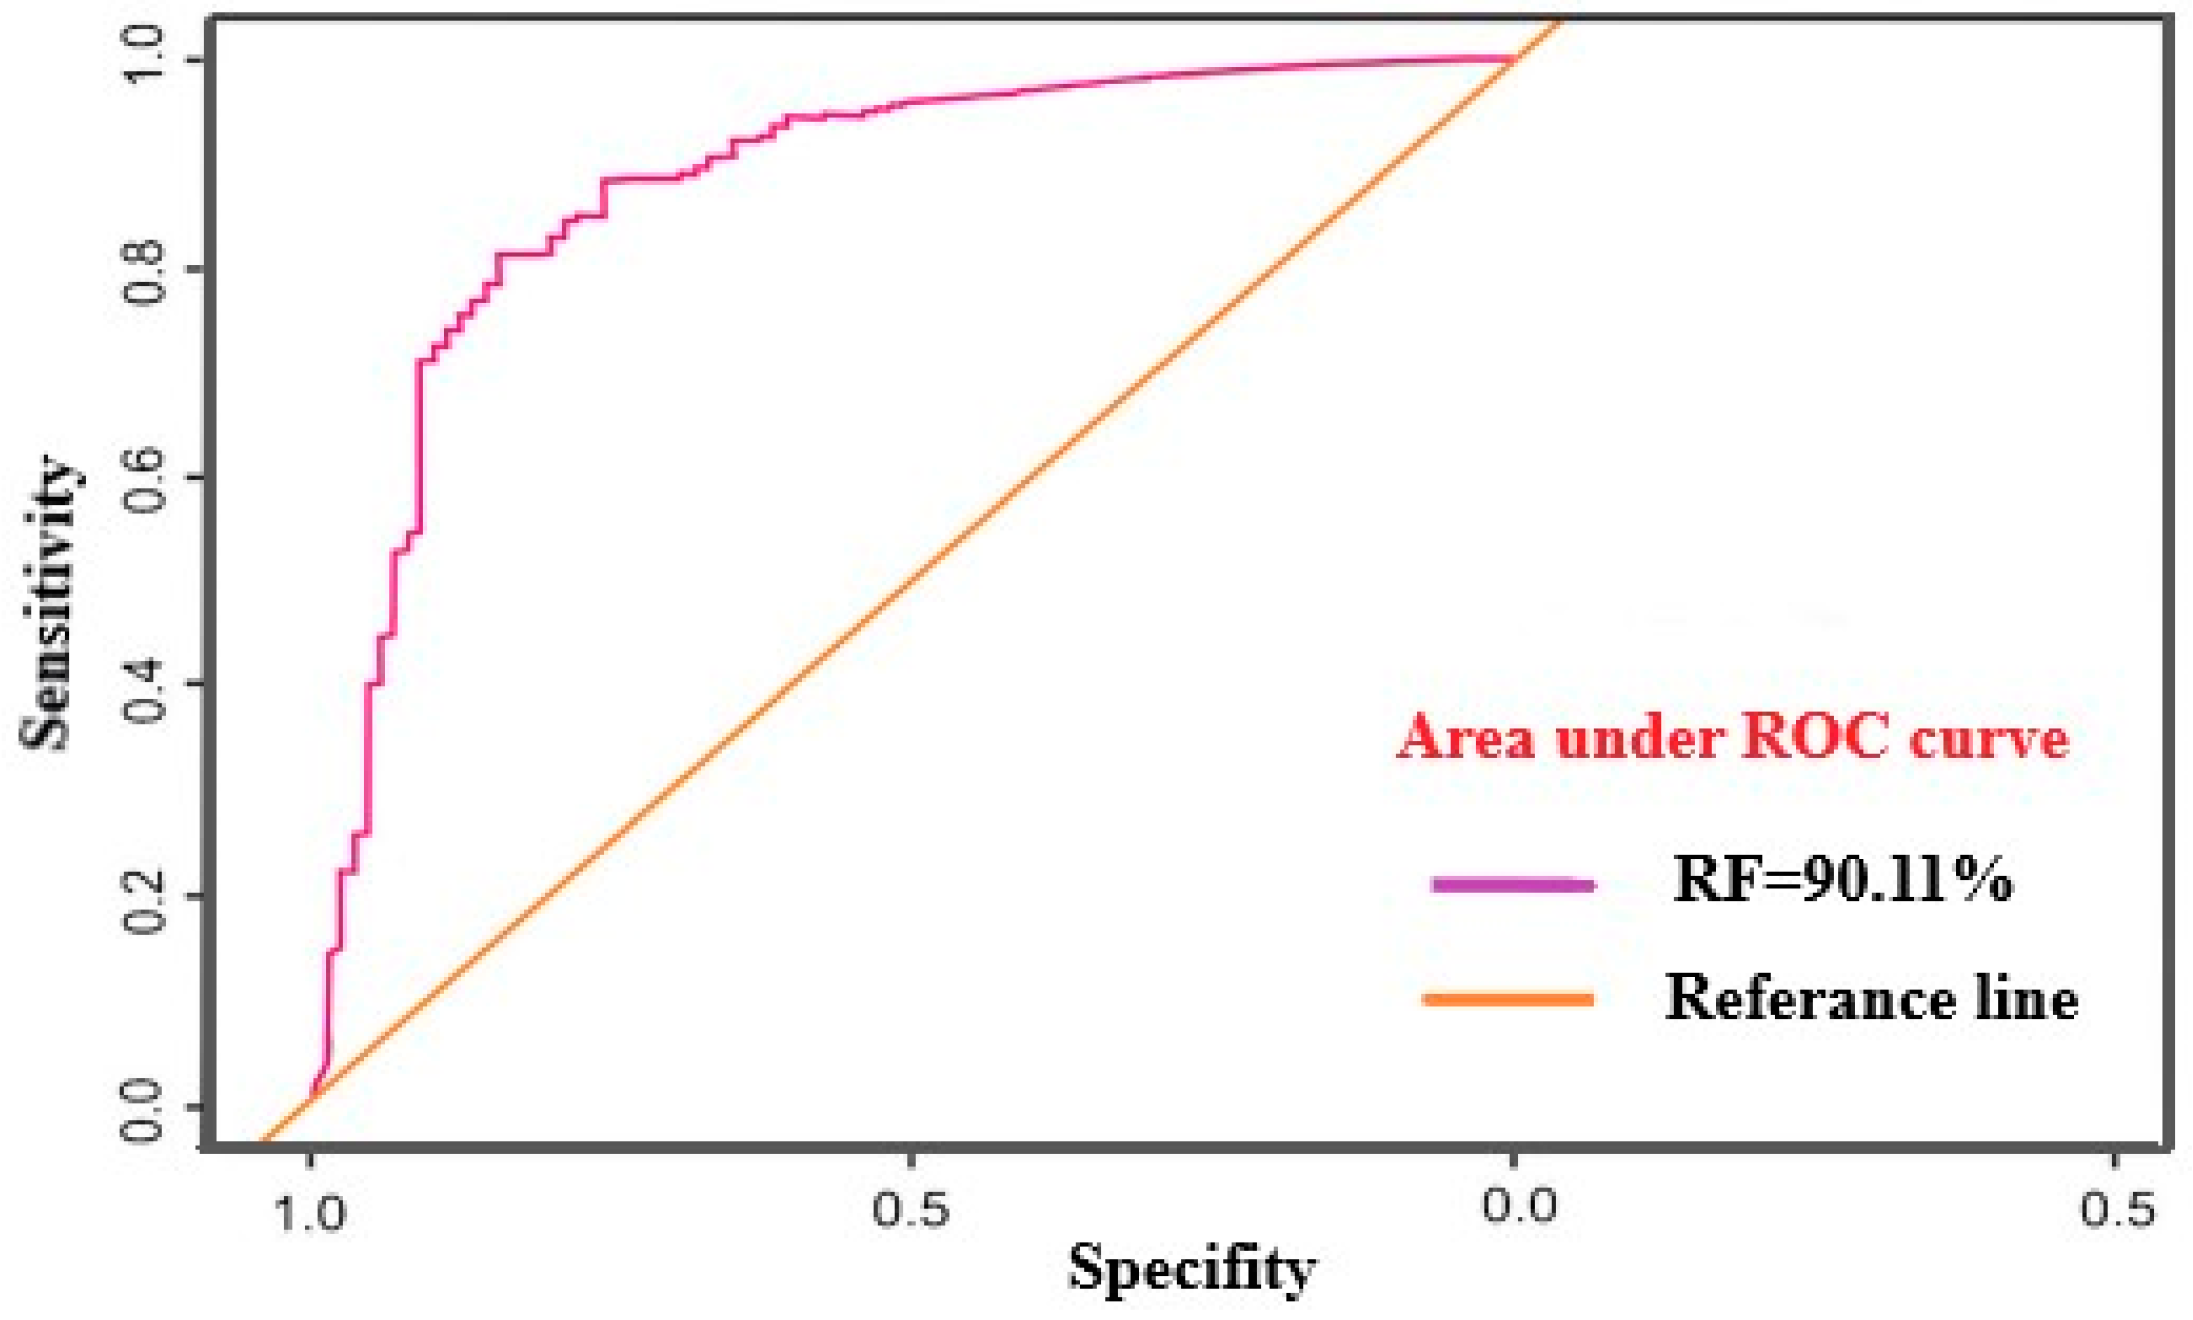
3.2. Model Validation

To evaluate the efficacy of the FR model, ROC was employed to corroborate the predictions’ correctness [77,78]. The vertical axis shows sensitivity, whereas the horizontal axis displays specificity [79]. The estimated models have been graded as poor, medium, good, very good, or outstanding in AUC-ROC ranges of 0.5–0.6, 0.6–0.7, 0.7–0.8, 0.8–0.9, and 0.9–1, respectively. Yesilnacar [80] classified models as poor, fair, good, very good, or exceptional based on the AUC-ROC ranges. The calculated area under the curve (AUC) for Figure 8 was found to be 90.11%, indicating a very good, effective model that may produce trustworthy results.
The role of geological formations (Figure 3) is considered the basis of hydrological studies, and an important factor to consider is a formation’s connection with the water-bearing layers and the ability of rocks to permeate water to feed the aquifer. In addition, the relationship between the surface characteristics and their influence on the degree of slope on the intensity of runoff is also important, as it turns out that there are interchangeable layers of soft rocks. The process of sculpting by flowing runoff on rocks with greater resistance, such as limestone rocks, indicates that the region was affected by erosion factors resulting from water runoff and then the phenomenon of undermining the bottom of the slopes, which led to rockslides in the region and increased rates of retreat of rocky edges.
The city of New Cairo has a dense network of roads of all degrees and road widths that, in general, vary with location in the region and the degree of connection to neighborhoods. It is noted that the periodic paving operations, which result in an explicit change and transformation of the land surface from just a natural surface permeable to water in varying proportions to a solid artificial surface that prevents the natural drainage of falling rainwater, increase the rates of runoff risk in urban areas if the slope factor and its direct impact participate with it. The velocity of runoff indicates the ability of water to carry rock and soil materials.
In this study, we analyzed the spatial relationships between all inputs using a process of digital conversion of the surface water drainage network that threatens the region. Additionally, we utilized spatial analysis to determine the areas threatened by the danger of surface runoff on all types of land use in the region. This is also due to the uncalculated encroachments on the old valleys’ streams, changes in land uses, the lack of avoidance of the main valleys’ streams, the general slope trends, and the inclinations of the earth’s surface in different neighborhoods of the city that vary in their geographical distribution and degree of their danger.
Flash floods pose a significant threat to the safety and well-being of communities around the world, including in New Cairo, Egypt. A growing body of research has sought to understand the causes and impacts of flash floods in this region, as well as to develop effective mitigation strategies to reduce their frequency and severity.
Several recent studies have shed light on the factors contributing to flash floods in New Cairo. For example, Elsanabary and Elsanabary [81] used GIS-based multi-criteria decision analysis to create a flash flood susceptibility map for the city, identifying areas at high risk for flooding. Similarly, El-Sayed and El-Sayed [82] assessed the flash flood hazard and risk in the Wadi Degla Protectorate area of New Cairo, finding that the main factors contributing to flash floods were land use change, urbanization, and climate change.
Other studies have focused on the impacts of flash floods in New Cairo and potential mitigation strategies. Elsanabary and Elsanabary [83] developed a flash flood risk map for the city, highlighting the importance of improved drainage systems and land use management to reduce the risk of flooding. Megahed and El Bastawesy [84] analyzed the impact of flash floods on the urban environment in New Cairo, emphasizing the need for better infrastructure and emergency response plans.
Overall, these studies highlight the urgent need for effective measures to mitigate the impact of flash floods in New Cairo, particularly in light of the increasing frequency and severity of this natural hazard.

4. Conclusions

This study aimed to analyze the flash flood susceptibility zones by using an FR model with ten independent parameters. This was performed considering that the higher the input, the more dependable the accuracy of the results. As a result, only areas where the necessary number of flash flood locations is at least 100 points could be subject to the mapping of flash flood vulnerable zones using the FR model. In total, 147 flooded locations were collected from field and satellite data of pre- and post-flash flood events. Frequency ratio techniques as tools were used in this study to create an accurate FSM map in New Cairo City. Researchers and scientists can use this tool to gain insights about effective methods for handling massive datasets. In our study, we used ten conditioning factors (elevation, slope, aspect, LULC, lithology, stream distance, stream density, TWI, TRI, and surface runoff) that have been developed and used in the FR technique’s training data as input. According to our findings, the flood susceptibility map has been categorized as having very low, low, moderate, high, and very high risk, which correspond to 40.09%, 13.14%, 14.48%, 12.97%, and 19.32% of the total area of the city, respectively. The findings of the susceptibility map showed a high flood risk in regions with low elevation, low slope and aspect, and near proximity to stream networks, urban areas as well high topographic areas, and wet areas. Decision makers could use the generated flood susceptibility map as a reference to step up preventive measures in areas that are particularly vulnerable to flash flood threats. Eventually, the AUC-ROC curve was used to perform and validate the used models, with an accuracy of 90.11% area under the curve. In order to build a deeper understanding of flash flood crisis mitigation, future studies will need to integrate models, such as logistic regression and weights of evidence. The findings reported here can act as a jumping-off point for subsequent research on flood evaluation and could give researchers a better understanding of the study area’s vulnerability to flash floods.

Author Contributions

Conceptualization, H.A.M., A.M.A. and M.N.H.; methodology, H.A.M., A.M.A., M.A.E.A. and M.N.H.; software, H.A.M., A.M.A., M.A.E.A. and M.N.H.; validation, H.A.M.; A.M.A., M.A.E.A. and M.N.H.; formal analysis, H.A.M., A.M.A. and M.N.H.; investigation, H.A.M., A.M.A., M.A.E.A. and M.N.H.; resources, H.A.M., A.M.A., M.A.E.A. and M.N.H.; data curation, H.A.M., A.M.A., M.A.E.A., A.S. and M.N.H.; writing-original draft preparation, H.A.M., A.M.A., M.A.E.A., A.S. and M.N.H.; writing-review and editing, H.A.M., A.M.A., M.A.E.A., A.S. and M.N.H.; visualization, H.A.M. and M.N.H.; supervision, H.A.M. and M.N.H.; project administration, H.A.M., A.M.A., M.A.E.A. and M.N.H.; funding acquisition, H.A.M., A.M.A., M.A.E.A., A.S. and M.N.H. All authors have read and agreed to the published version of the manuscript.

Funding

The work received no fund.

Institutional Review Board Statement

Not applicable.

Informed Consent Statement

Not applicable.

Data Availability Statement

The data presented in this study are available upon request from the corresponding author.

Acknowledgments

The authors are grateful for support in carrying out this work from the National Authority for Remote Sensing and Space Sciences (NARSS), Cairo 11769, Egypt and SAFE University of Basilicata, Potenza Italy. We sincerely thank the editor and all reviewers for their valuable feedback that we have permitted to improve the quality of our manuscript.

Conflicts of Interest

The authors declare no conflict of interest.

References

  1. Sarkar, D.; Mondal, P. Flood vulnerability mapping using frequency ratio (FR) model: A case study on Kulik river basin, Indo-Bangladesh Barind region. Appl. Water. Sci. 2020, 10, 17. [Google Scholar] [CrossRef]
  2. Natarajan, L.; Usha, T.; Gowrappan, M.; Kasthuri, B.P.; Moorthy, P.; Chokkalingam, L. Flood Susceptibility Analysis in Chennai Corporation Using Frequency Ratio Model. J. Indian Soc. Remote Sens. 2021, 49, 1533–1543. [Google Scholar] [CrossRef]
  3. Samanta, R.K.; Bhunia, G.S.; Shit, P.K.; Pourghasemi, H.Z. Flood susceptibility mapping using geospatial frequency ratio technique: A case study of Subarnarekha River Basin, India. Model. Earth Syst. Environ. 2018, 4, 395–408. [Google Scholar] [CrossRef]
  4. Addis, A. GIS–based flood susceptibility mapping using frequency ratio and information value models in upper Abay river basin, Ethiopia. Nat. Hazards Res. 2023, 3, 247–256. [Google Scholar] [CrossRef]
  5. Wang, Y.; Fang, Z.; Hong, H.; Costache, R.; Tang, X. Flood susceptibility mapping by integrating frequency ratio and index of entropy with multilayer perceptron and classification and regression tree. J. Environ. Manag. 2021, 289, 112449. [Google Scholar] [CrossRef] [PubMed]
  6. Duangyiwa, C.; Cheewinsiriwat, P. Flood Susceptibility Mapping Using a Frequency Ratio Model: A Case Study of Chai Nat Province, Thailand. In Applied Geography and Geoinformatics for Sustainable Development; Springer Geography; Boonpook, W., Lin, Z., Meksangsouy, P., Wetchayont, P., Eds.; Springer: Cham, Switzerland, 2023. [Google Scholar] [CrossRef]
  7. Waqas, H.; Lu, L.; Tariq, A.; Li, Q.; Baqa, M.F.; Xing, J.; Sajjad, A. Flash Flood Susceptibility Assessment and Zonation Using an Integrating Analytic Hierarchy Process and Frequency Ratio Model for the Chitral District, Khyber Pakhtunkhwa, Pakistan. Water 2021, 13, 1650. [Google Scholar] [CrossRef]
  8. Poff, N.L. Beyond the natural flow regime? Broadening the hydro-ecological foundation to meet environmental flows challenges in a non-stationary world. Freshw. Biol. 2018, 63, 1011–1021. [Google Scholar] [CrossRef]
  9. Norallahi, M.; Seyed Kaboli, H. Urban flood hazard mapping using machine learning models: GARP, RF, MaxEnt and NB. Nat. Hazards 2021, 106, 119–137. [Google Scholar] [CrossRef]
  10. Li, H.; Harvey, J.T.; Holland, T.J.; Kayhanian, M. Corrigendum: The use of reflective and permeable pavements as a potential practice for heat island mitigation and stormwater management. Environ. Res. Lett. 2013, 8, 049501. [Google Scholar] [CrossRef]
  11. Liu, A.; Goonetilleke, A.; Egodawatta, P. Role of Rainfall and Catchment Characteristic on Urban Stormwater Quality; Springer: Singapore, 2015; pp. 1–96. Available online: https://link.springer.com/book/10.1007/978-981-287-459-7 (accessed on 1 June 2022).
  12. Fonseca, A.R.; Santos, M.; Santos, J.A. Hydrological and flood hazard assessment using a coupled modelling approach for a mountainous catchment in Portugal. Stoch. Environ. Res. Risk Assess. 2018, 32, 2165–2177. [Google Scholar] [CrossRef]
  13. Laouacheria, F.; Kechida, S.; Chabi, M. Modelling the impact of design rainfall on the urban drainage system by Storm Water Management Model. J. Water Land Dev. 2019, 40, 119–125. [Google Scholar] [CrossRef]
  14. Wiles, J.J.; Levine, N.S. A combined GIS and HEC model for the analysis of the effect of urbanization on flooding; the Swan Creek watershed, Ohio. Environ. Eng. Geosci. 2002, 8, 47–61. [Google Scholar] [CrossRef]
  15. Rangari, V.A.; Sridhar, V.; Umamahesh, N.V.; Patel, A.K. Floodplain mapping and management of urban catchment using HEC-RAS: A case study of Hyderabad City. J. Inst. Eng. (India) Ser. A 2019, 100, 49–63. [Google Scholar] [CrossRef]
  16. Youssef, A.M.; Pradhan, B.; Sefry, S.A. Flash flood susceptibility assessment in Jeddah city (Kingdom of Saudi Arabia) using bivariate and multivariate statistical models. Environ. Earth Sci. 2016, 75, 12. [Google Scholar] [CrossRef]
  17. Giovannettone, J.; Copenhaver, T.; Burns, M.; Choquette, S. A statistical approach to mapping flood susceptibility in the Lower Connecticut River Valley Region. Water Resour. Res. 2018, 54, 7603–7618. [Google Scholar] [CrossRef]
  18. Ozdemir, A. GIS-based groundwater spring potential mapping in the Sultan Mountains (Konya, Turkey) using frequency ratio, weights of evidence and logistic regression methods and their comparison. J. Hydrol. 2011, 411, 290–308. [Google Scholar] [CrossRef]
  19. Rahmati, O.; Pourghasemi, H.R.; Zeinivand, H. Flood susceptibility mapping using frequency ratio and weights-of-evidence models in the Golastan Province, Iran. Geocarto Int. 2016, 31, 42–70. [Google Scholar] [CrossRef]
  20. Naghibi, S.A.; Moradi Dashtpagerdi, M. Evaluation of four supervised learning methods for groundwater spring potential mapping in Khalkhal region (Iran) using GIS-based features. Hydrogeol. J. 2016, 25, 169–189. [Google Scholar] [CrossRef]
  21. Chen, W.; Fan, L.; Li, C.; Pham, B.T. Spatial prediction of landslides using hybrid integration of artificial intelligence algorithms with frequency ratio and index of entropy in Nanzheng county, China. Appl. Sci. 2020, 10, 29. [Google Scholar] [CrossRef]
  22. Naghibi, S.A.; Dolatkordestani, M.; Rezaei, A.; Amouzegari, P.; Heravi, M.T.; Kalantar, B.; Pradhan, B. Application of rotation forest with decision trees as base classifier and a novel ensemble model in spatial modeling of groundwater potential. Environ. Monit. Assess. 2019, 191, 248. [Google Scholar] [CrossRef]
  23. Naghibi, S.A.; Moghaddam, D.D.; Kalantar, B.; Pradhan, B.; Kisi, O. A comparative assessment of GIS-based data mining models and a novel ensemble model in groundwater well potential mapping. J. Hydrol. 2017, 548, 471–483. [Google Scholar] [CrossRef]
  24. Rahmati, O.; Falah, F.; Naghibi, S.A.; Biggs, T.; Soltani, M.; Deo, R.C.; Cerdà, A.; Mohammadi, F.; Bui, D.T. Land subsidence modelling using tree-based machine learning algorithms. Sci. Total Environ. 2019, 672, 239–252. [Google Scholar] [CrossRef] [PubMed]
  25. Lee, S.; Pradhan, B. Landslide hazard mapping at Selangor, Malaysia using frequency ratio and logistic regression models. Landslides 2007, 4, 33–41. [Google Scholar] [CrossRef]
  26. Mousavi, S.M.; Golkarian, A.; Naghibi, S.A.; Kalantar, B.; Pradhan, B. GIS-based groundwater spring potential mapping using data mining boosted regression tree and probabilistic frequency ratio models in Iran. Aims. Geosci. 2017, 3, 91–115. [Google Scholar] [CrossRef]
  27. Khidr, M.M. The Main Geomorphological Hazards in EGYPT. Master’s Thesis, Department of Geography, Faculty of Arts, Ain Shams University, Cairo, Egypt, 1997; p. 513. (In Arabic). [Google Scholar]
  28. Moawad, M.B. Analysis of the flash flood occurred on 18 January 2010 in wadi El Arish, Egypt (a case study). Geomat. Nat. Hazards Risk 2013, 4, 254–274. [Google Scholar] [CrossRef]
  29. Moawad, M.B.; Abdel Aziz, A.O.; Mamtimin, B. Flash floods in the Sahara: A case study for the 28 January 2013 flood in Qena, Egypt. Geomat. Nat. Hazards Risk 2016, 7, 215–236. [Google Scholar] [CrossRef]
  30. Ashmawi, M.H. Assessment of flash flood potential of the Red Sea drainage basins along the Qena-Safaga Highway, Eastern Desert, Egypt. ITC J. 1994, 2, 119–128. Available online: http://pascal-francis.inist.fr/vibad/index.php?action=getRecordDetail&idt=6337642 (accessed on 1 June 2022).
  31. Youssef, A.M.; Abdel Moneim, A.A.; Abu El-Maged, S.A. Flood hazard assessment and its associated problems using geographic information systems, Sohag Governorate, Egypt. In Proceedings of the Fourth International Conference on the Geology of Africa, Assiut, Egypt, 15–16 November 2005; Volume 1, pp. 1–17. [Google Scholar]
  32. Youssef, A.M.; Pradhan, B.; Pourghasemi, H.R.; Abdullahi, S. Landslide susceptibility assessment at Wadi Jawrah Basin, Jizan region, Saudi Arabia using two bivariate models in GIS. Geosci. J. 2015, 19, 449–469. [Google Scholar] [CrossRef]
  33. Abu El-Magd, S.A.; Amer, R.A.; Embaby, A. Multi-criteria decision-making for the analysis of flash floods: A case study of Awlad Toq-Sherq, Southeast Sohag, Egypt. J. Afr. Earth Sci. 2020, 162, 103709. [Google Scholar] [CrossRef]
  34. Abu El-Magd, S.A.; Ali, S.A.; Pham, Q.B. Spatial modeling and susceptibility zonation of landslides using random forest, naïve bayes and K-nearest neighbor in a complicated terrain. Earth Sci. Inform. 2021, 14, 1227–1243. [Google Scholar] [CrossRef]
  35. FLOODLIST. Egypt-EU and Red Crescent Respond to Help Flood Victims. 2016. Available online: http://floodlist.com/africa/egypt-eu-red-crescent-respond-help-flood-victims (accessed on 1 June 2022).
  36. Elnazer, A.A.; Salman, S.A.; Asmoay, A.S. Flash flood hazard affected Ras Gharib City, Red Sea, Egypt: A proposed flash flood channel. Nat. Hazards 2017, 89, 1389–1400. [Google Scholar] [CrossRef]
  37. IFRC. Emergency Plan of Action Final Report, Egypt: Floods. 2017. Available online: https://reliefweb.int/sites/reliefweb.int/files/resources/MDREG013dfr.pdf (accessed on 1 June 2022).
  38. FLOODLIST. Eastern Mediterranean-Deadly Flash Floods after Heavy Rain. 2018. Available online: http://floodlist.com/asia/eastern-mediterranean-egypt-israel-floods-april-2018 (accessed on 1 June 2022).
  39. FLOODLIST. Egypt-Heavy Rain Causes Flood Chaos in Cairo. 2019. Available online: http://floodlist.com/africa/egypt-cairo-floods-october-2019 (accessed on 30 December 2022).
  40. FLOODLIST. Egypt–5 Dead after Storms Trigger Floods. 2020. Available online: https://floodlist.com/africa/egypt-storm-floods-march-2020 (accessed on 30 December 2022).
  41. Ali, S.A.; Khatun, R.; Ahmad, A.; Ahmad, A.N. Application of GIS-based analytic hierarchy process and frequency ratio model to food vulnerable mapping and risk area estimation at Sundarban region, India. Model. Earth Syst. Environ. 2019, 5, 1083–1102. [Google Scholar] [CrossRef]
  42. Lee, M.J.; Kang, J.E.; Jeon, S. Application of frequency ratio model and validation for predictive fooded area susceptibility mapping using GIS. In Proceedings of the 2012 IEEE International Geoscience and Remote Sensing Symposium (IGARSS), Munich, Germany, 22–27 July 2012; pp. 895–898. [Google Scholar]
  43. Jebur, M.N.; Pradhan, B.; Tehrany, M.S. Optimization of landslide conditioning factors using very high-resolution airborne laser scanning (LiDAR) data at catchment scale. Remote Sens. Environ. 2014, 152, 150–165. [Google Scholar] [CrossRef]
  44. Tehrany, M.S.; Shabani, F.; Jebur, M.N.; Hong, H.; Chen, W.; Xie, X. GIS-based spatial prediction of food prone areas using standalone frequency ratio, logistic regression, weight of evidence and their ensemble techniques. Geomat. Nat. Hazards Risk 2017, 8, 1538–1561. [Google Scholar] [CrossRef]
  45. Faccini, F.; Luino, F.; Paliaga, G.; Roccati, A.; Turconi, L. Flash Flood Events along the West Mediterranean Coasts: Inundations of Urbanized Areas Conditioned by Anthropic Impacts. Land 2021, 10, 620. [Google Scholar] [CrossRef]
  46. Samanta, S.; Pal, D.K.; Palsamanta, B. Flood susceptibility analysis through remote sensing, GIS and frequency ratio model. Appl. Water Sci. 2018, 8, 66. [Google Scholar] [CrossRef]
  47. Shukri, N.M.; Akmal, M.G. The geology of Gebel El Nasuri and Gebel El Anqabia area, Cairo–Suez district. Bull. Soc. Geogr. Egypt 1953, 26, 276. [Google Scholar]
  48. Shukri, N.M.; El-Ayouty, M.K. The Geology of Gebel Iweibid Gebel Gafra area, Cairo-Suez District. Bull. Soc. Geogr. Egypt 1956, 29, 67–109. [Google Scholar]
  49. Khadrah, A. The Geology of Gebel Abu-Treifiya Area, Cairo-Suez District. Master’s Thesis, Faculty of Science, Cairo University, Cairo, Egypt, 1968. Available online: https://www.researchgate.net/publication/283009299 (accessed on 28 February 2021).
  50. Metwalli, M.H. The Study of Some Miocene Sediments in the Cairo-Suez District. Master’s Thesis, Faculty of Science, Cairo University, Cairo, Egypt, 1963. [Google Scholar]
  51. El-Belasy, M.I. Geology of Gebel El-Hamza–Um Qammar Area, Cairo-Ismailia District, Egypt. Master’s Thesis, Faculty of Science, Cairo University, Cairo, Egypt, 1986. [Google Scholar]
  52. Meneisy, M.Y. Volcanicity. In The Geology of Egypt; Said, R., Ed.; Balkema: Rotterdam, The Netherlands, 1990; pp. 157–172. [Google Scholar]
  53. Hussein, M. Geological Studies on Some Tertiary Sediments of Gebel Um-Raqm Area, Cairo-Suez District. Master’s Thesis, Faculty of Science, Cairo University, Cairo, Egypt, 1980. [Google Scholar]
  54. Egyptian Geological Survey and Mining Authority (EGSMA); Geological Survey of Egypt. Geological Map of Greater Cairo Area; Egyptian Geological Survey and Mining Authority (EGSMA): Cairo, Egypt, 1983. [Google Scholar]
  55. Xu, K.; Fang, J.; Fang, Y.; Sun, Q.; Wu, C.; Liu, M. The importance of Digital Elevation Model selection in flood simulation and a proposed method to reduce DEM errors: A case study in Shanghai. Int. J. Disaster Risk Sci. 2021, 12, 890–902. [Google Scholar] [CrossRef]
  56. Tehrany, M.S.; Pradhan, B.; Jebur, M.N. Flood susceptibility mapping using a novel ensemble weights-of-evidence and support vector machine models in GIS. J. Hydrol. 2014, 512, 332–343. [Google Scholar] [CrossRef]
  57. Tien Bui, D.; Hoang, N.D. A Bayesian framework based on a Gaussian mixture model and radial-basis-function Fisher discriminant analysis (BayGmmKda V1.1) for spatial prediction of floods. Geosci. Model Dev. 2017, 10, 3391–3409. [Google Scholar] [CrossRef]
  58. Elwatan News. 2020. Available online: https://www.elwatannews.com/news/details/5001979 (accessed on 30 November 2021).
  59. Bordbar, M.; Aghamohammadi, H.; Pourghasemi, H.R.; Azizi, Z. Multi-hazard spatial modeling via ensembles of machine learning and meta-heuristic techniques. Sci. Rep. 2022, 12, 1451. [Google Scholar] [CrossRef] [PubMed]
  60. Lee, S.; Hyun, Y.; Lee, S.; Lee, M.J. Groundwater potential mapping using remote sensing and GIS-based machine learning techniques. Remote Sens. 2020, 12, 1200. [Google Scholar] [CrossRef]
  61. Fernandes, F.T.; de Oliveira, T.A.; Teixeira, C.E.; Batista, A.F.D.M.; Dalla Costa, G.; Chiavegatto Filho, A.D.P. A multipurpose machine learning approach to predict COVID-19 negative prognosis in São Paulo, Brazil. Sci. Rep. 2021, 11, 3343. [Google Scholar] [CrossRef] [PubMed]
  62. Gadalla, A.A.; Friberg, I.M.; Kift-Morgan, A.; Zhang, J.; Eberl, M.; Topley, N.; Weeks, I.; Cuff, S.; Wootton, M.; Gal, M.; et al. Identification of clinical and urine biomarkers for uncomplicated urinary tract infection using machine learning algorithms. Sci. Rep. 2019, 9, 19694. [Google Scholar] [CrossRef] [PubMed]
  63. Bui, D.T.; Pradhan, B.; Nampak, H.; Bui, Q.T.; Tran, Q.A.; Nguyen, Q.P. Hybrid artificial intelligence approach based on neural fuzzy inference model and metaheuristic optimization for flood susceptibility modeling in a high-frequency tropical cyclone area using GIS. J. Hydrol. 2016, 540, 317–330. [Google Scholar] [CrossRef]
  64. Khosravi, K.; Nohani, E.; Maroufinia, E.; Pourghasemi, H.R. A GIS-based flood susceptibility assessment and its mapping in Iran: A comparison between frequency ratio and weights-of-evidence bivariate statistical models with multi-criteria decision-making technique. Nat. Hazards 2016, 83, 947–987. [Google Scholar] [CrossRef]
  65. Meraj, G.; Romshoo, S.A.; Yousuf, A.R.; Altaf, S.; Altaf, F. Assessing the influence of watershed characteristics on the flood vulnerability of Jhelum basin in Kashmir Himalaya. Nat. Hazards 2015, 77, 153–175. [Google Scholar] [CrossRef]
  66. Komolafe, A.A.; Herath, S.; Avtar, R. Methodology to assess potential flood damages in urban areas under the influence of climate change. Nat. Hazards Rev. 2018, 19, 05018001. [Google Scholar] [CrossRef]
  67. Karlsson, C.S.; Kalantari, Z.; Mörtberg, U.; Olofsson, B.; Lyon, S.W. Natural hazard susceptibility assessment for road planning using spatial multi-criteria analysis. Environ. Manag. 2017, 60, 823–851. [Google Scholar] [CrossRef]
  68. Samanta, S.; Pal, D.K.; Lohar, D.; Pal, B. Preparation of digital data sets on land use/land cover, soil and digital elevation model for temperature modelling using Remote Sensing and GIS techniques. Indian J. Sci. Technol. 2011, 4, 636–642. [Google Scholar] [CrossRef]
  69. Conoco (Continental Oil Company). Geological Map of Egypt (Scale 1:500,000). In Collaboration with Freie; University at Berlin: Berlin, Germany, 1987; ISBN 3-927541-09-5. [Google Scholar]
  70. Opperman, J.J.; Galloway, G.E.; Fargione, J.; Mount, J.F.; Richter, B.D.; Secchi, S. Sustainable floodplains through large-scale reconnection to rivers. Science 2009, 326, 1487–1488. [Google Scholar] [CrossRef] [PubMed]
  71. Pal, B.; Samanta, S. Surface runoff estimation and mapping using remote sensing and geographic information system. Int. J. Adv. Sci. Technol. 2011, 3, 106–114. [Google Scholar]
  72. Bonham-Carter, G.F. Geographic Information Systems for Geoscientists: Modelling with GIS; Elsevier: Amsterdam, The Netherlands, 1994; pp. 1–398. [Google Scholar] [CrossRef]
  73. Manap, M.A.; Nampak, H.; Pradhan, B.; Lee, S.; Sulaiman, W.N.A.; Ramli, M.F. Application of probabilistic-based frequency ratio model in groundwater potential mapping using remote sensing data and GIS. Arab. J. Geosci. 2014, 7, 711–724. [Google Scholar] [CrossRef]
  74. Naghibi, S.A.; Pourghasemi, H.R. A comparative assessment between three machine learning models and their performance comparison by bivariate and multivariate statistical methods in groundwater potential mapping. Water Resour. Manag. 2015, 29, 5217–5236. [Google Scholar] [CrossRef]
  75. Pradhan, B.; Lee, S. Delineation of landslide hazard areas on Penang Island, Malaysia, by using frequency ratio, logistic regression, and artificial neural network models. Environ. Earth Sci. 2010, 60, 1037–1054. [Google Scholar] [CrossRef]
  76. Pradhan, B.; Lee, S. Landslide susceptibility assessment and factor effect analysis: Backpropagation artificial neural networks and their comparison with frequency ratio and bivariate logistic regression modelling. Environ. Model. Softw. 2010, 25, 747–759. [Google Scholar] [CrossRef]
  77. Jiménez-Valverde, A. Insights into the area under the receiver operating characteristic curve (AUC) as a discrimination measure in species distribution modelling. Glob. Ecol. Biogeogr. 2012, 21, 498–507. [Google Scholar] [CrossRef]
  78. Tehrany, M.S.; Pradhan, B.; Mansor, S.; Ahmad, N. Flood susceptibility assessment using GIS based support vector machine model with different kernel types. Catena 2015, 125, 91–101. [Google Scholar] [CrossRef]
  79. Negnevitsky, M. Artificial Intelligence: A Guide to Intelligent Systems; Addison-Wesley Longman Publishing Co., Inc.: Boston, MA, USA, 2002; ISBN 978-0-201-71159-2. [Google Scholar]
  80. Yesilnacar, E.K. The Application of Computational Intelligence to Landslide Susceptibility Mapping in Turkey. Ph.D. Thesis, Department of Geomatics, University of Melbourne, Melbourne, Australia, 2005; p. 423. [Google Scholar]
  81. Elsanabary, M.H.; Elsanabary, N.H. Flash flood susceptibility mapping in New Cairo City, Egypt, using GIS-based multi-criteria decision analysis. Arab. J. Geosci. 2020, 13, 1187. [Google Scholar]
  82. El-Sayed, A.S.; El-Sayed, M.M. Assessment of flash flood hazard and risk in Wadi Degla Protectorate, New Cairo, Egypt. J. Afr. Earth Sci. 2019, 153, 102909. [Google Scholar]
  83. Elsanabary, M.H.; Elsanabary, N.H. Flash flood risk assessment and mapping in New Cairo City, Egypt. Geomat. Nat. Hazards Risk 2021, 12, 450–464. [Google Scholar]
  84. Megahed, H.A.; El Bastawesy, M.A. Hydrological problems of flash floods and the encroachment of wastewater affecting the urban areas in Greater Cairo, Egypt, using remote sensing and GIS techniques. Bull. Natl. Res. Cent. 2020, 44, 188. [Google Scholar] [CrossRef]
Figure 1. (a) Drainage network of the study area and some various impacts of rainfall storms on (b) roads, (c) some facilities that struck New Cairo City, and (d) residential buildings (Egyptian Street, 2018; youm7.com, 2020).
Applsci 13 09445 g001
Figure 2. Location map of the New Cairo City by Landsat 7 (Acquisition date: May 2023).
Applsci 13 09445 g002
Figure 3. Rock units of the study area simplified from [54].
Applsci 13 09445 g003
Figure 4. Flowchart of the methodology for flood susceptibility mapping.
Applsci 13 09445 g004
Figure 5. Testing and validating dataset used in the current work.
Applsci 13 09445 g005
Figure 6. Parameters used for FR modelling: (a) elevation, (b) slope, (c) aspect, (d) LU/LC, (e) lithology, (f) distance from main streams, (g) stream density, (h) TWI index, (i) TRI and (j) surface runoff.
Applsci 13 09445 g006aApplsci 13 09445 g006b
Figure 7. The flood susceptibility map (FSM) produced by FR models.
Applsci 13 09445 g007
Figure 8. AUC-ROC rate calculated for the created FR model.
Applsci 13 09445 g008
Table 1. Frequency ratio (FR) outputs of the controlling factors layers used for flood suitability mapping.
FSM Conditioning FactorsClasses% of Domain% of FSM PointsFR
Slope0–106.039.78.1
10–2010.455.34.8
20–3020.10.00.0
>3061.50.00.0
Elevation<6045.292.72.0
60–938.168.32.7
94–11046.658.01.9
120–14020.954.71.7
150–16060.334.01.5
170–19018.80.00.0
>19035.80.00.0
AspectFlat20.94.71.5
North60.392.00.5
Northeast18.83.30.2
South35.80.00.0
Southeast2.30.00.0
West11.50.00.0
LULCUrban23.235.02.1
Vegetation10.511.71.4
Bare Land60.055.30.9
Water4.30.00.0
LithologySandstone30.570.30.2
Loose sand10.945.35.8
Sand and gravel7.560.15.3
Sandstone marl49.10.00.0
White limestone3.922.06.6
Distance from streams (m)<43040.068.72.7
440–85024.824.01.0
860–130014.82.70.2
1400–17009.02.70.3
1800–210011.32.00.2
>220012.03.10.1
Stream density (km km−2)<263.235.30.7
8.4–1110.816.71.5
12–1522.048.00.9
16–184.033.00.1
19–2122.060.70.9
22–244.048.02.2
TWI3–643.065.72.7
6–925.822.01.0
9–1213.84.70.3
12–168.03.70.4
16–1910.34.00.5
>1962.230.33.6
TRI0.11–0.3640.30.00.0
0.37–0.6310.83.30.2
0.64–0.8930.880.01.5
Surface Runoff5.3–5.740.231.30.6
5.7–612.814.70.9
6–6.320.044.01.7
6.3–6.65.00.00.0
6.6–729.142.73.2
Disclaimer/Publisher’s Note: The statements, opinions and data contained in all publications are solely those of the individual author(s) and contributor(s) and not of MDPI and/or the editor(s). MDPI and/or the editor(s) disclaim responsibility for any injury to people or property resulting from any ideas, methods, instructions or products referred to in the content.

