Article

Development of the Gravel Pressure and Voice Synchronous Observation System and Application in Bedload Transport Measurement

1
School of River & Ocean Engineering, Chongqing Jiaotong University, Chongqing 400074, China
2
National Engineering Research Center for Inland Waterway Regulation, Chongqing Jiaotong University, Chongqing 400074, China
3
Changjiang Chongqing Harbour and Waterway Engineering Investigation and Design Institute, Chongqing 401147, China
*
Author to whom correspondence should be addressed.
Appl. Sci. 2023, 13(16), 9429; https://doi.org/10.3390/app13169429
Submission received: 30 June 2023 / Revised: 18 August 2023 / Accepted: 18 August 2023 / Published: 19 August 2023
(This article belongs to the Section Civil Engineering)

Abstract

:
Bedload sediment transport is critical in the natural river environmental and ecological system. It is quite challenging to measure the bedload sediment transport rate in rivers with any degree of accuracy. In this study, the authors developed the Gravel Pressure and Voice Synchronous observation system (GPVS) to estimate the bedload sediment transport rate in rivers. The core of the GPVS includes an underwater high-fidelity audio recorder and pressure sensor. The audio recorder is intended to monitor the low bedload sediment transport rate, whereas the pressure sensor is utilized to detect relatively substantial bedload sediment transport. The GPVS is tested by running flume experiments with natural gravel to evaluate the system’s reliability and feasibility. Results reveal that the GPVS has a very high sensitivity for detecting bedload transport. When the bedload sediment transport rate is relatively low, the audio recorder can measure it quantitatively, showing that the system is not impacted by ambient noise.

1. Introduction

Sediment movement has a significant impact on river morphology and the aquatic environment. In some rivers, particularly mountainous rivers, bedload sediment transport is considerable. Bedload sediment transport is the act of particles rolling, sliding, and saltating [1,2]. Bedload sediment transport is affected mainly by flow hydraulics (such as flow velocity, bed slope, and water depth) and river-bed characteristics [3]. This makes bedload sediment transport have the characteristics of strong intermittent movement [4,5,6] and high randomness [7,8,9]. As a result, the reliable measurement of bedload sediment movement has long been a challenge in hydraulic engineering.
Basket sampling and trap measurements were originally used to examine bedload transport in the field, but neither one was able to capture the dynamic process of the mass transport in time and space [10,11,12]. As a result, numerous techniques have been developed for identifying bedload sediment transport, including tracers [13,14,15,16], optical methods, ultrasonic topography, and acoustic approaches. Radioactive particle tracking [17,18], radio-tracking techniques [19,20,21], magnetic tracer particles [22,23,24], painted particles [25], and the “Smartrock” tracer [26,27] are all examples of tracer techniques. This approach, however, has certain drawbacks. For example, the particle size range to be detected is limited, particles in motion may bury each other, recovery rates are low [28], and certain particles may poison the aquatic environment. Furthermore, the test is costly. Using a high-definition camera, the optical approach primarily observes bedload sediment transport on the riverbed [29,30]. Thorne [31,32] applied a low-light camera and placed it about 50 cm above the ocean floor to monitor the bedload movement in order to test the effectiveness of a synchronized hydrophone operating beneath the camera to observe bedload transport. He estimated high-temporal-resolution bedload transport rates based on the video and audio signal analyses. Drake et al. [4] used a Redlake Locam camera to photograph bedload transport in Duck Creek. They obtained the bedload movement pattern after processing the images. Ancey and Pascal [33,34] measured the amount of bedload transport by using high-speed cameras. Their experimental results revealed that the measured parameters in the flume were consistent with the authors’ theoretical relationships. The experimental protocol was then adapted to a flume experiment and a gravel-bed river. Ermilov et al. [35] used underwater video to track the motion of bedload sediment in a flume. They analyzed the individual sediment particle movements as well as the distribution of the moving particle sizes by applying statistical theory and image processing techniques. In summary, although the camera method can observe bedload transport in the flow, the technique has some limitations. (1) It is only applicable to shallow rivers with little suspended content, clear river water, and large sediment particles. The camera needs important protective measures and effective lighting during the observation process. (2) The method is unable to measure the bedload transport rate in the case of a high transport rate [36]. (3) Planar video photography can only record the transport information of the surface layer, while a high-speed camera placed on the side can only record the changes in limited space [36]. Ultrasonic topography is significantly affected by the device resolution, flow conditions, and sediment concentration, which results in inaccurate measurements of bedload sediment transport, particularly in mountainous rivers. The acoustic method has the advantages of high temporal resolution and working effectively in turbidity conditions [12]. This method can also provide continuous sampling data [37]. For example, Tian et al. [38] established a mathematical model to trace gravel using a customized acoustic transmitter based on the target tracing theory of underwater sonic wave analysis. The model has been proven theoretically. However, the low time accuracy of the model and the high cost of the customized transmitter limit the application of the technology in large mountainous rivers.
Marineau, Wright, and Gaeuman [39] used the hydrophone to measure bedload sediment transport at several locations along the Trinity River, California. Krein et al. [40] used a hydrophone positioned beneath a steel plate to quantify bedload sediment transport in a small river. Bedload transport was assessed and compared with that measured using traps, which were utilized to gather bedload transport identified by hydrophone. Bedload transport was assessed and compared with that recorded utilizing traps employed to gather bedload transport identified by hydrophone. Le Guren et al. [41] observed sand bedload sediment transport in the Loire River, a mild slope river, using an acoustic Doppler current profiler (ADCP), a hydrophone, and the dune tracking method (DTM). Their findings demonstrated that the hydrophone is more effective and precise than ADCP and DTM in measuring sandy bedload transfer. Geay et al. [37] employed hydrophones to measure bedload sediment in the Drau River in Austria. In addition to the hydrophone, they also placed 40 geophones and three slot bedload samplers along the 50 m wide observation section. The analysis of the short-time frequency response of the audio signals of bedload transport gathered by the hydrophone showed that the majority of the frequencies of the audio signals of bedload movement were concentrated at more than 1000 Hz. Simultaneously, the comparison of the hydrophone results with the geophone and slot sampler measured data demonstrated that the hydrophone and geophone signals had a clear correlation. The authors also discovered that the acoustic features of bedload movement were connected to the signal propagation effect in the river environment. Based on this, a theoretical framework for predicting the propagation of acoustic signals in the river was proposed. The application of this model to the Arc-en-Maurienne River revealed that the audio signal affected the spectral components of the acoustic signals generated by the transported bedload. The audio signal’s propagation effect had an effect on the spectral components of the acoustic signal [42]. Furthermore, Geay et al. [43,44] utilized a hydrophone to monitor and estimate bedload transport in five French alpine rivers (with the highest flow discharge of 237 m3/s and the deepest median water depth of 2.8 m). They employed the inverse method to assess the bedload sediment size distribution based on the measurements. The hydrophone was also applied to measure bedload sediment transport at 25 locations in 14 rivers in France. From their measurements, they established the relationship between the specific bedload transport flux and the cross-section average acoustic power. Based on the measured data and analyzed results from 14 rivers, Nasr et al. [45] combined field observations from 8 rivers with the measured data to fit a power–law relationship between the bedload movement and the mean cross-section sound power. When their results were compared with the results presented by Geay et al. [44], the difference between the two was not significant (at the 95% confidence level). Nasr also suggested that the calibration curves of bedload transport and the mean cross-section sound power would fit better if all the field measurements from the two databases were combined. Nasr et al. [46] developed a model that considered the bedload movement parameters, the flow conditions, and the acoustic propagation environment. The model was tested using a field data set, and the results showed that the model was sensitive to bed sediment size distribution and to bedload movement. The inverse model based on this model produced good correlation results for estimating the sound power of the audio signals of bedload movement only in the Giffre River [47]. However, the maximum flow discharge and average water depth of these rivers are 290 m3/s and 3.6 m, respectively. As a result, their findings may not be applicable to major mountainous rivers like the Yangtze River. Despite the fact that the method has been used to quantify bedload sediment transport for decades, the technology is still in development. The measurement of bedload transport in large mountainous rivers, in particular, is currently inadequate.
The Swiss plate geophone (hereinafter referred to as SPG) is another indirect observation technique that has been used extensively for monitoring bedload sediment transport in Eurasian watersheds for many years [48,49,50]. However, the SPG application reveals that some variation occurs when the bedload impacts the SPG. Nicollier et al. [51] enhanced the flume test by installing baffles on the SPG plate to separate the seismic signal from the particles that impacted the plate. However, even with the isolation plate in place, the SPG system continued to record the seismic signal of particles impacting the shock plate next door. To overcome this issue, they suggested a new filtering method to separate the genuine signals of the bedload impacts from the chaotic background sound. The filtering program was used to evaluate four river field observation data sets. Results showed that the filtering method effectively reduced the disparities across the observation sites, and the calibration curves for bedload transport were computed for the four observation rivers. However, the computed calibration curves were only applicable to the four rivers stated above. A thorough examination of the SPG results in various test flumes and rivers reveals that the relationship between the distinctive parameters of the bedload transport signal and the transport mass remains very obvious across all observation stations. Antoniazza et al. [52] investigated the factors that triggered bedload transport in the Alpine Basin. They quantified the contribution of rainfall and snowmelt to bedload transport based on five consecutive years of hydrological and bedload transport measurements in the Alpine Basin monitored by the SPG system (2016–2020). Their results showed that high-intensity rainfall and snowmelt played a significant role in bedload transport. Based on bedload transport signals collected from three field sites and a flume test, Rickenmann et al. [53] compared the performance of the SPG system with that of the acceleration impact plate (GP-Acc), the miniature acceleration plate (MPA), and the Japanese pipe microphone (JPM). The comparison showed that the signal of the geophone was more stable than the signal of the accelerometer sensor. Because of the advantages of geophones, accelerometers, and underwater microphones, the SPG can be applied to a broader range of observation environments. Based on the observed data, it may generate a relationship between the number of pulses measured and the bedload transferred mass, as well as identifying the size of pebble grains.
In this research, the gravel pressure and voice synchronous observation system (GPVS) is developed and utilized to monitor and detect gravel sediment transport continuously based on an analysis of the peak frequency, pitch frequency, and energy eigenvector of the gravel movement [54]. The results from the flume trials are used to validate the system. In the case of strong bedload sediment transport, pressure sensor signals are processed to determine the average gravel bedload transport rate across the measurement duration. When bedload transport is weak, acoustic signals provide an assessment of the rate of bedload transport. The verified technology will be used to estimate bedload sediment transport in the Yangtze River’s upper reaches (in another communication).

2. Materials and Methods

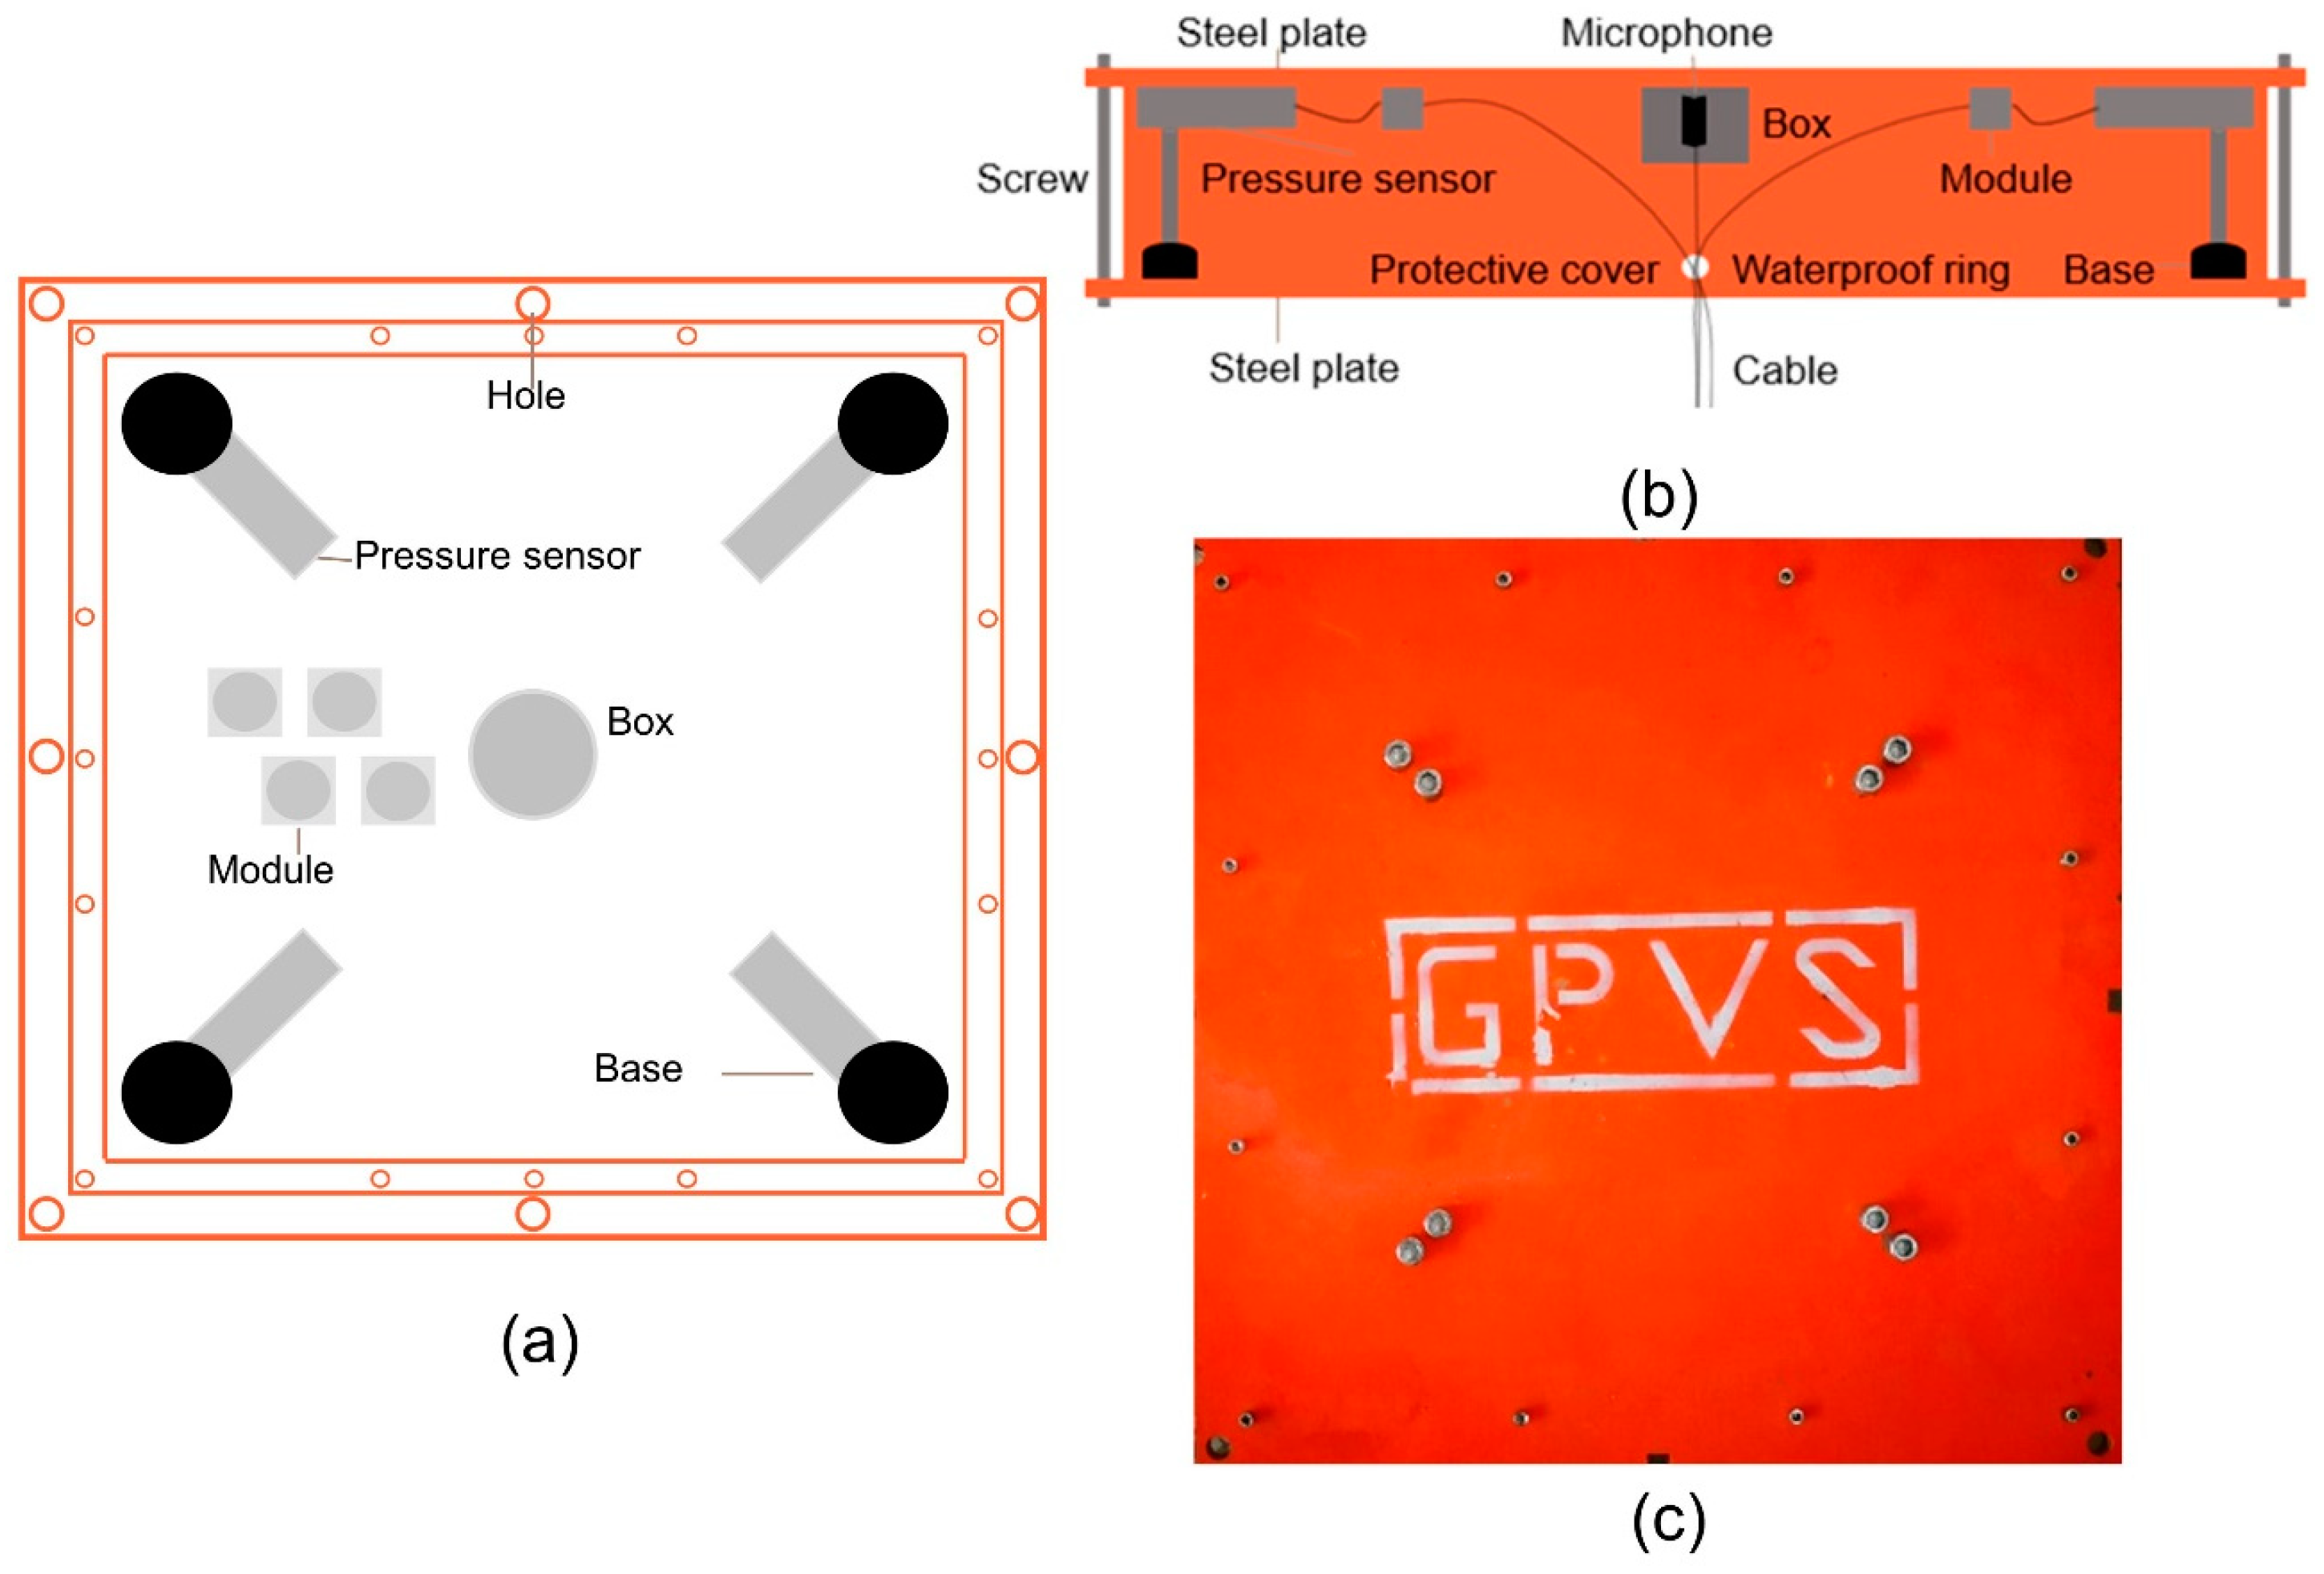
2.1. Instrument Design

The upper steel plate is the contact plane of the system. Figure 1 depicts a photograph of the GPVS. The dimensions of the system are 11 cm in height and 60 × 60 cm2 on the surface plane. The cores of the GPVS are the underwater high-fidelity audio recorder and pressure sensor. The audio recorder is a waterproof pickup that is enclosed in a metal box attached to the upper plate’s bottom. The sonic-sensitive part is closely attached to the inner wall of the metal box so that the audio recorder can only collect and detect the metal plate vibration sound caused by gravel movement. During the experiment, there is no audio signal other than the sound produced by the gravel movement. This substantially overcomes the problem of the gravel-movement-generated sound being drowned out by ambient sound, reducing the burden of post-data processing greatly. A cantilever framework supports the pressure sensor. As illustrated in Figure 1, there are four pressure sensors positioned at the four corners and screwed to the metal plate. The strain gauge, which is mounted within the pressure sensor, is utilized to reflect the pressure generated by the deformation caused by gravel movement. The soft waterproofing is employed to ensure the strain gauge’s sensitivity.
The GPVS uses coupling pressure and acoustic measuring technology to achieve remote, real-time monitoring of gravel movement. The system is set up on the surface of the riverbed. The pressure and audio signals are sent to the PC’s storage via wires. The gravel movement is determined by analyzing the collected data. The GPVS offers the advantages of function even when buried, easy recovery, and numerous configurations along the river length. This allows for repeated usage of the system and simple maintenance, as well as good monitoring of the space distribution of the gravel movement.
The features of the system are that, when the gravel movement is weak, the sole pressure method has limited accuracy, and the gravel movement is mostly monitored by recording the auditory signals generated by the collision of the gravel movement. When the gravel movement is strong and the audio signal analysis is impractical due to the enormous bedload particles, the pressure system is utilized to detect the gravel movement by monitoring the pressure fluctuation caused by the gravel movement.

2.2. Testing the Effectiveness of the Pressure System

The flume used to test the effectiveness of the pressure system is 70 m long, 1 m wide, and 2 m high, with a horizontal slope (i.e., zero slope) in the National Engineering Centre for the Inland Waterway Regulation at Chongqing Jiaotong University. The flume is supported by a steel framework, with toughened glass side walls and a flume bed.

2.2.1. Effect of Weight Position

The purpose of this testing is to demonstrate the reliability of GPVS pressure data as well as the correlation between pressure data and gravel movement. In the testing, four non-submersion arrangements are devised to represent the probable position of the GPVS on the gravel bed in the field: flat, 100 diagonal tilt, 100 opposite side tilt, and 180° overturn.
To test the effect of the weight position (modeling the gravel movement) on the measured pressure, the upper steel plate is divided into 9 zones, denoted as Pij (i, j = 1, 2, 3), as shown in Figure 2. The weight at Pij has the same effect as the weight at Pji in Figure 2, implying that the weight will be applied only at six different locations. A total of six weights are evaluated in the experiment: 2 kg, 3 kg, 5 kg, 8 kg, 12 kg, and 20 kg. The correlation between gravel movement and GPVS pressure data is explored by placing gravel of varying weights in six zones for each GPVS arrangement on the bed. There are 6 gravel weights and 6 gravel placements on the upper steel plate for each GPVS setup, yielding 36 possibilities. For each case, pressure data is gathered. Furthermore, the testing time is 5 min to ensure the correctness of the obtained data, and the steadiest data are used for analysis.

2.2.2. Effect of Water Depth

The purpose of this test is to see whether the pressure data acquired by GPVS are affected by the water level. In other words, the test is carried out to determine if the variance in recorded pressure is only due to variations in gravel weights. Confirmation of this is critical for the system’s dependability in the field.
To this end, six flow discharges are tested: 50 L/s, 150 L/s, 250 L/s, 350 L/s, 450 L/s, and 550 L/s. The surface of the GPVS is flush with the gravel bed, as shown in Figure 3. The flow discharge gradually increases to the prescribed flow discharge during the experiment. This is accomplished by adjusting the gate positioned at the flume’s end. After the water depth has remained constant for an extended period, the corresponding water depth is measured. Each experimental run lasts 30 min. When the flow achieves a steady state, the water depth is observed.

2.2.3. Gravel Movement Experiment Procedure

The experiment makes use of natural gravel particles with a diameter between 15 and 50 mm. To ensure active gravel movement at the experimental flow rates, gravel particles are laid on the flume bottom to provide a uniform bed slope of 1%.
The surface of the GPVS is flush with the gravel bed (Figure 3). The same gravel components and bed slope are used in three different flow discharge experiments of 200 L/s, 400 L/s, and 600 L/s. For each flow rate, five groups of tests are run. To obtain the predetermined value for each flow condition, the flow rate is progressively increased. Once the flow reaches a steady state, the measurement is taken for roughly 30 min. When the experiment is finished, the water flow is turned off, and the gravel on the GPVS’s surface is collected and weighed. The accuracy of the GPVS is then further investigated by comparing the weighted gravel with the most recent pressure data. The pressure data have been converted to mass value in the study for the purpose of presenting results for comparison. The experimental run is repeated for the above three flow discharges. The gravel that passes the device during the experimental run is collected in a bedload trap that is built downstream of the GPVS. This trap is 0.6 m in width and 0.2 m in length (along the water’s flow). To enable quick retrieval of gravel samples, the trap is made of a liftable metal mesh. The GPVS test results are then compared with the mass of gravel recovered in the retention pond to verify the GPVS’s accuracy and reliability.

2.3. Acoustic Method Experiments

The acoustic technique experiment is carried out in a 28-m-long, 0.7-m-wide, and 0.7-m-high tilting flume, as illustrated in Figure 4. The entrance length is 3 m, followed by a 10 m adjustment section to ensure that the flow is fully developed in the 12 m measurement section. The flume can be tilted between 0.1% and 0.7%, and the flow discharge can reach 125 L/s, with an error of ±0.1 L/s. The water level is measured using the ultrasonic gauge, which has a measurement range of 0.1–1 m and an error of less than 0.2 mm. The natural gravel particles in the Yangtze River’s upstream reach are chosen for the test. Gravel particles with a diameter of 10–12 mm (with a medium size of 11 mm) are employed in the test, based on the flow discharge range. At the start, the flume bed is set to zero degrees. The flume is then filled with gravel particles, with the gravel in the last 1 m segment being consolidated. The GPVS is placed 1 m upstream of the end of the experimental section. The surface of the GPVS is at the same level as the gravel bed surface and placed with a small hole facing downstream. This hole is used to connect data cables and electric wires to the PC. To avoid disrupting the flow field, the cable and wire are buried in the gravel bed. A bedload trap 0.6 m wide and 0.4 m long (in the flow direction) is placed one meter downstream of the GPVS to catch particles. The flume bed is adjusted to 0.6% once the gravel bed is consolidated.
A video camera is positioned just above the GPVS to record the gravel moving through it. The gravel transport rate can be determined using video data and compared with the value obtained using GPVS acoustic signals. The test uses three flow rates of 60 L/s, 70 L/s, and 80 L/s to ensure gravel movement. After the flow achieves a steady state, the measuring time is around 30 min.

3. Results

This section provides a concise and precise description and explanation of the experimental results. Some experimental conclusions are drawn from the analysis.

3.1. Effectiveness of the Pressure Method

This section is to investigate the reliability of the GPVS and the relationship between the recorded pressure signal using the GPVS and the average gravel transport mass.

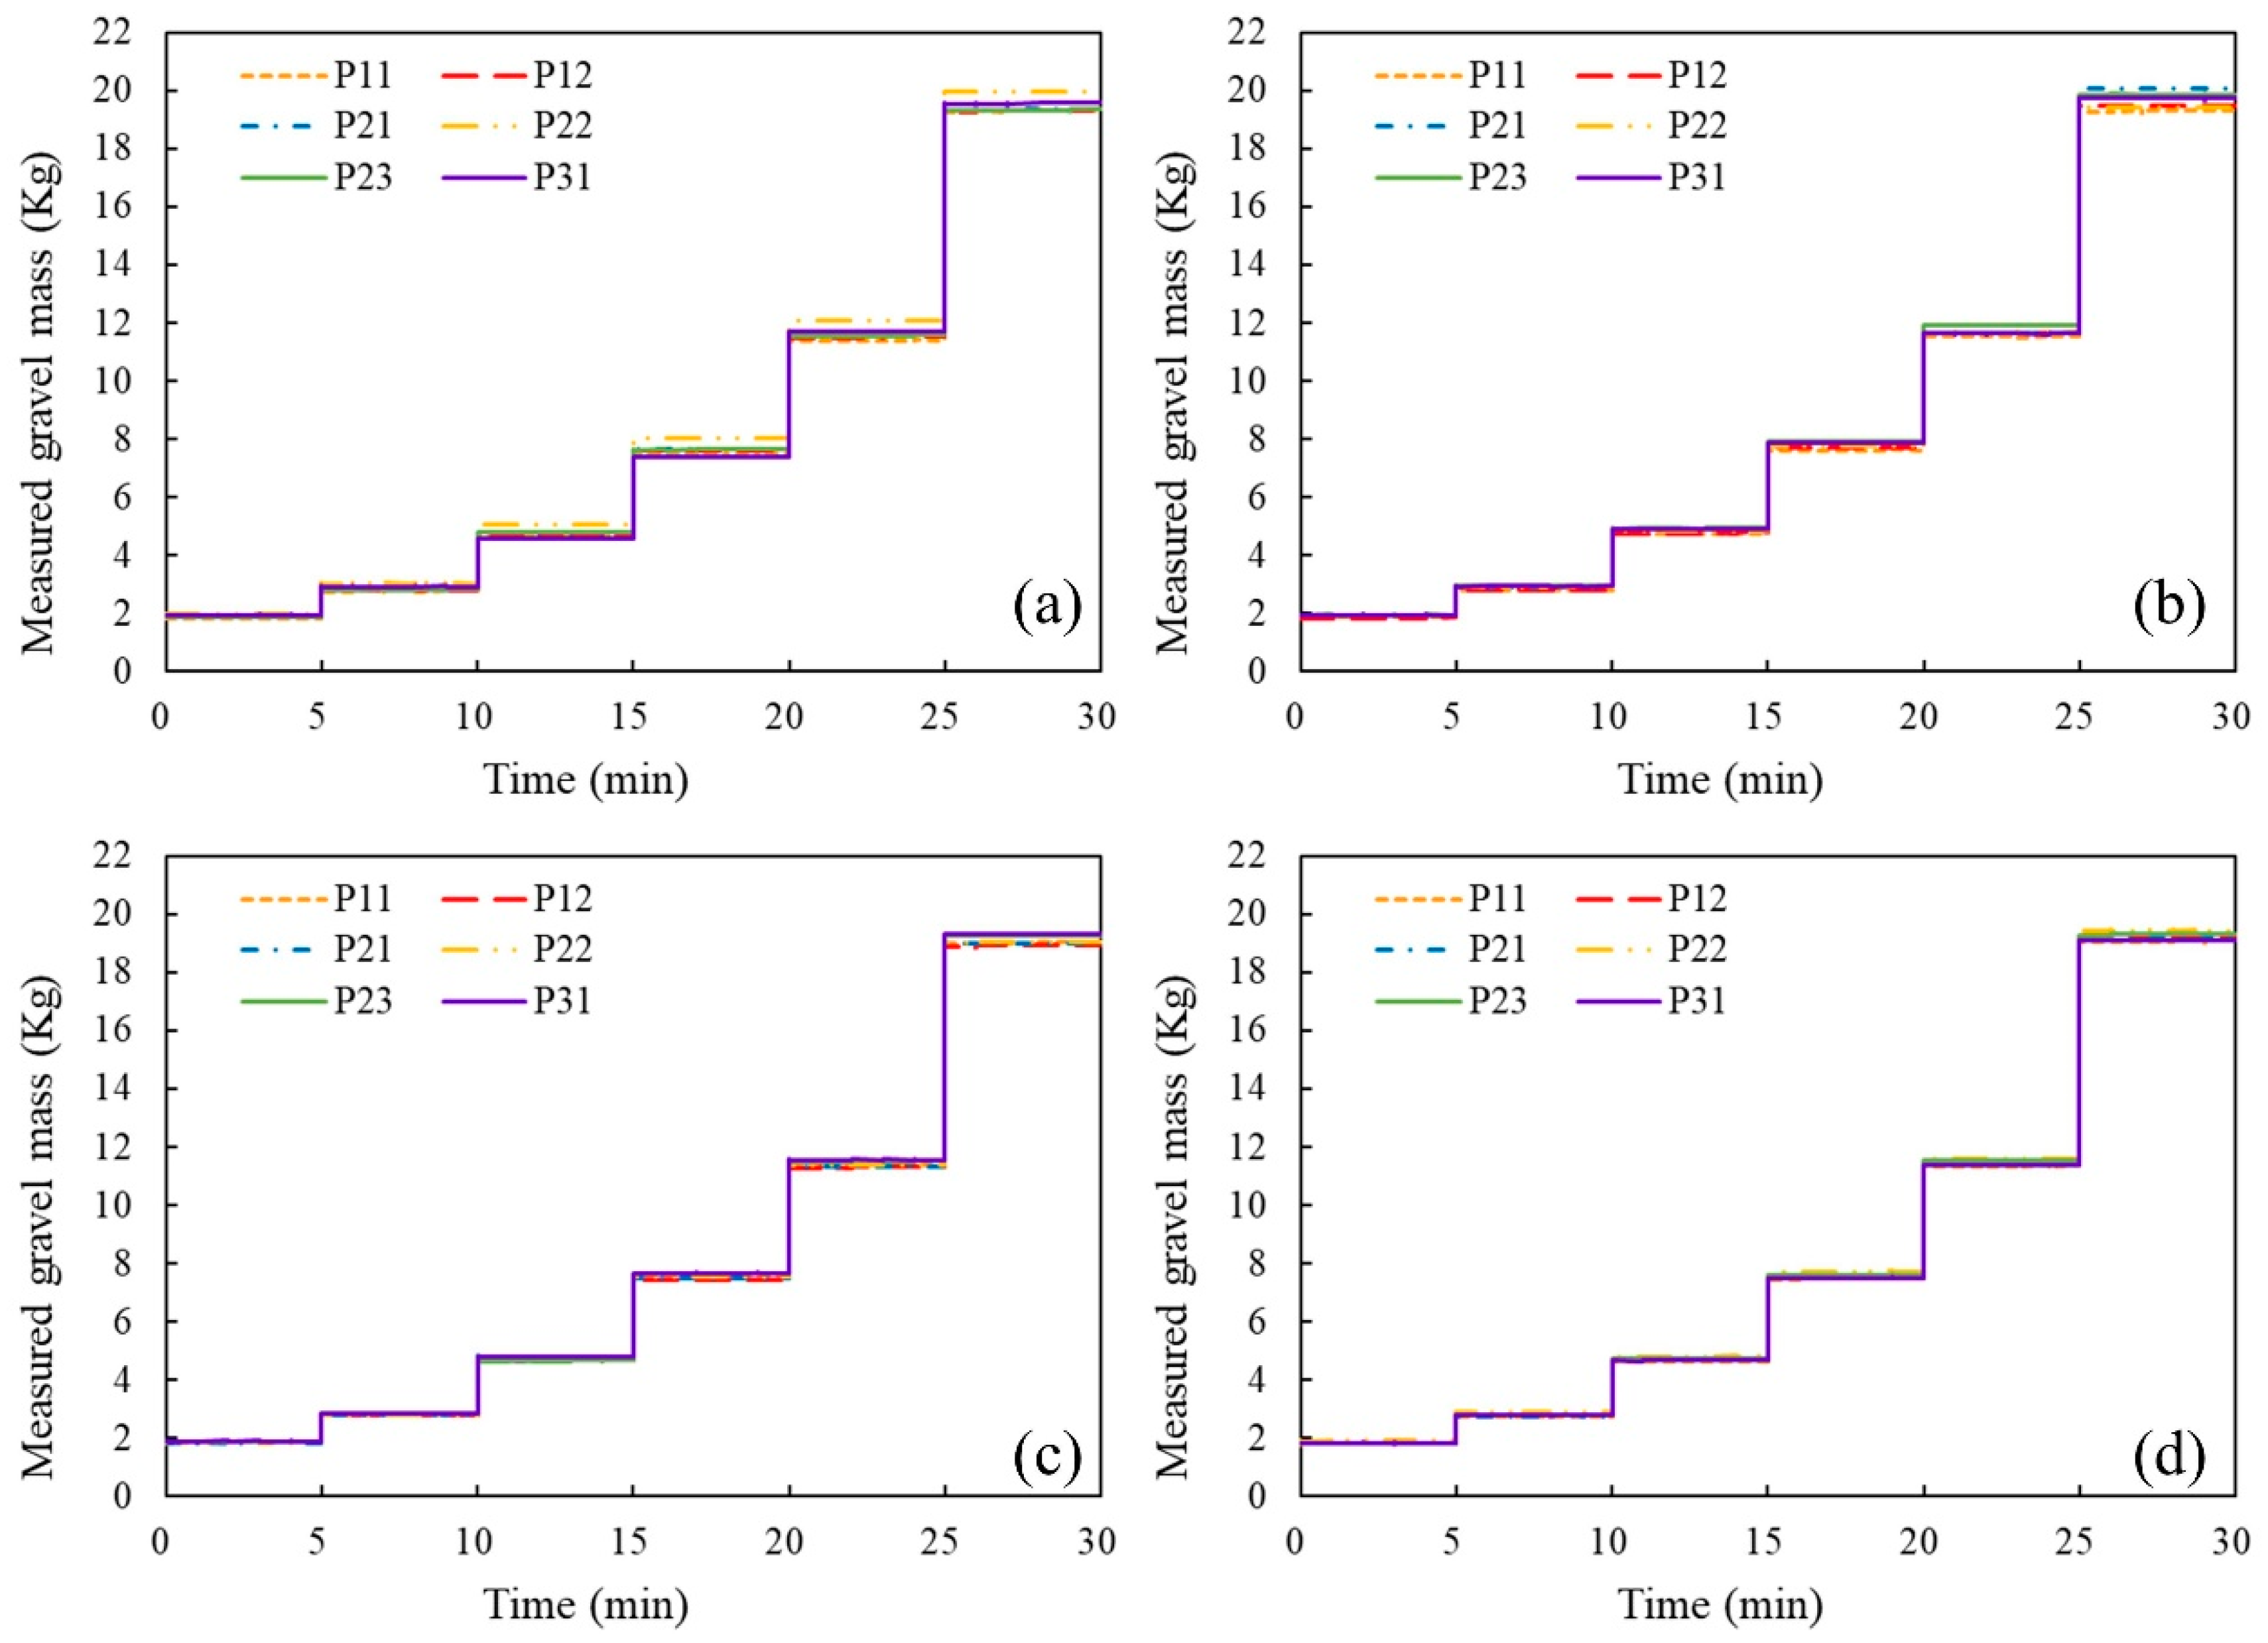
3.1.1. Effect of the Weight Position on the Measured Pressure

This section is to evaluate the reliability of the GPVS by comparing the analyzed results of the recorded pressure signal with the known gravel weight imposed. Figure 5 depicts the pressure computed from GPVS pressure signals for various gravel weights. It is found that, for the same GPVS placement status, gravel placement has an insignificant effect on the pressure. Figure 5a–d show that, for the same gravel weight (representing the force acting by passing gravel), there is little change in the predicted pressure from GPVS signals for different GPVS placements. Figure 5 further shows that the pressure estimated using the GPVS signal coincides well with the gravel-weight-induced force applied to the GPVS. The relative errors between the actual gravel-induced force and the projected pressure from the GPVS signals are shown in Table 1, indicating a very good agreement between the two. This confirms the GPVS’s dependability and precision in monitoring pressure generated by force acting on it.

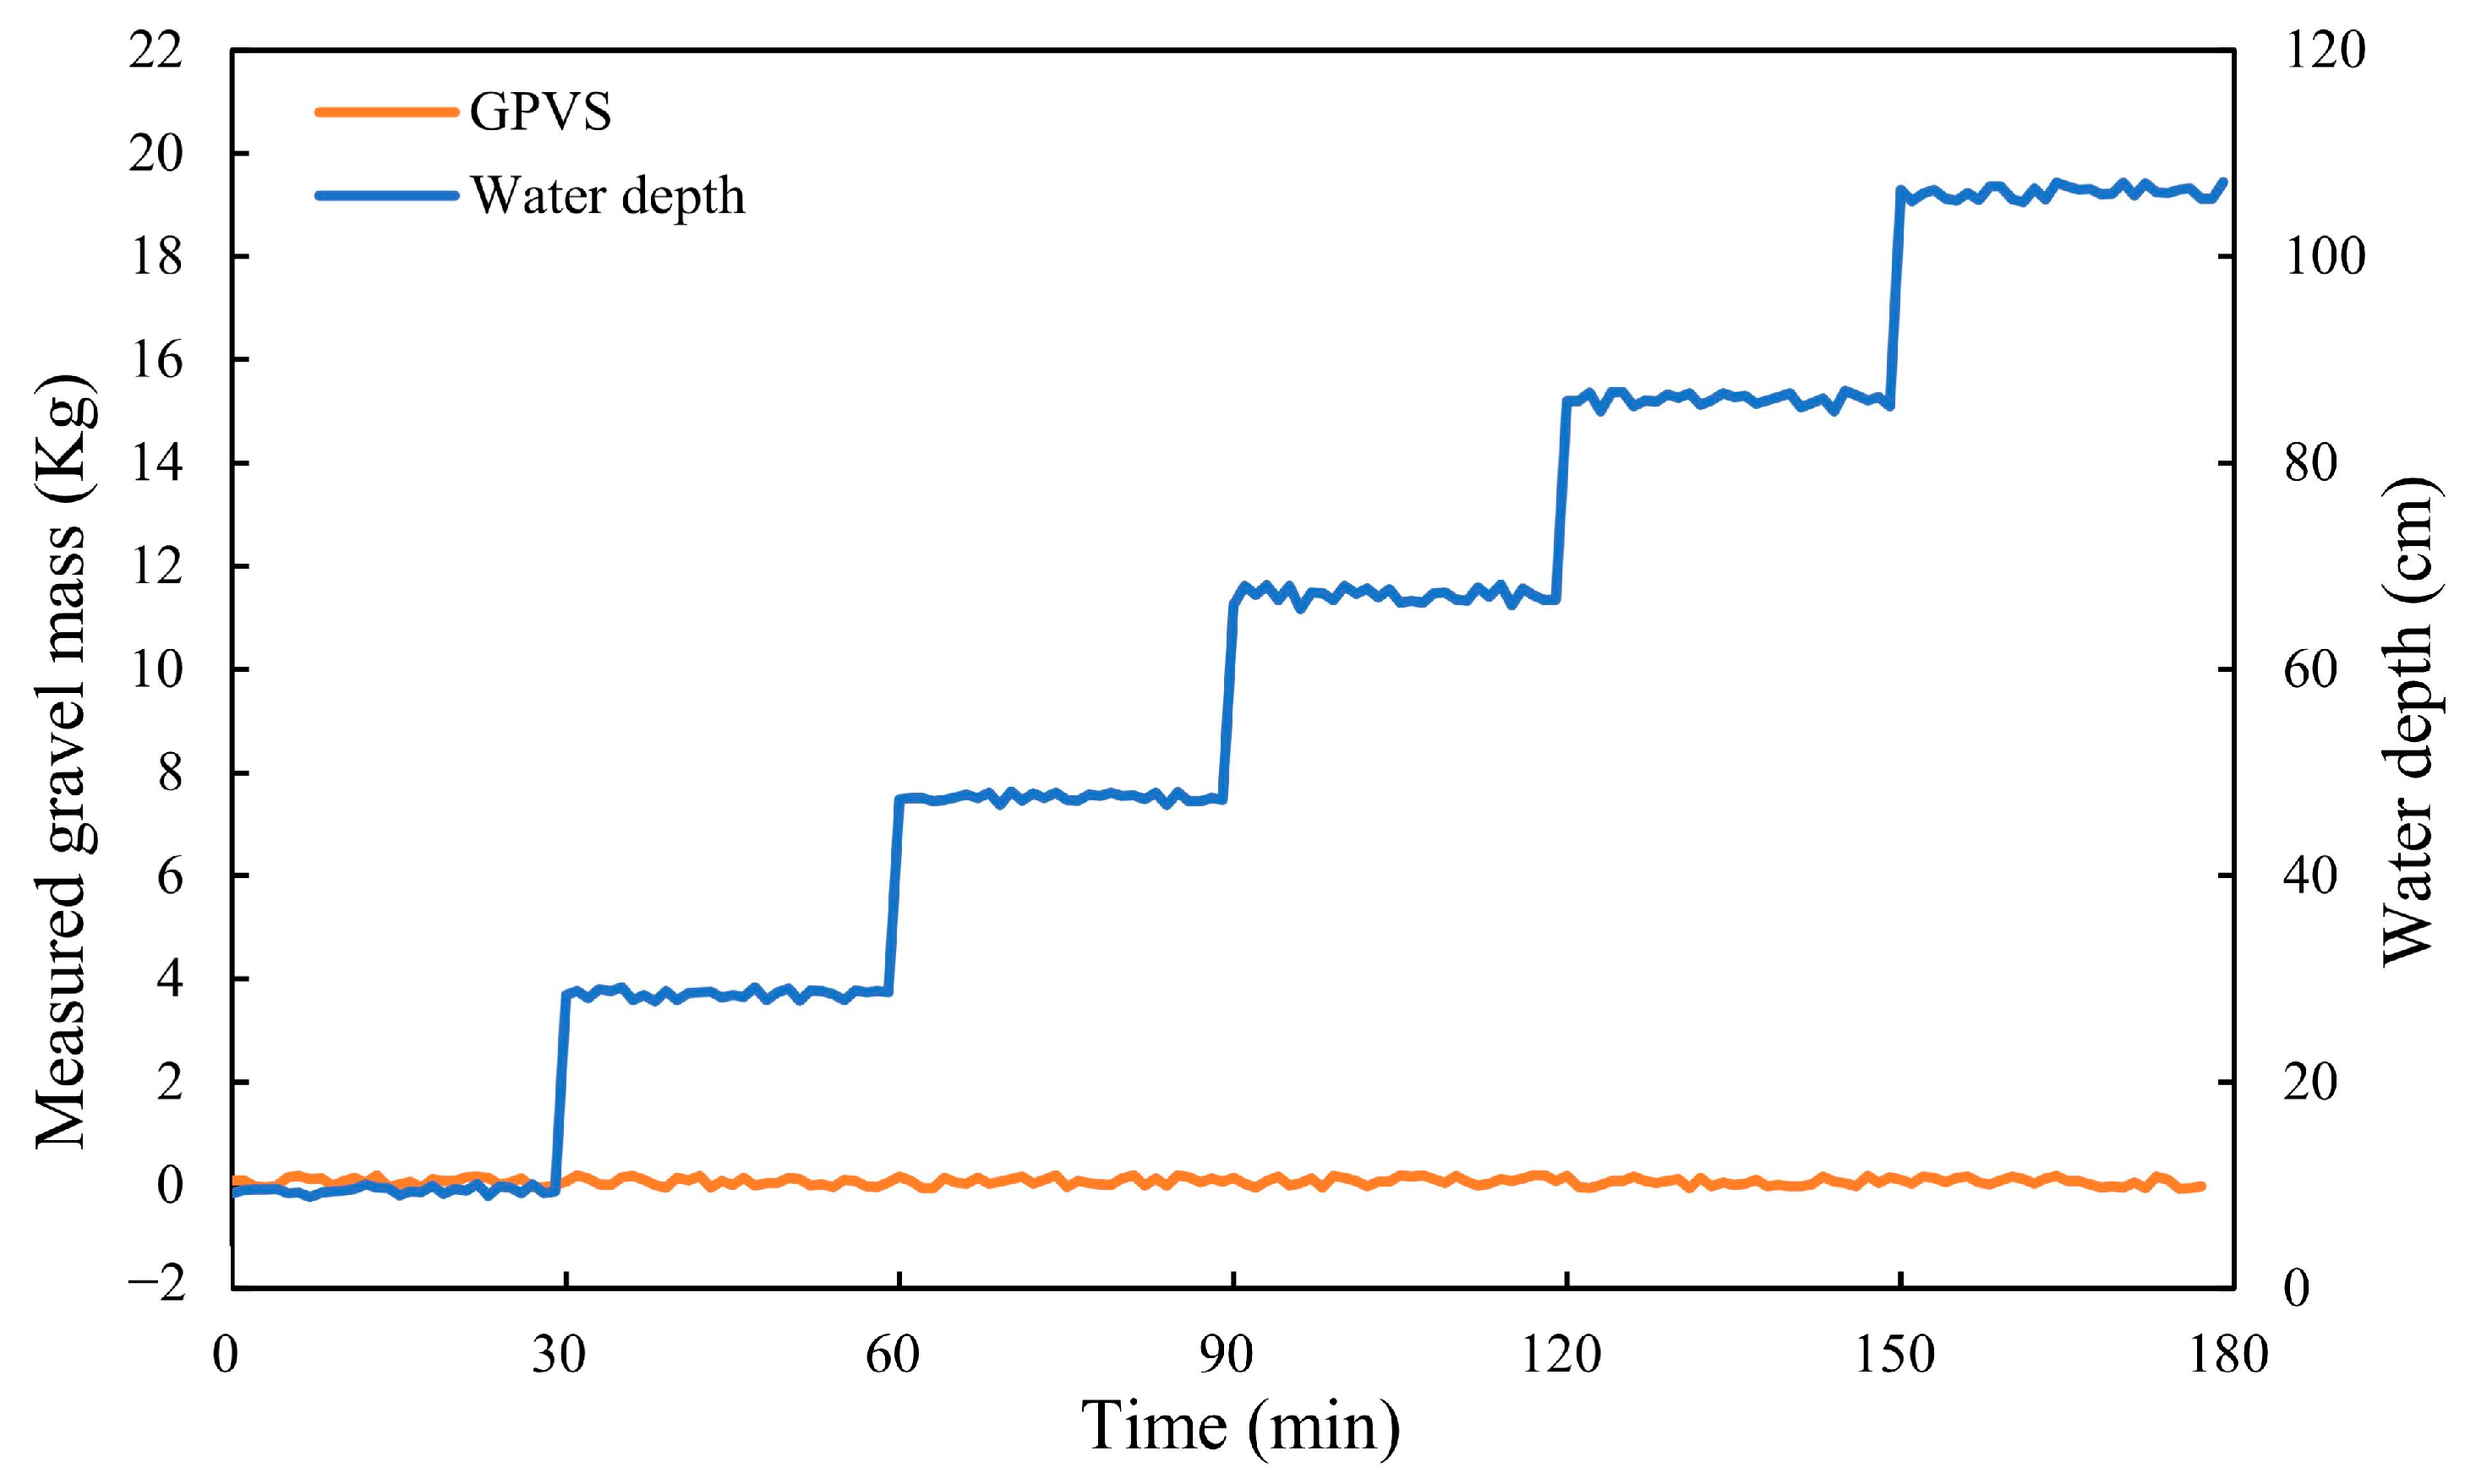
3.1.2. Effect of Water Depth on Pressure

This section investigates whether the water depth affects the GPVS signal. To this end, six water depths are tested without any gravel on the GPVS. The results are plotted in Figure 6. It is seen that the water depth has an insignificant effect on the pressure, though some small pressure oscillations appear from time to time. This results indicate that the GPVS measurement is independent of water depth, implying that the GPVS can be utilized in the field to monitor and measure gravel transport.

3.1.3. Gravel Transport Mass

This section is to measure the bedload transport mass and to examine whether the measured bedload mass using the GPVS increases when the bedload on the GPVS increases. To this end, a gate is installed at the end of the flume and can be adjusted during the experiment to ensure that the bedload on the GPVS gradually increases with time. Because the sediment is taken from the upper reach of the Yangtze River and has a wide grain size distribution, ranging from 1 cm to 15 cm, it is difficult to find a suitable threshold velocity or critical shield. Therefore, a simple method is adopted by starting the test with a low flow rate (200 L/s) and increasing it to 400 L/s to observe bedload transport. The observation of these two tests shows that, under these two flow discharges, little or no bedload is transported and the mass of moving gravel measured by GPVS fluctuates around 0, as shown in Figure 7. When the flow discharge reaches 600 L/s, gravel gradually accumulates on the GPVS plate, causing the measured value of the GPVS to rise. Figure 8 shows that, for a flow discharge of 600 L/s, the measured gravel mass by the GPVS increases with time and then reaches a quasi-constant value, indicating that the mass of gravel entering the plate of the GPVS and exiting the plate of the GPVS in a short period of time is virtually the same. Because there is a large amount of gravel movement at only 600 L/s flow discharge, the following analysis and discussion focus on 600 L/s.
Based on the above analysis, the calculated pressure using the recorded acoustic signals of the GPVS can be used to estimate the gravel transport mass. Defining Ti and Ti+1 as the adjacent recording times, and the corresponding pressures as Xi and Xi+1, the gravel mass passing the GPVS is then calculated as:
M i = | X i + 1 X i | / g ,
where g is the gravity acceleration; and i is ith observation. The total mass of transported gravel will be:
M = 1 n M i ,
where n is the total number of recordings.
The mass of five groups of pebbles measured by the GPVS and a sand pit under the 600 L/s water flow condition is calculated using the above approach. Table 1 shows that the mass of gravel collected by the downstream bedload trap is slightly greater than that measured by the GPVS. The difference in the mass of moving bedload sediments estimated by the two approaches ranges from 3% to 8%. The main reason is perhaps because the trap is placed one meter downstream of the GPVS, and as such, there is a one-meter gravel flume bed between them. Under the condition of no sediment input from the upstream inlet, this one-meter gravel bed makes an additional contribution towards the gravel collected by the bedload trap downstream of the GPVS. Eventually, this leads to a slightly larger bedload mass measured by the trap than by the GPVS.
In summary, the calculation of gravel transport using the GPVS can reflect the gravel transport mass for a period to some extent. This indicates that the developed GPVS has potential application in the field.

3.2. Gravel Transport Rate Analysis Using the Acoustic Method

3.2.1. Statistical Analysis of Gravel Transport Mass

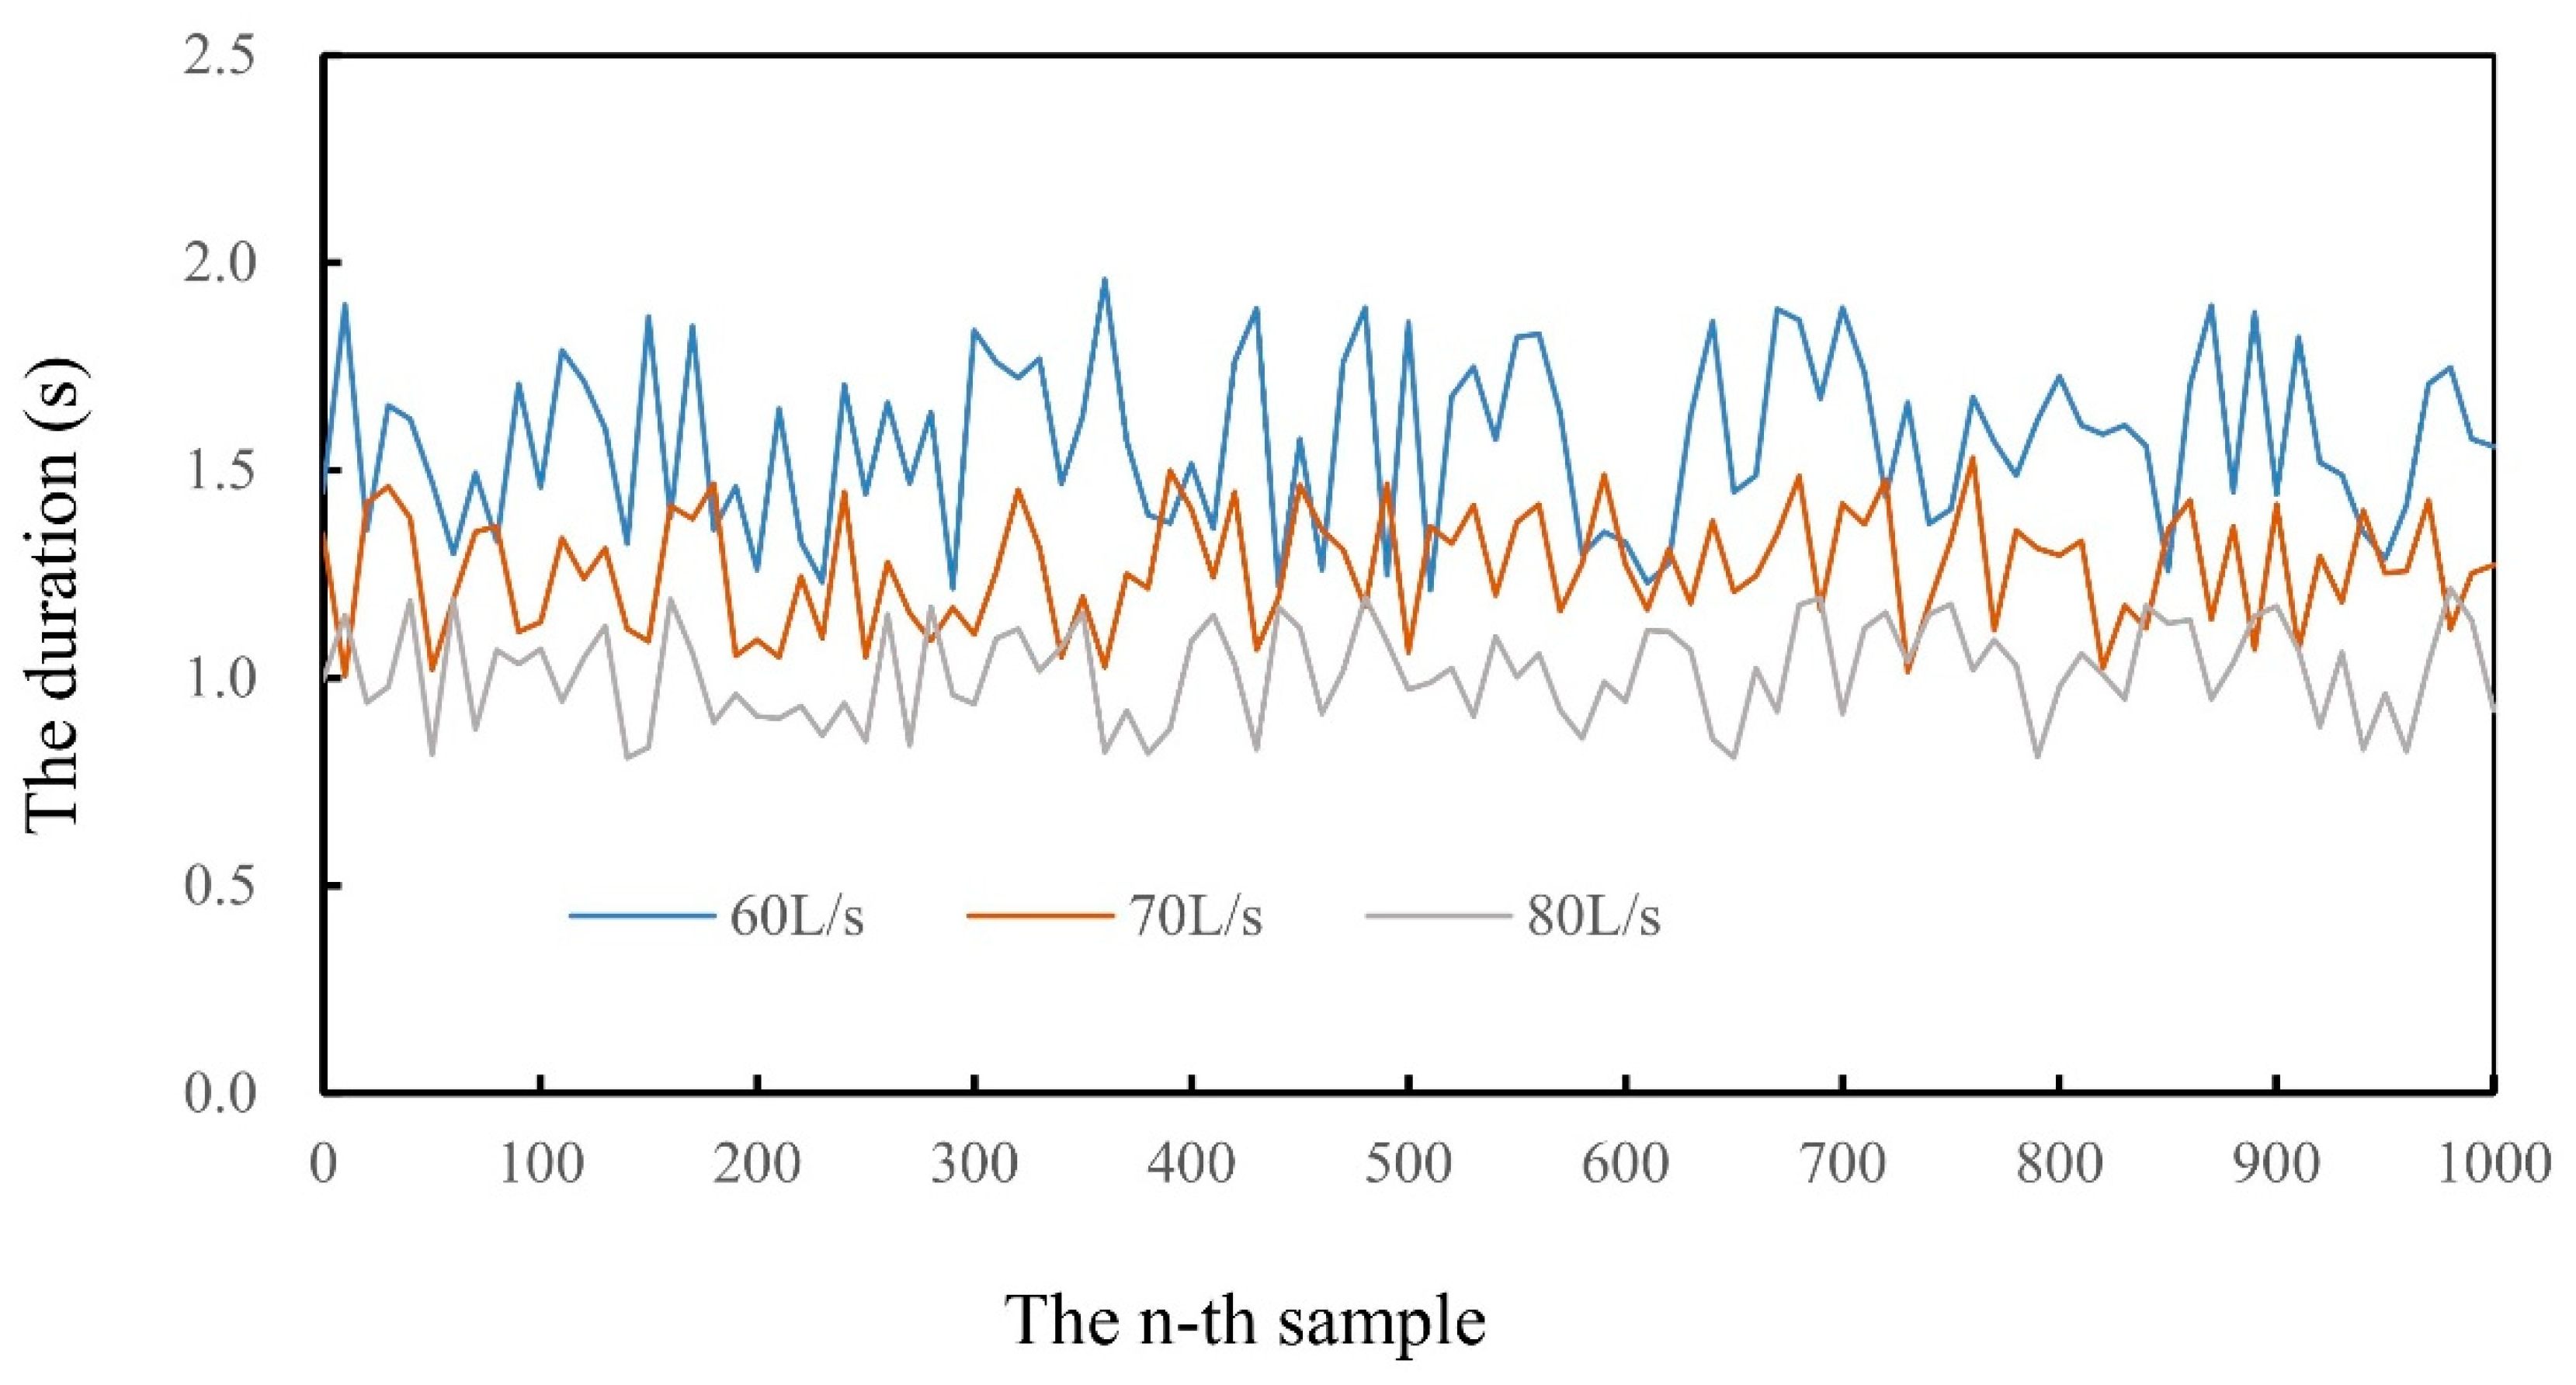
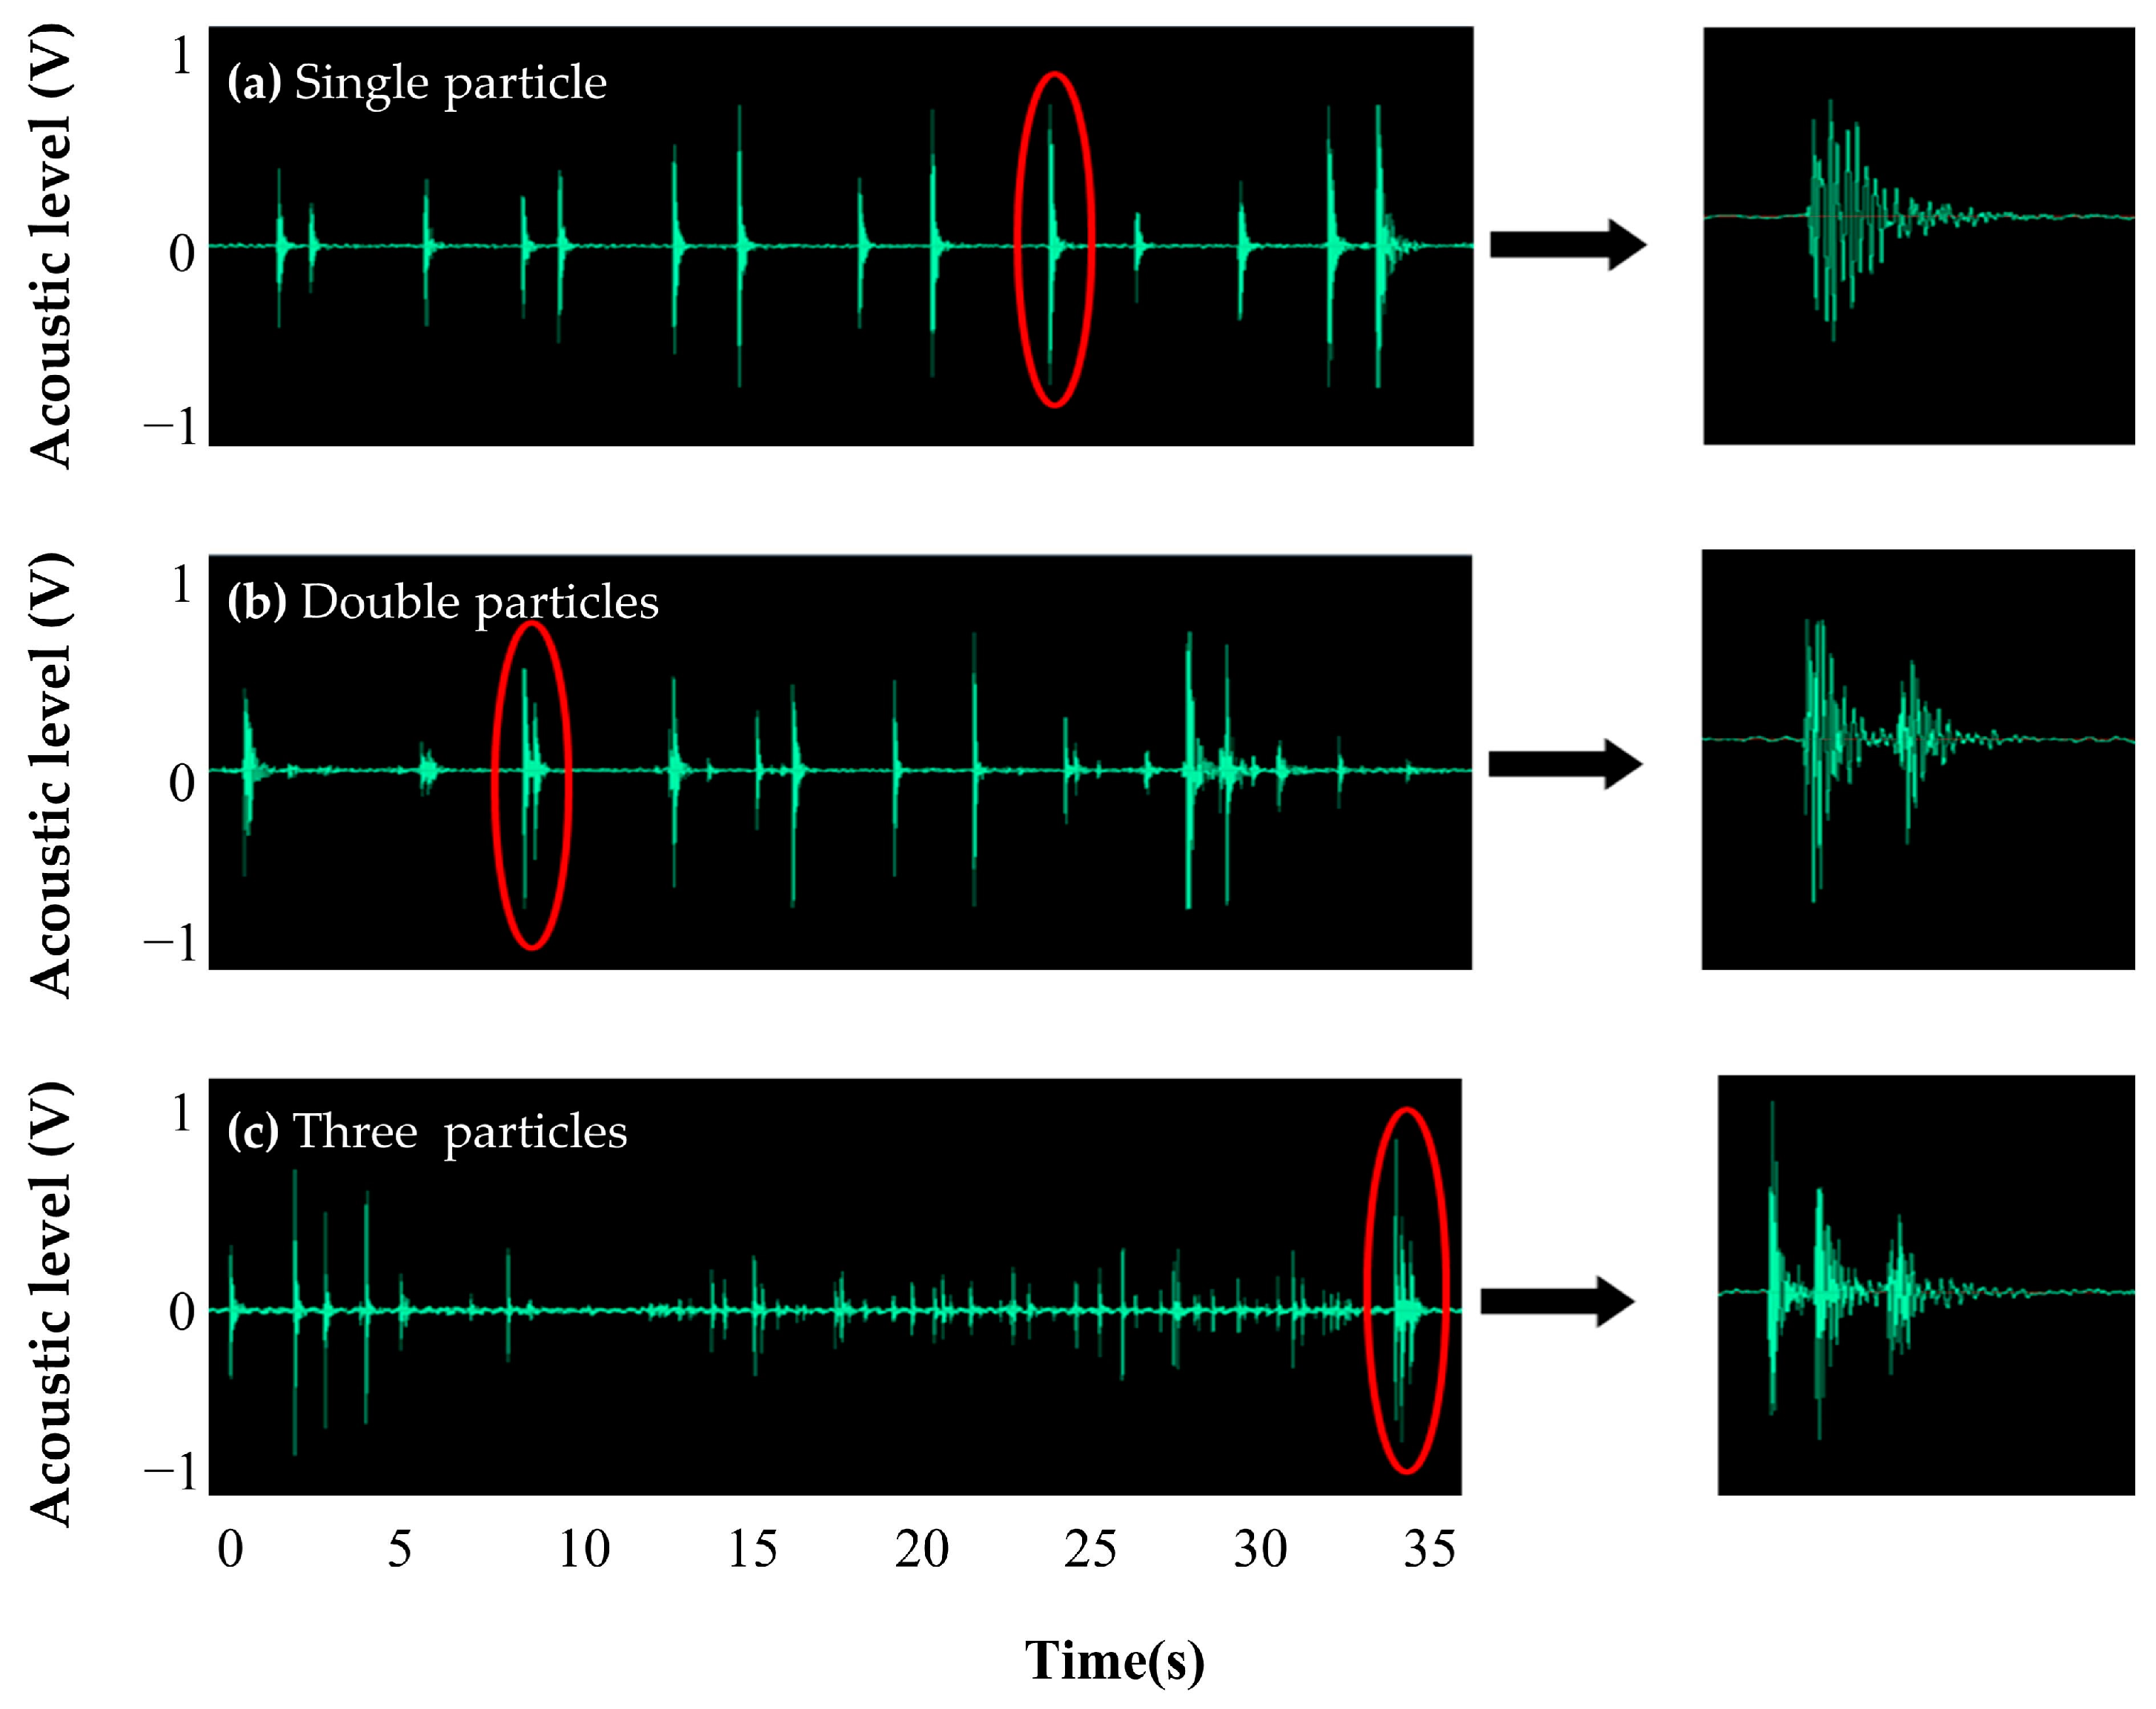
  • Period of single gravel particle travel
The GPVS records the sound of gravel passing (rolling) through the metal plate. Analyzing the acoustic signals yields the duration of the gravel crossing the plate. Figure 9 depicts a typical time recording for a single gravel particle rolling through the GPVS. The analysis results for 1000 samplings for the three flow discharges examined are shown in Figure 10. The average duration for a single gravel particle traversing the GPVS is shown in Table 2, which shows that it decreases with increasing flow discharge.
  • Comparison of signal characteristics of a single gravel particle and multiple gravel particles.
Figure 11 depicts a comparison of acoustic signals recorded for a single gravel particle and multiple gravel particles. Figure 11a shows that, when only one particle travels through the GPVS, the acoustic signal is simple, and the time intervals between two impacts are clear. The acoustic signal is more complicated in the event of multiple particles and reveals more impacts occurring at shorter time intervals, as shown in Figure 11b,c. The difference in acoustic signals between a single particle and multiple particles could be utilized to determine the number of particles traveling through the GPVS. These authors’ method [54] will be used to calculate the number of particles that travel through the GPVS.

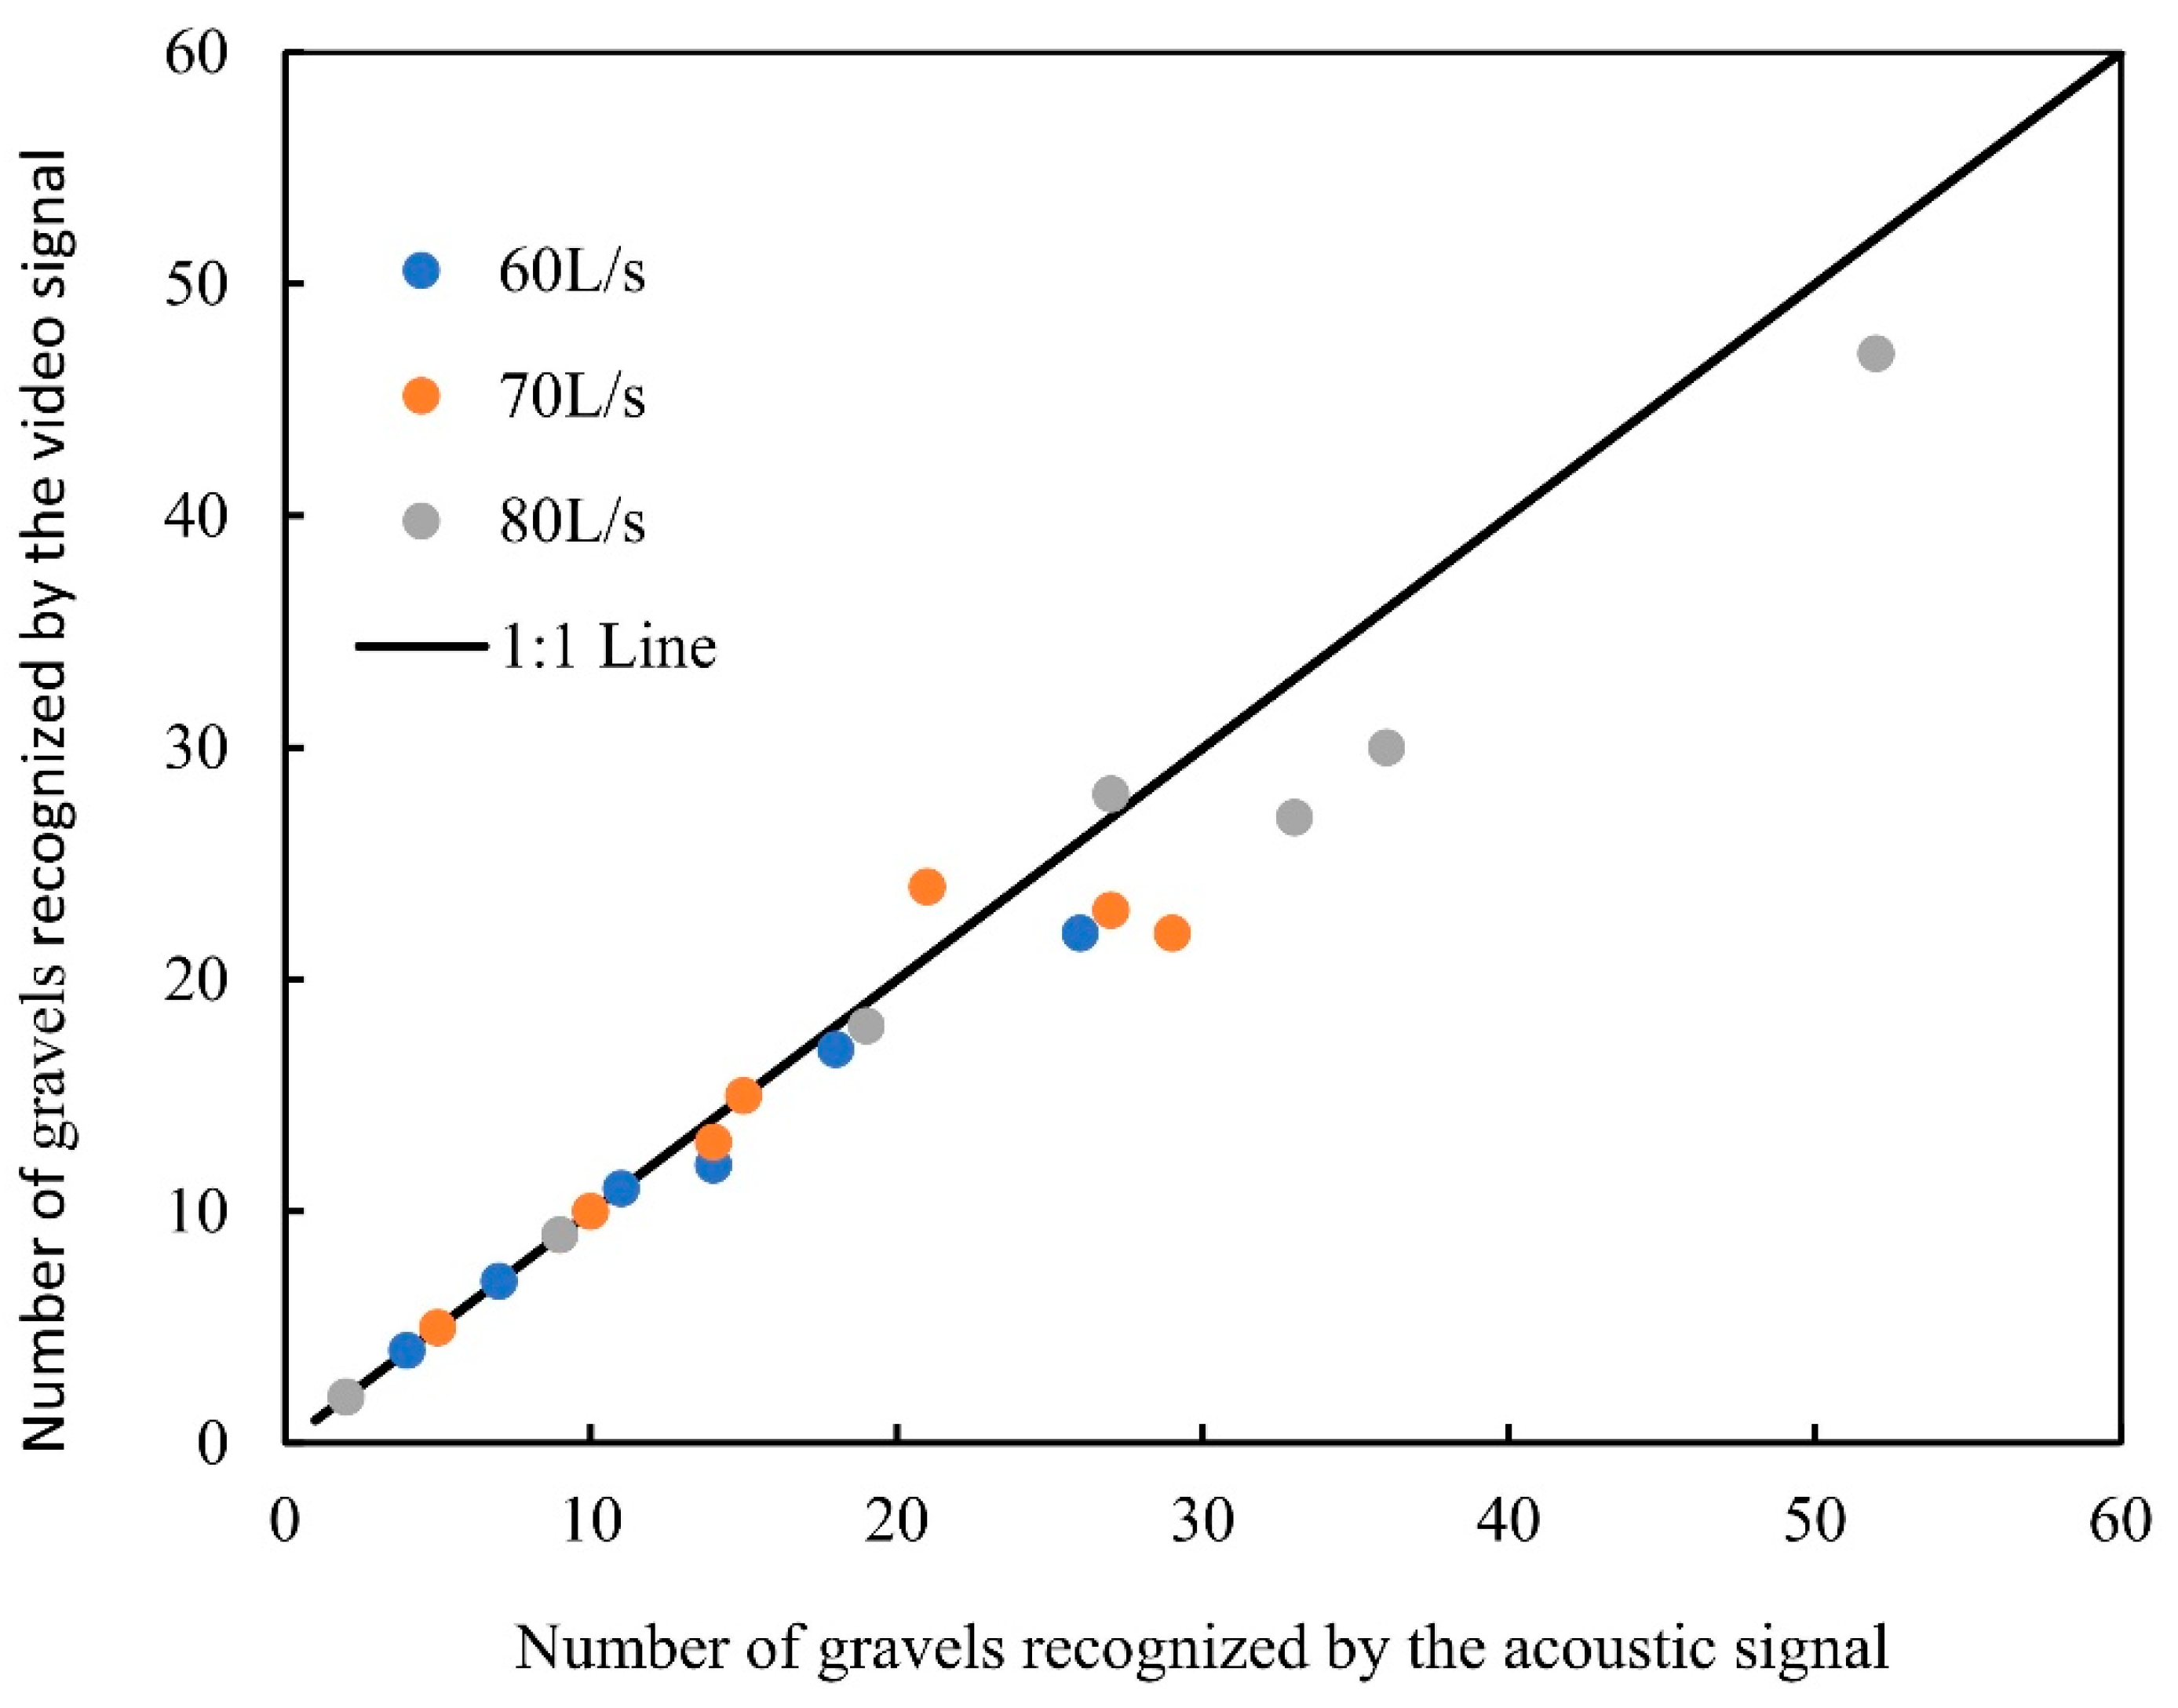
3.2.2. Gravel Transport Rate

The gravel transport rate per unit width is the gravel mass passing a river cross-section per unit time per unit width:
q s = n m / b t ,
where b is the width of the GPVS (m); n is the gravel particle number passing the GPVS during time t; t is the transport period (s); and m is the mass of a single gravel particle (kg). In the experiment, natural gravel with D50 = 11 mm is used in the test.
Figure 12 compares the gravel particle numbers moving through the GPVS using data from direct observation of the audio and acoustic signals. The gravel particle counts computed using GPVS acoustic signals agree well with the direct count from the audio recording. The gravel transport rate can be approximated using the above equation to be 0.1 g/(s·m), 0.25 g/(s·m), and 0.85 g/(s·m) for flow discharges of 60 L/s, 70 L/s, and 80 L/s, respectively.

4. Discussion

It is known that the peak frequency of the sediment particles impacting with each other or the acoustic device relates to the sediment particle size. From the laboratory experiments, Thorne [55,56,57] proposed the following equation, which links the peak frequency of the particles’ inter-collision and the sediment size distribution:
f p e a k = 224 / D 0.9 ,
where D is the particle size in meters. The computed peak frequency of particle instrument collisions with a size of 0.011 m using this equation is around 13,000 Hz. The peak frequency of the gravel particles of 0.011 m impacting on the GPVS in our experiment is around 600–8300 Hz, which is much lower than that given by Equation (4). One possible explanation is that the peak frequency in this study is the frequency of particles impacting on the measurement device (i.e., the GPVS), whereas the peak frequency estimated from the above equation is the frequency of particle instrument collisions, which could be much higher than the frequency of particles impacting on the device. Furthermore, previous studies reveal that the signal frequency of the particle’s movement has a fairly large range. For example, Bassett et al. [5] observed bedload sediment transport by placing a hydrophone in a tidal stream. They found that the analysis of the acoustic signals showed that the peak frequency was in the wide range of 4000 Hz to 20,000 Hz for moving particles whose sizes ranged from 4 mm to 170 mm. While the field observation carried out by Geay et al. [37] in the Alpine Drau River with large gravel showed that the bedload acoustic signals had a frequency between 1000 Hz and 60,000 Hz. This illustrates that the peak frequency indicating the inter-collision of sediment particles (or impact on the measurement apparatus) has a very wide range.
In fact, the frequency of the recorded acoustic signals from gravel movement is controlled by a number of factors, including gravel particle size and distribution, riverbed conditions, flow conditions, gravel movement patterns, and so on. As no theoretical expression for estimating bedload transport rates from hydrophone measurements has been developed, only the calibration approach has been used so far.

5. Conclusions

The GPVS system for monitoring gravel movement has been developed in this research. The system is validated by conducting laboratory flume experiments using natural gravel. The experimental results confirm the feasibility and efficacy of the GPVS in determining gravel movement and transport. Furthermore, the acoustic approach has been shown to predict the gravel transport rate rather accurately. This study leads to the following conclusions:
The GPVS is very sensitive to the sound generated by passing gravel and is not sensitive to ambient noise. This is especially advantageous because it eliminates the problem of ambient noise interference that most current acoustic systems have. Meanwhile, a developed GPVS can appropriately monitor the real-time gravel movement. Furthermore, using the collected acoustic signals, the GPVS can produce a relatively accurate quantitative estimation of the gravel transport rate.
The GPVS can reliably monitor total pressure regardless of where it is installed or what the GPVS panel position is, and wherever gravel is piled up. The results reveal that the GPVS measurements are independent of water depth, indicating that GPVS pressure data are primarily caused by gravel movement.
The acoustic approach can properly determine the gravel transport rate for weak gravel transport. For heavy gravel transport, the accuracy of this method decreases, and the pressure method will be used in this situation.
Due to the experimental flume’s restrictions, only a single gravel size is tested under steady and uniform flow conditions to assess the accuracy of the acoustic signal collected by the GPVS. Further study is required for cases with strong gravel transport and graded sediments in order to improve the system.

6. Patents

Yang, S.; Zhang, P.; Tian, M.; Hu, J.; Li, W.; Xiao, Y.; Xing, R.; Fu, X. Collecting apparatus, system, and method for gravel transport pressure and transport audio. CA 3010122 [P]. 9 June 2020.

Author Contributions

Conceptualization, M.T. and S.Y.; methodology, M.T. and P.Z.; validation, P.Z.; formal analysis, M.T. and Q.G.; investigation, M.T. and Q.G.; resources, S.Y.; data curation, M.T. and Q.G.; writing—original draft preparation, M.T.; writing—review and editing, M.T., S.Y. and P.Z.; supervision, P.Z.; project administration, S.Y.; funding acquisition, S.Y. All authors have read and agreed to the published version of the manuscript.

Funding

This research was funded by the Three Gorges Follow-up Scientific Research Project of China (Research and Application of the Prototype Observation Technology of Gravel Transport by the Pressure Method in the Fluctuating Backwater Area of the Three Gorges Reservoir, Project No.: 2017-31-1).

Institutional Review Board Statement

Not applicable.

Informed Consent Statement

Not applicable.

Data Availability Statement

The data presented in this study are available on request from the corresponding author.

Conflicts of Interest

The authors declare no conflict of interest.

References

  1. Lee, H.; Hsu, I. Investigation of Saltating Particle Motions. J. Hydraul. Eng. 1994, 120, 831–845. [Google Scholar] [CrossRef]
  2. Cristo, C.D.; Greco, M.; Iervolino, M.; Leopardi, A.; Vacca, A. Two-Dimensional Two-Phase Depth-Integrated Model for Transients over Mobile Bed. J. Hydraul. Eng. 2016, 142, 04015043. [Google Scholar] [CrossRef]
  3. Chien, N.; Wan, C. Mechanics of Sediment Transport; American Society of Civil Engineers: Reston, VA, USA, 1999; ISBN 978-0-7844-0400-3. [Google Scholar]
  4. Drake, T.G.; Shreve, R.L.; Dietrich, W.E.; Whiting, P.J.; Leopold, L.B. Bedload Transport of Fine Gravel Observed by Motion-Picture Photography. J. Fluid Mech. 1988, 192, 193–217. [Google Scholar] [CrossRef]
  5. Bassett, C.; Thomson, J.; Polagye, B. Sediment-Generated Noise and Bed Stress in a Tidal Channel. J. Geophys. Res. Ocean. 2013, 118, 2249–2265. [Google Scholar] [CrossRef]
  6. Bradley, D.N.; Tucker, G.E. Measuring Gravel Transport and Dispersion in a Mountain River Using Passive Radio Tracers. Earth Surf. Process. Landf. 2012, 37, 1034–1045. [Google Scholar] [CrossRef]
  7. Einstein, H.A. Formulas for the Transportation of Bed Load. T. Am. Soc. Civ. Eng. 1942, 107, 561–577. [Google Scholar] [CrossRef]
  8. Einstein H, A. The Bed-Load Function for Sediment Transportation in Open Channel Flows; Technical Bulletin; United States Department of Agriculture: Washington, DC, USA, 1950; pp. 35–39.
  9. Ancey, C.; Bohorquez, P.; Bardou, E. Sediment Transport in Mountain Rivers. Ercoftac Bull. 2014, 100, 37–52. [Google Scholar]
  10. Hubbell, D.W. Apparatus and Techniques for Measuring Bedload; USGS Numbered Series; U.S. Government Publishing Office: Washington, DC, USA, 1964; Volume 1748.
  11. Gray, J.R.; Laronne, J.B.; Marr, J.D.G. Bedload-Surrogate Monitoring Technologies; US Department of the Interior, US Geological Survey: Reston, VA, USA, 2010.
  12. Rickenmann, D. Bed-Load Transport Measurements with Geophones and Other Passive Acoustic Methods. J. Hydraul. Eng. 2017, 143, 03117004. [Google Scholar] [CrossRef]
  13. Ergenzinger, P.; Conrady, J. A New Tracer Technique for Measuring Bedload in Natural Channels. Catena 1982, 9, 77–80. [Google Scholar] [CrossRef]
  14. Phillips, C.B.; Jerolmack, D.J. Dynamics and Mechanics of Tracer Particles. Earth Surf. Dyn. Discuss. 2014, 2, 429–476. [Google Scholar] [CrossRef]
  15. Vázquez-Tarrío, D.; Menéndez-Duarte, R. Assessment of Bedload Equations Using Data Obtained with Tracers in Two Coarse-Bed Mountain Streams (Narcea River Basin, NW Spain). Geomorphology 2015, 238, 78–93. [Google Scholar] [CrossRef]
  16. Bunte, K.; Ergenzinger, P. New Tracer Techniques for Particles in Gravel Bed Rivers. Bull. Soc. Géograph. Liege 1989, 25, 85–90. [Google Scholar]
  17. Rasouli, M.; Bertrand, F.; Chaouki, J. A Multiple Radioactive Particle Tracking Technique to Investigate Particulate Flows. AIChE J. 2015, 61, 384–394. [Google Scholar] [CrossRef]
  18. Roy, S. Radiotracer and Particle Tracking Methods, Modeling and Scale-Up. AIChE J. 2017, 63, 314–326. [Google Scholar] [CrossRef]
  19. McNamara, J.P.; Borden, C. Observations on the Movement of Coarse Gravel Using Implanted Motion-Sensing Radio Transmitters. Hydrol. Process. 2004, 18, 1871–1884. [Google Scholar] [CrossRef]
  20. Habersack, H.M. Radio-Tracking Gravel Particles in a Large Braided River in New Zealand: A Field Test of the Stochastic Theory of Bed Load Transport Proposed by Einstein. Hydrol. Process. 2001, 15, 377–391. [Google Scholar] [CrossRef]
  21. Habersack, H. Use of Radio-Tracking Techniques in Bed Load Transport Investigations; IAHS-AISH Publication: Wallingford, UK, 2003; pp. 172–180. [Google Scholar]
  22. Ergenzinger, P.J.; Custer, S.G. Determination of Bedload Transport Using Naturally Magnetic Tracers: First Experiences at Squaw Creek, Gallatin County, Montana. Water Resour. Res. 1983, 19, 187–193. [Google Scholar] [CrossRef]
  23. Bunte, K. Measurements of Gravel Transport Using the Magnetic Tracer Technique: Temporal Variability over a Highflow Season and Field-Calibration. US Geol. Surv. Sci. Investig. Rep. 2010, 5091, 85–106. [Google Scholar]
  24. Beylich, A.A.; Laute, K. Combining Impact Sensor Field and Laboratory Flume Measurements with Other Techniques for Studying Fluvial Bedload Transport in Steep Mountain Streams. Geomorphology 2014, 218, 72–87. [Google Scholar] [CrossRef]
  25. Płaczkowska, E.; Krzemień, K.; Gorczyca, E.; Bojarczuk, A.; Żelazny, M. Disturbances in Coarse Bedload Transport in a High-Mountain Stream Channel System (Western Tatras, Poland). Geomorphology 2020, 371, 107428. [Google Scholar] [CrossRef]
  26. Gronz, O.; Hiller, P.H.; Wirtz, S.; Becker, K.; Iserloh, T.; Seeger, M.; Brings, C.; Aberle, J.; Casper, M.C.; Ries, J.B. Smartstones: A Small 9-Axis Sensor Implanted in Stones to Track Their Movements. Catena 2016, 142, 245–251. [Google Scholar] [CrossRef]
  27. Pretzlav, K.L.G.; Johnson, J.P.L.; Bradley, D.N. Smartrock Transport in a Mountain Stream: Bedload Hysteresis and Changing Thresholds of Motion. Water Resour. Res. 2020, 56, e2020WR028150. [Google Scholar] [CrossRef]
  28. Cassel, M.; Dépret, T.; Piégay, H. Assessment of a New Solution for Tracking Pebbles in Rivers Based on Active RFID. Earth Surf. Process. Landf. 2017, 42, 1938–1951. [Google Scholar] [CrossRef]
  29. Krein, A.; Klinck, H.; Eiden, M.; Symader, W.; Bierl, R.; Hoffmann, L.; Pfister, L. Investigating the Transport Dynamics and the Properties of Bedload Material with a Hydro-Acoustic Measuring System. Earth Surf. Process. Landf. 2008, 33, 152–163. [Google Scholar] [CrossRef]
  30. Penteado, M.R.M.; Franklin, E.d.M. Velocity Fields of a Bed-Load Layer under a Turbulent Liquid Flow. Exp. Therm. Fluid Sci. 2016, 78, 220–228. [Google Scholar] [CrossRef]
  31. Thorne, P.D. An Intercomparison between Visual and Acoustic Detection of Seabed Gravel Movement. Mar. Geol. 1986, 72, 11–31. [Google Scholar] [CrossRef]
  32. Thorne, P.D.; Williams, J.J.; Heathershaw, A.D. In Situ Acoustic Measurements of Marine Gravel Threshold and Transport. Sedimentology 1989, 36, 61–74. [Google Scholar] [CrossRef]
  33. Ancey, C.; Davison, A.C.; Böhm, T.; Jodeau, M.; Frey, P. Entrainment and Motion of Coarse Particles in a Shallow Water Stream down a Steep Slope. J. Fluid Mech. 2008, 595, 83–114. [Google Scholar] [CrossRef]
  34. Ancey, C.; Pascal, I. Estimating Mean Bedload Transport Rates and Their Uncertainty. J. Geophys. Res. Earth Surf. 2020, 125, e2020JF005534. [Google Scholar] [CrossRef]
  35. Ermilov, A.A.; Fleit, G.; Conevski, S.; Guerrero, M.; Baranya, S.; Rüther, N. Bedload Transport Analysis Using Image Processing Techniques. Acta Geophys. 2022, 70, 2341–2360. [Google Scholar] [CrossRef]
  36. Yager, E.M.; Kenworthy, M.; Monsalve, A. Taking the River inside: Fundamental Advances from Laboratory Experiments in Measuring and Understanding Bedload Transport Processes. Geomorphology 2015, 244, 21–32. [Google Scholar] [CrossRef]
  37. Geay, T.; Belleudy, P.; Gervaise, C.; Habersack, H.; Aigner, J.; Kreisler, A.; Seitz, H.; Laronne, J.B. Passive Acoustic Monitoring of Bed Load Discharge in a Large Gravel Bed River. J. Geophys. Res. Earth Surf. 2017, 122, 528–545. [Google Scholar] [CrossRef]
  38. Tian, M.; Yang, S.; Guo, Q. Gravel movement real-time tracking based on underwater acoustic principle. J. Sediment Res. 2017, 42, 14–19. [Google Scholar]
  39. Marineau, M.D.; Wright, S.A.; Gaeuman, D. Calibration of Sediment-Generated Noise Measured Using Hydrophones to Bedload Transport in the Trinity River, California, USA. 2016, Volume 9. Available online: https://www.researchgate.net/profile/Mathieu-Marineau/publication/305280105_Calibration_of_sediment_generated_noise_measured_using_hydrophones_to_bedload_transport_in_the_Trinity_River_California_USA/links/57867a4908aef321de2c6b29/Calibration-of-sediment-generated-noise-measured-using-hydrophones-to-bedload-transport-in-the-Trinity-River-California-USA.pdf (accessed on 29 June 2023).
  40. Krein, A.; Schenkluhn, R.; Kurtenbach, A.; Bierl, R.; Barrière, J. Listen to the Sound of Moving Sediment in a Small Gravel-Bed River. Int. J. Sediment Res. 2016, 31, 271–278. [Google Scholar] [CrossRef]
  41. Le Guern, J.; Rodrigues, S.; Geay, T.; Zanker, S.; Hauet, A.; Tassi, P.; Claude, N.; Jugé, P.; Duperray, A.; Vervynck, L. Relevance of Acoustic Methods to Quantify Bedload Transport and Bedform Dynamics in a Large Sandy-Gravel-Bed River. Earth Surf. Dynam. 2021, 9, 423–444. [Google Scholar] [CrossRef]
  42. Geay, T.; Belleudy, P.; Laronne, J.B.; Camenen, B.; Gervaise, C. Spectral Variations of Underwater River Sounds. Earth Surf. Process. Landf. 2017, 42, 2447–2456. [Google Scholar] [CrossRef]
  43. Geay, T.; Zanker, S.; Petrut, T.; Recking, A. Measuring Bedload Grain-Size Distributions with Passive Acoustic Measurements. E3S Web Conf. 2018, 40, 04010. [Google Scholar] [CrossRef]
  44. Geay, T.; Zanker, S.; Misset, C.; Recking, A. Passive Acoustic Measurement of Bedload Transport: Toward a Global Calibration Curve? J. Geophys. Res. Earth Surf. 2020, 125, e2019JF005242. [Google Scholar] [CrossRef]
  45. Nasr, M.; Johannot, A.; Geay, T.; Zanker, S.; Le Guern, J.; Recking, A. Passive Acoustic Monitoring of Bed Load with Drifted Hydrophone. J. Hydraul. Eng. 2023, 149, 06023003. [Google Scholar] [CrossRef]
  46. Nasr, M.; Geay, T.; Zanker, S.; Recking, A. A Physical Model for Acoustic Noise Generated by Bedload Transport in Rivers. J. Geophys. Res. Earth Surf. 2022, 127, e2021JF006167. [Google Scholar] [CrossRef]
  47. Nasr, M.; Johannot, A.; Geay, T.; Zanker, S.; Le Guern, J.; Recking, A. Optimization of Passive Acoustic Bedload Monitoring in Rivers by Signal Inversion. Earth Surf. Dyn. Discuss. 2023; in review. [Google Scholar] [CrossRef]
  48. Wyss, C.R.; Rickenmann, D.; Fritschi, B.; Turowski, J.M.; Weitbrecht, V.; Boes, R.M. Measuring Bed Load Transport Rates by Grain-Size Fraction Using the Swiss Plate Geophone Signal at the Erlenbach. J. Hydraul. Eng. 2016, 142, 04016003. [Google Scholar] [CrossRef]
  49. Rickenmann, D. Bedload Transport Measurements with Geophones, Hydrophones, and Underwater Microphones (Passive Acoustic Methods). In Gravel-Bed Rivers; Tsutsumi, D., Laronne, J.B., Eds.; John Wiley & Sons, Ltd.: Chichester, UK, 2017; pp. 185–208. ISBN 978-1-118-97143-7. [Google Scholar]
  50. Nicollier, T.; Rickenmann, D.; Hartlieb, A. Field and Flume Measurements with the Impact Plate: Effect of Bedload Grain-size Distribution on Signal Response. Earth Surf. Process. Landforms 2021, 46, 1504–1520. [Google Scholar] [CrossRef]
  51. Nicollier, T.; Antoniazza, G.; Rickenmann, D.; Hartlieb, A.; Kirchner, J.W. Improving the Calibration of the Swiss Plate Geophone Bedload Monitoring System by Filtering Out Seismic Signals from Extraneous Particle Impacts. Earth Space Sci. 2022, 9, e2021EA001962. [Google Scholar] [CrossRef]
  52. Antoniazza, G.; Nicollier, T.; Boss, S.; Mettra, F.; Badoux, A.; Schaefli, B.; Rickenmann, D.; Lane, S.N. Hydrological Drivers of Bedload Transport in an Alpine Watershed. Water Resour. Res. 2022, 58, e2021WR030663. [Google Scholar] [CrossRef]
  53. Rickenmann, D.; Ammann, L.; Nicollier, T.; Boss, S.; Fritschi, B.; Antoniazza, G.; Steeb, N.; Chen, Z.; Wyss, C.; Badoux, A. Comparison of Calibration Characteristics of Different Acoustic Impact Systems for Measuring Bedload Transport in Mountain Streams. Earth Surf. Dyn. 2022, 10, 1165–1183. [Google Scholar] [CrossRef]
  54. Tian, M.; Yang, S.; Zhang, P. Detection of the Bedload Movement with an Acoustic Sensor in the Yangtze River, China. Water 2023, 15, 939. [Google Scholar] [CrossRef]
  55. Thorne, P.D. The Measurement of Acoustic Noise Generated by Moving Artificial Sediments. J. Acoust. Soc. Am. 1985, 78, 1013–1023. [Google Scholar] [CrossRef]
  56. Thorne, P.D. Laboratory and Marine Measurements on the Acoustic Detection of Sediment Transport. J. Acoust. Soc. Am. 1986, 80, 899–910. [Google Scholar] [CrossRef]
  57. Thorne, P.D. An Overview of Underwater Sound Generated by Inter-Particle Collisions and Its Application to the Measurements of Coarse Sediment Bedload Transport. Earth Surf. Dyn. 2014, 2, 531–543. [Google Scholar] [CrossRef]
Figure 1. Schematical diagram of GPVS. (a) Location of pressure sensor; (b) arrangement of elements of the system; and (c) cover of GPVS.
Applsci 13 09429 g001
Figure 2. Schematical diagram of the location of weights.
Applsci 13 09429 g002
Figure 3. Layout of the GPVS in the pressure test.
Applsci 13 09429 g003
Figure 4. The plan view of the flume setup.
Applsci 13 09429 g004
Figure 5. Variation of the estimated pressure with gravel weight placed at various status: (a) flat; (b) diagonal tiling (10°); (c) opposite side tiling (10°); and (d) overturning.
Applsci 13 09429 g005
Figure 6. Effect of water depth on pressure recording.
Applsci 13 09429 g006
Figure 7. Photograph of bedload particles in motion.
Applsci 13 09429 g007
Figure 8. Temporal variation of the measured gravel mass by the GPVS with flow discharge.
Applsci 13 09429 g008
Figure 9. Duration of a single particle motion on the GPVS.
Applsci 13 09429 g009
Figure 10. Distribution of the movement time of the bedload under three flow discharges.
Applsci 13 09429 g010
Figure 11. Raw acoustic waveforms of moving gravel with different particle counts.
Applsci 13 09429 g011
Figure 12. Identification results of different methods under three flow conditions.
Applsci 13 09429 g012
Table 1. Results of different methods of measuring gravel transport mass (600 L/S).
Method12345
GPVS24.78 kg30.92 kg28.63 kg21.94 kg26.32 kg
Bedload trap25.98 kg32.05 kg29.87 kg22.63 kg28.74 kg
Table 2. Average duration for a single gravel particle traversing the GPVS.
Flow Discharge (L/s)Time (s)Average Time (s)
601.21~1.961.568
701.01~1.531.263
800.81~1.191.013
Disclaimer/Publisher’s Note: The statements, opinions and data contained in all publications are solely those of the individual author(s) and contributor(s) and not of MDPI and/or the editor(s). MDPI and/or the editor(s) disclaim responsibility for any injury to people or property resulting from any ideas, methods, instructions or products referred to in the content.

