Article

The Influence of Tomato and Pepper Processing Waste on Bread Quality

by
Anna Wirkijowska
1,
Piotr Zarzycki
1,*,
Dorota Teterycz
1,
Agnieszka Nawrocka
2,
Agata Blicharz-Kania
3 and
Paulina Łysakowska
1
1
Division of Engineering and Cereals Technology, Department of Plant Food Technology and Gastronomy, University of Life Sciences in Lublin, Skromna 8, 20-704 Lublin, Poland
2
Institute of Agrophysics Polish Academy of Sciences, Doświadczalna 4, 20-290 Lublin, Poland
3
Department of Biological Bases of Food and Feed Technologies, Faculty of Production Engineering, University of Life Sciences in Lublin, Głęboka 28, 20-612 Lublin, Poland
*
Author to whom correspondence should be addressed.
Appl. Sci. 2023, 13(16), 9312; https://doi.org/10.3390/app13169312
Submission received: 15 July 2023 / Revised: 8 August 2023 / Accepted: 15 August 2023 / Published: 16 August 2023

Abstract

:
Worldwide, there is a significant amount of food waste, highlighting the need to reduce waste throughout the production process. This study investigated the impact of incorporating vegetable processing waste from tomatoes (TP) and bell peppers (PB) on dough characteristics and bread quality, with concentrations of TP and PB ranging from 3% to 12% based on flour weight. The addition of TP and PB influenced the farinograph characteristics, increasing water absorption, dough development, and softening while reducing stability time. However, the changes in bread quality, including baking yield, loss, volume, and crumb porosity, were not significant. The texture properties, such as hardness, chewiness, and cohesiveness of the crumb, showed no significant changes within the supplemented levels up to 9%. Additionally, the TP and PB had a significant impact on the color of the bread crumb, increasing redness and yellowness, particularly with PB. Fortification with TP and PB up to 9% resulted in baking characteristics comparable to 100% wheat bread. The addition of TP and PB changed nutrient content, particularly dietary fiber, without significantly altering the caloric value of the bread. However, semi-consumer sensory evaluation indicated a decrease in aroma and taste when PB exceeded 9%, and a similar effect on taste was indicated when TP exceeded 9%. In conclusion, TP and PB at supplementation levels up to 9% can enhance the nutritional profile of bread and maintain its baking quality.

1. Introduction

One of the major challenges facing the agri-food industry today is the elimination, reduction, or reuse of significant amounts of waste and by-products generated at various stages of the food production process [1]. These efforts align with the European Union’s (EU) plan for a circular economy, which aims to reduce food waste, increase the value and longevity of products, and promote more efficient use of materials and resources in the economy [2]. According to data from the Food and Agriculture Organization (FAO), in the processing of oilseeds, approximately 20% of oilseeds are wasted, while for meat and dairy products, this figure is 20%; for grains, this figure is 30%; for fish, this figure is 35%, and for fruits and vegetables, it ranges from 40% to 50% [3]. Regarding total global food production, the amount of food wasted is estimated to be around 1.3 billion tons. Utilizing by-products from food processing that are rich in nutrients in new product development is a recommended approach for alleviating this [3,4,5,6].
One potential source of by-products that can be used to modify food product recipes is vegetable processing waste, specifically tomato by-products (TP) and bell pepper by-products (PB). These by-products have been studied for their potential applications in various food products, contributing to reducing food waste and enhancing the nutritional value of food [7,8,9]. Previous research has shown that TP can be a good source of dietary fiber, with an approximate content of 61% on a dry basis, while PB has a dietary fiber content of approximately 33% on a dry matter basis [9]. Additionally, dried tomato waste, including seeds and skin, contains approximately 17–23% protein, and the placenta of bell peppers has a protein content of about 28% [8,10]. Furthermore, both TP and PB are rich sources of lysine and sulfur amino acids such as methionine and cysteine, which can improve the overall protein quality of wheat-based food products [8,9]. TP, which contain a large amount of seeds, are a rich source of bioactive compounds that have been shown to exhibit strong antioxidant, anticancer, and antimicrobial activity in numerous studies. Tomato seeds contain no antinutritive agents or toxic elements [11,12]. The consumption of tomatoes is generally recognized as healthy, but as with all foods, there are limits and concerns to be mindful of. The vast consumption of tomato skin and seeds by humans may lead to irritable bowel syndrome, causing bloating and diarrhea [12]. Some research suggests that seed protein may be a relevant allergen, although whether it is predictive of systemic reactions remains to be determined [13]. Research also indicates that bell peppers are rich in phenolic compounds and flavonoids, which may offer benefits to human health. Diets rich in phytochemicals have been associated with a reduced risk of chronic non-communicable diseases, including diabetes, osteoporosis, and cancer. These beneficial effects are often attributed to the antioxidant capacity of polyphenols and flavonoids, which can help mitigate oxidative stress. The regular consumption of bell peppers can improve one’s health and prevent degenerative diseases [14].
Bread is a widely consumed staple food globally, with an average per capita consumption of around 250 g per day [15]. It primarily provides carbohydrates (70–80% dry matter), proteins (10–14% dry matter), minerals (0.5–0.8% dry matter), and fats (0.7–1.35% dry matter). However, the dietary fiber content in bread is relatively low, typically around 2–3% [6,16]. To enhance the nutritional value of bread, there is a growing trend of incorporating non-traditional raw materials, including high-protein waste products from the plant food industry [17,18]. The introduction of additional ingredients, including by-products, into bread recipes not only affects the health-promoting properties of the resulting products but also the rheological characteristics of the dough. These changes can significantly impact the quality attributes of bread. For instance, the incorporation of high-fiber ingredients into the dough can disrupt the formation of the gluten network by creating new hydrogen bonds or altering the conformation of disulfide bridges. Such changes can influence the rheological properties of the dough by improper folding of polypeptide chains or aggregation of protein complexes [19]. The addition of fiber-rich ingredients, due to the presence of hydroxyl groups in their structure that can form hydrogen bonds with water, can increase the water absorption capacity [20]. While the high water absorption capacity of fiber can have a positive effect on the baking properties of the mixture [21], it can lead to dehydration of the gluten network, resulting in reduced elasticity and decreased resistance to mixing [22]. The weakening of the gluten network structure by vegetable by-products such as TP and PB has also been confirmed in previous studies examining changes in the secondary structure of the gluten network [23]. These findings further support the notion that the addition of fiber-rich ingredients can have a significant impact on the rheological properties of dough and the overall quality of bread.
Therefore, the objective of this study was to examine the effects on the rheological properties of dough and the quality of bread after incorporating vegetable processing waste from tomatoes (TP) and bell peppers (PB) into a recipe for wheat bread. Additionally, the physicochemical features and nutrient composition of the bread were analyzed to assess the potential for producing bread with increased nutritional value, particularly in terms of dietary fiber, while maintaining the desired quality characteristics preferred by consumers. This research aimed to contribute to both diversifying the range of bread products and reducing food waste by utilizing vegetable processing waste.

2. Materials and Methods

2.1. Materials

The wheat flour (type 750) used as the primary raw material in this study was obtained from a local supermarket in Lublin, Poland. The flour had an ash content of 0.72% d.b., a wet gluten content of 27.2% ± 1.1, a gluten index of 98.3 ± 0.5, a falling number of 301 s ± 8, and an equivalent diameter of 0.12 mm. By-products from red bell pepper processing, namely pepper placenta (PB) without seeds, and by-products from tomato processing, specifically tomato waste (TP) containing seeds and skin, were also used. These by-products were sourced from Krokus, Pająków, Poland.
Before usage, TP and PB were prepared according to the procedure described previously by Teterycz and Sobota [9]. The vegetable by-products were dried for 17 h in static dryers (EAC 30-Lab, ItalPast, Fidenza, Italy) using a low temperature profile (30–40 °C; 72–25% RH—relative humidity). Subsequently, the by-products were ground using a laboratory knife mill (Grindomix GM 200, Retsch, GmbH, Haan, Germany) to obtain flour with a particle size below 0.250 mm (>95%). The resulting flour was stored in dark sealed containers prior to bread making and chemical analysis. The equivalent diameter was determined based on the conducted sieve analysis of the used raw materials. Each time, a 100 g sample of the material was taken and sieved through a set of sieves (315, 250, 200, 180, 160, 125, 80, and 60 μm) for 10 min using a sieve shaker (CISA BA 200N, Barcelona, Spain). The equivalent diameter for TP was 0.240 mm, and for PB, it was 0.180 mm.

2.2. Bread Making Procedure

A total of nine bread formulas were prepared, each utilizing different ratios of wheat flour to TP and PB. The control bread formula (CON) consisted of 100% wheat flour. Additionally, four bread formulas enriched with TP and four with PB were created, where wheat flour was substituted with TP or PB at varying levels: 3, 6, 9, and 12 g per 100 g. The samples were labeled as TP3, TP6, TP9, TP12, PB3, PB6, PB9, and PB12, respectively. The complete bread formula consisted of 600 g of flour, which could be either wheat flour or a mixture of wheat flour with PB or TP. Other ingredients included 9 g of salt, 18 g of compressed yeast (Saccharomyces cerevisiae), and an appropriate amount of water. The water content for each formula was determined based on the previously established farinographic water absorption (WA) measured at 500 Brabender units consistency.
The bread making procedure used in this study followed the methodology described by Zarzycki et al. [18]. The bread dough was prepared using the straight dough method. All the dough ingredients were mixed in a BEAR Varimixer Teddy 5 L (Verimixer A/S, Copenhagen, Denmark) at level one (low speed) for 3 min and then at high speed until complete gluten development was achieved, as indicated by the farinograph. The dough was then fermented in a proofing chamber (Tefi Klima pro 100, Debag, Germany) at a temperature of 30 °C and a RH of 85 ± 2% for 90 min. At the 60 min mark, an intermediate punching step involving mixing at low speed was performed for 30s. Following the intermediate punching step, the dough was divided by hand into portions weighing 290 g ± 5 g. These portions were then molded and placed into baking pans measuring 18 × 7.5 × 7.0 cm. The dough was allowed to rest for an additional 30 min in the proofing chamber at a temperature of 30 °C and a RH of 85 ± 2%. The fermentation time was monitored for each formulation. Subsequently, the fermented dough samples were baked in a bakery oven (Helios pro 100, Debag, Germany) at a temperature of 230 °C for 30 min. Three loaves of bread prepared with each formula were baked in three separate baking tests, yielding a total of nine loaves of bread for each formula. After baking and cooling for 1 h outside the oven, the bread loaves were weighed, placed in individual plastic bags (one loaf per bag), sealed, and stored at room conditions (20 °C, 50% RH) until further analysis.

2.3. Farinograph Properties of Dough

Farinograph parameters, including water absorption (WA), dough development time (DDT), stability time (ST), dough softening (DS), and Farinograph Quality Number (FQN), were analyzed for both wheat flour and mixed wheat flour with vegetable raw materials (TP and PB) at different levels. The measurements were taken using a Farinograph-E (Brabender, model 8110142, Duisburg, Germany) following the AACC method 54-21 [24]. The determinations of farinograph parameters were performed in triplicate for each sample.

2.4. Evaluation of Bread Quality Characteristics

Bread quality parameters were evaluated in this study, including bread yield (BY), which was calculated using Equation (1); baking loss (BL), which was calculated using Equation (2); bread volume, which was determined using the rapeseed displacement method [AACC Method 10-05.01]; specific volume (cm3·g−1), which was calculated as the ratio of bread volume to bread mass; crumb porosity, which was assessed on a scale from 1 to 8 (8 = only small alveoli and 1 = mix of large and small alveoli) using Dallmann’s classification reported by Bot et al. [25]; and crumb moisture content, which was determined according to AACC Method 44-15.02. All these assessments were conducted 24 h after baking and repeated three times.
B Y = W 1 W 2 · 100 %
B L = W 3 W 1 W 3 · 100 %
where W1 represents the weight of the baked bread (measured 1 h after removal from the oven), W2 represents the weight of the flour used for a specific loaf of bread, and W3 represents the weight of the dough (proofed doughs were weighed immediately prior to being placed in the oven).

2.5. Evaluation of Color Parameters of Bread Crumbs

The color of the bread crumbs, expressed as L*, a*, b* values in the CIE Lab color system, was measured using a spherical spectrophotometer (Chroma Meter CR 5, Konica Minolta, Sakai Osaka, Japan). The measurements were taken with a standard light source (D65), a standard visual field (10 degrees), and an 8 mm diameter aperture. The spectrophotometer was calibrated using white and black standard plates. The measurements were carried out 10 times for each sample.
The total color difference (ΔE*) between the control sample ( L c * , a c * , b c * —taken as a reference sample) and the bread loaves supplemented with TP or PB ( L i * , a i * , b i * ) was calculated using Equation (3). The whiteness index (WI) and yellowness index (YI) of each bread sample were calculated from the acquired L*, a*, and b* data using Equations (4) and (5), respectively.
Δ E * = ( L c * L i * ) 2 + ( a c * a i * ) 2 + ( b c * b i * ) 2
W I = 100 ( ( 100 L * ) 2 + a 2 + b 2 )  
Y I = 142.83 · b * L *

2.6. Texture Profile Analysis (TPA) of Bread

A TPA analysis of the bread crumbs was conducted following the procedure described by Wirkijowska et al. [17]. In summary, the bread loaves were sliced into 20 mm wide slices, and the outer parts were removed. From these slices, samples in the form of cuboids measuring 30 × 30 × 20 mm were cut for assessment. The double compression test was performed using a testing machine Zwick/Roell Z0.5, (BT1-FR0.5TN.D14, Ulm, Germany) with a maximum force of 500 N. The following parameters were applied: compression to 50% of the initial height, a constant head speed of 1 mm/s, and a flat cylindrical disk with a diameter of 100 mm. Based on the conducted analysis, force–deformation curves were obtained. Using the testXpert II software, properties such as hardness [N] (maximum force during the first compression), springiness [-] (ratio of deformation in the second cycle to deformation in the first cycle), cohesiveness [-] (ratio of the area under the force curve in the second cycle to the area under the force curve in the first cycle), and chewiness [N] (product of hardness, springiness, and cohesiveness) were calculated. The TPA analysis was conducted 24 h and 72 h after baking, and each sample was measured 7 times.

2.7. Semi-Consumer Sensory Evaluation of Bread

Semi-consumer sensory evaluation of bread was conducted using a five-point hedonic scale, where 1 represented “dislike extremely”, 3 represented “neither like nor dislike”, and 5 represented “like extremely”. The evaluation involved 30 panelists (male/female ratio of 70:30, and an age range of 19 to 55 years) consisting of students and staff from the Faculty of Food Science and Biotechnology at the University of Life Sciences in Lublin (participation in the research was voluntary). The panelists were selected based on the following criteria: regular consumption of bread (at least four times per week), good health, and no allergic reactions to gluten/wheat products. The panelists assessed the sensory attributes of the bread, including appearance, aroma, taste, color, texture (elasticity and porosity), and overall acceptance. The bread samples were mechanically sliced into 1 cm thick slices, coded, and served in a randomized order.

2.8. Chemical Composition of Raw Materials and Bread

The chemical composition of the raw materials and bread baked with different formulas was assessed using the AACC and AOAC methods [24,26]. The following parameters were determined: moisture content [AACC Method 44-15A]; ash content [AACC Method 08-01]; protein content using the Kjeldahl method [AACC Method 46-08] with a conversion factor of N × 5.7, fat content [AACC Method 30-26]; and total, soluble, and insoluble dietary fiber (TDF, SDF and IDF, respectively) according to AOAC 991.43, AACC 32-07, AACC 32-21, AOAC 985.29, and AACC 32-05. Available carbohydrate were calculated by subtracting the sum of protein, fat, water, ash, and total dietary fiber from the total weight of the wet sample. The energy value was determined in kilocalories (kcal) per 100 g of wet bread using Atwater factors, where protein and carbohydrate contribute 4 kcal/g, fat contributes 9 kcal/g, and total dietary fiber contributes 2 kcal/g. All chemical tests were conducted in three replications.

2.9. Statistical Analysis

Analytical results were processed using one-way analysis of variance (ANOVA), followed by the post hoc multiple comparison Tukey test to highlight significant differences (p ≤ 0.05) among samples. All data were analyzed using Statistica software (ver.13.3, StatSoft Polska, Kraków, Poland). The data are expressed as mean values ± standard deviations.

3. Results and Discussion

3.1. Farinograph Properties of Dough

The farinographic characteristics facilitate the management of production process parameters and provide insights into the effect of specific additives on the water absorption of flour and dough consistency. The basic farinographic characteristics of wheat flour and wheat flour with the vegetable component (TP and PB) are provided in Table 1. The results indicate that the water absorption of the dough increased from 57.7% to 58.2% and to 61.6% by increasing the levels up to 12% of PB and TP, respectively. However, the changes in the dough fortified with PB were slight, and no significant differences (p ≥ 0.05) were found compared to the control sample. The higher water absorption observed in the dough fortified with TP compared to PB may be attributed to the higher content of TDF in TP, as shown in Table 2. Typically, increasing the content of dietary fiber in dough (through various types of additional ingredients) leads to an increase in water absorption (WA) [17,27]. This phenomenon can be explained by the presence of a large number of hydrophilic groups in the structure of dietary fiber, allowing for more water interaction through hydrogen bonding. Consequently, the dough can absorb a higher amount of water. In general, high water absorption is an indicator of good baking performance [21]. However, the higher water absorption of fiber compared to gluten proteins can lead to dehydration of gluten matrix during the mixing process. As a result, there is an increased resistance to mixing and, at the same time, a reduced elasticity of the gluten network [22].
The significant indicators used to determine the strength of flour included DDT, ST, and DS. Increased dough development time and stability time, along with a decreased degree of softening, indicate flour with strong gluten, which demonstrates resistance to changes in consistency during mixing [28]. The conducted research has shown that both the addition of PB and TP not only results in an increase in DDT but also yields a simultaneous decrease in ST and an increase in DS compared to the control sample (Table 1). The obtained results indicate a weakening of the dough structure caused by the aforementioned additives, which was also confirmed by a significant (p ≤ 0.05) decrease in FQN values (Table 1). The observed relationships can be partially explained by interactions between fiber and gluten, which hinder the complete hydration of proteins, thereby impeding the proper formation of the gluten matrix during dough mixing [29]. Moreover, the observed higher impact of adding PB on DDT and DS compared to adding TP may be due to the significantly higher ash content in PB (Table 2). This leads, among other things, to a significant increase in magnesium, potassium, and sodium levels, which, as previous studies have shown, can result in increased dough resistance to mixing and soften the dough further [9]. An important influence is also exerted by the reduction in gluten protein content, which is caused by the addition of gluten-free ingredients, as well as the physical disorganization of the gluten matrix, leading to a decrease in the strength of the gluten network [30,31]. The weakening of the gluten network structure by vegetable by-products such as TP and PB has also been confirmed in previous studies examining changes in the secondary structure of the gluten network [23].

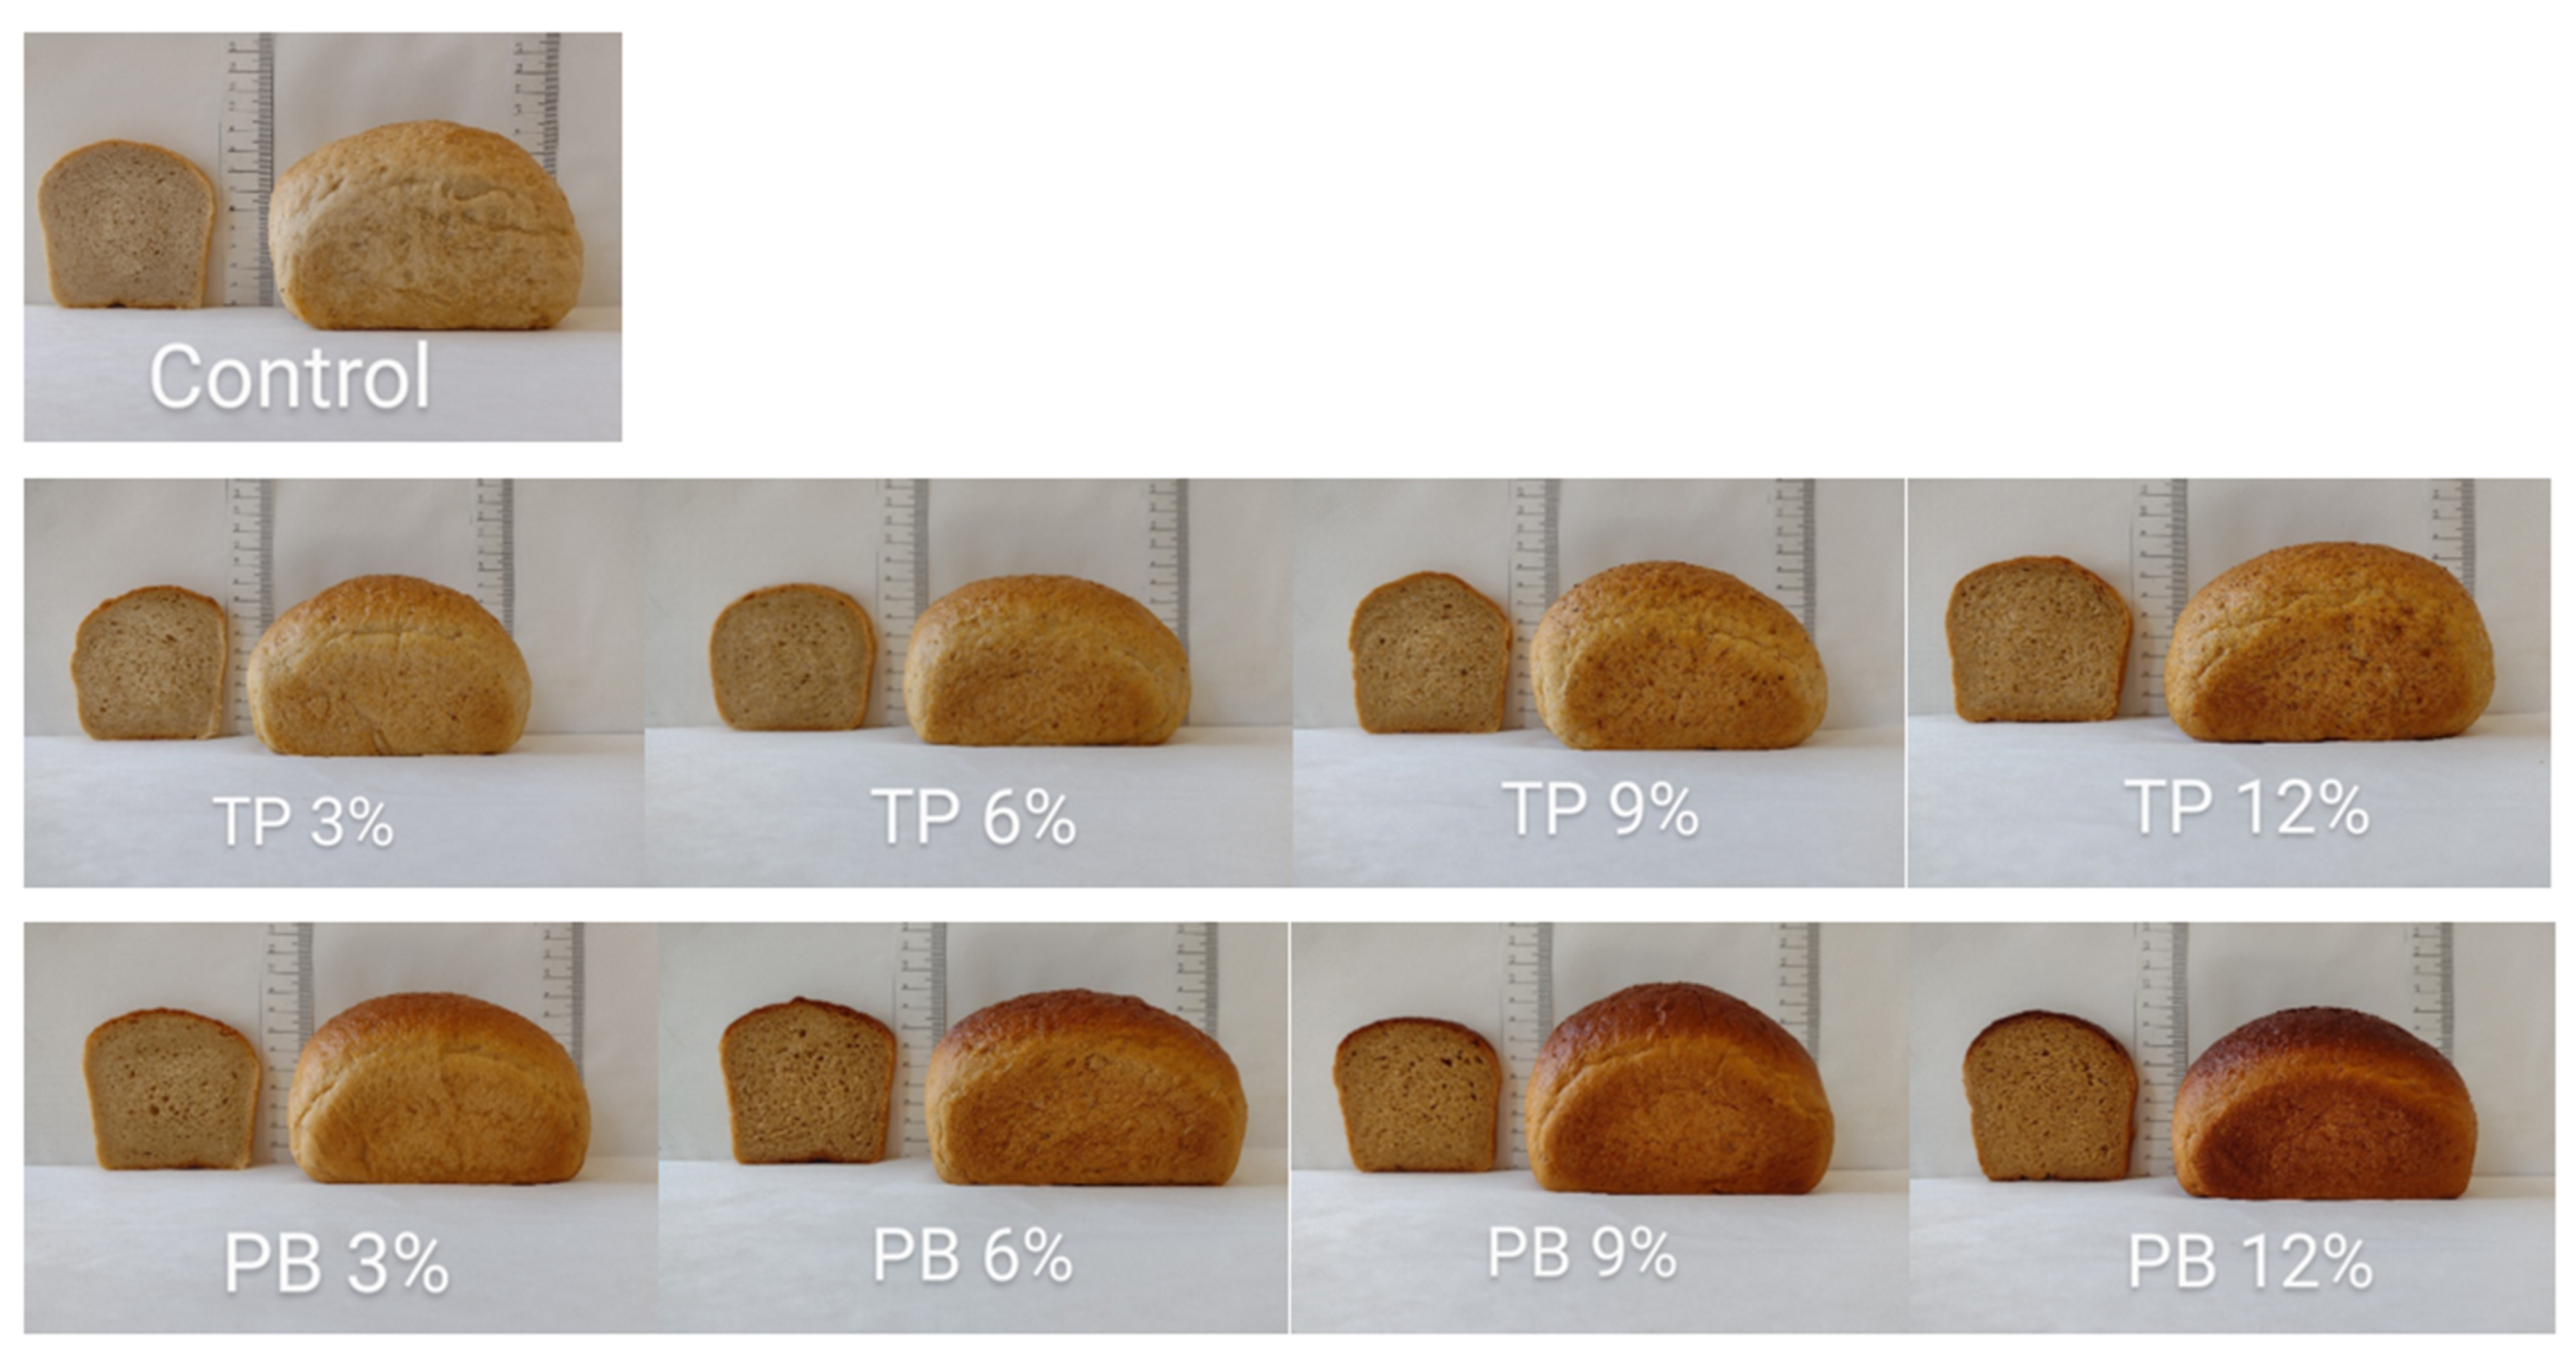
3.2. Evaluation of Bread Quality Characteristics

Table 3 presents the results of the basic physical properties of the control and supplemented bread loaves. All the fortified bread samples exhibited good physical parameters (BY, BL, SV, and crumb porosity) that were comparable to the control. The BY value ranged from 135.4% to 142.3%. In the case of the bread fortified with TP, a slight decrease in BY was observed, but these changes were not statistically significant (p ≥ 0.05). Regarding the bread fortified with PB, a slight increase in BY was observed, which was statistically significant (p ≤ 0.05) for supplementation above 9%. The addition of the TP and PB also did not significantly affect the total baking loss (p ≥ 0.05). The BL values for the tested bread samples ranged from 8.4% to 11.0%, which were slightly lower than the values reported by other authors for wheat bread and bread with the addition of dietary fiber components (ranging from 11.0% to 15.8%) [17,18,32,33].
One of the key factors determining bread quality is the loaf volume. Loaves with a larger volume are generally more appealing to consumers [6]. SV ranged from 2.82 cm3·g−1 to 2.29 cm3·g−1, with the maximum value observed in the control sample, and it decreased with the incorporation of vegetable by-products. However, a clear trend cannot be identified. With the addition of 6% TP, the specific volume decreased by 19%, which was the largest observed reduction. The effect of dry tomato waste addition on the volume of bread was also studied by Nour et al. [8]. They found a significant decrease in the volume of bread with tomato waste addition compared to the control bread. The volume of bread generally depends on gas formation and gas retention, both of which can be affected by the fiber content. The dilution effect, which restricts the water available for gluten hydration and development, as well as the physical disruption of gluten matrix formation, can be responsible for the reduction in bread volume [6]. The obtained results are consistent with the previously demonstrated weakening of the gluten network caused by the addition of TP and PB. A similar impact on SV was also observed in a study by Sogi et al. [34], who utilized the addition of tomato seed flour. On the contrary, in their study on the influence of tomato seed flour addition, Mironeasa et al. [35] demonstrated an increase in bread volume, particularly when the addition did not exceed 10%.
The enhanced addition of vegetable by-products correlates with a lower bread crumb porosity. These differences can also be observed in the digital images of the bread slices (Figure 1). Bread fortified with TP exhibits slightly higher porosity compared to bread fortified with PB; however, the differences are not statistically significant (p ≥ 0.05). The crumb moisture ranged from 41.89% to 43.81%. The changes in moisture caused by the addition of TP and PB did not exceed 3%.
Although there were differences in BY, BL, SV, and crumb porosity between the control and supplemented samples, they were not substantial. Therefore, we can conclude that fortification with TP and PB resulted in baking characteristics comparable to 100% wheat bread.

3.3. Evaluation of Color Parameters of Bread Crumbs

In addition to taste and texture, color is an important sensory indicator of baked goods, and it plays a significant role in meeting consumer expectations. The color of bread is influenced by various factors, including baking parameters, the recipe, and dough characteristics [33,36]. In the present study, the color analysis of the bread was conducted using the CIELab color space, also known as the Lab* color space, developed by the International Commission on Illumination (CIE). The color coordinates of the CIELab color space (L*, a*, and b*) were used to calculate derived parameters, including the total color difference (ΔE*), whiteness index (WI), and the yellowness index (YI) (Table 4). The addition of TP and PB significantly impacts the color of the bread, as indicated by ΔE* values ranging from 4.8 to 14.8 for TP and from 7.1 to 20.2 for PB (Table 4), corresponding to low (3%) and high (12%) levels of incorporation, respectively. ΔE* values exceeding 3 suggest that the color difference is noticeable, even to an untrained observer [37].
The L* values of the bread fortified with PB significantly decreased (from 61 to 49.6) as the proportion of PB increased. However, for the bread fortified with TP, the changes were not statistically significant (p ≥ 0.05) until the inclusion level of TP reached 12%, where a significant (p ≤ 0.05) decrease was observed. The observed darkening of the bread color was confirmed by the significant decrease in the WI for both TP- and PB-fortified bread. In the study conducted by Majzoobi et al. [38], a significant decrease in bread color was observed with the addition of tomato waste, even at low levels. This could be attributed to the use of higher drying temperatures (60 °C) for the by-products, resulting in the raw material having a darker color. The negative correlation between L* and the increasing proportions of TP and PB aligns with a previous study by Teterycz and Sobota [9], who examined the impact of adding various proportions of TP and PB to pasta. Tomato waste and pepper placenta are rich sources of carotenoids, specifically capsanthin in peppers [39] and lycopene in tomatoes [40]. These carotenoids are responsible for both the darker color and increased redness observed in the product [9,38]. The values of parameters a* and b* significantly increased (p ≤ 0.05) with an increasing percentage of both TP and PB. This suggests that the addition of TP and PB increased the red and yellow components within the bread samples. The changes in the YI also clearly indicate a shift in color towards yellow. The changes were more prominent in the case of PB, as shown in Table 3.

3.4. Texture Profile Analysis (TPA) of Bread

The results of the bread crumb texture analysis, including four crucial parameters (hardness, springiness, cohesiveness, and chewiness), are presented in Table 5. Hardness, which measures the force required to deform the product, is commonly used in the analysis of bakery products and serves as an indicator of staling [33,38]. The hardness of the fresh bread crumb, measured 24 h after baking, ranged from 4.8 N to 7.5 N and varied depending on the amount of supplementation and recipe variation. Increasing the dosage of both by-products, TP and PB, in the bread formulations resulted in higher values of hardness. Generally, the crumb hardness of the breads containing PB was lower than that of the samples with TP. However, statistically significant (p ≤ 0.05) changes were observed only in the samples supplemented with 12% tomato waste (TP). Therefore, it can be concluded that the addition of pepper placenta (PB) up to 12% and TP up to 9% did not have a significant (p ≥ 0.05) impact on the hardness of the bread crumbs after 24 h. In contrast, a significant reduction (p ≤ 0.05) in springiness, which measures the degree of shape recovery after deformation, was observed even with the addition of 3% PB or TP. However, no statistical differences were observed between the breads supplemented with vegetable by-products, regardless of the proportion used. The addition of TP to the bread recipe slightly increased the chewiness of the product, which refers to the strength required to chew a piece of food. However, significant changes (p ≤ 0.05) in this parameter were only observed in the samples containing 12% TP. On the other hand, the addition of PB did not have a significant effect on the chewiness of the bread. The statistical analysis did not identify any significant changes in the cohesiveness of the bread crumbs based on the type of supplementation and the interactions between the variables (supplementation type and amount).
Previous studies [7,34,35,38] have reported on the transformative effects adding tomato (seeds and residue) and paprika powder has on crumb texture parameters. Sogi et al. [34] observed that an increase in the addition of tomato seed pomace resulted in a significant increase in wheat bread firmness. Mironeasa et al. [35] found that supplementation with powdered tomato seeds increased the hardness and chewiness of wheat bread crumbs while negatively affecting its cohesiveness. Interestingly, Majzoobi et al. [38], who used whole tomato powder for bread fortification, demonstrated that the hardness of enriched bread crumbs was lower than in their control sample, especially at higher levels of tomato powder supplementation. Choi et al. [7], in their analysis of wheat bread fortified with whole pepper powder, showed that hardness, springiness, cohesiveness, and chewiness increased with the addition of paprika powder.
During storage (72 h versus 24 h), there was an increase in the hardness and chewiness of the bread crumbs, while the cohesiveness values decreased in all recipe variants. In terms of springiness, the changes were minimal. In both the TP-fortified bread and the PB-fortified bread, the largest changes observed pertained to hardness, with slightly greater changes being observed in the bread fortified with TP. However, the values of this parameter significantly differed from the control in the TP-fortified bread (above 9%) and in the bread fortified with PB only in samples supplemented with 12% of these ingredients. The changes in the textural properties observed while the bread was stored were generally consistent with the results reported by other researchers. Choi et al. [7] analyzed bread fortified with whole pepper powder and found that the hardness and chewiness of the bread crumb increased with storage time, while the springiness and cohesiveness values decreased. Similarly, Majzoobi et al. [38] reported an increase in hardness during storage for bread fortified with tomato pomace. However, our study did not indicate a significant effect of adding TP or PB on reducing the rate of bread staling during storage, as concluded by assessing bread texture. This is contrary to the findings of Majzoobi et al. [38], which demonstrated the potential for delaying the staling process of flatbread (Barbari bread) by adding tomato pomace.

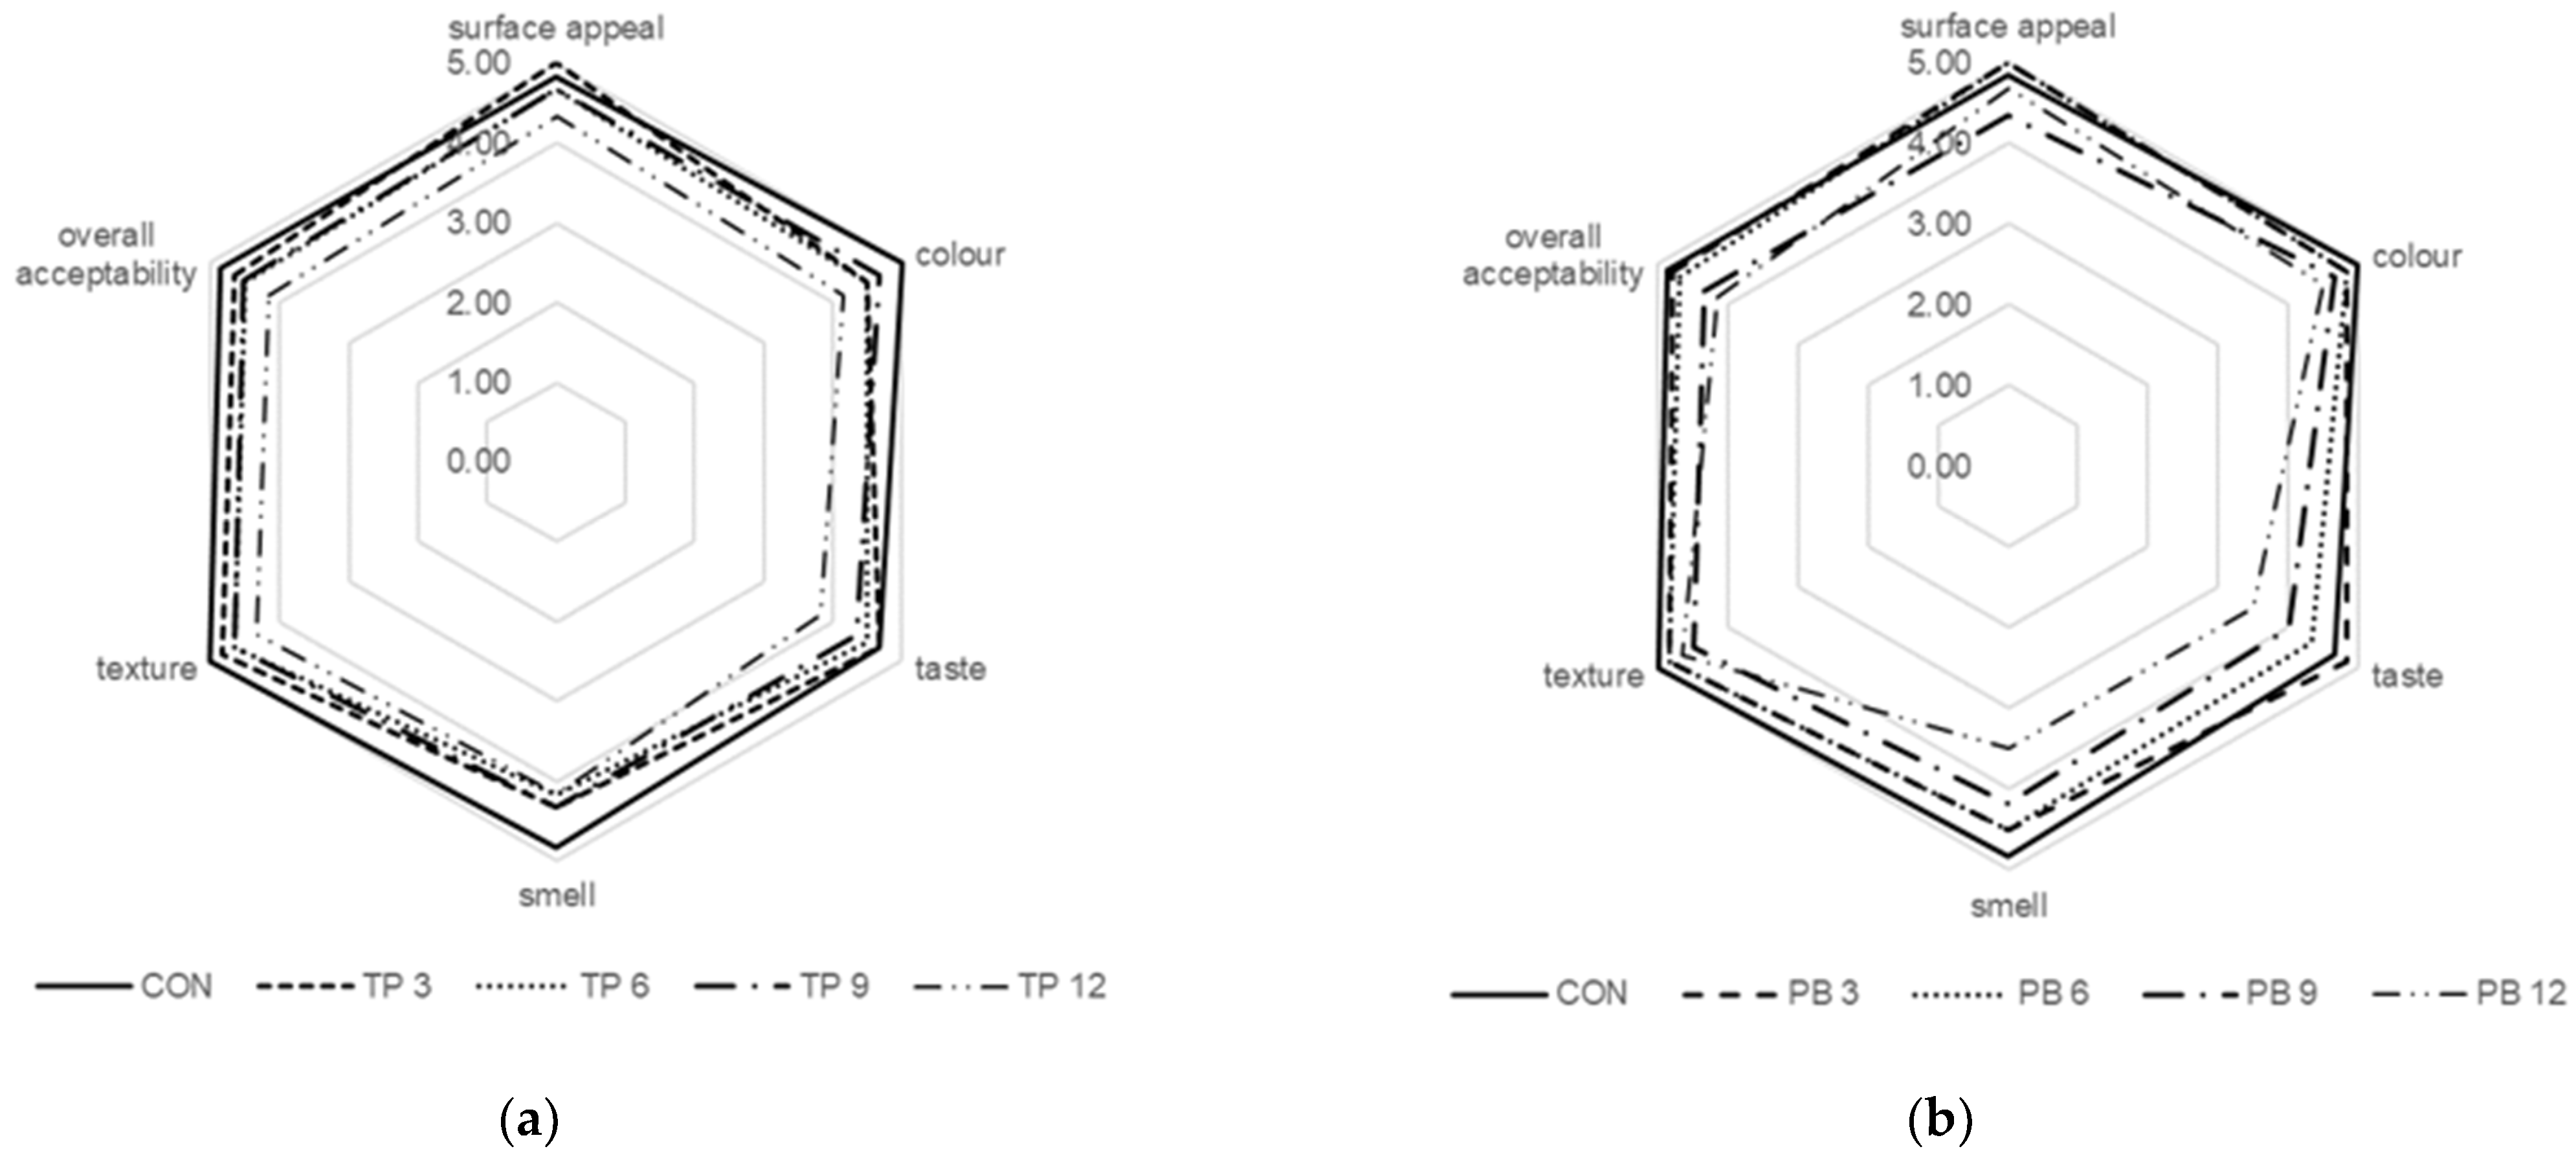
3.5. Consumer Sensory Evaluation of Bread

Sensory acceptance and consumer preference are crucial factors in determining the success of a new product or formula. Therefore, alongside assessing other quality features of the bread, a sensory evaluation was conducted to determine consumer acceptance and identify any inadequate sensory attributes (Figure 2a,b). Moreover, the surface and cross-sections of the bread samples are illustrated in Figure 2, providing a visual representation of the bread’s appearance. The results of the sensory evaluation, as depicted in Figure 1, revealed that an increase in the addition level of TP or PB from 3 to 12 g/100 g resulted in a decrease in the overall acceptability score for both cases. Specifically, the overall acceptability score decreased from 4.87 to 4.17 with higher levels of TP or PB (Figure 2a,b). These findings are consistent with the observations made by Majzoobi et al. [38] in relation to the use of tomato pomace, which also demonstrated an impact on taste. In the case of PB, taste and smell were the sensory attributes that were found to be inadequate. These findings highlight the importance of sensory attributes in determining consumer acceptability towards bread fortified with TP or PB.
Figure 1. Surface and cross-sections of bread with progressive addition of tomato waste (TP) and pepper placenta (PB) from 3 to 12 g/100 g.
Applsci 13 09312 g001
Figure 2. Sensory characteristics of bread samples at different levels of (a) tomato waste (TP) and (b) pepper placenta (PB) addition.
Applsci 13 09312 g002

3.6. Chemical Composition of Raw Materials and Bread

Table 2 presents the chemical composition of wheat flour, TP, and PB. The results demonstrate that TP and PB have significantly higher amounts of fiber (TDF, SDF, and IDF), protein, fat, and ash content compared to wheat flour. Additionally, it can be observed that TP has nearly twice the amount of total fiber compared to PB (60.9% d.b. and 33.47% d.b., respectively), and this is primarily due to its high insoluble fiber content. Despite having a lower total fiber content, PB is a better source of soluble fiber (17.13% d.b.), as evidenced by the fact that it has a soluble fiber content that is approximately 50% higher than that of TP (11.29% d.b.).
As expected, the partial substitution of wheat flour with TP or PB resulted in a significant increase (p ≤ 0.05) in the protein, lipid, and dietary fiber content (in all fractions), while the carbohydrates content decreased in the fortified bread compared to the control. We found that the addition of 12 g/100 g of TP to the bread formula resulted in a 129% increase in total dietary fiber, a 422% increase in fat, and a 16% increase in minerals, with a 16% reduction in carbohydrate content (compared to control sample). In the case of PB, with the same inclusion level, it increased the TDF content by 53%, fat content by 170%, and ash content by approximately 44% while reducing the carbohydrate content by about 8%. It is worth noting that, despite higher fat and protein contents and a lower carbohydrate content, the bread fortified with TP or PB had an energy value comparable to that of the control sample. Except for the 12% addition of TP, no statistically significant differences (p ≥ 0.05) were observed. The application of both vegetable by-products additives made it possible to improve the chemical composition of the bread while maintaining consumer acceptability. These findings confirm the potential of vegetable by-products such as TP and PB as promising food additives that enhance the nutritional properties of foods, particularly by increasing their dietary fiber content [9].

4. Conclusions

In conclusion, incorporating vegetable processing waste from bell peppers (PB) and tomatoes (TP) into a bread recipe resulted in significant improvements in the nutritional composition of the bread. The fortified bread showed higher protein, lipid, and dietary fiber content, while the carbohydrate content was reduced compared to the control sample. The addition of 12 g/100 g of TP increased the total dietary fiber by 129%, fat by 422%, and minerals by 16%, with a 16% decrease in carbohydrates. Similarly, the addition of PB at the same inclusion level increased the TDF content by 53%, fat content by 170%, and ash content by approximately 44% while reducing carbohydrates by about 8%. Furthermore, the fortified bread exhibited an energy value comparable to that of the control sample, despite the higher fat and protein content and lower carbohydrate content. The sensory attributes and textural properties of the bread were also maintained within acceptable levels. The sensory evaluation revealed that higher levels of TP negatively affected taste, while PB supplementation primarily affected taste and smell. These findings underscore the potential of vegetable by-products, namely TP and PB, as valuable food additives for enhancing the nutritional profile of bread. Incorporating these waste materials into food production not only promotes sustainability but also helps reduce food waste. Furthermore, future research should delve into exploring additional applications and optimizing the utilization of these vegetable processing waste in various food products. It is important to focus on finding the optimal levels of supplementation to improve the sensory characteristics of the fortified bread while preserving the desired nutritional benefits. Such efforts will contribute to expanding the use of vegetable by-products in the food industry and promoting a more sustainable and resource-efficient approach to food production. However, further research should aim to investigate the content of substances that may act as contraindications for consuming fortified bread by individuals with health disorders, including people with food sensitivity, allergies, autoimmune diseases, and a predisposition for inflammatory issues.

Author Contributions

Conceptualization, A.W. and P.Z.; methodology, A.W. and P.Z.; formal analysis, A.W.; investigation, A.W., P.Z., A.N., D.T., A.B.-K. and P.Ł.; resources, P.Z.; data curation, P.Z. and A.W.; writing—original draft preparation, A.W. and P.Z.; writing—review and editing, A.W. and P.Z.; visualization, A.W. and P.Z.; supervision, A.W. All authors have read and agreed to the published version of the manuscript.

Funding

The authors declare that no funds, grants, or other support were received during the preparation of this manuscript.

Institutional Review Board Statement

Not applicable. According to the Bioethics Commission (UP Lublin, Poland), the study did not require the consent of the Commission.

Informed Consent Statement

Informed consent was obtained from all volunteers involved in the sensory study.

Data Availability Statement

The data presented in this study are available on request from the corresponding author.

Conflicts of Interest

The authors declare no conflict of interest.

References

  1. Corrado, S.; Caldeira, C.; Eriksson, M.; Hanssen, O.J.; Hauser, H.E.; van Holsteijn, F.; Liu, G.; Ostergren, K.; Parry, A.; Secondi, L.; et al. Food waste accounting methodologies: Challenges, opportunities, and further advancements. Glob. Food Sec. 2019, 20, 93–100. [Google Scholar] [CrossRef] [PubMed]
  2. Faustino, M.; Veiga, M.; Sousa, P.; Costa, E.M.; Silva, S.; Pintado, M. Agro-Food Byproducts as a New Source of Natural Food Additives. Molecules 2019, 24, 1056. [Google Scholar] [CrossRef]
  3. Ancuța, P.; Sonia, A. Oil press-cakes and meals valorization through circular economy approaches: A review. Appl. Sci. 2020, 10, 7432. [Google Scholar] [CrossRef]
  4. Jimenez-Moreno, N.; Esparza, I.; Bimbela, F.; Gandia, L.M.; Ancin-Azpilicueta, C. Valorization of selected fruit and vegetable wastes as bioactive compounds: Opportunities and challenges. Crit. Rev. Environ. Sci. Technol. 2020, 50, 2061–2108. [Google Scholar] [CrossRef]
  5. Machado, A.; Gerald, M.V.; do Nascimento, R.P.; Moya, A.; Vezza, T.; Diez-Echave, P.; Galvez, J.J.; Cazarin, C.B.B.; Junior, M.R.M. Polyphenols from food by-products: An alternative or complementary therapy to IBD conventional treatments. Food Res. Int. 2021, 140, 110018. [Google Scholar] [CrossRef]
  6. Makowska, A.; Zielińska-Dawidziak, M.; Waszkowiak, K.; Myszka, K. Effect of Flax Cake and Lupine Flour Addition on the Physicochemical, Sensory Properties, and Composition of Wheat Bread. Appl. Sci. 2023, 13, 7840. [Google Scholar] [CrossRef]
  7. Choi, S.N.; Kim, H.J.; Chung, N.Y. Quality characteristics of bread added with paprika powder. Korean J. Food Cook Sci. 2012, 28, 839–846. [Google Scholar] [CrossRef]
  8. Nour, V.; Ionica, M.E.; Trandafir, I. Bread enriched in lycopene and other bioactive compounds by addition of dry tomato waste. J. Food Sci. Technol. 2015, 52, 8260–8267. [Google Scholar] [CrossRef]
  9. Teterycz, D.; Sobota, A. Use of High-Protein and High-Dietary-Fibre Vegetable Processing Waste from Bell Pepper and Tomato for Pasta Fortification. Foods 2023, 12, 2567. [Google Scholar] [CrossRef] [PubMed]
  10. Adeyeye, E.I. The contribution of flesh, placenta and seeds to the nutritional attributes of a variety of Capsicum annum (Bell pepper). Elixir Food Sci. 2014, 68, 22587–22594. [Google Scholar]
  11. Kumar, M.; Chandran, D.; Tomar, M.; Bhuyan, D.J.; Grasso, S.; Sá, A.G.A.; Carciofi, B.A.M.; Radha; Dhumal, S.; Singh, S.; et al. Valorization Potential of Tomato (Solanum lycopersicum L.) Seed: Nutraceutical Quality, Food Properties, Safety Aspects, and Application as a Health-Promoting Ingredient in Foods. Horticulturae 2022, 8, 265. [Google Scholar] [CrossRef]
  12. Kumar, M.; Tomar, M.; Bhuyan, D.J.; Punia, S.; Grasso, S.; Sa, A.G.A.; Mekhemar, M. Tomato (Solanum lycopersicum L.) seed: A review on bioactives and biomedical activities. Biomed. Pharmacother. 2021, 142, 112018. [Google Scholar] [CrossRef]
  13. Gonzalez, M.; Martín-Pedraza, L.; Somoza, M.L.; Blanca-López, N.; Macías, M.L.; Perez, D. Sensitisation patterns to tomato seed. Clin. Transl. Allergy 2015, 5, 120. [Google Scholar] [CrossRef]
  14. Anaya-Esparza, L.M.; Mora, Z.V.-D.L.; Vázquez-Paulino, O.; Ascencio, F.; Villarruel-López, A. Bell Peppers (Capsicum annum L.) Losses and Wastes: Source for Food and Pharmaceutical Applications. Molecules 2021, 26, 5341. [Google Scholar] [CrossRef] [PubMed]
  15. Mollakhalili-Meybodi, N.; Ehrampoush, M.H.; Hajimohammadi, B.; Mosaddeg, M.H. Formulation optimization of functional wheat bread with low glycemic index from technological and nutritional perspective. Food Sci. Nutr. 2023, 11, 284–294. [Google Scholar] [CrossRef]
  16. Almeida, E.L.; Chang, Y.K.; Steel, C.J. Dietary fibre sources in bread: Influence on technological quality. LWT 2013, 50, 545–553. [Google Scholar] [CrossRef]
  17. Wirkijowska, A.; Zarzycki, P.; Sobota, A.; Nawrocka, A.; Blicharz-Kania, A.; Andrejko, D. The possibility of using by-products from the flaxseed industry for functional bread production. LWT 2020, 118, 108860. [Google Scholar] [CrossRef]
  18. Zarzycki, P.; Wirkijowska, A.; Nawrocka, A.; Kozłowicz, K.; Krajewska, M.; Kłosok, K.; Krawęcka, A. Effect of Moldavian dragonhead seed residue on the baking properties of wheat flour and bread quality. LWT 2022, 155, 112967. [Google Scholar] [CrossRef]
  19. Miś, A.; Dziki, D. Extensograph curve profile model used for characterising the impact of dietary fibre on wheat dough. J. Cereal Sci. 2013, 57, 471–479. [Google Scholar] [CrossRef]
  20. Chouaibi, M.; Rezig, L.; Boussaid, A.; Hamdi, S. Insoluble tomato-fiber effect on wheat dough rheology and cookies’ quality. Ital. J. Food Sci. 2019, 31, 1–18. [Google Scholar] [CrossRef]
  21. Zecevic, V.; Boskovic, J.; Knezevic, D.; Micanovic, D.; Milenkovic, S. Influence of cultivar and growing season on quality properties of winter wheat (Triticum aestivum L.). Afr. J. Agric. Res. 2013, 8, 2545–2550. [Google Scholar]
  22. Miś, A.; Nawrocka, A.; Dziki, D. Behaviour of dietary fibre supplements during bread dough development evaluated using novel farinograph curve analysis. Food Bioproc. Technol. 2017, 10, 1031–1041. [Google Scholar] [CrossRef]
  23. Nawrocka, A.; Zarzycki, P.; Kłosok, K.; Welc, R.; Wirkijowska, A.; Teterycz, D. Effect of dietary fibre waste originating from food production on the gluten structure in common wheat dough. Int. Agrophys. 2023, 37, 101–109. [Google Scholar] [CrossRef]
  24. AACC (American Association of Cereal Chemists). AACC Approved Methods of Analysis, 11th ed.; AACC (American Association of Cereal Chemists): St. Paul, MN, USA, 2010. [Google Scholar]
  25. Bot, B.; Sanchez, H.; De la Torre, M.; Osella, C. Mother dough in bread making. J. Food Nutr. Sci. 2014, 2, 24–29. [Google Scholar] [CrossRef]
  26. AOAC (Association of Official Analytical Chemists International). AOAC Official Methods, 20th ed.; AOAC (Association of Official Analytical Chemists International): Rockville, MD, USA, 2016. [Google Scholar]
  27. Dziki, D.; Cacak-Pietrzak, G.; Gawlik-Dziki, U.; Sułek, A.; Kocira, S.; Biernacka, B. Effect of Moldavian dragonhead (Dracocephalum moldavica L.) leaves on the baking properties of wheat flour and quality of bread. CYTA J. Food 2019, 17, 536–543. [Google Scholar] [CrossRef]
  28. Wang, J.; Rosell, C.M.; de Barber, C.B. Effect of the addition of different fibres on wheat dough performance and bread quality. Food Chem. 2002, 79, 221–226. [Google Scholar] [CrossRef]
  29. Liu, J.; Shim, Y.Y.; Timothy, J.T.; Wang, Y.; Reaney, M.J. Flaxseed gum a versatile natural hydrocolloid for food and non-food applications. Trends Food Sci. Technol. 2018, 75, 146–157. [Google Scholar] [CrossRef]
  30. Marpalle, P.; Sonawane, S.K.; Arya, S.S. Effect of flaxseed flour addition on physicochemical and sensory properties of functional bread. LWT 2014, 58, 614–619. [Google Scholar] [CrossRef]
  31. Codina, G.G.; Istrate, A.M.; Gontariu, I.; Mironeasa, S. Rheological properties of wheat–flaxseed composite flours assessed by mixolab and their relation to quality features. Foods 2019, 8, 333. [Google Scholar] [CrossRef]
  32. Kasprzak, M.; Rzedzicki, Z. Application of grasspea wholemeal in the technology of white bread production. Pol. J. Food Nutr. Sci. 2012, 62, 207–213. [Google Scholar] [CrossRef]
  33. Blicharz-Kania, A.; Pecyna, A.; Zdybel, B.; Andrejko, D.; Marczuk, A. Sunflower seed cake as a source of nutrients in gluten-free bread. Sci. Rep. 2023, 13, 10864. [Google Scholar] [CrossRef] [PubMed]
  34. Sogi, D.S.; Sidhu, J.S.; Arora, M.S.; Garg, S.K.; Bawa, A.S. Effect of tomato seed meal supplementation on the dough and bread characteristics of wheat (PBW 343) flour. Int. J. Food Prop. 2002, 5, 563–571. [Google Scholar] [CrossRef]
  35. Mironeasa, S.; Codină, G.G.; Mironeasa, C. Effect of composite flour made from tomato seed and wheat of 650 type of a strong quality for bread making on bread quality and alveograph rheological properties. Int. J. Food Eng. 2018, 4, 22–26. [Google Scholar] [CrossRef]
  36. Lukas, B.F.; Morais, M.G.; Santos, T.D.; Costa, J.A.V. Spirulina for snack enrichment: Nutritional, physical and sensory evaluations. LWT 2018, 90, 270–276. [Google Scholar] [CrossRef]
  37. Pathare, P.B.; Opara, U.L.; Al-Said, F.A.J. Colour measurement and analysis in fresh and processed foods: A review. Food Bioproc. Technol. 2013, 6, 36–60. [Google Scholar] [CrossRef]
  38. Majzoobi, M.; Ghavi, F.S.; Farahnaky, A.; Jamalian, J.; Mesbahi, G. Effect of tomato pomace powder on the physicochemical properties of flat bread (Barbari bread). J. Food Process. Preserv. 2011, 35, 247–256. [Google Scholar] [CrossRef]
  39. Saini, R.K.; Prasad, P.; Lokesh, V.; Shang, X.; Shin, J.; Keum, Y.S.; Lee, J.H. Carotenoids: Dietary sources, extraction, encapsulation, bioavailability, and health benefits-A review of recent advancements. Antioxidants 2022, 11, 795. [Google Scholar] [CrossRef]
  40. Madia, V.N.; De Vita, D.; Ialongo, D.; Tudino, V.; De Leo, A.; Scipione, L.; Di Santo, R.; Costi, R.; Messore, A. Recent advances in recovery of lycopene from tomato waste: A potent antioxidant with endless benefits. Molecules 2021, 26, 4495. [Google Scholar] [CrossRef] [PubMed]
Table 1. Farinograph analysis of wheat dough with progressive addition of tomato waste (TP) and pepper placenta (PB) from 3 to 12 g/100 g.
SampleWA [%]DDT [min]ST [min]DS [FU]FQN
CON57.7 ± 0.5 f2.3 ± 0.3 c12.7 ± 0.3 a28.3 ± 2.1 d108.3 ± 37.2 a
TP359.3 ± 0.5 ed2.7 ± 1.1 c6.1 ± 0.3 cb79.7 ± 15.6 c71.0 ± 3.0 ba
TP660.0 ± 0.5 dc3.3 ± 1.8 bc6.7 ± 2.1 b112.7 ± 14.8 b69.0 ± 10.6 b
TP961.2 ± 0.4 cb4.0 ± 0.4 b5.3 ± 0.3 cb140.7 ± 6.4 b57.3 ± 3.2 b
TP1261.6 ± 0.2 b3.5 ± 0.4 b4.3 ± 0.3 c133.3 ± 8.7 b54.0 ± 5.2 b
PB359.0 ± 0.1 fed6.6 ± 0.3 a6.3 ± 0.7 cb210.3 ± 9.3 a83.3 ± 1.2 ba
PB662.1 ± 0.6 abc5.2 ± 0.3 ba4.9 ± 0.2 cb236.7 ± 11.0 a70.0 ± 3.0 b
PB957.7 ± 0.1 f5.3 ± 0.2 ba4.6 ± 0.2 cb221.7 ± 4.9 a72.0 ± 1.0 ba
PB1258.2 ± 0.7 fe5.3 ± 0.2 ba4.8 ± 0.6 cb232.0 ± 8.7 a66.3 ± 2.5 b
CON—control sample (100% wheat flour); mean value (n = 3) ± SD; means in the same column with different letters (a–f) are significantly different (Tukey test, p ≤ 0.05); WA—water adsorption; DDT—dough development time; ST—Stability time; DS—Dough softening; FQN—Farinograph Quality Number.
Table 2. Chemical composition of raw materials: wheat flour (WF), tomato waste (TP), and pepper placenta (PB), and bread with progressive addition of TP and PB from 3 to 12 g/100 g.
SampleRaw Materials and Bread Compositions [% d.b.]
Moisture
[%]
AshProteinFatTDFIDFSDFCHOEnergy
[kcal/100 g]
Raw materials
WF9.4
± 0.0 b
0.72
± 0.01 c
13.16
± 0.07 c
0.49
± 0.00 c
5.36
± 0.04 c
2.43
± 0.18 c
2.93
± 0.22 c
80.3
± 0.1 a
352.3
± 0.1 a
TP6.5
± 0.0 c
3.81
± 0.06 b
20.53
± 0.20 b
11.53
± 0.42 a
60.9
± 0.27 a
49.61
± 0.38 a
11.29
± 0.11 b
3.2
± 0.1 c
299.9
± 2.7 b
PB11.7
± 0.6 a
13.28
± 0.19 a
28.47
± 0.44 a
3.17
± 0.04 b
33.47
± 0.58 b
16.34
± 0.89 b
17.13
± 0.31 a
21.6
± 0.9 b
261.1
± 0.2 c
Bread
CON43.1
± 0.6 ba
2.48
± 0.05 e
13.35
± 0.03 f
0.27
± 0.07 e
6.77
± 0.36 f
3.14
± 0.26 e
3.64
± 0.62 c
69.5
± 0.4 a
197.9
± 0.9 ab
TP342.0
± 0.2 b
2.53
± 0.06 de
13.72
± 0.03 e
0.64
± 0.03 dc
8.49
± 0.22 e
4.19
± 0.1 ed
4.30
± 0.12 bc
67.0
± 0.3 cba
200.3
± 0.6 a
TP642.7
± 0.7 ba
2.58
± 0.04 de
13.82
± 0.01 ed
0.97
± 0.04 b
10.69
± 0.63 c
5.99
± 0.43 cb
4.70
± 0.2 bac
65.9
± 1.2 dcb
200.0
± 3.3 a
TP941.9
± 0.2 b
2.56
± 0.04 e
14.01
± 0.19 dc
1.33
± 0.08 a
12.42
± 0.41 b
7.28
± 0.49 b
5.14
± 0.08 ba
63.7
± 1.1 d
201.9
± 3 a
TP1243
± 0.3 ba
2.87
± 0.01 c
14.24
± 0.03 cb
1.41
± 0.02 a
15.52
± 0.1 a
10.1
± 0.26 a
5.42
± 0.36 ba
58.7
± 0.0 e
191.2
± 0.0 c
PB343.1
± 0.2 ba
2.84
± 0.01 dc
13.57
± 0.04 ef
0.37
± 0.07 e
8.43
± 0.6 e
3.59
± 0.42 ed
4.84
± 0.18 ba
67.5
± 0.4 ba
196.2
± 0.7 abc
PB643.8
± 0.3 a
2.84
± 0.04 dc
14.01
± 0.0 dc
0.47
± 0.07 ed
9.02
± 0.06 ed
3.76
± 0.22 ed
5.27
± 0.17 ba
66.5
± 0.0 cb
193.4
± 0.3 bc
PB942.4
± 0.1 ba
3.26
± 0.16 b
14.51
± 0.04 b
0.61
± 0.07 dc
9.97
± 0.03 edc
4.56
± 0.4 edc
5.41
± 0.42 ba
64.8
± 0.5 dc
197.4
± 0.7 ab
PB1242.7
± 0.2 ba
3.58
± 0.02 a
14.92
± 0.01 a
0.73
± 0.01 c
10.33
± 0.62 dc
4.78
± 0.54 dc
5.56
± 0.08 a
63.7
± 0.7 d
195.9
± 0.9 abc
CON—control sample (100% wheat flour); CHO—digestible carbohydrates; mean value (n = 3) ± SD; different letters (a–f) within a column indicate statistically significant differences (Tukey test, p ≤ 0.05).
Table 3. The physical properties of bread with progressive addition of tomato waste (TP) and pepper placenta (PB) from 3 to 12 g/100 g.
SampleBread Yield
[%]
Baking Loss
[%]
Specific Volume [cm3 g−1]Crumb Moisture [%]Crumb Porosity [-]
CON138.0 ± 1.3 cb9.5 ± 0.9 ab2.82 ± 0.15 a43.08 ± 0.41 ba8.0 ± 0.0 a
TP3135.7 ± 0.3 c11.0 ± 0.2 a2.85 ± 0.10 a42.08 ± 0.16 dc7.7 ± 0.6 ab
TP6135.4 ± 0.3 c10.9 ± 0.2 a2.29 ± 0.22 b42.70 ± 0.71 bdc8.0 ± 0.6 a
TP9136.1 ± 0.8 c10.6 ± 0.5 a2.74 ± 0.09 a41.89 ± 0.13 d7.3 ± 0.6 ab
TP12137.1 ± 0.5 c10.2 ± 0.3 a2.54 ± 0.01 b43.05 ± 0.25 ba7.3 ± 0.6 ab
PB3140.4 ± 0.5 ab9.3 ± 0.3 ab2.37 ± 0.06 b43.06 ± 0.22 ba7.0 ± 0.0 ab
PB6140.5 ± 0.9 ab9.5 ± 0.6 ab2.78 ± 0.13 a43.81 ± 0.22 a6.7 ± 0.6 ab
PB9140.9 ± 1.3 a9.3 ± 0.9 ab2.69 ± 0.22 a42.43 ± 0.11 bdc6.7 ± 0.6 ab
PB12142.3 ± 1.1 a8.4 ± 0.7 b2.55 ± 0.36 ab42.71 ± 0.11 bc6.3 ± 0.6 b
CON—control sample (100% wheat flour); mean value (n = 3) ± SD; means in the same column with different letters (a–d) are significantly different (Tukey test, p ≤ 0.05).
Table 4. The color coordinates (L*, a*, b*) of bread crumbs with progressive addition of tomato waste (TP) and pepper placenta (PB) from 3 to 12 g/100 g.
SampleL*a*b*∆E*WIYI
CON61.0 ± 2.1 a1.6 ± 0.3 i15.0 ± 0.7 g-58.2 ± 2.1 a35.2 ± 2.4 h
TP362.5 ± 1.6 a2.6 ± 0.2 h19.2 ± 0.5 f4.8 ± 0.7 h57.8 ± 1.4 a43.9 ± 1.5 g
TP660.7 ± 1.4 a4.3 ± 0.2 f22.8 ± 0.8 d8.4 ± 0.4 f54.4 ± 0.9 b53.6 ± 1.3 f
TP961.0 ± 1.1 a5.0 ± 0.5 e24.6 ± 1.2 c10.2 ± 1.2 e53.6 ± 1.2 b57.6 ± 3.1 e
TP1256.0 ± 0.7 c6.9 ± 0.4 c27.8 ± 0.4 b14.8 ± 0.6 c47.5 ± 0.7 c71.1 ± 1.6 c
PB358.5 ± 1.0 b3.7 ± 0.3 g21.2 ± 0.5 e7.1 ± 0.9 g53.2 ± 1.1 b51.9 ± 2.1 f
PB654.3 ± 1.0 dc6.0 ± 0.2 d25.4 ± 0.6 c13.1 ± 0.7 d47.4 ± 0.9 c66.7 ± 1.8 d
PB953.5 ± 0.7 d7.7 ± 0.3 b27.9 ± 0.5 b16.1 ± 0.6 b45.2 ± 0.6 d74.5 ± 1.6 b
PB1249.6 ± 1.4 e9.5 ± 0.4 a29.6 ± 0.9 a20.2 ± 0.8 a40.8 ± 1.1 e85.2 ± 2.6 a
CON—control sample (100% wheat flour); ∆E*—the total color difference; WI—whiteness index; YI—yellowness index. Data are presented as mean (n = 15) ± standard deviation; means in the same column with different letters (a–i) are significantly different (Tukey test, p ≤ 0.05).
Table 5. Texture profile analysis of the bread samples with the progressive addition of tomato waste (TP) and pepper placenta (PB) from 3 to 12 g/100 g after 24 and 72 h of storage.
SampleHardness
[N]
Cohesiveness
[-]
Chewiness
[N]
Springiness
[-]
24 h72 h24 h72 h24 h72 h24 h72 h
CON4.8
± 0.4 bB
9.83
± 1.69 eA
0.62
± 0.02 baA
0.4
± 0.03 bB
2.8
± 0.1 bB
3.5
± 0.6 dA
0.96
± 0.03 aA
0.88
± 0.06 aB
TP35.0
± 1.2 bB
12.8
± 1.46 dcbA
0.61
± 0.01 baA
0.4
± 0.01 bB
2.7
± 0.6 bB
4.5
± 0.7 cbaA
0.89
± 0.04 bA
0.86
± 0.04 aA
TP66.0
± 1.0 baB
12.92
± 1.63 dcbeA
0.61
± 0.01 baA
0.38
± 0.02 bcB
3.2
± 0.5 baA
3.9
± 0.5 dcbA
0.87
± 0.03 bA
0.81
± 0.02 abB
TP96.2
± 1.3 baB
13.4
± 1.37 cbA
0.6
± 0.03 baA
0.36
± 0.01 cdB
3.3
± 0.8 baA
3.9
± 0.4 dcbA
0.89
± 0.05 bA
0.81
± 0.05 abA
TP127.5
± 0.9 aB
19.69
± 2.46 aA
0.59
± 0.02 bA
0.34
± 0.02 dB
3.9
± 0.4 aB
5.2
± 0.5 aA
0.88
± 0.04 bA
0.77
± 0.04 bB
PB34.8
± 0.6 bB
10.2
± 1.25 deA
0.63
± 0.04 aA
0.44
± 0.02 aB
2.7
± 0.3 bB
3.7
± 0.4 dcA
0.87
± 0.04 bA
0.83
± 0.04 abA
PB65.0
± 1.0 bB
10.77
± 0.84 dceA
0.62
± 0.03 baA
0.38
± 0.01 bcB
2.7
± 0.5 bB
3.4
± 0.2 dA
0.87
± 0.03 bA
0.82
± 0.07 abA
PB95.3
± 0.5 bB
12.12
± 1.88 dcbeA
0.6
± 0.04 baA
0.37
± 0.01 bcdB
2.6
± 0.3 bB
3.6
± 0.4 dcA
0.85
± 0.03 bA
0.81
± 0.06 abA
PB125.5
± 0.6 bB
14.86
± 1.24 bA
0.58
± 0.02 bA
0.37
± 0.03 bcdB
2.7
± 0.3 bB
4.8
± 0.9 baA
0.83
± 0.02 bA
0.82
± 0.06 abA
CON—control sample (100% wheat flour); mean value (n = 7) ± SD; different lowercase letters (a–e) within a column and different uppercase letters (A,B) within a row indicate statistically significant differences (Tukey test, p ≤ 0.05).
Disclaimer/Publisher’s Note: The statements, opinions and data contained in all publications are solely those of the individual author(s) and contributor(s) and not of MDPI and/or the editor(s). MDPI and/or the editor(s) disclaim responsibility for any injury to people or property resulting from any ideas, methods, instructions or products referred to in the content.

