Article

A Wide-Area Measurement System-Based Load Encroachment Identification Method Applicable to Power Systems with High Wind Power Penetration

Key Laboratory of Power System Intelligent Dispatch and Control of Ministry of Education, Shandong University, Jinan 250061, China
*
Author to whom correspondence should be addressed.
Appl. Sci. 2023, 13(16), 9279; https://doi.org/10.3390/app13169279
Submission received: 20 July 2023 / Revised: 8 August 2023 / Accepted: 13 August 2023 / Published: 15 August 2023

Abstract

:
One of the main factors in triggering cascading outages is the unexpected tripping of backup protection caused by load encroachment (LE). Hence, LE should be identified quickly to avoid unexpected tripping. This paper proposes a fast LE identification method based on the wide-area measurement system (WAMS), applicable to transmission grids with high wind power penetration. Firstly, based on the improved shortest path algorithm, the method searches for critical lines greatly affected by the LE to determine the collected range of wide-area information. Then, by analyzing the hidden dangers of the existing calculation method for the active power estimation value (APEV) in the power system with wind farms, a fast calculation method of the APEV based on the WAMS is proposed to ensure that the existing LE identification criterion is still applicable in the high-penetration system of wind power. Finally, based on the PSASP platform, the wind farm model is integrated into the IEEE 39-bus New England system for simulation. The simulation results show that the method proposed in this paper can quickly search for the critical line set (CLS) and accurately identify the LE under high wind power penetration, effectively avoiding the unexpected tripping of backup protection and preventing cascading outages.

1. Introduction

In recent decades, many cascading outages on transmission grids have occurred worldwide, causing huge disasters to society [1,2,3]. Numerous studies have shown that one of the main factors in triggering cascading outages is the unexpected tripping of backup protection caused by load encroachment (LE), which tends to occur when the power system operates under heavy load and is accompanied by faults. Removing the faulty line will result in a grid-wide redistribution of active power, which may cause overloads in other branches of the transmission grid, called LE [4]. Since the conventional backup protection only acts according to the setting and configuration requirements based on local information, it does not consider the impact of fault removal on the overall grid and cannot distinguish whether the line overload is caused by the fault within the protection range or the LE after the faulty line outside the protection range is removed, so it is easy to cause the unexpected action of backup protection, triggering cascading trips and ultimately causing cascading outages. Therefore, the key to preventing cascading outages is to identify the LE reliably, thus achieving the safe and reliable operation of the whole power grid. The three key problems to be solved are: (1) considering the economy and practical feasibility, explore how to reduce the analysis range of branches that are greatly affected by LE; (2) explore a new method for fast real-time calculation of the active power estimation value (APEV) of each branch after active power redistribution; (3) quickly identify the LE overload and reliably block the backup protection, laying the foundation for the subsequent load-shedding measures.
The WAMS can track the dynamic of the power grid and obtain the dynamic data of the whole grid in real-time [4,5,6]. In recent years, many experts have proposed a variety of LE identification methods based on wide-area information, accurately distinguishing the short-circuit fault of the transmission line within the protection range or the LE caused by the removal of the faulty line outside the protection range and effectively prevent the cascading trip accident caused by the unexpected action of the conventional backup protection. The authors of reference [7] use the fault chain theory to simulate the process of successive line outages that occur step by step and lead to LE. The authors of reference [8] propose an intelligent distance relay sensing methodology for the differentiation of LE from fault conditions by analyzing the apparent impedance behavior during a fault and LE. However, the method requires high investment and running costs, can be analyzed to a limited extent, and is difficult to apply in the field. In reference [9], the authors identify faults and LE based on real-time measured voltage and current information. In reference [10], LE and faults are distinguished by calculating the ratio of changes in the phase angle and the voltage magnitude of selected buses, thus supplementing backup protection. The authors of reference [11] perform a decomposition of the momentary power to extract the most valid intrinsic mode function and then identified LE and fault by estimating the energy of this mode and comparing it to an adaptive statistical threshold, but the method relies on the accuracy of the statistical threshold. Based on the fault component complex power, the short-circuit fault and LE are distinguished to avoid cascading trips in reference [12]. The authors of reference [13] define the reliability index as the energy of the critical baseline component with the highest peak value and then identify LE and fault based on the energy index. To prevent backup protection tripping due to LE, the authors of reference [14] propose a corrective scheme based on model predictive control, which sequentially reschedules the loads and the generation, thus avoiding undesired actions of the backup protection.
The above research is based on the conventional power grid. With the construction of new-type power systems, the research on backup protection for power systems with high penetration of renewable energy sources is an important topic in the future. The power system under a high proportion of renewable energy sources will cause huge active power fluctuations when an N − 1 fault occurs [15]. Wind power output’s randomness and volatility in renewable energy sources are the largest, and the higher the penetration level of wind generation, the greater the power fluctuation of the power grid [16,17,18]. The authors of reference [19] summarize the challenges brought by integrating renewable energy into the smart power grid and point out that few studies on backup protection can identify the LE for the power system with wind farms. The authors of reference [20] note that the high penetration of renewable energy sources leads to various stability problems in the power system, which are interconnected, and the effects of the local faults can spread to the entire grid, posing a great threat to the security and stability of the power system. In reference [21], comprehensive indices are proposed to analyze the effect of renewable energy integration on power systems based on graph theory. The authors note that power systems are more prone to cascade tripping when uncertainty levels exceed a certain range. However, these methods do not have the performance to identify the cause of branch overloading. In reference [22], the influence of wind power output on backup protection is considered for the first time, and a voltage and angle criterion based on wide-area information is proposed to identify short-circuit fault and LE, but it depends on the performance of two designed discriminant subroutines. Apart from this, no other article has been seen that considers the impact of renewable energy in identifying LE and faults.
It can be concluded that there are very few articles that consider the impact of new energy sources on the method of distinguishing LE from faults. Therefore, there is a need to upgrade the existing methods for identifying the causes of branch circuit overloads while considering the integration of large wind farms into power systems. The development of a unique method for identifying the cause of branch overloads is the main motivation of this paper, and the goal of this work is to clearly distinguish between LE and fault in power systems with a high penetration of wind power, providing technical support to improve the reliability of backup protection for transmission grids with high wind power penetration.
In view of the above problems, this paper proposes a method for searching the critical line set (CLS) based on the improved shortest path algorithm; then, standing on the conventional LE identification criterion based on the active power change value (APCV), it proposes a fast LE identification method based on a WAMS for high wind power penetration scenarios, laying a technical foundation for avoiding the unexpected action of backup protection and subsequent load-shedding actions. The main contributions of this paper are as follows:
  • In order to determine the range of wide-area information that needs to be collected, a method of searching the CLS based on an improved shortest-path algorithm is proposed. This method can quickly search for dangerous lines greatly affected by LE after the faulty line is removed, laying the foundation for the subsequent load-shedding, significantly reducing the range of the analysis, and preparing for the rapid elimination of branch overloads.
  • The hidden dangers of the conventional calculation method of the APEV in the scenario with wind farms are analyzed. Then, a calculation method for the APEV considering the fluctuation of wind power output is proposed to estimate the active power of the remaining branches after the faulty branch is removed. This method improves the accuracy of the calculation results of the APEV under different penetrations of wind generation, thus ensuring that the existing LE identification criteria are still applicable in a power grid with a high wind power penetration rate.
  • The concept of load encroachment eigenvalue (LEE) is given based on the LE identification criterion, which is calculated using the APEV and the active power measured value (APMV) and used to identify the LE quickly. It can prevent the backup protection from unexpected action in time and reliably block the tripping signals, thus gaining time for the action of the subsequent automatic safety devices and avoiding cascading outages.
The remainder of this paper is organized as follows: Section 2 proposes a search method for CLSs. Section 3 proposes an LE identification method considering the fluctuation of wind power output. In Section 4, taking the IEEE 39-bus New England system as an example, the simulation is carried out using PSASP. Finally, the paper is concluded in Section 5.

2. Critical Line Set and Its Search Method

In order to determine the effect of removing branches on the lines of the whole network, the power distribution of the whole network needs to be recalculated, which is complicated and time-consuming. If it is possible to identify the set of lines that are more affected by LE and analyze only the extent of the impact on the branches within the set, it will be possible to shorten the analysis time, take emergency control measures as soon as possible, and effectively avoid cascade tripping caused by mechanically removing overloaded lines. This section proposes a method to quickly search for branches more affected by LE to determine the range of wide-area information that needs to be collected.

2.1. The Definition and Graph Theory Characteristics of the CLS

Rapid judgment of the impact of branch removal on the whole network is of great significance in suppressing the development and spread of grid accidents. Before searching the CLS of the removed branch, it is necessary to find out its characteristics.
Under unfavorable operating conditions, a wide range of LE in the power system is likely to happen after removing the faulty branch, which may lead to cascading tripping accidents. The possible operating states of cascading trips caused by LE are as follows:
  • The overall load of the system is large, and some branches in the system are in a heavy load state. Once the faulty line is removed, LE will likely cause branch overload.
  • One line in the system is out of power for maintenance, and the other line is removed by the main protection due to a short-circuit fault, resulting in LE, and the remaining branch is prone to overload.
The set of dangerous lines greatly affected by the LE is called the CLS. The definition of the CLS is given according to the load encroachment-related proportional factor (LERPF): the set of all branches satisfying Equation (1) after the faulty line is removed is called the CLS of the removed branch.
d > d 0
where d is the LERPF of the remaining branches to the faulty branch after it is removed; its value is related to the power grid’s topological structure and branch parameters. The definition of its concept and the derivation of its mathematical expression will be discussed in Section 3 of this paper. The value of d can reflect the active power change value of the remaining branches in the network caused by the LE after the faulty branch is removed. The larger the value of d, the larger the branch is affected by the LE, and vice versa, the smaller the value of d, the smaller the branch is affected by the LE. d0 is a fixed value; the larger the value of d0, the fewer the number of branches included in the CLS of the removed branch and the higher the search speed of the CLS can be improved, but there is a possibility that some of the branches affected by the LE are missed; the smaller the value of d0, the more branches affected by the LE can be included, but it will increase the collection range of the wide-area information and reduce the speed. Therefore, the value of d0 should not be too small or too large; many scholars have studied this area and finally concluded that, according to the actual operational requirements, the value of d0 in the range of 0.2–0.3 is the best [23].
In fact, the effect of the removed branch on the power flow of the whole network decreases gradually outwards, centered on the removed branch. Thus, in the early stages of incident development, the overloaded branch tends to be electrically close to the resected branch. According to the circuit principle, the graph theory characteristics of the CLS are summarized as follows:
  • The branches in the CLS can form a loop with the removed branches.
  • The smaller the loop reactance value is, the greater the influence of LE is. When the loop reactance value is larger, the influence of LE can be ignored.
The fast search method for the CLS proposed in this paper consists of two modules: (1) grid abstraction and dimensionality reduction; (2) path search to determine the CLS. The overall steps for searching for the CLS are shown in Figure 1.
All the branches within the CLS make up the area highly affected by LE, and if this area can be quickly identified, the analysis can be narrowed down and time saved. Therefore, if backup protection activation exists after a line is removed, the CLS of that removed line is quickly searched to determine the scope of the analysis, and the wide-area information within that scope is used for the identification of the cause of branch overloading.

2.2. The Establishment and Dimension Reduction of the Graph Model

According to the characteristics of the CLS mentioned above, before searching for the CLS of the resected branch, it is necessary to transform the power system into a graph model and then perform a dimensionality reduction process on it so as to realize CLS searching in a smaller area, which greatly reduces the burden of further analyses and calculations and narrows down the target range, thus improving the searching speed.
According to the graph theory, the power system can be abstracted into a graph model, represented by T, and T = (V, E), where
  • V = {v1, v2, …, vm}, and V represents the set of grid nodes; vi represents the node abstracted from the generator or bus of the power grid;
  • E = {e1, e2, …, em}, and E represents the edge set of the grid; ei represents the edge abstracted from the transmission line or power transformer. If ei has a direction, then T is a directed graph; otherwise, T is an undirected graph. If ei has weight, then T is a weighted graph; otherwise, it is an unweighted graph. In the weighted graph, the weight of ei is represented by wij. In this paper, the branch reactance is used to represent the branch weight, which is also called branch length.
Suppose T has n nodes. If vi and vj are directly connected by ei, then vi and vj are called adjacent nodes. If vi and vj are connected by a finite number of edges, then all branches from vi to vj form a path, denoted by Pl, and the length of the path is the sum of the weights of all branches on the path, denoted by:
Z ( P l ) = e i P l w i j
The topological relations of a graph are commonly represented by an adjacency matrix, denoted as A, and A is an Nth-order square matrix. The search method for the CLS proposed in this paper is based on undirected graphs. The elements in the adjacency matrix of the undirected graph are denoted by Aij, as shown in Equation (3).
A i j = { 0 i = j w i j i j ( v i , v j ) E
Reducing the dimension of the graph model is based on the hanging nodes and breakpoints. The definition of hanging nodes and breakpoints is as follows:
  • Hanging nodes
According to whether it can form a loop with other lines in the graph, the edges are distinguished. The edges that cannot form a loop with other edges are defined as hanging edges, and the nodes only connected to the hanging edges are defined as hanging nodes.
The number of branches associated with the node is defined as the node‘s branch correlation degree (BCD). The BCD of the node in an undirected graph is equal to the number of non-zero elements in the row/column where the node is located in A.
According to the above definition of hanging nodes and BCD, hanging nodes include:
  • (1)
    Nodes whose BCD is one.
    (2)
    After deleting all nodes in the graph whose BCD is one, the nodes whose BCD becomes one in all remaining nodes.
The BCD of each node in the graph and its neighboring nodes can be quickly obtained by searching A, thus quickly obtaining the hanging nodes.
2.
Breakpoints
Suppose T is a connected graph and va is a node in T. If T becomes a non-connected graph after va is removed (removing a node requires removing all the edges associated with it together), then va is called a breakpoint. If T contains breakpoints, then T is called a divisible graph. The breakpoints of the graph can be searched using the Tarjan algorithm based on the depth-first algorithm.
It follows from the graph theory characteristics of the CLS that if there is a breakpoint in a graph, the branch in the CLS and the removal branch should be located in the same subgraph. Therefore, before searching for the CLS, the graph is first divided into multiple subgraphs according to the breakpoints, and then the hanging nodes in each subgraph and the lines connected to them are removed. Finally, multiple LE regions can be obtained, which reduces the dimension of the graph model of the power grid, significantly reducing the target range and the burden of further analysis, thus increasing the search speed.
As shown in Figure 2, firstly, three subgraphs are obtained according to breakpoints three and seven, then the hanging nodes one, two, and ten in each subgraph are removed, and finally, two LE regions are obtained. After obtaining multiple LE regions, the search of the CLS only needs to be carried out from the LE region where the branch is removed, accelerating the search speed and quickly determining the range of wide-area information that needs to be collected.

2.3. Search Method of CLS Based on Improved Shortest Path Algorithm

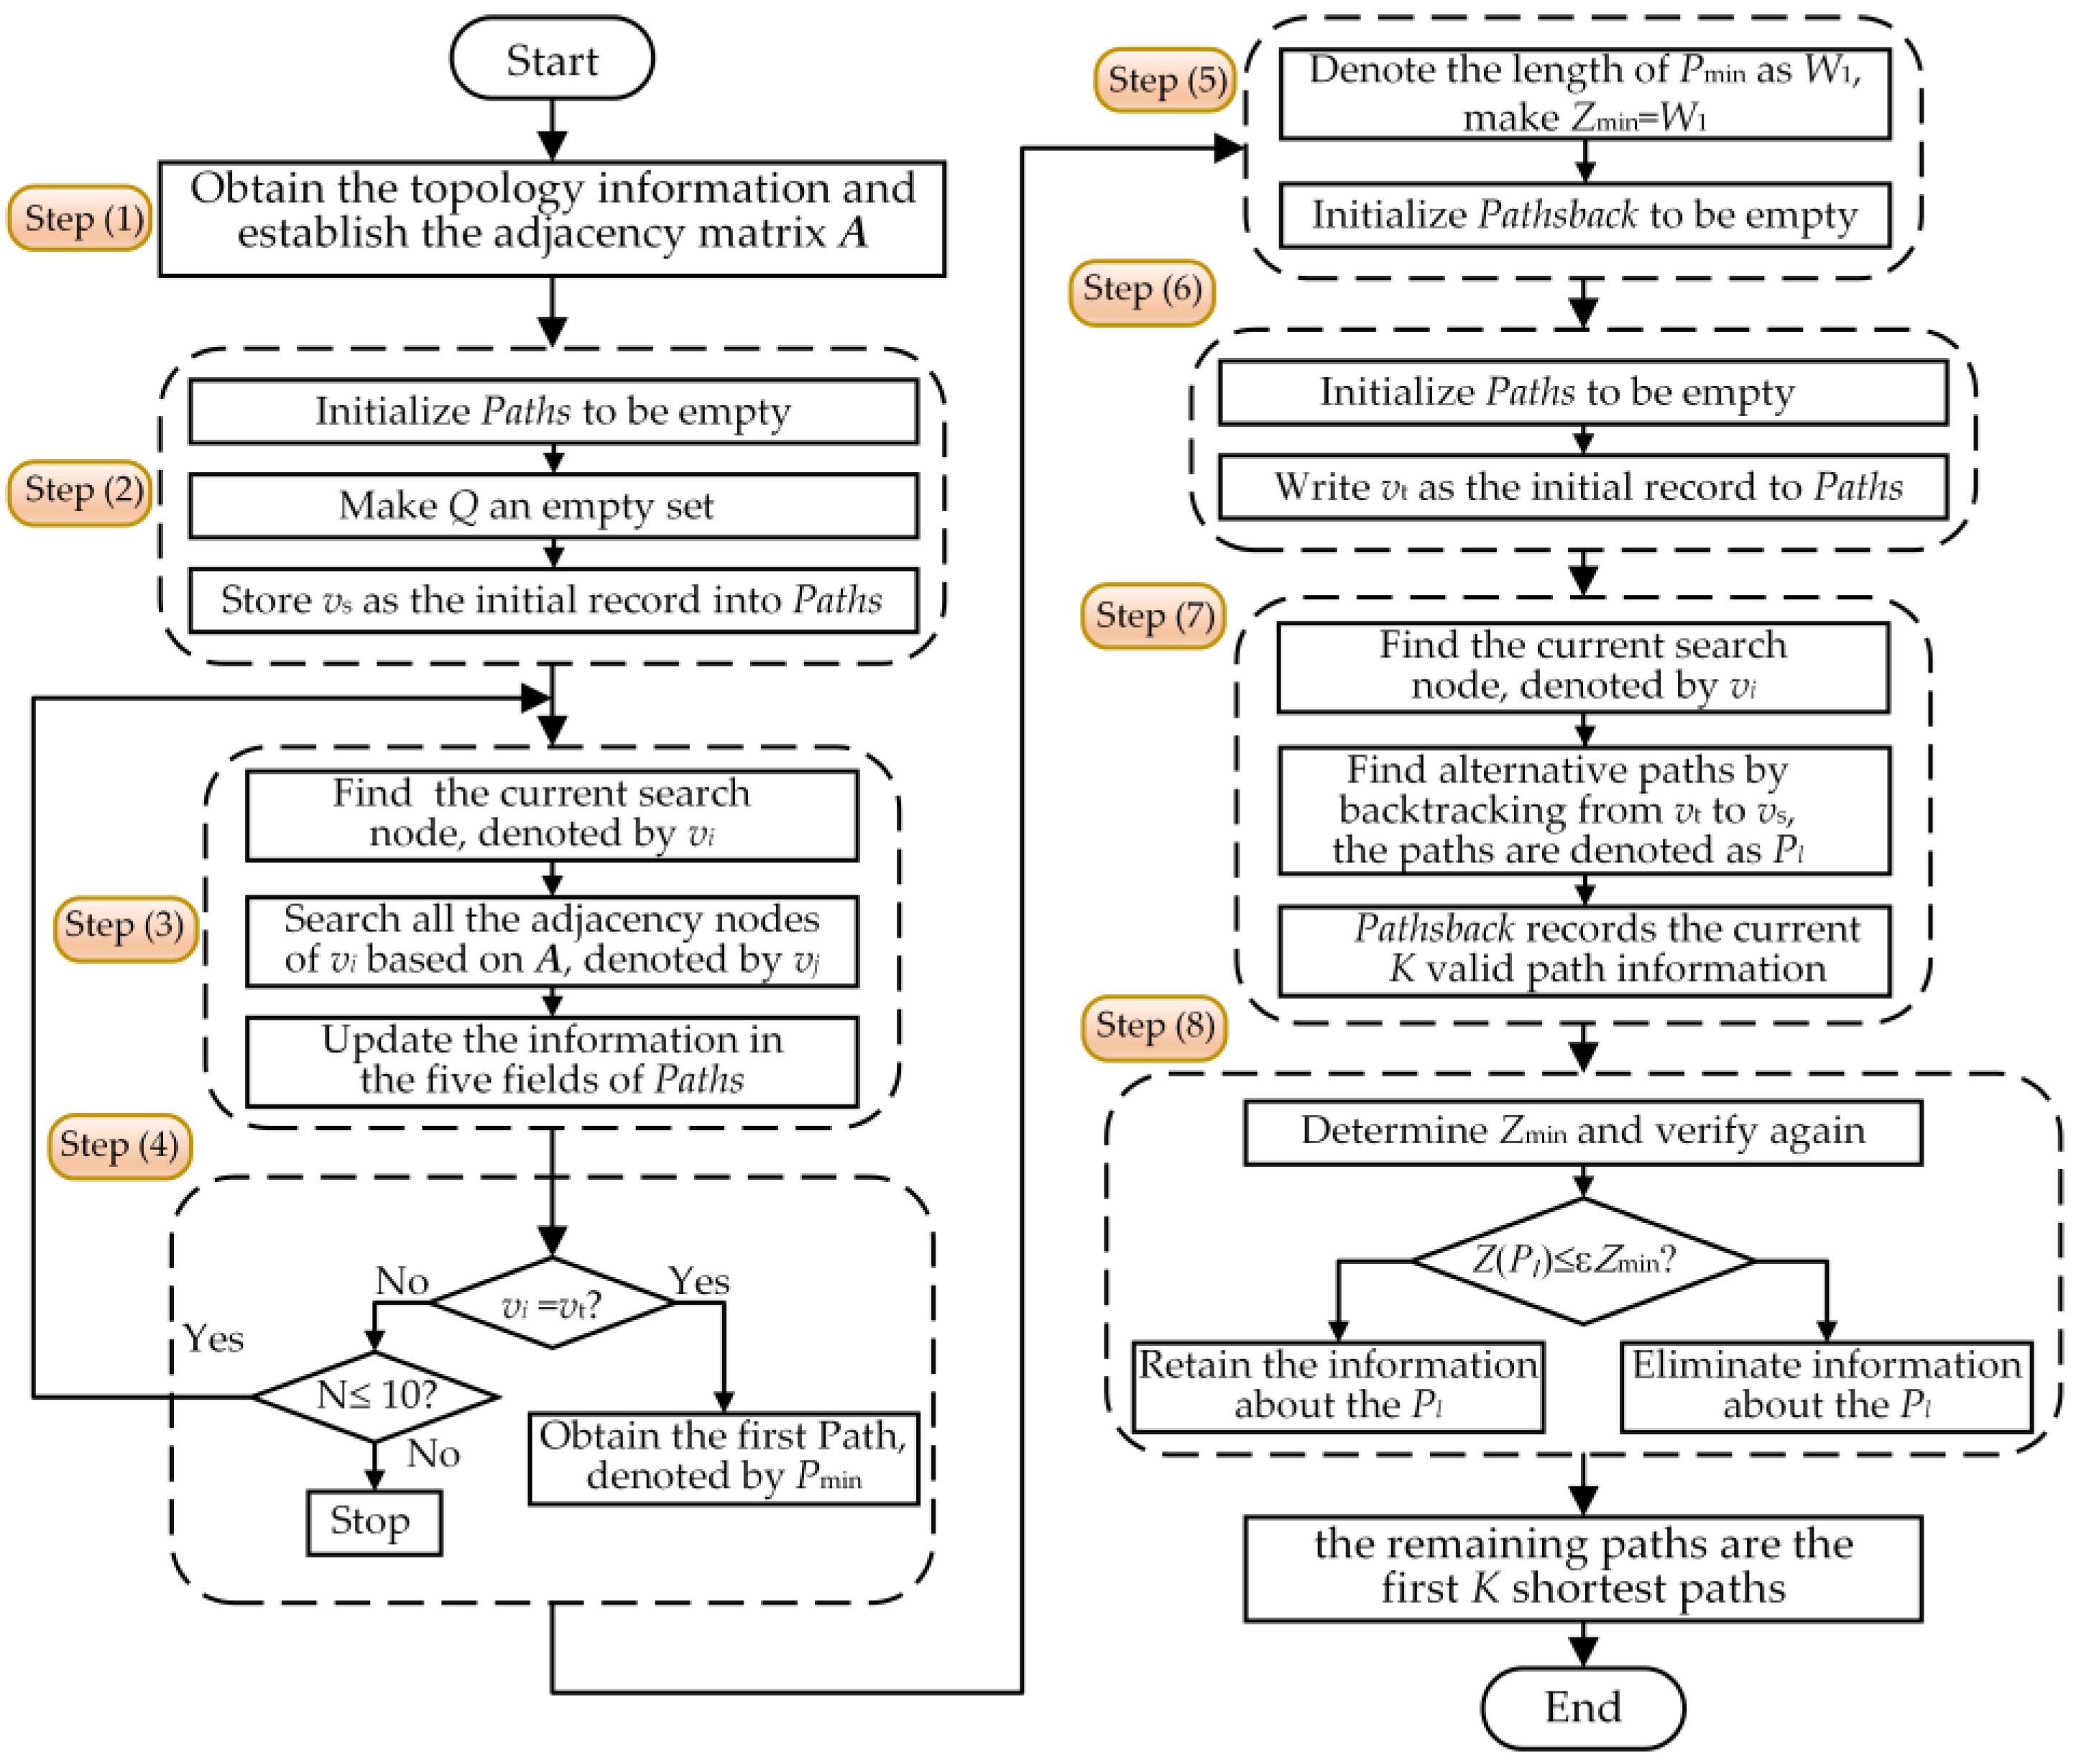
The Dijkstra algorithm is a classical shortest path algorithm for solving the shortest path problem, which can solve the shortest path from one source node to multiple end nodes. In this section, the shortest path algorithm is improved. Differing from the Dijkstra algorithm, which requires repeated traversal, the improved search method ensures the search process’s unidirectionality based on the adjacency matrix, reducing the search process’s complexity. The improved shortest path method is described in detail below.
The improved shortest path algorithm can search the shortest path from the source node to the end and discover all the first K shortest paths that satisfy Equation (4). The K shortest paths include all branches that satisfy Equation (1), and all branches on these paths constitute the CLS. According to the definition of the CLS and its graph theory characteristics, searching the CLS is equivalent to searching the multiple connected paths between the two ends of the removed branch; that is, searching the first K shortest paths that can form the loop with the removed branch. The principle of selecting the value of K in this paper is as shown in Equation (4).
K = max { i | Z i ε Z min }
where Zi is the length of the ith shortest path between two ends; Zmin is the minimum length of all the shortest paths between two ends; ε is the threshold value of the path length ratio. The selection principle of the value of ε is as follows: since the larger the value of d0 is, the smaller the value of ε is, it is approximately considered that ε is inversely proportional to d0. In order to improve the adaptability of the method proposed in this paper to various types of power grids, d0 takes the defined median value of 0.25, so take ε = 1/d0 − 1 = 3; subtracting 1 is an adjustment to the less than equal sign in Equation (4) [20]. This value is taken to ensure that even in the extreme case, that is, the K + 1th shortest path has no intersection with the Kth shortest path, and the APCV due to LE on all branches of the Kth shortest path is less than 1/4 of the active power of the removed branch (because a small part of the power encroaches on the branch outside the CLS). Therefore, the first to the last shortest path contains all branches with d > d0.
The BCD of all nodes in the path is two except for the source and final nodes, whose BCD is one. The nodes in the path with a BCD of two are defined as inner nodes, and their number is denoted by N. A large number of simulations have found that when N exceeds a certain value, it can be considered that this path is invalid due to the corresponding electrical distance being too long. For medium-sized systems, when N > 10, the branch is less affected by LE and can be ignored. The simulation case in this paper can verify. Therefore, the constraint condition of N ≤ 10 is added to the shortest path search. The value of N can be adjusted according to the different sizes of the system; the larger the system size, the larger N, and vice versa, the smaller. Since the search for the shortest path is limited by ε and N simultaneously, the search speed is not affected by the system size.
Denote the lth shortest path from the source node to the end node by Pl, where the source node is denoted by vs, the end node is denoted by vt, and the path length is denoted by Z(Pl). A data table, denoted by Paths, is constructed to store the information of the first K shortest paths during the search process. Paths contains five fields, which are:
(1)
The current search node number, denoted by Num.
(2)
The set of nodes that have been searched, denoted by Q.
(3)
The edge length between two nodes, denoted by wij.
(4)
The number of inner nodes, denoted by N.
(5)
The length of the path, denoted by W.
During the search process, the current search node is determined based on the previous search node, and the current search node is not in the set of nodes that have been searched to ensure the search process‘s unidirectionality, improving the search speed. The improved algorithm consists of the following two parts:
  • Find the shortest path
    (1)
    Obtain the topology information of the power grid, including the number of each node and branch and the reactance of each branch, then establish the adjacency matrix A based on the topology information.
    (2)
    Initialize Paths to be empty; make Q an empty set and store vs as the initial record into Paths; then, the field information of Paths becomes [vs, Null, 0, 0, 0].
    (3)
    Find the last field information recorded by Paths and use its first field information as the current search node, denoted by vi. Then, search all the adjacency nodes of vi based on A. The adjacency nodes are denoted by vj, and vj is not in the Q of vi. After getting vj, update Paths and replace its first field from vi to vj; that is, Num = vj and vi is written into Q, then wij is recorded in the third field, and N++, W = W + w.
    (4)
    If vj = vt, the first path from vs to vt can be obtained according to the record in Q, denoted as P1. Since the path with the least number of nodes is generally the first to be found, it is called the path with the fewest number of nodes here, and P1 will be taken as the shortest path first, denoted as Pmin; if vjvt, then determines whether it satisfies N ≤ 10. If not, then stop searching for the next adjacency node of vj. If it satisfies, then repeat step (3); if all the paths do not satisfy N ≤ 10, then the paths are considered unsolvable.
  • Backtrack to find the K shortest paths. Construct a data table, denoted as Pathsback. Pathsback has the same structure as Paths, and all the paths eventually obtained will be recorded in Pathsback:
    (5)
    Get the length of Pmin found earlier, denoted as W1, make Zmin = W1, and initialize Pathsback to be empty.
    (6)
    Initialize Paths to be empty and write vt as the first field information of the initial record to Paths; then, the field information of Paths becomes [vt, Null, 0, 0, 0].
    (7)
    Find alternative paths by backtracking from vt to vs; the paths are denoted as Pl, and repeat the following steps until no node satisfies the condition.
    • Find out the field information of the last record in Paths, and then find the node recorded in the first field, denoted as vi. If the fourth field of the record satisfies N ≤ 10, search all the adjacent nodes of vi, denoted as vj, and vj is not in the Q of vi. If Z(Pl) > εZmin, the subsequent nodes of vj are no longer searched. If N > 10, the search for adjacent nodes of vi is stopped.
    • If vj = vs, store the information of this node into Paths and record N as infinity when storing; that is, no longer search for this path. Compare the length of this path with the size of Zmin: if Z(Pl) < Zmin, then make Zmin = Z(Pl); if Z(Pl) > εZmin, then Pl is an invalid path; if Z(Pl) ≤ εZmin, then Pl is temporarily considered to be a valid path and the information related to this node is stored in Pathsback. If vjvs, the information of vj is added into Paths, that is, Num = vj, Q = Q vi, w = wij, N++, W = W + w.
    • Repeat step (7). Finally, Pathsback records the current K valid path information.
    (8)
    Find the minimum value of the path length among all the paths recorded by Pathsback, denoted as Zmin. Check again whether the paths satisfy Z(Pl) ≤ εZmin and eliminate the paths that do not satisfy the condition; at this time, the remaining paths all satisfy N ≤ 10 and Z(Pl) ≤ εZmin. These paths are the first K shortest paths, and all the branches on these paths constitute the CLS of the removed branch.
Based on the improved shortest path method for searching for the CLS, the number of the first K shortest paths is limited by the minimum value of the length of all shortest paths. Therefore, when the shortest paths are determined, the number of the first K paths that can satisfy the restriction is very small. Due to the large number of circuits in the transmission grid, many loops include a small number of branches and nodes. When the number of nodes exceeds a certain value, it can be assumed that this loop is invalid due to the excessive length of the corresponding electrical distance. Therefore the method in this paper is not affected by the number of nodes in the grid.
In this section, we fully use the information of the adjacent nodes of the first K-1 paths obtained to discover the Kth shortest path and finally obtain the CLS based on the first K shortest paths that have been searched to satisfy the conditions. The steps of the improved algorithm are shown in Figure 3. Therefore, when the WAMS monitors the power grid topology changes in real-time, the CLS of the removed branch can be quickly found based on the improved shortest path algorithm, and the acquisition range of wide-area information used to identify LE can be further determined.

3. LE Identification Method Considering the Fluctuation of Wind Power Output

This section proposes the concept of LEE based on the existing LE identification criteria, analyzes the hidden dangers of the conventional calculation method of the APEV in wind power penetration scenarios, and proposes a fast calculation method of the APEV considering the fluctuation of wind power output, which can quickly estimate the active power of the branches in the CLS after the faulty line has been removed and is used for the fast identification of LE. This method ensures the criterion is still applicable under high wind power penetration.

3.1. LE Identification Criterion

LE in a power system usually occurs after the topology of the grid has been changed. When a contact line in the system is removed due to a fault, its active power will be transferred to other normally operating branches in the system, causing an overload on the normal line. If it is possible to quickly estimate the active power transferred by each branch in the CLS of the removed branch after the line is removed, then compare this estimate with the APMV, the cause of the line overload can be determined. If LE occurs, the backup protection should be correctly blocked before the line reaches its thermal stability limit.
The basic idea of identifying LE is as follows: if branch k is overloaded after faulty branch l is removed, the active power of the branch k after the faulty branch l is removed is estimated according to the active power distribution of the power grid before the faulty branch l is removed, and the APEV of the branch k is compared with the APMV of the branch k after the branch l is removed. If the two are basically the same, it shows that the overload of branch k is caused by the LE. The LE identification criterion based on active power is shown in Equation (5).
| P k t P k | < ε P k
where P k t is the APMV of the line k uploaded by WAMS after the power grid topology changes; P k is the APEV after active power redistribution; ε is the threshold value considering the transient transition process and various errors of the power grid. The factors affecting the value of ε are as follows:
  • The maximum error caused by the change in the amplitude of the bus voltage at the protection installation.
  • The maximum error caused by the transient oscillation process of the power grid.
  • The influence of branch capacitance current.
  • The margin required to ensure the reliability of the criterion.
Based on the above four factors, ε can take 30% [24].
Equation (5) is called the steady state criterion and is applicable when the system’s operating state does not change much after the faulty branch is removed.
Define | ( P k t P k ) / P k | as the LEE. If | ( P k t P k ) / P k | < ε , it shows that the LE identification criterion is satisfied. It is concluded that the branch overload is caused by the LE.
According to the circuit superposition principle, the active power transmitted by each line in the CLS of the faulty line after the faulty line has been removed can be considered to be obtained by superposition of the pre-fault active power and the APCV after the line has been removed. The active power transmitted by each line in the network before the faulty line is removed can be obtained based on the measurement value of WAMS, and the key to identifying the LE is to estimate the active power of each line in the network after component removal based on the real-time measurement value of WAMS. In the following, the traditional calculation method is first introduced and the pitfalls of this method in high wind power penetration power systems are analyzed, based on which a calculation method for the APEV applicable to high wind power penetration power systems is proposed.

3.2. The Conventional Calculation Method of APEV

In a conventional power grid without wind farms, it is considered that the output of the generator remains unchanged before and after the faulty branch is removed. The APEV of each branch within the CLS can be quickly obtained based on the LERPF, and the cause of the branch overload can be judged by applying the APEV to the LE identification criteria described in Section 3.1.

3.2.1. LERPF

The LE caused by the branch removal belongs to the static security analysis research scope [25,26]. In order to calculate the impact of a branch removal on the other branches in the system, various power-flow calculation methods can be used, such as Newton iterative algorithms. However, these methods are computationally intensive, time-consuming, and have convergence problems, making it difficult to meet the requirements of online real-time control. In order to reflect the influence degree of the removal branch visually and accurately on the active power of the remaining branches, this section introduces the concept of the LERPF and derives its mathematical expression.
  • The definition of LERPF
After a faulty branch is removed from the power grid, the original active power on that branch will be transferred to the remaining branches according to a certain proportion, defined as the LERPF and denoted by d. Considering the directionality of the transmitted active power, the LERPF can be positive or negative, and the larger its absolute value is, the greater the influence on the active power transmitted by the branch. After the faulty line l is removed, the APCV of branch k within the CLS is shown in Equation (6).
Δ P k l = d k l P l 0
where Δ P k l is the APCV of line k after line l is removed; P l 0 is the active power transmitted by branch l before line l is removed; and dkl is the LERPF of line k for line l. The LERPF is derived below.
2.
The mathematical expression for the LERPF
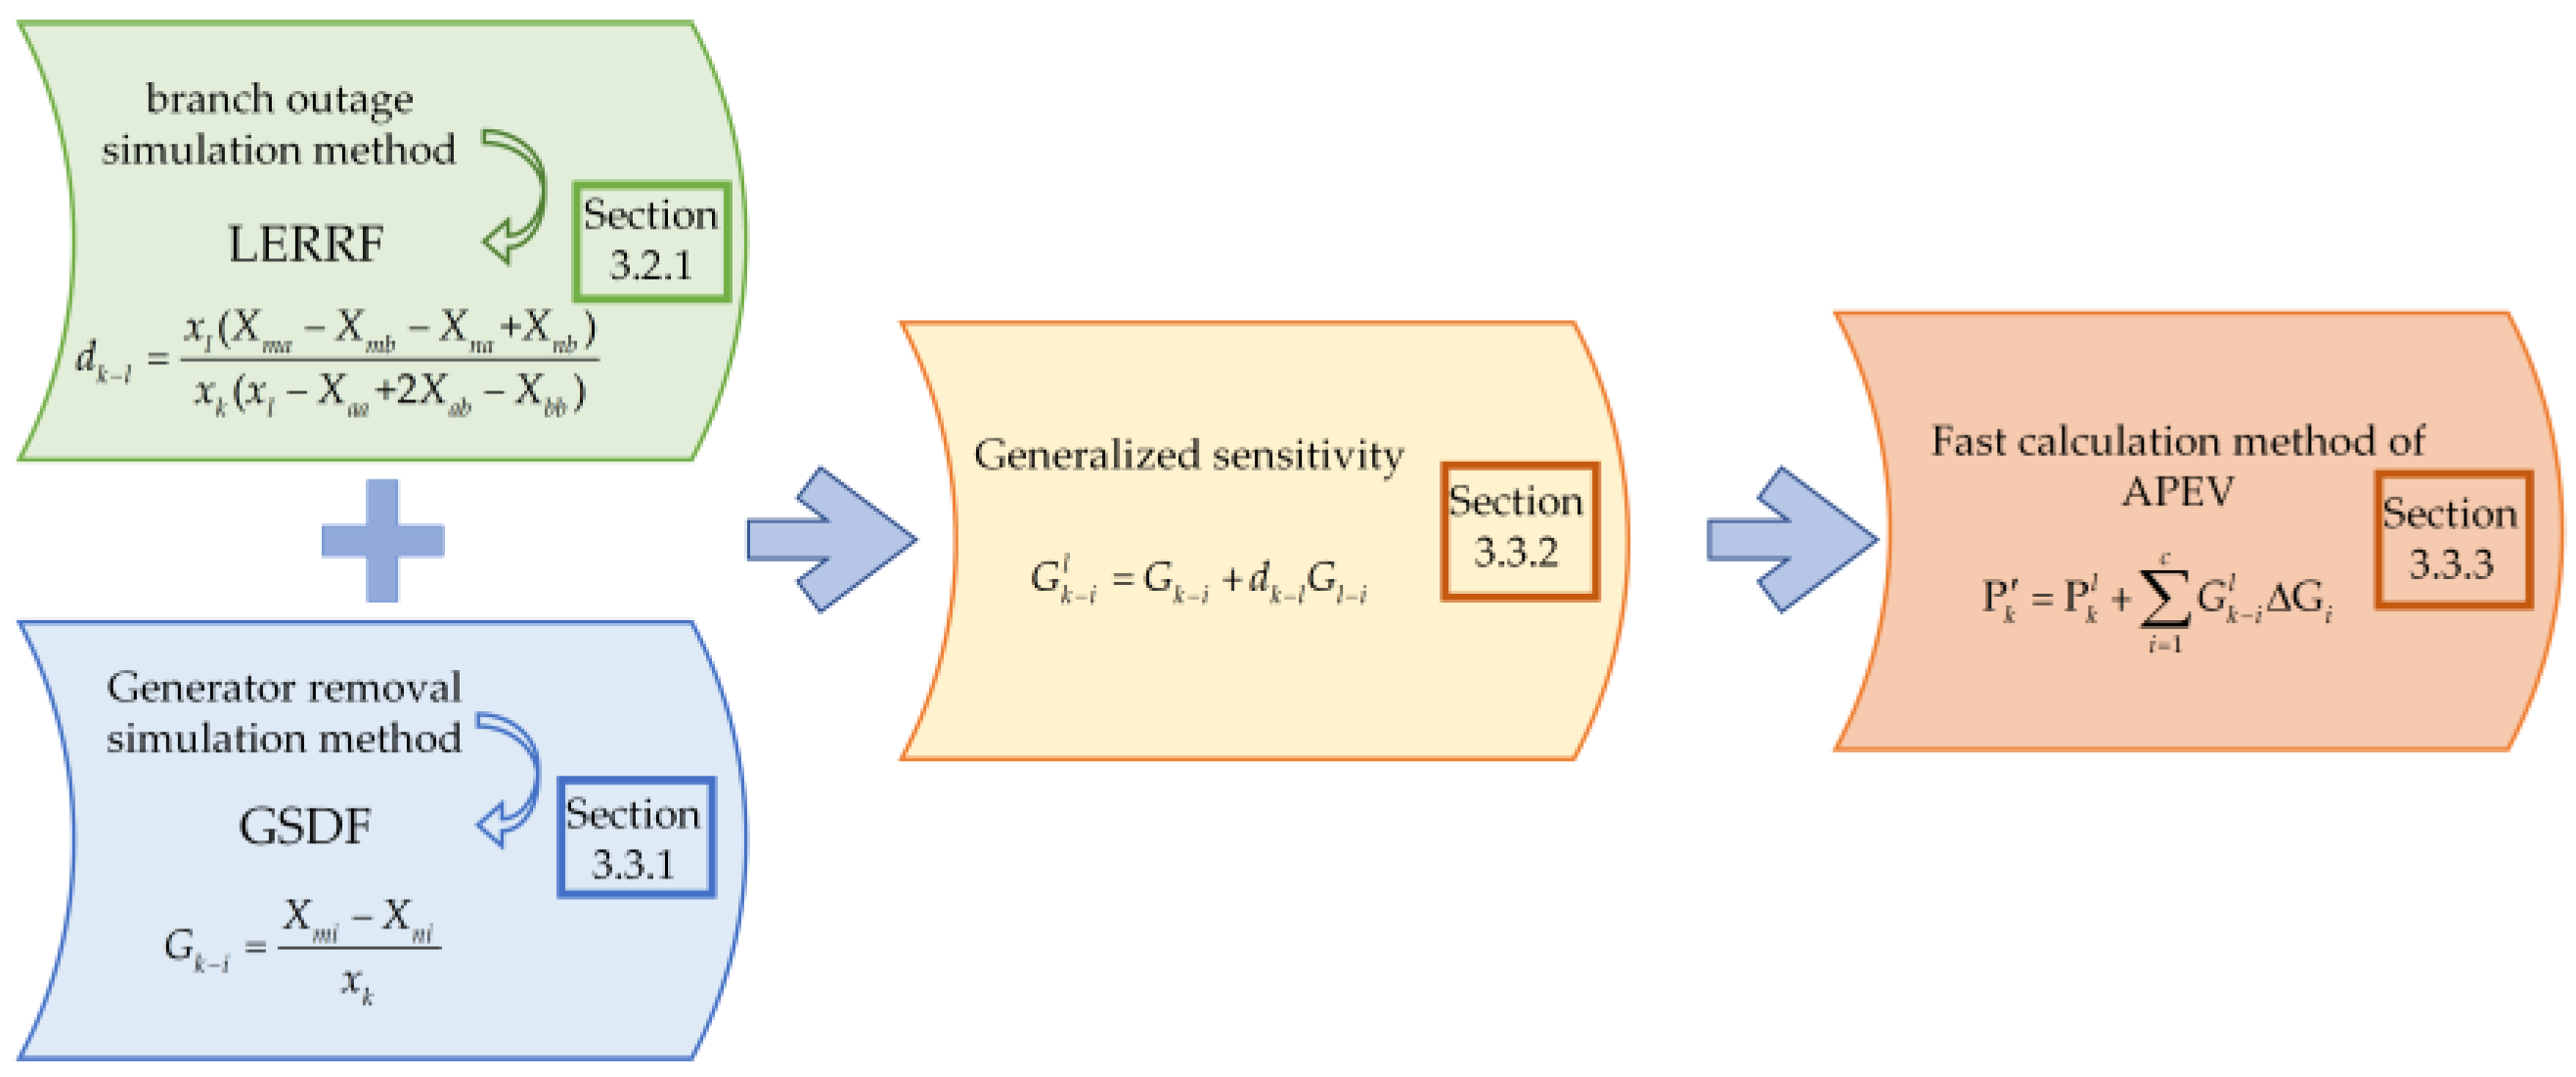
The LERPF is derived from the branch outage simulation of static security analysis. The detailed derivation process can be found in Appendix A. Let the two end nodes of branch k be m and n, respectively. According to Appendix A, we can obtain the mathematical expression of the LERPF as shown in Equation (7):
d k l = x l ( X m a X m b X n a + X n b ) x k ( x l X a a + 2 X a b X b b )
where xl and xk are the reactance of branch l and branch k, respectively; Xma, Xmb, Xna, Xnb, Xaa, Xab, and Xbb are elements in matrix X; X is the reactance matrix. From Equation (7), it can be seen that the LERPF is only related to the power grid topology and line parameters and are independent of the active power transmitted by the power grid.

3.2.2. Method of Calculation

In the conventional method, the calculation of the APEV is based on the assumption that the bus nodes’ output remains unchanged before and after the branch is removed, and it is considered that the APCV of the remaining branches is only affected by the LE caused by the removal of the branch. The mathematical expression for APEV is obtained based on the branch outage simulation method in the static safety analysis. The APCV of each branch within the CLS due to LE can be obtained by Equation (6).
After the faulty branch is removed, the APEV can be obtained by adding APCV to the active power of the line before the faulty branch is removed, as shown in Equation (8).
P k = P k l = P k 0 + Δ P k l = P k 0 + d k l P l 0
where P k l is the APEV of line k after line l is removed; P k 0 is the active power transmitted by branch k before line l is removed;
The calculation of the APEV in the above conventional method assumes that the bus nodes’ output before and after the faulty branch removal is unchanged. In the power system with wind farms, especially under the scenario of high wind power penetration, if the APEV is calculated based on the conventional method without considering the change value of wind power output before and after the faulty branch removal, the error between the APEV and the APMV may be too large, so that the LEE cannot meet the LE identification criterion, resulting in misjudgment of the cause of branch overload. The LE cannot be accurately identified, causing the unexpected tripping of backup protection, which may lead to cascade tripping and subsequent blackouts.
Therefore, for the power system with wind farms, when calculating the APEV after the faulty branch is removed, the APCV caused by the output fluctuation of the wind farm must be considered. A calculation method of the APEV considering wind power output fluctuation is proposed in the following.

3.3. Calculation Method of APEV Considering the Output Fluctuation of the Wind Farm

In a power grid containing wind farms, the influence of the randomness and volatility of wind power output on the existing LE identification method is mainly reflected in the calculation method of the APEV of remaining branches after the faulty branch is removed, especially in the new type power system with high wind power penetration. The wind power output differs before and after the faulty branch is removed. Therefore, when calculating the APEV of the remaining branches after the faulty branch is removed, not only the influence of LE should be considered, but also the influence of wind power output fluctuation. In order to ensure that the LE identification criterion described in Section 3.1 is still applicable under high wind power penetration scenarios, this section proposes a fast calculation method for the APEV.

3.3.1. Sensitivity of Bus Nodes to Line

The generator switching simulation method in the static safety analysis can reflect the impact of the generator output change on the active power of all branches of the whole network. Therefore, the generation shift distribution factor (GSDF) obtained from the generator switching simulation method can be used to calculate the value of the change in the active tidal current brought about by the generator output change to the line [25,26]. The GSDF is also called the sensitivity of the bus node to the line and is denoted as G. GSDF describes the APCV of branch k when the active power output of the bus node i is a changed unit value, and its definition is shown in Equation (9).
Δ P k i = G k i Δ G i
where Δ P k i is the APCV of branch k when the active power generated by bus node i changes; ΔGi is the change value of the active power generated by bus node i; and Gki is the GSDF of bus node i for branch k, also known as the sensitivity of bus node i for branch k, which can be approximately calculated by Equation (10).
G k i = X m i X n i x k
where Xmi and Xni are the elements of matrix X. According to Equation (10), it can be seen that GSDF is only related to power grid topology and system parameters. On this basis, it can be determined that when the change value in active power output at bus node i is ΔGi, the APEV of the branch is calculated by Equation (11).
P k i = P k 0 + G k i Δ G i
where P k i is the APEV of branch k when the active power generated by bus node i changes; P k 0 is the active power of the line k if the active power generated by bus node i is constant, which is also the active power transmitted by the branch k before the branch l is removed mentioned above.
According to reference [27], for any branch in the subgraph, the nodes outside the subgraph and the breakpoints of the subgraph have the same GSDF for the branch.

3.3.2. Generalized Sensitivity When the Faulty Branch Is Removed

The conventional sensitivity GSDF reflects the APCV of the branch caused by the change value in active power output at bus node i when the power grid topology is unchanged. After removing the faulty branch, the power grid’s topology changes. Each bus node’s sensitivity to the remaining branch will also change. Therefore, it is necessary to extend the conventional sensitivity to the case of branch removal, which is called generalized sensitivity. The generalized sensitivity of each bus node to the line is derived below based on the LERPF and GSDF obtained above.
  • Scenarios where the active power of a single bus node output changes
When branch l is removed, the active power of branch k will change from P k 0 to P k l , and
P k l = P k 0 + d k l P l 0
Considering that the active power generated by large-scale wind farms has huge volatility, it is assumed that the active power generated by the wind farms connected to bus node i changes after branch l is removed. Then, the active power transmitted by branch k after branch l is removed will become as follows,
P k l , i = P k i + d k l P l i
where the superscripts ‘l’ and ‘i’ represent the removed branch l and the bus node i containing the wind farm, respectively. P k l , i is the APEV of branch k under the condition that the active power generated by node i changes after branch l is removed; According to Equation (11), Equation (14) can be obtained.
{ P k i = P k 0 + G k i Δ G i P l i = P l 0 + G l i Δ G i
Substitute Equation (14) into Equation (13); then Equation (15) is obtained as follows.
P k l , i = ( P k 0 + G k i Δ G i ) + d k l ( P l 0 + G l i Δ G i )   = ( P k 0 + d k l P l 0 ) + ( G k i + d k l G l i ) Δ G i   = P k l + G k i l Δ G i
where P k l is the APEV of branch k after branch l is removed without considering the change value of the active power generated by the wind farms; G k i l Δ G i is the APCV of branch k caused by the change value of active power generated by bus node i after branch l is removed. According to Equation (15), when the bus node output at node i changes before and after branch l is removed, the active power on branch k consists of two parts:
  • P k l : the APEV of branch k after branch l is removed when the active power generated by the wind farms is constant; that is, the APEV obtained by the conventional method.
  • G k i l Δ G i : the APCV of branch k caused by the ΔGi after branch l is removed.
Define G k i l as generalized sensitivity. According to Equation (15),
G k i l = G k i + d k l G l i
It can be seen from Equation (16) that the generalized sensitivity is related to the LERPF and GSDF and can reflect the change in active power caused by the change in bus node output before and after the branch is removed.
From Section 3.3.1, for any branch in the subgraph, the nodes outside the subgraph and the breakpoints of the subgraph have the same GSDF for the branch. It can be seen from Equation (16) that after branch l is removed, for branch k in the subgraph, dkl is a fixed value. Therefore, the nodes outside the subgraph and the breakpoints of the subgraph also have the same generalized sensitivity to the branch.
2.
Scenarios where the active power of multi-node output changes.
When there are multiple nodes with wind farms in the system, the generalized sensitivity of each node with the wind farm to each branch within the CLS can be calculated in parallel. Therefore, the calculation speed is theoretically not affected.

3.3.3. Fast Calculation Method of APEV

According to the above Section 3.3.2, when branch l is removed, and the change value in active power output at bus node i is ΔGi, the APEV of branch k consists of two parts. Among them, P k l is a fixed value, essentially the APEV calculated by the conventional method after branch l is removed. G k i l Δ G i is related to the active power output of the bus nodes; when the active power output of multiple bus nodes changes, the APCV of the branch k caused by different bus nodes is independent and can be calculated in parallel.
Therefore, in the scenario of multiple bus nodes containing wind farms, the change value brought by each node can be calculated in parallel, and the total APCV brought by all nodes can be obtained by superposition. When there are c bus nodes containing wind farms in the power system, after branch l is removed, the APEV of line k can be directly calculated using Equation (17). The calculation is very fast and meets the requirements of online calculation.
P k = P k l , ( c ) = P k l + i = 1 c G k i l Δ G i
where P k l , ( c ) is the APEV of branch k for the scenario where branch l is removed and there are c bus nodes containing wind farms. The APCV of the branch caused by the active power output change in the bus nodes containing the wind farm before and after the faulty branch removal is considered, thus ensuring that the LE identification criterion described in Section 3.1 is still applicable under high penetration of wind power generation.
Therefore, based on generalized sensitivity, a fast calculation of active power can be achieved, which is suitable for power systems with multiple nodes containing wind farms and is independent of wind power penetration. The fast calculation can avoid iterations and increase the calculation speed. After the branch is removed, according to the data uploaded by WAMS, ΔGi can be obtained, which corresponds to the APCV of the wind power output before and after the removal of the faulty branch. Therefore, using Equation (17), the APEV of branch k, which considers the fluctuation of the wind farm output, can be obtained after the faulty branch is removed. The overall steps in the derivation of the mathematical expression for APEV are shown in Figure 4.
The APEV is used in the LE identification criterion described in Section 3.1 to determine the cause of branch overload. Differing from the traditional method that assumes the active power output of bus nodes to be unchanged before and after the faulty line is removed, the calculation method of the APEV considering the output fluctuation of wind farms proposed in this section can be used for LE identification in high-penetration scenarios of wind power.

3.4. LE Identification Process

The WAMS monitors the electrical quantities and each circuit breaker’s opening/closing information online in real-time. Once WAMS monitors a change in the power grid topology, branch l is removed, and the backup protection is activated at one or several locations in the power grid, it quickly activates the LE identification procedure.
Firstly, the CLS of this removed branch is searched based on the improved shortest path algorithm. Then, the generalized sensitivity is quickly calculated for all branches k within the CLS, and it is worth stating that the LERPF and sensitivity can be obtained offline because they are only related to the power grid topology and line parameters. After that, ΔGi is calculated based on the measured values of the active output of the bus nodes containing the wind farm before and after branch l is removed, and the APEV and LEE of branch k within the CLS are calculated based on the active power transmitted by each branch in the power grid before branch l is removed collected by WAMS in real-time. Finally, the cause of the overloading of branches within the CLS is quickly determined based on the LE identification criterion.
Suppose the APMV and the APEV of branch k meet the LE identification criterion. In that case, overload occurs in branch k caused by LE, and the corresponding backup protection will have an unexpected trip. At this time, the backup protection trip signal should be blocked quickly to win time for the load-shedding action of the automatic safety device, and the subsequent load-shedding strategy is designed according to the operational state of the branches within the CLS to narrow the control range and increase the speed.
Suppose the APMV of branch k does not satisfy the LE identification criterion. In that case, it means that branch k is overloaded due to a fault within the short-circuit range, and the corresponding backup protection trips after the delay period expires.
Since the time interval for the WAMS to dynamically update the data is 20–50 ms, and the tripping delay of the backup protection is usually more than 1 s, there is enough time to realize the LE identification function. Considering the communication system’s possible failure, if the backup protection delay has been reached while the result of LE identification has not been obtained, it will be tripped directly.
The specific flow of identifying LE is shown in Figure 5.

4. Simulation and Analysis

Taking the IEEE 39-bus New England system as an example, it is assumed that the system is in a heavy-load operation state. Based on the PSASP platform, the simulation analysis is carried out to verify the effectiveness of the CLS search method proposed in this paper and the accuracy and adaptability of the LE identification method under different penetrations of wind power generation.

4.1. Test Case 1: Search for the CLS

In this case, according to the search method of the CLS described in Section 2, the IEEE 39-bus New England system is modeled and reduced in dimension. Then, the CLS of the branch removed due to the fault is searched based on the improved shortest path algorithm proposed in this paper. The validity and accuracy of the algorithm is verified.
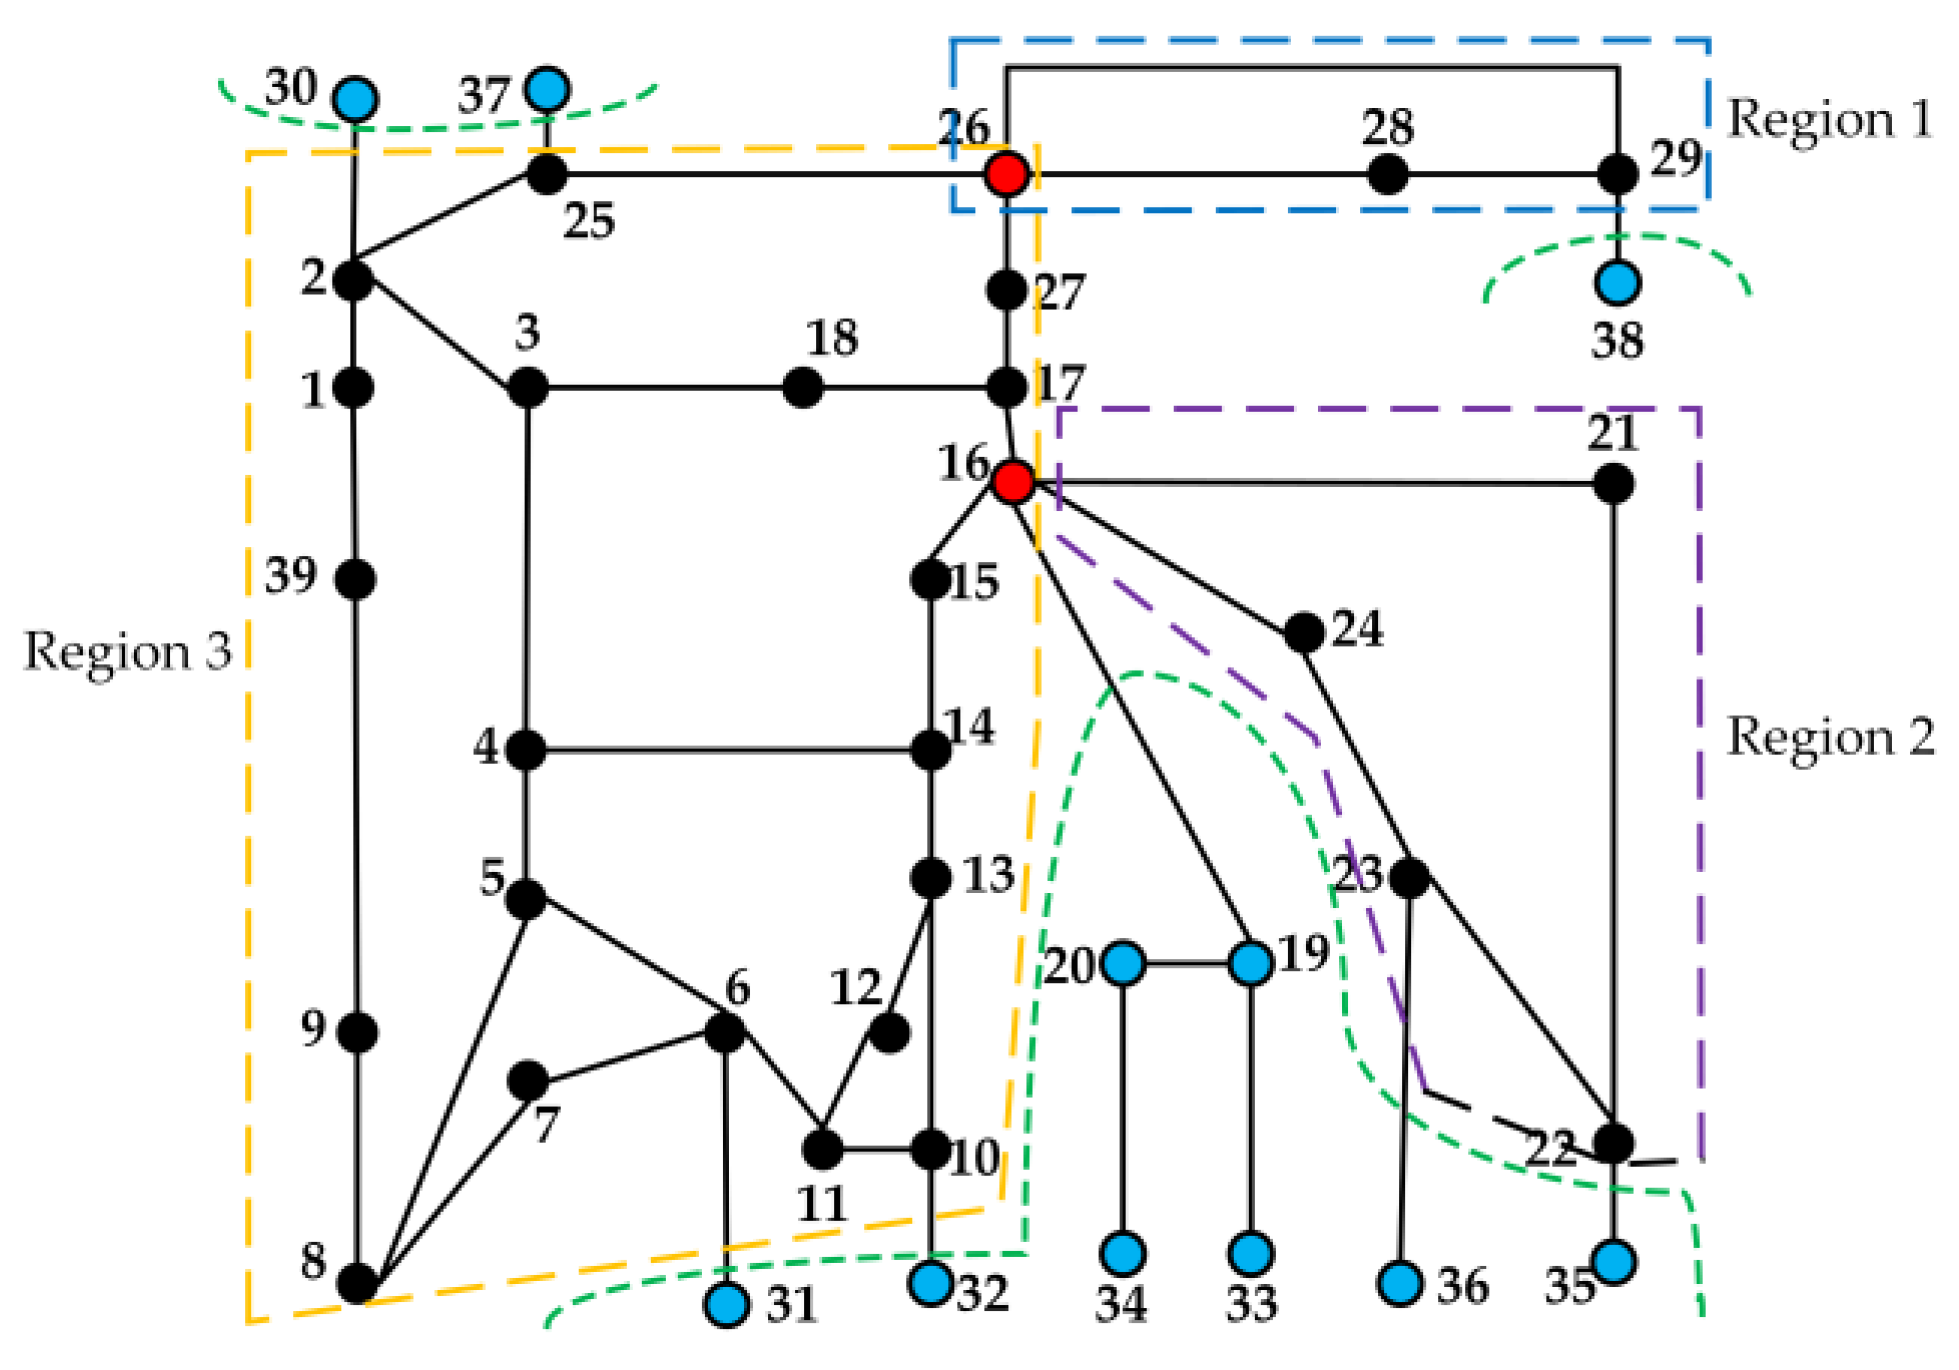
There are eleven hanging nodes and two breakpoints in the IEEE 39-bus New England system. Node 16 and node 26 are breakpoints. Three LE regions are obtained according to the breakpoints and hanging nodes, as shown in Figure 6.
Assuming branch 5-6 is removed due to a short-circuit fault, and then based on the improved shortest path algorithm, two shortest paths are obtained, constituting the CLS of branch 5-6, as shown in Table 1. The absolute value of the LERPF of all branches on the path is greater than d0, and the shorter the path length, the greater the LERPF, as shown in Table 2. In all branches of the power grid except the branches within the CLS of branch 5-6, the maximum value of the LERPF comes from branch 4-3, and its value is only 0.054. Therefore, these two shortest paths contain all the branches within the CLS of branch 5-6.

4.2. Test Case 2: LE Identification in the Scenario Where a Single Node Contains Wind Farms

This case is aimed at the scenario where a single node of the power system contains a wind farm, and the penetration level of wind power generation is low. The accuracy of the conventional calculation method of the APEV and the calculation method that considers the fluctuation of the wind power output proposed in this paper are compared.
The wind farm model is integrated into the IEEE 39-bus New England system through bus node 26 for analysis. The wind farm is composed of 40 wind turbines, with a single unit capacity of 1.5 MW, divided into four columns, ten wind turbines in each column, and the total installed capacity of the wind farm is 60 MW. After boosting, the 40 wind turbines are integrated into the 35 kV collector line and then into the IEEE 39-bus New England system through the 35/110 transformer. The cut-in, rated, and cut-out wind speeds of each turbine are 3 m/s, 11 m/s, and 25 m/s, respectively, and the active power, reactive power, and voltage data of each turbine required for the modeling process are obtained from the SCADA system. The sensitivity and generalized sensitivity of each branch of the CLS of branches 5-6 to node 26 are shown in Table 3.
Using the simulation data of PSASP as the data uploaded by WAMS, before branch 5-6 was removed, the wind power output was 93.33% of the installed wind power capacity, and the active power of branch 5-6 was 456.45 MW. The wind power output was 76.7% of the installed wind power capacity at a certain moment after branch 5-6 was removed. The branch active power and the wind active power output at two moments are recorded, respectively. The APEV of each branch within the CLS of branch 5-6 is calculated using the conventional and proposed methods after branch 5-6 is removed, respectively. On this basis, LEEs are obtained. The APEV and the LEE obtained based on the proposed method are denoted as P k and α, respectively, and those obtained based on the conventional calculation method are denoted as P k and β, respectively. All data are obtained as shown in Table 4 and processed to obtain Figure 7.
Assuming the permitted value of active power of branch 7-6 is [−700 MW, 700 MW], according to the simulation results: the active power on branch 7-6 after branch 5-6 is removed is 733.87 MW, and overloading occurs on branch 7-6. Based on the LE identification criterion, the LEE calculated by the method proposed in this paper is 0.0003, which satisfies | ( P k t P k ) / P k | < ε . Therefore, it is concluded that branch 7-6 is overloaded due to LE. The LEE calculated by the traditional method is 0.0099, which also satisfies the LE identification criterion and is able to correctly judge the cause of branch overload. Figure 7a illustrates that the APEV calculated by the two methods is basically consistent with the APMV. Figure 7b shows that in the case of very small wind power penetration, the APEV calculated by the conventional method still has high accuracy and can still meet the accuracy requirements in LE identification. It is worth stating that the APEV calculated by the proposed method is closer than that calculated by the conventional method, and the error between the APEV and the APMV is smaller.

4.3. Test Case 3: LE Identification in the Scenario Where Multiple Nodes Contain Wind Farms

This case is aimed at the scenario where multiple bus nodes contain wind farms and the penetration of wind power gradually increases. The adaptability of the conventional calculation method of the APEV and the proposed method are compared.
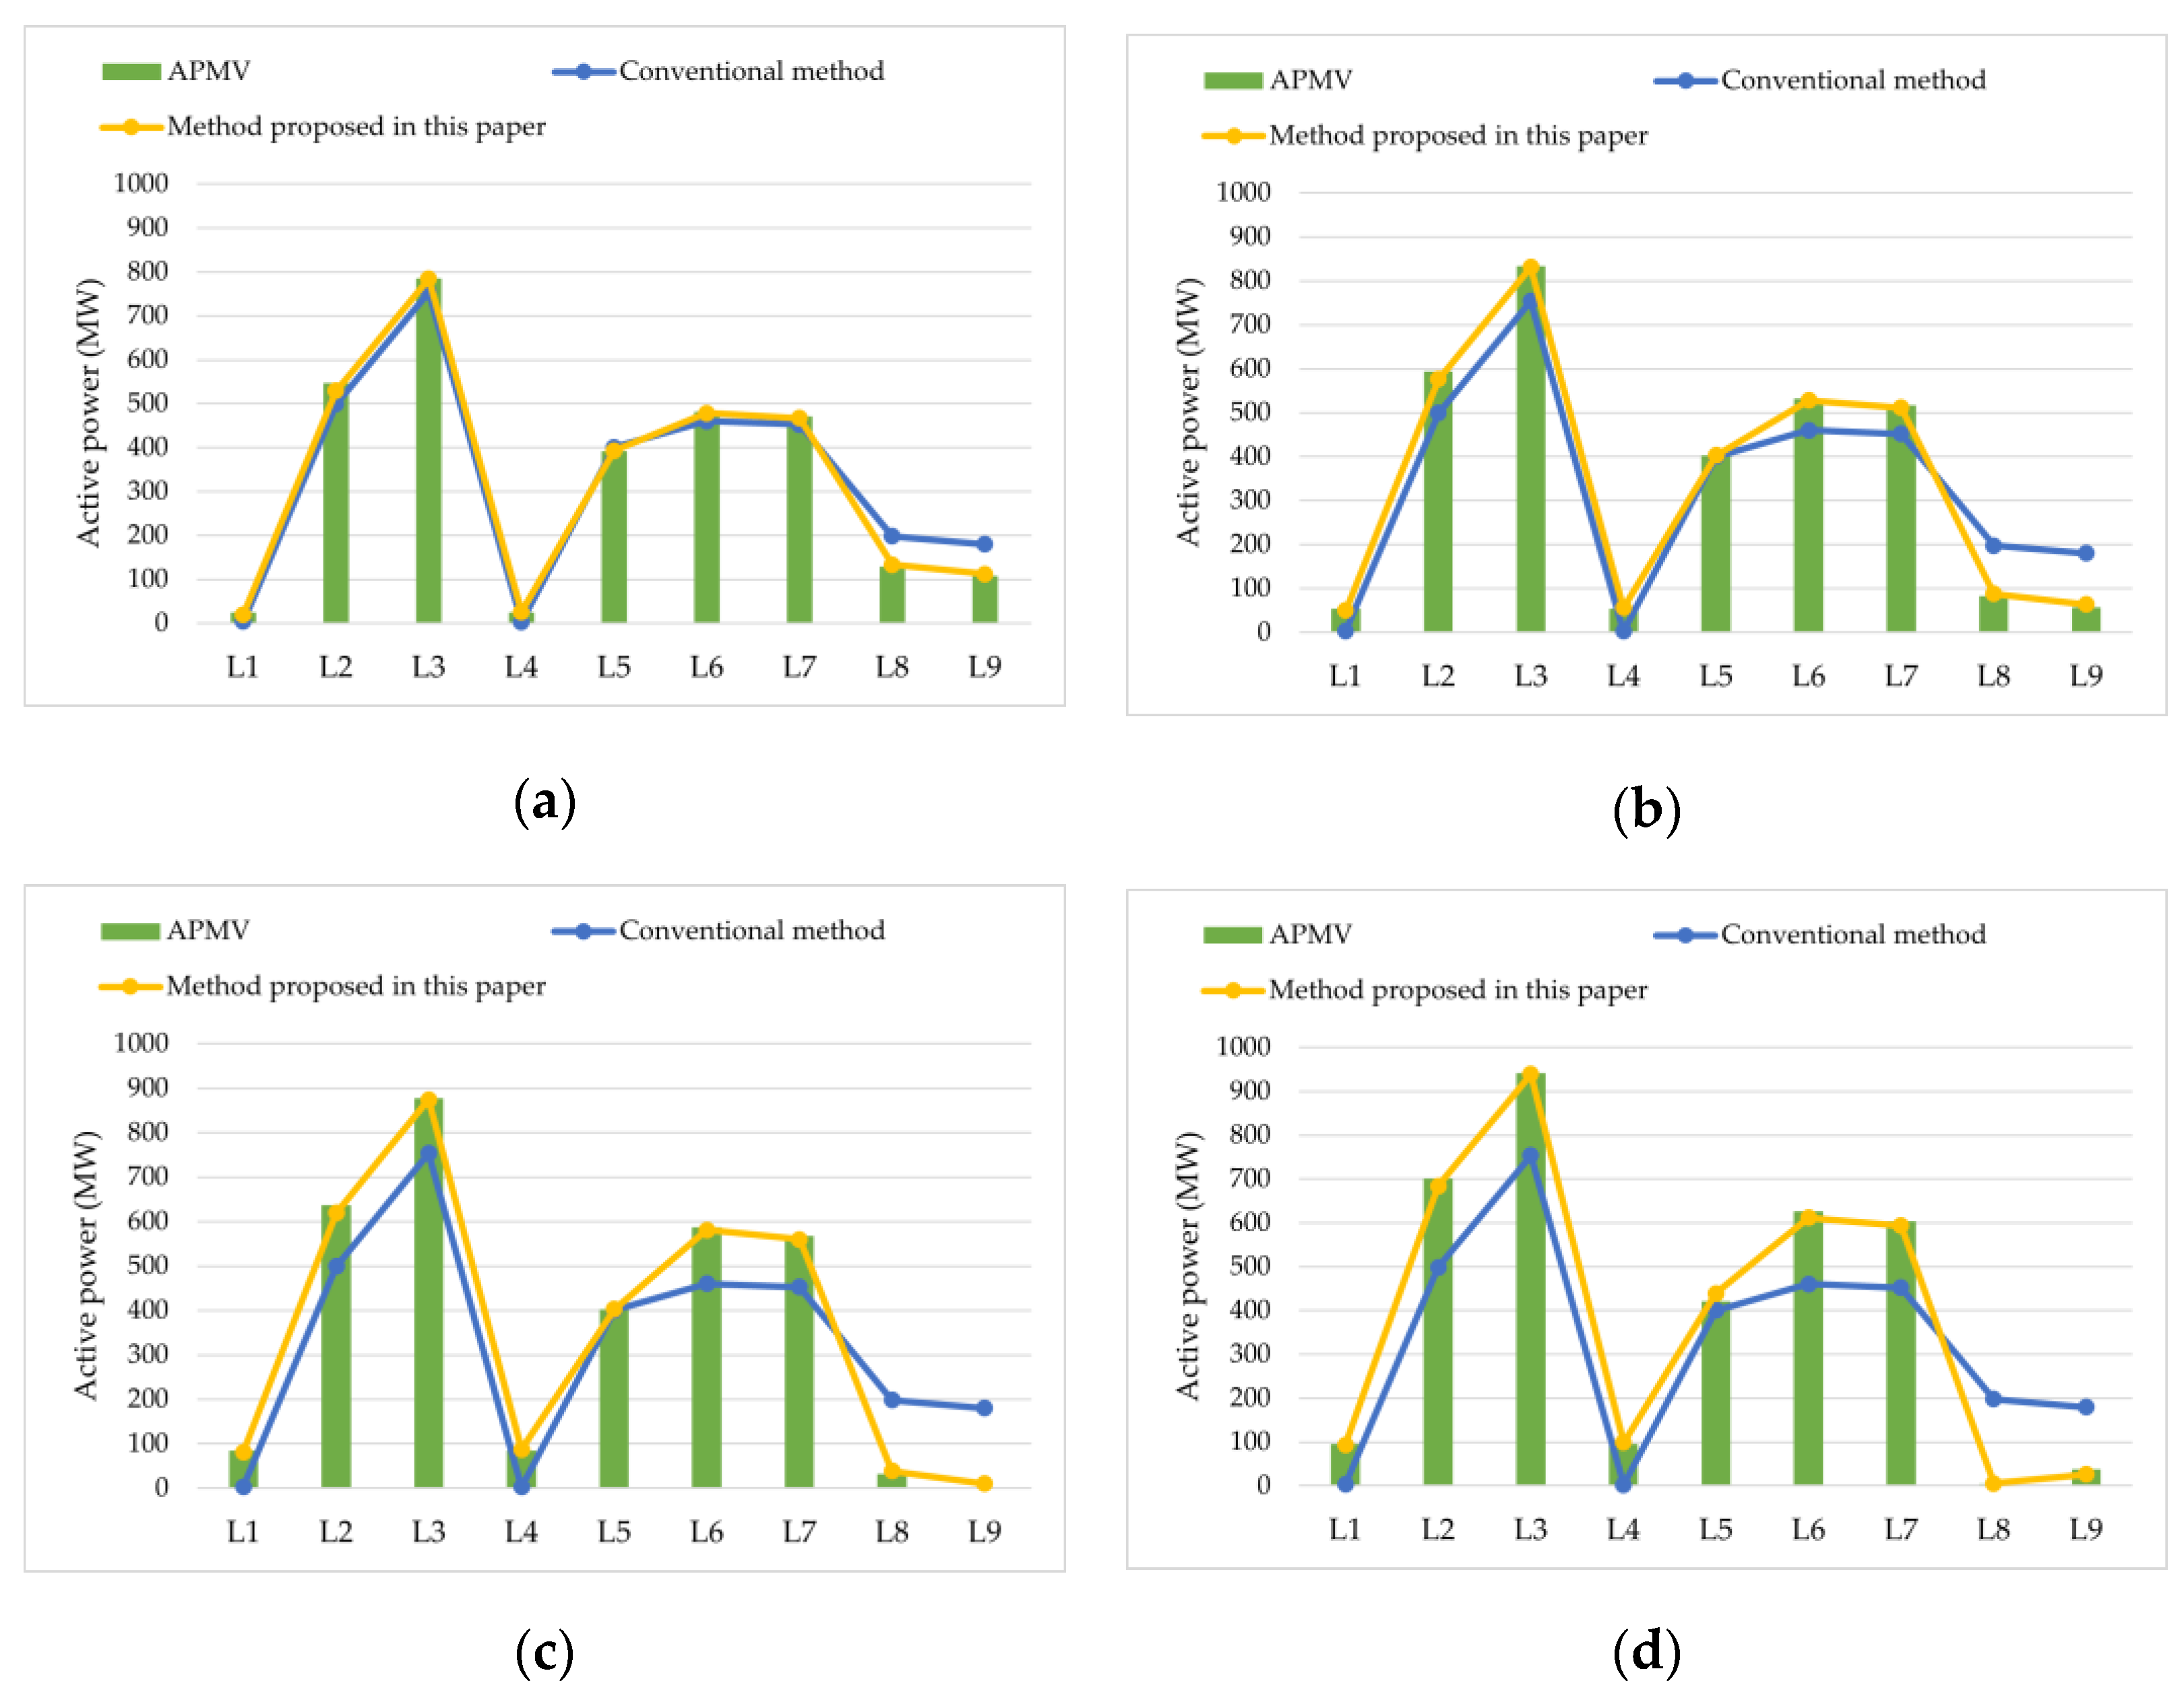
In the simulation process, conventional generators are replaced with wind farm models of 1.08 times the capacity. Table 5 shows the nodes where the replaced generators are located under different wind power penetration and the corresponding wind active power output change value at two moments before and after branch 5-6 is removed. The sensitivity of bus nodes containing wind farms to each branch within the CLS of branch 5-6 is shown in Table 6, and the generalized sensitivity is shown in Table 7, where nodes 33, 34, 35, and 36 have the same sensitivity and generalized sensitivity as node 16. Table 8 shows the APEV calculated by the two methods under different penetrations of wind power and processed to obtain Figure 8.
From Figure 8, for the scenario where multiple nodes contain wind farms, the APEV calculated by the proposed method is closer to the APMV than that calculated by the conventional method under different wind power penetrations. With the increase in wind power penetration, under the condition that the proportion of wind power output change value to the total installed capacity of wind farms is basically the same—that is, the wind power output is 92.6% of the wind power installed capacity before branch 5-6 is removed and is about 85% at a certain moment after the branch 5-6 is removed—the error between the APEV calculated by the conventional method and the APMV is increasing, while the error between the APEV calculated by the proposed method and the APMV is still small and basically unchanged, which validates that the proposed method has good adaptability for systems under different penetrations. It is worth stating that the essential reason for the error between the APEV and the APMV calculated by the conventional method is not related to the wind power penetration but to the integration location of the wind farm and the change value of wind power output.
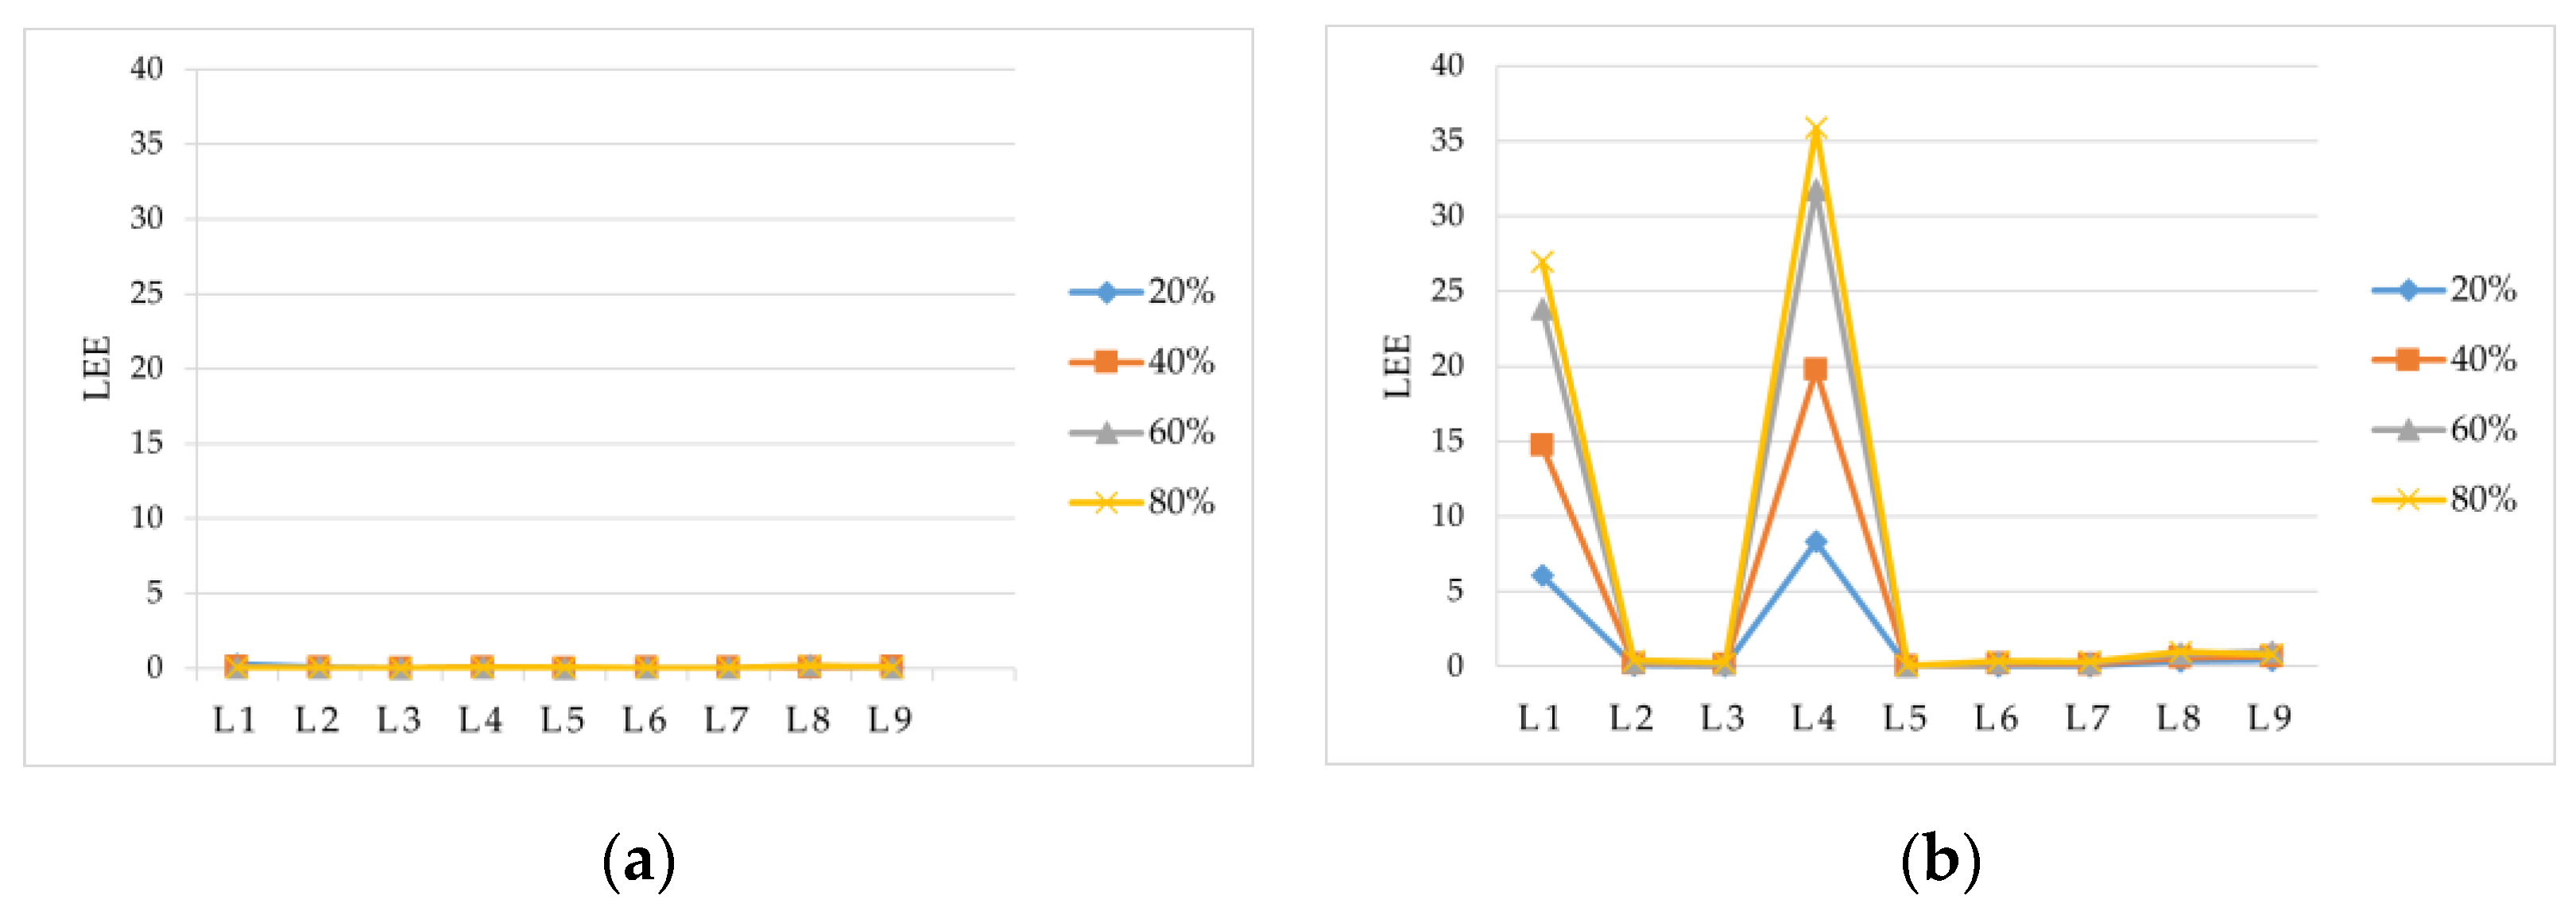
The LEEs calculated by two methods under different penetrations are shown in Table 9 and processed to obtain Figure 9. From Figure 9a, the LEEs calculated by the proposed method are all within the threshold value with the penetration increase. From Figure 9b, when the APMV and the APEV are small, the situation wherein the LEE is greater than the threshold value occurs, such as for L1 and L4, which indicates that the calculation result of the conventional calculation method under high penetration of wind power is not accurate enough, easily causing the misjudgment of the cause of the branch overload.
It is assumed that the permitted value of the active power of branch 7-6 is [−700 MW, 700 MW], that of branch 8-7 is [−500 MW, 500 MW], and that of branch 14-13 is [−450 MW, 450 MW]. From Table 8, overloading occurs on branch 7-6, branch 8-7, and branch 14-13 after branch 5-6 is removed under different penetrations of wind power. Figure 10 compares the LEEs of overloaded branches calculated by the proposed and conventional methods under different penetrations of wind power. From Figure 10a, the LEEs of three branches calculated by the proposed method all satisfy LE identification criteria; it is concluded that three branches were overloaded due to LE, and the proposed method can accurately identify the LE under different penetrations of wind power. From Figure 10b, when the penetration does not exceed 60%, the LEEs of the three branches calculated by the conventional method satisfy the identification criteria. It can be judged that the three branches are all overload due to LE. However, when penetration reaches 80%, it will misjudge that branches 7-6 and 14-13 are all overloaded due to faults within the protection range.
Thus, unlike the traditional calculation method that may misjudge in the scenario of high penetration of wind power, the method proposed in this paper is applicable under any high wind power penetration.

4.4. Feasibility Analysis of Preventing Cascade Tripping

The above simulation results show that the improved shortest path algorithm proposed in this paper can quickly and accurately search for dangerous lines greatly affected by LE after faulty line removal, quickly determining the collection range of wide-area information. In the scenario where a single node contains a wind farm and the wind power penetration is low, the APEV obtained by the conventional method still has high accuracy and can still meet the accuracy requirements in the LE identification. The error between the APEV calculated by the proposed method and the APMV is smaller than that calculated by the conventional method. In the scenario where multiple nodes contain wind farms, assuming that the value of the change in wind power active output as a proportion of total installed wind power capacity remains constant, the error between the APEV calculated by the conventional method and the APMV increases as the wind power penetration gradually increases.
In the cases in this paper, when the wind power penetration rate exceeds 60%, the APEV calculated by the conventional method can no longer satisfy the LE criterion, which may lead to incorrect LE identification results, causing an unexpected trip of the backup protection, which may cause a cascading trip. As for the proposed method, the APEV is still close to the APMV in the scenario of high wind power penetration. The LE overload can be accurately identified based on the existing LE identification criterion.
The time spent on each link in the simulation process of this paper is shown in Table 10. From Table 10, the entire identification process of LE can be completed within 0.1 s in different scenarios. It is worth explaining that with the increase in wind power penetration, the time for calculating the APEV increases, which is essentially due to the increase in the number of bus nodes containing wind farms, resulting in an increase in the calculation of the APEV, but the increment of time is very small, and from the point of view of the total time, the total time of the LE identification method proposed in this paper is basically the same for the different scenarios with different wind power penetration rates.
Since the time interval of WAMS updating data is 20–50 ms, and the backup protection action delay is usually 1–5 s, this inherent delay can be used to collect wide-area information and complete relevant algorithms quickly. LE can be reliably identified, and the trip signal can be blocked before the action of the backup protection, which wins enough time for the subsequent load-shedding control and can effectively prevent the occurrence of cascade tripping accidents.

5. Conclusions

Given that most of the current identification of branch overload causes is carried out for conventional power grids, and with the trend of gradually increasing the proportion of renewable energy sources, there is an urgent need for a method of identifying the causes of branch overloads that considers renewable energy sources. In response to the development trend of new power systems, this paper proposes a method for quickly identifying the causes of branch overloads applicable to power systems with high wind power penetration, which can avoid the unexpected tripping of the backup protection due to LE, providing technical support for the improvement of the performance of the backup protection.
Firstly, the improved shortest path algorithm was adopted to search for the CLS. Based on the adjacency matrix, the method ensures the unidirectionality of the search process, which avoids the repeated traversal of the nodes, quickly determining the collected range of the wide-area information and significantly reducing the burden of further analysis and computation, thus increasing the search speed. At the same time, the method lays a foundation for the design of the subsequent load-shedding strategy, which significantly reduces the range of the analysis, preparing for the rapid elimination of the overloaded branch.
Then, the hidden dangers of the traditional calculation method of the APEV in the scenario with wind farms are analyzed, and a fast calculation method of the APEV considering the fluctuation of wind power output is proposed. This method can ensure the accuracy of the active power calculation results in scenarios with different wind power penetration rates. In the scenario set in this paper, when the wind power penetration rate exceeds 60%, the APEV obtained based on the conventional method can no longer satisfy the LE identification criterion, the cause of the branch overload appears to be misjudged, the backup protection will be tripped according to the whole delay, and the active power of the whole network will be redistributed again, which may trigger chain tripping. The APEV calculation method proposed in this paper, which takes into account the fluctuation of wind farm output, ensures that the LE identification criterion is still applicable to the grid when the penetration rate of wind power exceeds 60%.
Finally, simulations of the IEEE 39-bus New England system were carried out based on PSASP. The simulation results show that the search for the CLS can be completed quickly and accurately based on the improved shortest path algorithm, quickly determining the range of the information that needs to be collected. The LE identification method proposed in this paper can reliably identify the LE in both the single-node and multi-node scenarios containing wind farms, and it remains applicable in scenarios with high wind power penetration. It takes less than 0.1 s to complete the identification of LE, which can reliably block the tripping signal within the delay period of backup protection, preventing the backup protection from unexpected action, winning time for the subsequent load-shedding action of the automatic safety device and effectively avoiding the occurrence of cascading outages.
This paper mainly studies the identification of LE suitable for high penetration scenarios of wind generators to avoid blackouts caused by cascading trips of transmission lines. We are currently considering the impact of communication faults and network attacks on cascading trips and trying to realize the early warning function of communication faults and network attacks with the help of the secondary monitoring system developed by the State Grid Corporation of China; at the same time, we are designing the load-shedding control strategy, thus ensuring that the overload condition of the branch circuit can be eliminated quickly after identifying the overload of the LE. In the next step, we will consider the effect of the frequency fluctuation brought by wind turbines on the cascading trip, further consider the cascading trip-off accident of wind turbines themselves, and propose corresponding response strategies.

Author Contributions

Conceptualization, D.X. and Q.C.; data curation, D.X. and Y.S.; formal analysis, D.X., Q.C. and N.S.; funding acquisition, Q.C.; methodology, D.X., Q.C. and Y.D.; project administration, Q.C.; software, D.X.; validation, D.X. and Q.C.; visualization, D.X. and W.D.; writing—original draft, D.X.; writing—review and editing, D.X., Q.C. and Y.S. All authors have read and agreed to the published version of the manuscript.

Funding

This research was funded by the National Natural Science Foundation of China, grant number 51877123.

Institutional Review Board Statement

Not applicable.

Informed Consent Statement

Not applicable.

Data Availability Statement

The data presented in this study are available in the article.

Conflicts of Interest

The authors declare no conflict of interest. The funders had no role in the design of the study; in the collection, analysis, or interpretation of the data; in the writing of the manuscript; or in the decision to publish the results.

Nomenclature

LELoad encroachment
WAMSWide-area measurement system
CLSCritical line set
LERPFLoad encroachment-related proportional factor
LEELoad encroachment eigenvalue
APEVActive power estimation value
APCVActive power change value
APMVActive power measured value
BCDBranch correlation degree

Appendix A

The DC active power equation in incremental form is shown in Equation (A1),
Δ P = B 0 Δ θ Δ θ = X Δ P
where B0 is the matrix based on 1/x (x is the reactance of the branch); X is the inverse of B0—that is, the reactance matrix; ΔP is the column vector of the APCV of the node in the power grid; and Δθ is the column vector of the change value of the node voltage phase angle.
Let the two end nodes of the branch l be a and b, respectively. Assuming that the active power injected into each node before and after the removal of branch l is unchanged, Then both B0 and ΔP will change after the branch is removed. Assuming that B0 and ΔP become B ˜ 0 and Δ P ˜ after branch l is removed, respectively, Equation (A2) can be obtained from the compensation principle.
B ˜ 0 = B 0 M l x l 1 M l T Δ P ˜ = [ 0     P l 0   P l 0     0 ] T = M l P l 0   a  b
where Ml is the node–branch correlation vector of branch l with only two non-zero elements, +1 and −1, at the corresponding positions of nodes a and b at both ends, and the remaining elements are zero. The voltage phase angle change value caused by the removal of branch l is shown in Equation (A3).
Δ θ = B ˜ 0 1 Δ P ˜ = ( B 0 M l x l 1 M l T ) 1 M l P l 0
where xl is the reactance of branch l.
Based on Equation (A3), Equation (A4) can be obtained by using the matrix inversion lemma shown in Appendix B.
Δ θ = ( X η l c l η l T ) M l P l 0
where
η l = X M l ,   c l = ( x l + X l l ) 1 ,   X l l = M l T η l
where Xll is the self–impedance of port l. The mutual impedance between port k and port l is defined as shown in Equation (A6).
X k l = M k T η l
where Mk is the node–branch correlation vector of branch k.
The APCV caused by the removal of branch l on branch k (kl) is shown as follows.
Δ P k l = M k T Δ θ x k = M k T ( X η l c l η l T ) M l P l 0 x k = d k l P l 0
where xk is the reactance of branch k.

Appendix B

Equation (A8) is the famous Sherman–Morrison–Woodbury Equation, also known as the matrix inverse lemma.
( A 11 A 12 A 22 1 A 21 ) 1 = A 11 1 + A 11 1 A 12 ( A 22 A 21 A 11 1 A 12 ) 1 A 21 A 11 1
In power grid calculations, submatrix A22 usually has a lower order, and in special cases A22 is scalar. Representing the sub-blocks of A by general matrices with the same order, take
A 11 = B 0 ,   A 22 1 = x l ,   A 12 = M l ,   A 21 = M l T
Then, the matrix inversion lemma can be expressed in the general form, as follows:
( B 0 M l x l 1 M l T ) 1 = B 0 1 B 0 1 M l ( x l + M l T B 0 1 M l ) 1 M l T B 0 1
Substituting B 0 1 = X into Equation (A9) yields Equation (A10)
( B 0 M l x l 1 M l T ) 1 = X X M l ( x l + M l T X M l ) 1 M l T X
Since the reactance matrix X is a symmetric matrix, there is X = XT, and Equation (A11) also holds true
( B 0 M l x l 1 M l T ) 1 = X X M l ( x l + M l T X M l ) 1 M l T X T

References

  1. Fotis, G.; Vita, V.; Maris, T.I. Risks in the European Transmission System and a Novel Restoration Strategy for a Power System after a Major Blackout. Appl. Sci. 2023, 13, 83. [Google Scholar] [CrossRef]
  2. Dong, X.; Cao, R.; Wang, B.; Shi, S.; Dominik, B. India blackout and three functions of protective relay. Power Syst. Prot. Control. 2013, 41, 19–25. [Google Scholar]
  3. Yi, J.; Bu, G.; Guo, Q.; Xi, G.; Zhang, J.; Tu, J. Analysis on Blackout in Brazilian Power Grid on March 21, 2018 and Its Enlightenment to Power Grid in China. Autom. Electr. Power Syst. 2019, 43, 1–6. [Google Scholar]
  4. Biswal, C.; Sahu, B.K.; Mishra, M.; Rout, P.K. Real–Time Grid Monitoring and Protection: A Comprehensive Survey on the Advantages of Phasor Measurement Units. Energies 2023, 16, 4054. [Google Scholar] [CrossRef]
  5. Ahmadinia, M.; Sadeh, J. A modified wide–area backup protection scheme for shunt–compensated transmission lines. Electr. Power Syst. Res. 2020, 183, 106274. [Google Scholar] [CrossRef]
  6. Alhelou, H.H.; Hamedani-Golshan, M.E.; Njenda, T.C.; Siano, P. Wide-Area Measurement System-Based Optimal Multi-Stage Under–Frequency Load-Shedding in Interconnected Smart Power Systems Using Evolutionary Computing Techniques. Appl. Sci. 2019, 9, 508. [Google Scholar] [CrossRef] [Green Version]
  7. Bolandi, T.G.; Talavat, V.; Morsali, J. Online vulnerability assessment of Zone-3 distance relays against static load Encroachment: A novel approach based on fault chain theory. Int. J. Electr. Power Energy Syst. 2023, 151, 9183. [Google Scholar] [CrossRef]
  8. Arumuga, M.; Reddy, M.J.B. An Intelligent Distance Relay Sensing Methodology Immune to Power Swing and Load Encroachment. IEEE Sens. J. 2023, 23, 800–811. [Google Scholar] [CrossRef]
  9. Saber, A.; Emam, A.; Elghazaly, H. Wide-Area Backup Protection Scheme for Transmission Lines Considering Cross-Country and Evolving Faults. IEEE Syst. J. 2019, 13, 813–822. [Google Scholar] [CrossRef]
  10. Senapati, M.K.; Sarangi, S. Secured zone 3 protection during load encroachment using synchrophasor data. Sustain. Energy Grids Netw. 2021, 27, 100522. [Google Scholar] [CrossRef]
  11. Dewangan, F.; Biswal, M. An adaptive time-frequency approach based secured back-up distance protection scheme for system stress conditions. Sustain. Energy Grids Netw. 2022, 31, 100732. [Google Scholar] [CrossRef]
  12. Mirhosseini, S.-S.; Akhbari, M. Wide area backup protection algorithm for transmission lines based on fault component complex power. Int. J. Electr. Power Energy Syst. 2016, 83, 1–6. [Google Scholar] [CrossRef]
  13. Venkatanagaraju, K.; Biswal, M. A Time-Frequency based backup protection scheme for enhancing grid security against power system blackout. Int. J. Electr. Power Energy Syst. 2022, 137, 107780. [Google Scholar] [CrossRef]
  14. Sengupta, A. Prevention of Load Encroachment Using Model Predictive Control. IEEE Trans. Power Deliv. 2021, 36, 3657–3670. [Google Scholar] [CrossRef]
  15. Shen, Z.; Sun, H.; Zhong, W.; Wang, A.; Zhao, B.; Xu, S. Key Event Based Analysis of Evolution Law of Cascading Failures in Power System with High Proportion of Renewable Energy. Autom. Electr. Power Syst. 2022, 46, 57–65. [Google Scholar]
  16. Liu, D.; Zhang, X.; Tse, C.K. Effects of High Level of Penetration of Renewable Energy Sources on Cascading Failure of Modern Power Systems. IEEE J. Emerg. Sel. Top. Circuits Syst. 2022, 12, 98–106. [Google Scholar] [CrossRef]
  17. Athari, M.H.; Wang, Z. Studying Cascading Overload Failures under High Penetration of Wind Generation. In Proceedings of the 2017 IEEE Power & Energy Society General Meeting, Chicago, IL, USA, 16–20 July 2017. [Google Scholar]
  18. Gao, X.; Peng, M.; Tse, C.K. Impact of wind power uncertainty on cascading failure in cyber-physical power systems. Phys. A Stat. Mech. Its Appl. 2021, 583, 126358. [Google Scholar] [CrossRef]
  19. Eissa, M.M. Challenges and novel solution for wide-area protection due to renewable sources integration into smart grid: An extensive review. IET Renew. Power Gener. 2018, 12, 1843–1853. [Google Scholar] [CrossRef]
  20. Shair, J.; Li, H.Z.; Hu, J.B.; Xie, X.R. Power system stability issues, classifications and research prospects in the context of high-penetration of renewables and power electronics. Renew. Sustain. Energy Rev. 2021, 145, 111111. [Google Scholar] [CrossRef]
  21. Yang, S.H.; Chen, W.R.; Zhang, X.X.; Yang, W.Q. A Graph-based Method for Vulnerability Analysis of Renewable Energy integrated Power Systems to Cascading Failures. Reliab. Eng. Syst. Saf. 2021, 207, 107354. [Google Scholar] [CrossRef]
  22. Biswal, S.; Swain, S.D.; Patidar, R.D.; Bhoi, A.K.; Malik, O.P. Integrated Wide-Area Backup Protection Algorithm During Stressed Power System Condition in Presence of Wind Farm. Arab. J. Sci. Eng. 2021, 46, 9363–9376. [Google Scholar] [CrossRef]
  23. Miao, S.; Ma, S.; Shang, Y.; Jiang, Z.; Hou, J.; Yu, Z. A Fast Recognition Method of Transmission Section Based on Cut-vertex and Path Search. Autom. Electr. Power Syst. 2014, 38, 39–45. [Google Scholar] [CrossRef]
  24. Nie, H.; Yuan, X.; Zhang, H.; Wang, F. Rapid flow transferring identification based on multiple line tripping and key branch set. Power Syst. Prot. Control. 2014, 42, 38–43. [Google Scholar]
  25. Zhang, B.; Chen, S.; Yan, Z. Advanced Power Network Analysis, 2nd ed.; Tsinghua University Press: Beijing, China, 2007; pp. 208–268. [Google Scholar]
  26. Liu, T. Theory and Methods of Modern Power System Analysis, 2nd ed.; China Electric Power Press: Beijing, China, 2016; pp. 262–271. [Google Scholar]
  27. Xu, Y.; Zhi, J. A Multi Control-node Emergency Control Strategy Based on DC Power Flow and Virtual Bus. Trans. China Electrotech. Soc. 2015, 30, 77–86. [Google Scholar]
Figure 1. The overall steps for searching for the CLS.
Applsci 13 09279 g001
Figure 2. Subgraphs and LE regions.
Applsci 13 09279 g002
Figure 3. The steps of the improved algorithm.
Applsci 13 09279 g003
Figure 4. Steps to derive the mathematical expression for APEV.
Applsci 13 09279 g004
Figure 5. The identification process of LE.
Applsci 13 09279 g005
Figure 6. Graph model and its dimension reduction of the IEEE 39-bus New England system.
Applsci 13 09279 g006
Figure 7. Comparisons between two methods. (a) Comparison of the APEV and the APMV between the two methods; (b) comparison of LEEs between the two methods.
Applsci 13 09279 g007
Figure 8. Comparison of the APEV and the APMV between two methods under different penetrations of wind power. (a) The penetration is 20%; (b) the penetration is 40%; (c) the penetration is 60%; (d) the penetration is 80%.
Applsci 13 09279 g008
Figure 9. Comparison of LEEs calculated by two methods under different penetration. (a) The proposed method; (b) the conventional method.
Applsci 13 09279 g009
Figure 10. Comparison of the overload branch’s LEEs calculated by the proposed and conventional methods. (a) The proposed method; (b) The conventional method.
Applsci 13 09279 g010
Table 1. Two shortest paths that constitute the CLS of branch 5-6.
PathsLength of the PathN
P1:5-8-7-60.0250 p.u.2
P2:5-4-14-13-10-11-60.0526 p.u.5
Table 2. LERPF.
Table 2. LERPF.
Branch k d k l Branch k d k l
5-8−0.660614-130.3307
8-70.672913-100.3007
7-60.672610-11−0.3002
5-4−0.340511-6−0.3289
4-140.2870
Table 3. Sensitivity and generalized sensitivity.
Branch k G k 26 G k i l Branch k G k 26 G k i l
5-8−0.0360−0.112214-130.31630.3545
8-7−0.1270−0.049313-10−0.2892−0.2545
7-6−0.1277−0.050110-110.28920.2520
5-4−0.4922−0.531511-6−0.3143−0.3523
4-140.02980.06295-60.1154-
Table 4. The simulation results after the faulty branch 5–6 is removed.
Branch kNumber P k 0 (MW) P k t (MW) P k (MW) P k (MW)αβ
5-8L1315.5611.7710.7714.030.09290.1601
8-7L2184.45495.62491.60492.090.00070.0072
7-6L3419.65733.87731.69726.660.00030.0099
5-4L4140.6911.7711.4914.730.02440.2010
4-14L5262.45394.49394.72393.450.00060.0026
14-13L6281.66432.61437.72439.730.01170.0162
13-10L7289.75427.00431.67434.500.01080.0173
10-11L8360.25223.22218.56215.500.00090.0358
11-6L9357.54207.41202.33200.110.02510.0365
Table 5. The nodes where the replaced generators are located and the corresponding wind active power output change value at two moments before and after branch 5-6 is removed.
PenetrationIncreased Wind Farm NodeΔGi (MW)The Proportion of Output to Installed Capacity
20%32, 36−50, −5084.9%
40%34, 37−40, −6084.4%
60%33, 35−50, −5084.7%
80%30, 39−20, −8084.9%
Table 6. The sensitivity of bus nodes to each branch within the CLS of branch 5-6.
5-88-77-65-44-1414-1313-1010-1111-65-6
Gk−320.0007−0.0319−0.0321−0.20980.19430.23810.26200.73800.7543−0.2035
Gk−16−0.0102−0.1000−0.1008−0.48550.1504−0.3717−0.33980.33980.3694−0.4974
Gk−37−0.0536−0.1410−0.1420−0.4747−0.0185−0.2842−0.25980.28240.2824−0.5299
Gk−30−0.0623−0.1530−0.1541−0.4925−0.0368−0.2863−0.26170.26170.2846−0.5564
Gk−39−0.2758−0.3193−0.3215−0.2477−0.0300−0.1645−0.15030.15030.1636−0.5244
Table 7. The generalized sensitivity of bus nodes to each branch within the CLS of branch 5-6.
5-88-77-65-44-1414-1313-1010-1111-6
G k 32 l 0.1350−0.1688−0.1690−0.14050.13590.17080.20080.79910.8212
G k 16 l 0.3184−0.4347−0.4354−0.31610.0076−0.5362−0.48940.48910.5330
G k 37 l 0.2965−0.4976−0.4984−0.2943−0.1706−0.4594−0.41910.44150.4567
G k 30 l 0.3053−0.5274−0.5283−0.3031−0.4702−0.1965−0.42900.42870.4676
G k 39 l 0.0706−0.6722−0.6741−0.0692−0.3378−0.3378−0.30800.30770.3360
Table 8. The simulation results after branch 5-6 is removed under different penetrations of wind power.
Line Number P k 0 (MW) P k (MW)20%40%60%80%
P k (MW) P k t (MW) P k (MW) P k t (MW) P k (MW) P k t (MW) P k (MW) P k t (MW)
L1317.643.4219.2524.1049.7853.7881.6284.8893.3795.66
L2191.57498.72528.90547.06576.14594.02619.61637.48683.93701.04
L3426.81753.70783.92785.72831.24833.32874.78877.42939.27942.03
L4168.082.5925.4224.0955.7253.7487.3384.7998.9395.54
L5260.93400.41393.24392.57403.17402.88402.41402.62438.84421.64
L6299.47460.19478.46481.86527.47532.34581.09587.94612.05626.61
L7306.02452.16466.59470.84511.31517.10560.25568.08593.47603.57
L8343.98198.08133.67129.1687.6282.9038.7131.925.524.57
L9339.85180.00112.29108.1963.5757.5610.2710.6925.9627.28
Table 9. The LEEs calculated by two methods under different penetration.
20%40%60%80%
αβαβαβαβ
L10.25196.04680.080414.72510.039923.81870.024526.9708
L20.03430.09700.03100.19110.02880.27820.02500.4057
L30.00230.04250.00250.10560.00300.16420.00290.2499
L40.05238.30120.035519.74900.029131.73750.034335.8880
L50.00170.01960.00070.00620.00050.00550.03920.0530
L60.00710.04710.00920.15680.01180.27760.02380.3616
L70.00910.04130.011320.14360.01400.25640.01700.3349
L80.03370.34790.05390.58150.17540.83890.17210.9820
L90.03650.39890.09450.68020.04090.99060.05080.7929
Table 10. The time consumption of each link in the simulation process.
ScenariosSearch for CLS(s) Calculate   G k i l (s) Calculate the APEV(s)Identify LE(s)Total Time(s)
Single node with wind farm0.01600.01860.01800.02100.0736
Multi-node with wind farm20%0.01600.01860.01810.02100.0737
40%0.01600.01860.01820.02100.0738
60%0.01600.01860.01860.02100.0742
80%0.01600.01860.01870.02100.0743
Disclaimer/Publisher’s Note: The statements, opinions and data contained in all publications are solely those of the individual author(s) and contributor(s) and not of MDPI and/or the editor(s). MDPI and/or the editor(s) disclaim responsibility for any injury to people or property resulting from any ideas, methods, instructions or products referred to in the content.