Abstract
Understanding the in-game demands placed on athletes may allow practitioners to design improved training protocols to prepare athletes for competitive demands. This study aimed to quantify the competitive movement demands of professional American football athletes and to determine any inter-positional differences that may exist. Player tracking data were collected from 2018 to 2020 regular season games of the National Football League. Distance, maximum velocity, high-velocity efforts and distance, and acceleration and deceleration efforts and distance were used to evaluate competitive movement demands. To determine position-specific demands, each player was classified by their designated position, and velocity data from competitive games were used to develop position-specific velocity thresholds. One-way ANOVA and post hoc Bonferroni statistical analysis were used to determine inter-positional difference. Significant (p < 0.05) positional differences were found for all load metrics with respect to competitive game demands. Generally, wide receivers and defensive backs had faster maximum velocities, higher distances, and more acceleration and deceleration efforts and distance than other positions. Linebackers accumulated the most high-velocity efforts and distance. Lineman had the lowest values for all assessed metrics. These findings may assist the performance staff in developing improved training and return-to-play protocols with the aim of improving player performance and mitigating injury.
1. Introduction
American football is a field-based collision sport characterized by high intensity multi-directional movements and repeated high-velocity sprints separated by periods of rest [1,2]. The combination of high-intensity accelerations and decelerations, high-velocity running, and collisions from blocking and tackling, collectively, may place American football players at an increased risk for injury compared to other team sports [3]. In the National Football League (NFL), 60% of all injuries occur in the lower extremity, resulting in a considerable number of player-days missed [4]. As such, the prevention and treatment of lower extremity injuries remain a priority for medical and performance staff aiming to maximize player availability. While many lower extremity injuries are multifactorial in nature [5,6,7,8], the literature has found a relationship between player workloads and soft tissue injury [9,10]. A deeper understanding of the position-specific game demands may assist practitioners in developing training programs to prepare athletes for competition and potentially mitigate injury risk [11]. Furthermore, understanding competitive demands may provide increased insight to position-specific training programs to better optimize on-field performance [3,11].
The utilization of wearable sensor technology for player tracking has been commonplace in team sports for over a decade and has facilitated the understanding of movement demands across competition and training [12]. The technology, including global positioning systems (GPS) and local positioning systems (LPS), has been validated within the scientific literature for the quantification of athletic movements associated with team sport, including distance, velocity, and acceleration [13,14,15,16,17]. Recently, this technology has emerged in American football to provide greater context around the physical requirements of the sport, which have previously relied on observational reports [18].
Much of the reported data associated with game and training demands in American football have been conducted at the high school [19] and collegiate [3,20,21,22] levels. These studies have generally found that players on the offensive and defensive lines accumulated less total distance and high velocity distance compared to non-linemen [3,19,20]. Conversely, linemen tend to engage in a higher volume of collisions and contacts compared to other positions [22]. These positional trends represent a useful starting point for exploring the physical activities of the game but may lack specificity to the capabilities of an elite professional athlete during an NFL game.
Ward et al. [10] reported on the movement demands of NFL players during practice and reported differences in running volumes, intensities, and sport-specific movements across positions. They found that defensive backs and wide receivers had a greater total distance than other positions, while offensive and defensive linemen had the largest number of sport-specific movements. These authors also found that distances observed in their study were greater than those reported during a collegiate football practice [10]. These authors were the first to report on position-specific movement demands of NFL football players; however, these data were collected on a single team during one preseason training camp. Due to the limited number of datasets, these findings may not be representative of every NFL football team. Furthermore, the investigation did not provide detail on specific movement demands associated with competitive games.
In 2015, the NFL implemented a league-wide initiative, called Next Gen Stats (NGS), to quantify the movement demands of NFL players during games [23]. Through NGS, an LPS tracking system (Zebra Technologies, Lincolnshire, IL, USA) captured player data, including on-field location and velocity, during every game using ultra-wide band receivers and radiofrequency identification (RFID) tags installed in the players’ shoulder pads. These tracking data are processed to output metrics associated with movement, such as total distance and maximum velocity, along with acceleration and deceleration efforts. Zebra Technologies [24] reported the on-field position data to be accurate to within 15 cm. Hagan [25] used measured distances and timing gates to assess the velocities and distances traveled by six athletes in six different field tests. For all tests, he found an overall error of 0.83 m for every 45.7 m of distance and velocities were reported within 0.80 kmh−1. To date, the use of NGS player tracking data has been limited to use by NFL teams, for player health and safety initiatives, and to enhance viewer experience during television broadcasts [23].
This study aims to characterize the position-specific movement demands associated with a professional football game and to identify differences which may exist between position groups. Significant differences in competitive movements demands are hypothesized to exist between position groups.
2. Materials and Methods
NGS tracking data from 768 regular season games from the 2018–2020 seasons were retrospectively analyzed. Two RFID tags were affixed to the epaulet in the shoulder pads of every player; linemen had a third tag on their shoulder pads centered across the back. Tags were sampled at 10 Hz and used to quantify the locomotor activity of players during each game. While this technology was initially designed to capture movement during discrete plays, a substantial amount of activity is performed between plays as players run on and off the field. Therefore, the locomotor activity was collected while each individual was on the field of play starting with the opening kickoff through the end of the game. For this paper, the field of play was defined as within 0.91 m of the sideline and 4.57 m from the back of the endzone. Furthermore, a player had to participate in at least one play during the game to be included. To explore inter-positional movement demands, players were categorized into positions as designated by their respective NFL franchise: cornerbacks (CBs; n = 455), safeties (Ss; n = 450), defensive linemen (DLs; n = 732), linebackers (LBs; n = 667), offensive linemen (OLs; n = 779), quarterbacks (QBs; n = 182), running backs (RBs; n = 418), tight ends (TEs; n = 325), and wide receivers (WRs; n = 663).
Metrics calculated from the tracking data included distance, maximum velocity, high-velocity efforts and distance, acceleration efforts and distance, and deceleration efforts and distance. The operational definitions used to quantify these variables are detailed in Table 1. Values were summarized on a player–game basis to describe game demands while the player is on-field.

Table 1.
Load metric definitions.
The prior literature [22] found positional differences in maximum velocities; however, most authors used absolute thresholds to define sprinting and running velocities. An absolute threshold may indicate that certain positions never achieve sprinting velocities, failing to consider the individual sprinting capacity of the player. To account for distinct high-velocity capacities by positions, thresholds were determined relative to positional maximum velocities. Position-specific maximum velocity was defined as the 75th percentile value observed in all player–games in order to estimate the top velocity capabilities of all players within a position. This percentile was chosen over an average or median to account for different opportunities for players to achieve high velocities. Some players may have only participated in a limited number of plays and were not afforded the opportunity to achieve their true maximum velocity during a game.
Data are represented as mean ± standard deviation. Distributions illustrate the movement demands of all NFL players. One-way ANOVA determined the positional group main effects for each metric. Post hoc Bonferroni tests were used for all the main effects detected by one-way ANOVA to determine the statistical significance between positions. Alpha intervals were set an a priori at p-value ≤ 0.05 as the level of significance for statistical tests. Data were analyzed using the SciPy (1.5.1) and StatsModels (0.12.2) modules in Python v3.8.3.
3. Results
Data for all in-game variables are reported in Table 2. One-way ANOVA found significant main effects for all metrics (p < 0.01). Post hoc testing revealed a substantial number of statistically significant differences between positions (p < 0.05). To simplify reporting, findings are only reported where there was no significance between position groups for all tracking metrics. All other findings were found to be statistically significant (p < 0.05).
Table 2.
In-game player loads by position. Data are mean ± SD. Statistically insignificant between-position findings are reported in the final row. All others were observed to be statistically significant (p < 0.05).
In-game distance depended on the player’s position (Figure 1A). For offensive players, the WR traveled the greatest distance (3188 ± 1328 m), while the S and CB had the most distance defensively (3466 ± 1280 m, 3305 ± 1340 m). Linemen had the least distance per player–game at 2061 ± 1061 m (OL) and 2096 ± 811 m (DL), with no statistical difference observed between these positions. In-game distances of the QB were also not significantly different from LB and TE distances (Table S1).
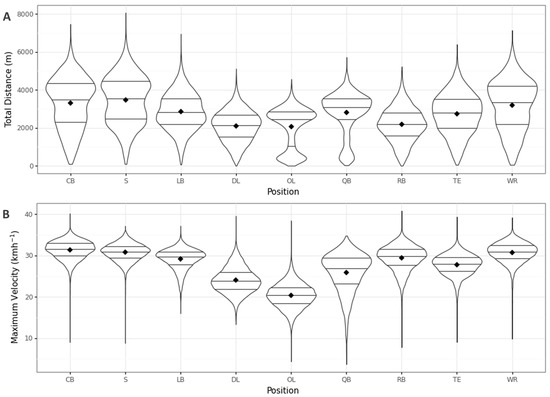
Figure 1.
Distribution of (A) total distance and (B) maximum velocity by an NFL player during a regular season game based on position group. Horizontal lines represent the 25th, 50th, and 75th percentiles, and the diamond denotes the average value for each position group.
Maximum velocities varied between positions (Figure 1B). The highest in-game velocities were achieved by the CB, S, and WR, reaching 31.4 ± 2.3 kmh−1, 30.8 ± 2.1 kmh−1, and 30.7 ± 2.5 kmh−1, respectively, while OL had the lowest maximum velocity (20.4 ± 3.0 kmh−1). The maximum velocities between S and WR were not significantly different (Table S2).
Using position-specific thresholds to define high velocity, the LB had the most high-velocity efforts (5.1 ± 4.3) and high-velocity distance (98.5 ± 101.0 m) in game compared to all other positions (Figure 2). Offensive linemen exhibited the fewest high-velocity efforts (1.4 ± 1.7) and distance per game (13.7 ± 19.9 m). Differences in high-velocity efforts were significant (p < 0.05) for all pairs of position groups except for the CB and S, CB and WR, and RB and TE (Table S3). Similarly, only the CB, WR, and S had statistically insignificant differences in high-velocity distance (Table S4).
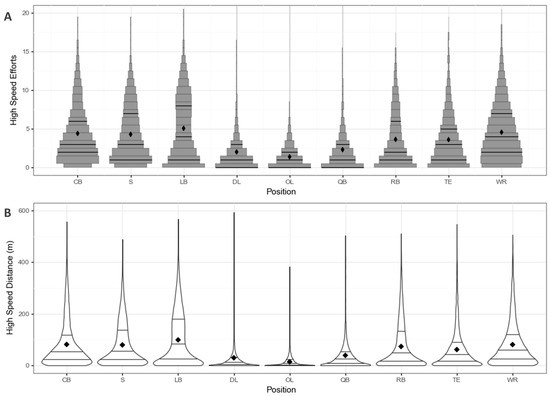
Figure 2.
Distribution of high-velocity (A) efforts and (B) distance traveled by an NFL player during a regular season game based on position group. Horizontal lines represent the 25th, 50th, and 75th percentiles, and the diamond denotes the average value for each position group.
Wide receivers performed the most acceleration efforts (65.7 ± 35.6) per game and distance traveled while accelerating above 3.5 ms−2 (88.5 ± 42.6 m), while OL had the fewest number of efforts (14.8 ± 14.4) and amount of distance (13.6 ± 10.3 m) per game among positions (Figure 3A,B). Differences in acceleration efforts were statistically significant (p < 0.05) among all positions except for the LB–S and QB–RB (Table S5). Acceleration distances were statistically significant for all positions except for the CB and S (Table S6).
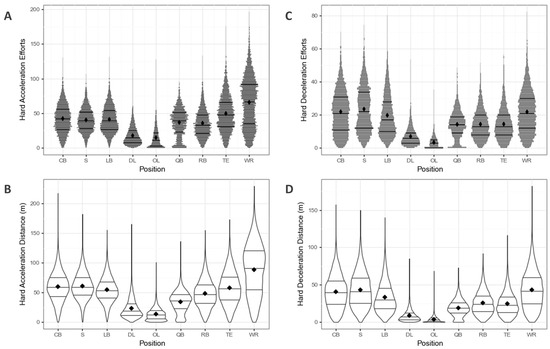
Figure 3.
Distribution of (A) acceleration efforts, (B) acceleration distance, (C) deceleration efforts, and (D) deceleration distance accumulated by an NFL player during a regular season game based on position group. Horizontal lines represent the 25th, 50th, and 75th percentiles, and the diamond denotes the average value for each position group.
Safeties had more deceleration efforts per game than any other position at 23.5 ± 13.5 (Figure 3C), while linemen had the fewest efforts (DL: 6.9 ± 5.4; OL: 3.3 ± 3.3). Statistical significance (p < 0.05) was seen between positions with few exceptions; the CB and WR were statistically similar as were the QB, RB, and TE (Table S7). Wide receivers traveled the most distance per game while decelerating below −3.5 ms−2 with 43.3 ± 24.6 m (Figure 3D). Defensive backs closely followed (S: 43.2 ± 23.2 m; CB: 40.7 ± 22.0 m). Offensive and defensive linemen averaged less than 10 m per game at these deceleration levels (3.5 ± 3.6 m and 8.7 ± 7.6 m, respectively). All positions were statistically different from one another (p < 0.05; Table S8).
4. Discussion
This novel study examined the positional movement demands associated with participation in an NFL football game and is the first to report on position-specific loads on professional football athletes. Positions have different roles to play during a game and different locomotor demands required of their role. Significant positional differences with respect to total distance, maximum velocity, high-velocity movements, and acceleration and deceleration actions were identified. In addition, similarities in locomotor demands were found between positions that compete against each other during gameplay. For example, the highest total running volume and maximum velocity were observed in WR on offense and defensive backs (CB, S) on defense. Conversely, linemen (OL, DL) performed the least amount of running and exhibited the lowest maximum velocity compared to other positions. High-velocity efforts, acceleration, and deceleration efforts displayed variability between positional groups, suggesting movement activity is dependent on the in-play requirements for each group. Collectively, in addition to describing the locomotor demand of American football, these findings are relevant to practitioners who are responsible for physically preparing athletes for competition.
The primary findings of this paper corroborate those of prior studies conducted on game play in lower levels of American football. In collegiate football matches, wide receivers and defensive backs performed the highest amount of total distance compared to other positions [3]. Similar observations were made at the high school level, where non-linemen positions accumulated greater total distance than linemen [19].
While such trends were observed to be consistent across levels of play, the average total game distance in this study was lower from that of Wellman and colleagues [3]. This difference might be because Wellman et al. tracked players while they were on the sideline as well as on-field, while this analysis only recorded on-field locomotor activities. Additionally, they quantified demands of a single collegiate team over one season, and their findings may be specific to how that team was coached; this research observed the demands of all NFL teams over multiple seasons. This could also explain the high variability within positions in this study. Teams compete with different tactical schemes depending on how they are coached, which could affect a player’s in-game demands. The team’s success or failure to execute in a game could also affect the metric, as teams with many scores and therefore many kickoffs may accumulate more distance at higher velocities. Participation levels may also contribute to the positional variability. Some players are starters and participate in most of a game’s offensive or defensive plays, while others may only substitute in for a handful. Additionally, players may primarily participate in special team plays, which may also contribute to the positional variability. This study did not assess variability within position groups; further work should be undertaken to delineate the nuances of these tactical schemes and situations.
Linebackers were observed to have the highest number of high velocity efforts (5.1 ± 4.3); however, this group also displayed the largest variability across player–games. These findings may be specific to the unique roles LB perform on the field; some primarily serve to rush the QB, others are required to play in space and cover offensive players in the passing game, and still others may be used primarily to stop running backs on rush plays. Future research is needed to clearly elucidate the nuanced actions of this diverse position.
The number of high-velocity efforts differ from the sprint counts observed by Wellman et al. [3] during collegiate football matches. Fewer high-velocity efforts were observed for WR, CB, and S than Wellman, while linemen had more high-velocity efforts in this study. These disagreements may be explained by differences in the thresholds set to define a high velocity or sprint effort. Wellman used an absolute cutoff of 23 kmh−1 as a sprint effort, which may over-classify sprint efforts for the faster players and under-classify sprint efforts for slower players [26]. Defining sprints based on an absolute threshold does not account for the sprint ability of slower positions, likely underestimating their high-velocity running during a game [26]. Similarly, it may overestimate the high velocity running by faster players. This study used a threshold of 85% of positional maximum velocity, which may offer a more robust representation of high-velocity activity by accounting for differences in maximum velocities and sprint capacity between positions. Such an approach could be extended in future research to create thresholds for individual athletes based on their in-game maximum velocity. One limitation of this study is that it does not examine player demands for running or other velocity zones; future studies should look at in-game loads at other thresholds. Additionally, further research should work to express the velocity demands during specific play types (run versus pass) or other discrete actions (e.g., different wide receiver routes).
Due to the start and stop nature of the sport and the small spaces within which players must navigate, acceleration and deceleration become a vital component of the game. Using a threshold of 3.5 ms−2, WR performed the most acceleration efforts, followed by TE on offense. On defense, S had the highest number of acceleration efforts, with LB closely following. These observations may be specific to the unique demands of tight ends and linebackers, who compete against each other. These two groups represent a hybrid or transitional type of player who is larger and not as fast as the wide receivers and defensive backs but smaller and faster than the linemen [18,27]. As such, they perform a substantial amount of activity in small spaces, often hitting and colliding with other players, where the ability to accelerate is required.
The acceleration and deceleration findings within this study were similar to observations made at the collegiate level [3], where the wide receiver and defensive backs exhibited more maximum intensity acceleration and deceleration efforts than other positions. However, the number of efforts observed for NFL athletes was greater across all positions than that seen in Wellman’s data despite a similar threshold being used. Athletic ability across a college team is more heterogenous than the NFL, as many of the collegiate players will not make it to the highest level of play. The NFL data may also be more reflective of the upper limits of physical performance for individuals playing the sport. More specific analysis is required to differentiate acceleration and deceleration activities during run and pass plays where positions may perform differently due to the structure of the play and the starting position of the players in the play (e.g., three-point stance versus standing up right).
The physical requirements within American football diverge based on the role of each position. Importantly, defensive players should have similar physical abilities to the offensive players they cover. Robbins [28] found that positions who compete against each other possessed complementary physical outputs during the NFL combine, suggesting potential similarities in game demands. For example, the WR runs routes at high velocities to create opportunities to receive a pass while defensive backs try to mirror them to defend or intercept the pass. These findings agree with the assumptions of Robbins, as the WR, CB, and S were observed to have similar amounts of high-velocity efforts and distance.
The same trend is not seen when looking at the deceleration efforts of positions who compete against one another. Generally, defensive players produced a larger number of deceleration efforts than their offensive counterparts. Defensive players face unique demands as they are forced to read and react to the play that the offense is trying to run. Thus, the defensive players may need to decelerate and change directions to respond to the actions of the offensive player they are defending.
In addition to not assessing inter-position variability, a limitation is that American football is a collision sport, and a substantial number of in-play activities are centered around blocking, hitting, and tackling. This paper presents one aspect of the physical demands of the game and allows for no understanding of the sport’s impact nature. For example, across all movement categories, OL and DL performed the lowest in-game volume and intensity. These positions are made up of the largest players on the field, and their role is to protect or attack the quarterback. As such, these players perform many collisions with each other, ultimately limiting their running-based actions. In NFL training camp practices, while these two positions were observed to perform less locomotor activity than other groups, inertial sensors captured their impact demands, providing a more complete picture of their physical requirements and a more holistic view of the sport in general [10]. Future research should seek to understand the collision-based nature of the sport in-game.
5. Conclusions
This study investigated the in-game locomotor demands of American football using player tracking technology during NFL football games and offers novel insight to the volume of running, maximum velocities achieved, and amount of high velocity, acceleration, and deceleration efforts that athletes perform across positional groups. These findings can be used by practitioners in the training process to optimize player preparation, improve performance, and mitigate injury risk by describing the position-specific competitive demands of these elite athletes. For example, data from this study may help performance coaches develop better training programs during the preseason by providing targets for the start of the regular season. Furthermore, descriptions of game demands may help with return to play protocols by providing a better understanding of the locomotor demands needed for a return to competition. Further studies should continue to explore player and position-specific movement during NFL games as well as examine how coaches develop training programs to optimize performance on game days.
Supplementary Materials
The following supporting information can be downloaded at: https://www.mdpi.com/article/10.3390/app13169278/s1, Table S1. Post-hoc results for in-game distance. Table S2. Post-hoc results for maximum velocity. Table S3. Post-hoc results for high velocity efforts. Table S4. Post-hoc results for high velocity distance. Table S5. Post-hoc results for acceleration efforts. Table S6. Post-hoc results for acceleration distance. Table S7. Post-hoc results for deceleration efforts. Table S8. Post-hoc results for deceleration distance.
Author Contributions
Conceptualization, E.S., L.W., T.W., P.W., B.P. and J.C.; Formal analysis, E.S.; Methodology, E.S., L.W., T.W., P.W. and B.P.; Supervision, L.W. and J.C.; Visualization, E.S., L.W., T.W., P.W. and B.P.; Writing—original draft, E.S., L.W., T.W., P.W. and B.P.; Writing—review and editing, A.W. and J.C. All authors have read and agreed to the published version of the manuscript.
Funding
Authors J.C., E.S. are paid consultants to the NFL. L.W., T.W., P.W., B.P. are employed at NFL clubs.
Institutional Review Board Statement
This study uses deidentified, aggregate data that are publicly available. Analysis of such data does not constitute human subjects research as defined at 45 CFR 46.102 and does not require IRB review.
Informed Consent Statement
These data do not require individual consent due to the Collective Bargaining Agreement between the NFL and NFL Players Association. The Players Association, as representatives of the individual players, have consented to use aggregated data for research purposes.
Data Availability Statement
Data were provided to the authors through NFL Next Gen Stats.
Acknowledgments
The authors gratefully acknowledge NFL Next Gen Stats for making this paper possible. The research presented was supported by the National Football League. The views expressed are solely those of the authors and do not represent those of the NFL or any of its affiliates.
Conflicts of Interest
Authors J.C., E.S. are paid consultants to the NFL. L.W., T.W., P.W., B.P. are employed at NFL clubs.
References
- Iosia, M.F.; Bishop, P.A. Analysis of Exercise-to-Rest Ratios During Division IA Televised Football Competition. J. Strength Cond. Res. 2008, 22, 332–340. [Google Scholar] [CrossRef] [PubMed]
- Rhea, M.R.; Hunter, R.L.; Hunter, T.J. Competition Modeling of American Football: Observational Data and Implications for High School, Collegiate, and Professional Player Conditioning. J. Strength Cond. Res. 2006, 20, 58–61. [Google Scholar] [CrossRef] [PubMed]
- Wellman, A.D.; Coad, S.C.; Goulet, G.C.; McLellan, C.P. Quantification of Competitive Game Demands of NCAA Division I College Football Players Using Global Positioning Systems. J. Strength Cond. Res. 2016, 30, 11–19. [Google Scholar] [CrossRef] [PubMed]
- Mack, C.D.; Kent, R.W.; Coughlin, M.J.; Shiue, K.Y.; Weiss, L.J.; Jastifer, J.R.; Wojtys, E.M.; Anderson, R.B. Incidence of Lower Extremity Injury in the National Football League: 2015 to 2018. Am. J. Sports Med. 2020, 48, 2287–2294. [Google Scholar] [CrossRef]
- Meeuwisse, W.H. Assessing Causation in Sport Injury: A Multifactorial Model. Clin. J. Sport Med. 1994, 4, 166–217. [Google Scholar] [CrossRef]
- Meeuwisse, W.H.; Tyreman, H.; Hagel, B.; Emery, C. A Dynamic Model of Etiology in Sport Injury: The Recursive Nature of Risk and Causation. Clin. J. Sport Med. 2007, 17, 215–219. [Google Scholar] [CrossRef]
- Gabbett, T.J. The Development and Application of an Injury Prediction Model for Noncontact, Soft-Tissue Injuries in Elite Collision Sport Athletes. J. Strength Cond. Res. 2010, 24, 2593–2603. [Google Scholar] [CrossRef]
- Windt, J.; Gabbett, T.J. How Do Training and Competition Workloads Relate to Injury? The Workload—Injury Aetiology Model. Br. J. Sports Med. 2017, 51, 428–435. [Google Scholar] [CrossRef]
- Li, R.T.; Salata, M.J.; Rambhia, S.; Sheehan, J.; Voos, J.E. Does Overexertion Correlate with Increased Injury? The Relationship Between Player Workload and Soft Tissue Injury in Professional American Football Players Using Wearable Technology. Sports Health 2020, 12, 66–73. [Google Scholar] [CrossRef]
- Ward, P.; Tankovich, M.; Ramsden, J.S.; Drust, B.; Bornn, L. Volume and Intensity Are Important Training Related Factors in Injury Incidence in American Football Athletes. In Proceedings of the Sloan Sports Analytics Conference, Boston MA, USA, 23–24 February 2018. [Google Scholar]
- Edwards, T.; Spiteri, T.; Piggott, B.; Haff, G.G.; Joyce, C. A Narrative Review of the Physical Demands and Injury Incidence in American Football: Application of Current Knowledge and Practices in Workload Management. Sports Med. 2018, 48, 45–55. [Google Scholar] [CrossRef]
- Theodoropoulos, J.S.; Bettle, J.; Kosy, J.D. The Use of GPS and Inertial Devices for Player Monitoring in Team Sports: A Review of Current and Future Applications. Orthop. Rev. 2020, 12, 7863. [Google Scholar] [CrossRef] [PubMed]
- Cummins, C.; Orr, R.; O’Connor, H.; West, C. Global Positioning Systems (GPS) and Microtechnology Sensors in Team Sports: A Systematic Review. Sports Med. 2013, 43, 1025–1042. [Google Scholar] [CrossRef] [PubMed]
- Hoppe, M.W.; Baumgart, C.; Polglaze, T.; Freiwald, J. Validity and Reliability of GPS and LPS for Measuring Distances Covered and Sprint Mechanical Properties in Team Sports. PLoS ONE 2018, 13, e0192708. [Google Scholar] [CrossRef]
- Chambers, R.; Gabbett, T.J.; Cole, M.H.; Beard, A. The Use of Wearable Microsensors to Quantify Sport-Specific Movements. Sports Med. 2015, 45, 1065–1081. [Google Scholar] [CrossRef] [PubMed]
- Linke, D.; Link, D.; Lames, M. Validation of Electronic Performance and Tracking Systems EPTS under Field Conditions. PLoS ONE 2018, 13, e0199519. [Google Scholar] [CrossRef]
- EPTS Testing Process. Available online: https://football-technology.fifa.com/en/media-tiles/epts-testing-process/ (accessed on 11 August 2021).
- Pincivero, D.M.; Bompa, T.O. A Physiological Review of American Football. Sports Med. 1997, 23, 247–260. [Google Scholar] [CrossRef]
- Gleason, B.H.; Sams, M.L.; Salley, J.T.; Pustina, A.A.; Stone, M.H. Global Positioning System Analysis of a High School Football Scrimmage. J. Strength Cond. Res. 2017, 31, 2183–2188. [Google Scholar] [CrossRef]
- DeMartini, J.K.; Martschinske, J.L.; Casa, D.J.; Lopez, R.M.; Ganio, M.S.; Walz, S.M.; Coris, E.E. Physical Demands of National Collegiate Athletic Association Division I Football Players during Preseason Training in the Heat. J. Strength Cond. Res. 2011, 25, 2935–2943. [Google Scholar] [CrossRef]
- Wilkerson, G.B.; Gupta, A.; Allen, J.R.; Keith, C.M.; Colston, M.A. Utilization of Practice Session Average Inertial Load to Quantify College Football Injury Risk. J. Strength Cond. Res. 2016, 30, 2369–2374. [Google Scholar] [CrossRef]
- Bayliff, G.E.; Jacobson, B.H.; Moghaddam, M.; Estrada, C. Global Positioning System Monitoring of Selected Physical Demands of NCAA Division I Football Players during Games. J. Strength Cond. Res. 2019, 33, 1185–1191. [Google Scholar] [CrossRef]
- NFL Next Gen Stats. NFL Football Operations. Available online: https://operations.nfl.com/gameday/technology/nfl-next-gen-stats/ (accessed on 11 August 2021).
- Zebra & The NFL. Official On-Field Player-Tracking. Zebra. Available online: https://www.zebra.com/us/en/nfl.html (accessed on 11 August 2021).
- Hagen, J. Gold Standard Testing of Motion Based Tracking Systems; Air Force Research Lab.: Riverside, OH, USA, 2017. [Google Scholar]
- Gabbett, T.J. Use of Relative Speed Zones Increases the High-Speed Running Performed in Team Sport Match Play. J. Strength Cond. Res. 2015, 29, 3353–3359. [Google Scholar] [CrossRef] [PubMed]
- Kuzmits, F.E.; Adams, A.J. The NFL Combine: Does It Predict Performance in the National Football League? J. Strength Cond. Res. 2008, 22, 1721–1727. [Google Scholar] [CrossRef] [PubMed]
- Robbins, D.W. Positional Physical Characteristics of Players Drafted into the National Football League. J. Strength Cond. Res. 2011, 25, 2661–2667. [Google Scholar] [CrossRef] [PubMed]


Disclaimer/Publisher’s Note: The statements, opinions and data contained in all publications are solely those of the individual author(s) and contributor(s) and not of MDPI and/or the editor(s). MDPI and/or the editor(s) disclaim responsibility for any injury to people or property resulting from any ideas, methods, instructions or products referred to in the content. |
© 2023 by the authors. Licensee MDPI, Basel, Switzerland. This article is an open access article distributed under the terms and conditions of the Creative Commons Attribution (CC BY) license (https://creativecommons.org/licenses/by/4.0/).