Abstract
The purpose of this paper is to investigate the developmental process of internal damage in prestressed concrete beams under static loading conditions. We conducted static loading tests on two prestressed reinforced concrete beams and one ordinary reinforced concrete beam. Acoustic emission (AE) technology was employed to dynamically monitor the entire process of the test beams simultaneously. The energy and ring count AE characteristic parameters were studied, and the frequency domain characteristics of acoustic emission signals from three test beams were analyzed. The actual failure process of the test beams was compared with the AE characteristic parameters and the waveform frequency distribution. Furthermore, the corresponding relationships between the actual failure process and the AE characteristic parameters were analyzed. Additionally, the frequency distribution of waveforms was examined. The obtained data, including deflection, strain, and prestress variation within the beams, were combined with theoretical calculations to explore the damage development law of simply supported reinforced concrete beams during the entire failure process. Comparative studies revealed a strong correlation between the actual failure processes of the three test beams and the AE characteristic parameters as well as the waveform frequency distribution. The strain variation trend of the ordinary reinforced concrete beam closely matched the AE signal characteristics, with the critical load often occurring at around 40% of the ultimate load. The strain and deflection variations of the prestressed reinforced concrete beams exhibited a robust correspondence with the AE signal characteristics. The critical load typically manifested at approximately 80% of the ultimate load. The ultimate load of the prestressed reinforced concrete beams decreased by approximately 20% under cyclic loading conditions compared to hierarchical loading.
1. Introduction
Concrete bridges have been widely used and developed in recent years. Regular bridge inspections are essential to ensure safe operation throughout their service life and prevent major disasters. These inspections help maintain the bridges in a safe working condition, ensuring their normal operation [1,2,3,4]. However, concrete structures are inherently compact, making it impossible to assess the development of internal damage based solely on their external appearance. Non-destructive testing methods are the preferred choice for detecting internal damage while avoiding any damage to the beams. Common non-destructive testing methods for detecting internal damage include acoustic emission, infrared thermography, impact-echo, ultrasound testing, microwave testing, and ground-penetrating radar [5,6]. Acoustic emission technology is a passive testing method, in contrast to other methods [7,8,9]. It involves analyzing elastic wave signals emitted from the material or internal structure of the bridge using sensors, enabling dynamic and non-intrusive detection and monitoring of structural damage. Acoustic emission technology, unlike active testing methods, does not require energy input as it relies on the reception of elastic wave signals.
Numerous experimental studies have shown that the ultimate failure of concrete structures results from the gradual development of internal microcracks. Scholars from various countries have extensively researched the evolution process of concrete cracks and their damage using different methods and theories [10,11]. In their study, Lacidogna et al. [10] examined the mechanical behavior of concrete and rock samples under constant-rate-to-failure loading conditions. They utilized acoustic emission (AE) and electromagnetic emission (EME) techniques for analysis. The result shows that the presence of AE signals has been always observed during the damage process. Magnetic signals are usually observed only when there is a sharp drop in stress or an eventual collapse. Habib et al. [12] combined AE characteristic parameters with the K-nearest neighbor (k-NN) algorithm to propose a concrete structure crack evaluation index (CAI). This method extracts important AEB features from recorded AE signals, such as rise time, decay time, peak amplitude, AE energy, and AE count. Based on AEB characteristics, the normal state, microcrack state and macrocrack state of concrete structures are effectively distinguished. Carpinteri et al. [12] developed a fractal multi-scale approach based on fracture mechanics and acoustic emission technology to predict the evolution of structural damage and failure time. Under load conditions, cracks rapidly develop and undergo multiple bifurcations, significantly increasing the irregularity of the fracture surface. Previous research has investigated crack bifurcation phenomena using fractal theory. It examines the crack bifurcation mechanism from the perspective of energy release and presents theoretical formulas describing the variation of fracture toughness with crack bifurcation angle [13].
Currently, acoustic emission (AE) technology is being applied to investigate concrete structures under various loading conditions [14], including bending, shear, and torsion. Scholars from both domestic and international contexts have successfully integrated AE technology with signal processing, mathematical modeling, and damage mechanics, achieving promising results [15,16,17,18,19]. For instance, the combination of Gaussian mixture models and AE technology effectively addresses the randomness of experimental data. The polling scheduling method effectively combines damage scalars from damage mechanics with AE technology to assess the evolution of concrete damage [20]. Zarastvand et al. [21,22] conducted a comprehensive review and summary of research on sound propagation prediction methods for plate structures from 1967 to the present. They also delved into the propagation and diffusion of waves in infinite hyperbolic laminated composite shells. Barile et al. [23] proposed using wavelet transform for analyzing recorded AE signals. The influence of material properties on AE signal propagation was characterized comprehensively through AE descriptors, waveforms, and wavelet analysis. The combination of the Weibull damage function and AE technology enables quantitative studies on the failure of fiber-reinforced concrete beams with varying water–cement ratios under pure torsion conditions [24]. The integration of fractal theory in AE technology provides theoretical guidance for analyzing the evolution of correlation dimensions of AE signal characteristic parameters in prestressed reinforced concrete beams [25].
The choice of AE devices for monitoring structural damage varies according to the type of building and monitoring requirements. In high-rise buildings and bridges, AE sensor networks and vibration sensors are commonly utilized to detect acoustic signals resulting from structural cracks or material fatigue. For dam and levee structures, AE sensors are employed to detect acoustic signals within soil and concrete components, thereby monitoring potential issues such as leaks and fractures. Additionally, strain sensors are integrated to monitor structural deformation and assess damage [26]. In underground structures like tunnels, AE sensors are deployed to monitor acoustic signals associated with cracks, leaks, or geological activities. Simultaneously, seismic monitoring equipment is employed to gauge the seismic-induced vibrations within subterranean structures. Within cultural heritage edifices, infrared thermography is commonly employed to track surface temperature fluctuations, aiding in identifying latent concerns such as humidity, leaks, or structural degradation [27,28]. Moreover, AE sensors are employed to capture internal acoustic signals within cultural heritage sites, offering insight into issues like sonic reverberations caused by structural degradation [29]. However, AE technology in the analysis of concrete damage evolution still has several limitations: (1) There is a lack of quantitative analysis and research on AE technology in the field of reinforced concrete research. (2) Concrete damage models need further optimization, and there is limited research on the influencing factors of damage evolution. (3) Further refinement is needed in the processing and parameter extraction of AE signals.
The study conducted static loading tests on reinforced concrete beams under three different working conditions. The study examined the mapping relationship between acoustic emission (AE) characteristic parameters and the damage of reinforced concrete beams. A comparative analysis was conducted to examine the variation patterns of AE parameters during the damage evolution process of the test beams in relation to the theoretical load values, strain test values, and deflection test values. The study confirmed the applicability of AE non-destructive testing technology and analyzed the impact of loading methods and prestressing on the damage of reinforced concrete beams.
2. Test Scheme Design and Implementation
2.1. Design of Test Beams
Three rectangular reinforced concrete beams were labeled as P1, P2, and P3. They were designed following the principles of concrete structural design. P1 is an ordinary reinforced concrete beam. P2 and P3 are curved reinforced concrete beams with prestressing applied using the post-tensioning method. The magnitude of the applied prestressing force is 120 kN. The reinforcement arrangement, excluding the prestressing bars, is the same for all beams. A low-relaxation 7Φs5 steel strand with a cross-sectional area of 139 mm2 was selected as the prestressing reinforcement for beams P2 and P3. The upper reinforcement in all three test beams consists of 2Φ12 steel bars. The lower longitudinal tensile reinforcement comprises 2Φ16 steel bars, resulting in a reinforcement ratio of 1.046%. The stirrups used are R235 grade steel, and the remaining hot-rolled ribbed steel bars are HRB335 grade. Ordinary 42.5R grade cement was used for the entire construction. Hinged supports were employed at both ends of the beams for the experiments. Detailed parameters for the simply supported beams are provided in Table 1, and the construction is illustrated in Figure 1.

Table 1.
Structural parameters of reinforced concrete test beams.
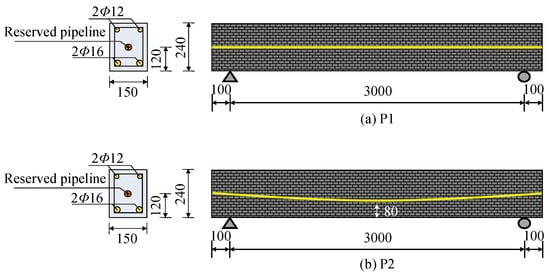

Figure 1.
Construction of reinforced concrete test beams (mm).
2.2. Loading Device and Acquisition System
The testing was conducted using the JN-020 1000 kN high-performance universal testing machine. The testing machine is equipped with an advanced electrohydraulic servo system, providing a maximum load capacity of 1000 kN. It is capable of delivering precise measurements and acquiring data under various loading conditions, as shown in Figure 2. The testing machine is equipped with high-precision sensors and controllers, allowing real-time monitoring and recording of the load parameters during the testing process.

Figure 2.
Loading device and equipment layout. The red arrows in the figure represent the physical image of the corresponding device. Serial number (1)–(8) indicates the number of the acoustic emission sensor.
Magnetic flux sensors were embedded inside the test beam during the pouring process, and they were connected to a magnetic field detector during testing. The internal prestressing of the beam was monitored in real time using the non-destructive testing technique of magnetic flux-force measurement. To comprehensively investigate the entire process of loading-induced failure in reinforced concrete beams, five strain gauges were installed on the test beam: one on the top surface, one on the bottom surface, and three on the sides, connected to strain gauge channels 1, 2, 3, 4, and 5, respectively. Furthermore, a dial gauge was installed at the mid-span of the bottom surface of the test beam to measure its deflection, as shown in Figure 2, for accurate positioning.
The AE detection system used the AE-DS5 series full-information acoustic emission signal analyzer, produced by Beijing Soft Island Technology Co., Ltd. It operated on a 220 V AC power supply and consisted of 16 AE signal channels and 8 additional external parameter channels. For this experiment, 8 channels were used, and RS-2A type sensors were employed as AE sensors. The 8 sensors were positioned around the perimeter of the rectangular test beam, as shown in Figure 2 and Figure 3. To effectively reduce external mechanical noise from impacts and friction [30], rubber pads were placed at the contact points between the loading hammer and the test beam. Additionally, the AE instrument was grounded.

Figure 3.
Acoustic emission detection system.
2.3. Loading Scheme
Before conducting the tests, theoretical calculations determine the ultimate load values. These values are used to design the hierarchical and cyclic loading rationally, ensuring experiment safety. The loading process of prestressed reinforced concrete beams P2 and P3 generally consists of three stages until failure: (1) loading until the neutralization of prestress, (2) continued loading until cracking occurs in the lower part of the test beam, and (3) cracking in the lower part of the test beam until failure occurs at the top of the beam span. Non-prestressed reinforced concrete beam P1 generally experiences stages (2) and (3) only. The calculation of critical loads for the failure process of test beams P2 and P3 is as follows:
- (1)
- The stress at the mid-span section during the neutralization of prestress is denoted as , and the moment for decompression is denoted as .
In the equation, Np represents prestress, e denotes eccentricity, A stands for the cross-sectional area of the test beam, y represents the distance from the centroid of the section to the calculated fiber, I represents the moment of inertia, and represents the flexural modulus of the converted section for the tension side.
In the equation, F1 represents the critical load at the stage of neutralizing prestress, q denotes the gravity equivalent uniformly distributed load, and l represents the length of the beam.
- (2)
- The cracking moment Mf and critical load F2 at the stage of continued loading until cracking occurs in the lower part of the test beam are determined as follows:
In the equation, represents the cracking stress of C40 concrete, which is assumed to be 2.4 N/mm2.
- (3)
- The ultimate flexural capacity Mu and critical load F3 at the stage of continued loading until failure occurs at the top of the beam span can be expressed as follows:
In the equation, fcd represents the design value of compressive strength of concrete. b denotes the width of the structural section. x represents the height of the compressed concrete zone. h0 is the effective height of the section. is the design value of compressive strength of the steel reinforcement. is the cross-sectional area of ordinary reinforcement in the compressed zone. is the distance from the resultant force of longitudinal ordinary reinforcement in the compressed zone to the edge of the section. Ap represents the cross-sectional area of longitudinal the prestressed reinforcement in the tension zone. As denotes the cross-sectional area of ordinary reinforcement in the tension zone. fy represents the design value of tensile strength of the steel reinforcement, and fpd represents the design value of tensile strength of the prestressed reinforcement.
The critical load F2’ for the P1 test beam is calculated using Equations (4) and (5). At the stage of neutralizing prestress, no loading is applied, and F1 in Equation (5) is set to 0. The ultimate flexural capacity Mu’ and critical load F3’ at the stage of continued loading until failure occurs at the top of the beam span can be expressed as follows:
In the equations, the parameters have the same meanings as mentioned above.
The theoretical values of critical loads at different stages of failure for the P1, P2, and P3 test beams are calculated and presented in Table 2.
Table 2.
Theoretical value of critical load at each stage of the test beam (kN).
The critical loads for different failure stages were determined through theoretical calculations. To achieve the experimental objectives, two loading methods, hierarchical loading and trapezoidal cyclic loading, were designed. Before the actual loading test, a lead break test was conducted to determine the propagation velocity of sound waves in the beam. Subsequently, a pre-loading procedure was conducted. The loading scheme is as follows. The loading mode diagram is shown in Figure 4.

Figure 4.
Test beam loading mode. (a) P1: hierarchical loading; (b) P2: cyclic loading; (c) P3: hierarchical loading.
(1) The P1 beam is a non-prestressed reinforced concrete beam. Due to the relatively small theoretical value of the failure load, a hierarchical loading approach is employed, with each level of loading increased by 5 kN until failure occurs.
(2) The P2 beam is a prestressed reinforced concrete beam with a relatively large theoretical value of the failure load. Therefore, a trapezoidal cyclic loading method is employed. Each level of loading increases by 20 kN. Initially, the load increases from 0 to 20 kN, then decreases to 10 kN, followed by an increase to 40 kN, and then a decrease to 10 kN, and so on. Once 60 kN is reached, the load increment per level is reduced to 10 kN. This loading pattern continues until the test beam fails.
(3) Similarly, the P3 beam is a prestressed reinforced concrete beam with a relatively large theoretical value of the failure load. However, unlike P2, the P3 beam uses a hierarchical loading approach. Initially, each level of loading increases by 10 kN. Once the load reaches 50 kN, the load increment per level is reduced to 5 kN. This pattern continues until the test beam fails.
3. Analysis of Test Results
3.1. P1 Beam Results
The P1 beam, a non-prestressed reinforced concrete beam loaded hierarchically, initially exhibits no significant changes as the load is applied. At a load of 10 kN, the first crack appears at the mid-span. At a load of 20–25 kN, strain gauges 4 and 5 lose their readings, and multiple cracks appear on the side of the beam, eventually forming a through-crack. With a further increase in load, multiple visible cracks appear at the bottom of the beam. At a load of 40–50 kN, significant bending of the beam is observed, and the percentage deflection continuously increases. At this point, the P1 beam is considered to have reached its ultimate bearing capacity. The flexural failure progression of the P1 beam is illustrated in Figure 5a–d. The mid-span strains and deflection of the P1 beam during the test are presented in Table 3.

Figure 5.
P1 test beam bending failure process diagram. (a) pre-test; (b) crack appearance; (c) multiple cracks; (d) beam bending. The red lines and frame in the figure indicate the crack locations.
Table 3.
Strain and deflection in span of P1 beam.
3.2. P2 Beam Results
P2 is a prestressed reinforced concrete beam subjected to trapezoidal cyclic loading. Due to its higher initial strength and stiffness than P1 beam, the deformations and the damage exhibit no significant changes during the early stages of cyclic loading which is less than 20 kN. Once a load of 40 kN is reached, multiple long cracks appear on the side of the P2 beam. Upon unloading and reloading up to 60 kN, multiple cracks form at the bottom of the beam, accompanied by slight splitting sounds. Additionally, the number of cracks on the side of the beam increases. Table 4 shows that strain gauges 3, 4, and 5 no longer provide readings, indicating that these gauges have been pulled apart, and through-cracks have formed. When loaded to 70 kN, the cracks at the mid-span rapidly expand with distinct explosive sounds. Upon unloading and further reloading to 74 kN, a significant number of explosive sounds occur, and the dial of the percentage gauge exceeds its range and continues to increase. The beam exhibits evident bending and a minor amount of concrete spalling, indicating that the P2 beam has experienced brittle failure. The flexural failure progression of the P2 beam is illustrated in Figure 6a–d. The significance of studying mid-span deflection and internal prestress in the P2 beam is limited due to its trapezoidal cyclic loading and thus is not further elaborated here.
Table 4.
P2 beam test data.

Figure 6.
P2 test beam bending failure process diagram. (a) pre-test; (b) multiple cracks; (c) midspan through-cracking; (d) top concrete crushed. The red lines and circle in the figure indicate the crack locations.
3.3. P3 Beam Results
The P3 beam, a prestressed reinforced concrete beam subjected to hierarchical loading, initially exhibits no significant changes during the early loading stages. By combining Figure 7a–d and Table 5, it can be observed that at a load of 40 kN, multiple vertical cracks appear in the beam accompanied by weak fracturing noise. When loaded to 60 kN, the cracks at the mid-span of the P3 beam significantly widen and increase in number. At 70 kN, strain gauge 5 breaks, indicating that the bottom of the beam has cracked. This load is preliminarily determined as the critical load for the P3 beam. With a further increase in load, strain gauges 3 and 4 gradually lose their readings. At a load of 80 kN, a through-crack appears at the mid-span with a maximum width of 2 mm. Relative sliding between the steel reinforcement and the concrete is observed, accompanied by a brittle cracking sound. When loaded up to 85 kN, strain gauges 1 to 5 all lose their readings, and the concrete at the top of the mid-span is crushed with an increased frequency of explosive sounds. At this point, the P3 beam is considered to have experienced brittle failure.

Figure 7.
P3 test beam bending failure process diagram. (a) pre-test; (b) multiple cracks; (c) midspan through-cracking; (d) top concrete crushed. The red lines and circle in the figure indicate the crack locations.
Table 5.
P3 beam test data.
4. Analysis of Acoustic Emission Technology Characteristics
4.1. Acoustic Emission Characteristic Parameter Analysis
Within the acoustic emission (AE) parameters, the energy signal reflects the total intensity of AE, while the ring count indicates the activity level of AE. Energy and ring count were selected as indicators to analyze the evolution of AE characteristic parameters during the entire failure process of the test beams. The results are presented in Figure 8 and Figure 9.

Figure 8.
Relationship between energy, ringing count, and load of P3 beam and P1 beam. (a) P3 beam energy–load changes with time; (b) P3 beam ringing count-load changes with time; (c) P1 beam energy–load changes with time; (d) P1 beam ringing count-load changes with time.

Figure 9.
Relationship between energy, ringing count, and load of P2 beam. (a) P2 beam energy–load changes with time; (b) P2 beam ringing count-load changes with time.
4.1.1. Analysis of the Characteristic Parameters of P3 and P1 Beams
Both the P3 and P1 beams were loaded using a hierarchical loading approach. The failure process of the prestressed reinforced concrete beam P3 can be divided into four stages based on variations in energy and ring count with load (Figure 8 and Figure 9): (1) 0–241 s, the compaction stage of the concrete in the beam; (2) 241–1449 s, stable expansion of internal micro-cracks in the beam; (3) 1449–1914 s, propagation and expansion of cracks throughout the beam; (4) 1914 s until the end of the test, complete failure of the beam. In contrast, the non-prestressed reinforced concrete beam P1 undergoes stages (2), (3), and (4) of the failure process, as it lacks the compaction stage of the concrete.
By combining Figure 8a,b, it can be observed that the presence of prestress in the P3 beam helps restrain the significant development of damage or cracks. However, the micro-cracks inside the concrete beam are still active, which will lead to the generation of acoustic emission signals. At the same time, a small amount of noise in the measurement channel will not completely disappear. Although the presence of prestress causes the P3 beam to undergo a process of overcoming the compressive moment in Stage 1, during which the corresponding load values range from 0 to 20 kN, the minimal acoustic emission (AE) signals are generated. As the prestress is overcome, the concrete in the beam starts to bear the load, and the beam enters Stage 2, where crack activity gradually intensifies. Compared to Stage 1, the AE signals show a significant and stable increase, with energy and ring count reaching approximately 1 V·ms and 7500 counts, respectively. Upon further loading to 70 kN, the beam enters Stage 3, which represents a transition stage towards the unstable failure of the P3 beam. This stage is short but shows a significant surge in AE signals, with energy and ring count increasing to approximately 3–4 V·ms and 35,000–45,000 counts, respectively. Continuing the loading process leads to Stage 4, in which the concrete in the beam undergoes complete failure. The AE signals significantly decrease, with energy and ring count maintained below 0.5 V·ms and 5000 counts, respectively.
From Figure 8c,d, it can be observed that due to the absence of prestress, the P1 beam does not go through the compaction stage of concrete. With increasing load, it directly enters the stage of stable crack expansion. Compared to the P3 beam, this stage is relatively short, with AE energy and ring count maintained below 2 V·ms and 12,500 counts, respectively. The corresponding load values range from 0 to 20 kN. At approximately 500 s, a through-crack appears in the beam, accompanied by a significant increase in AE signals. The energy and ring count reach around 27 V·ms and 190,000, respectively, occurring earlier than in the P3 beam. Subsequently, the P1 beam enters a relatively persistent stage of multiple crack occurrences, which lasts for approximately 1500 s. During this stage, the AE signals decrease significantly and remain relatively stable. The corresponding load values range from 20 to 45 kN. Around 2000 s, the AE signals experience another significant increase, indicating the complete failure of the beam. The corresponding load value is approximately 50 kN.
Based on the analysis above, the critical load for the P1 beam is determined to be around 20 kN, while the ultimate load is around 50 kN. This indicates that the critical load is approximately 40% of the ultimate load. Similarly, for the P3 beam, the critical load is around 70 kN, and the ultimate load is around 85 kN. The critical load represents approximately 80% of the ultimate load. Therefore, it can be observed that the load-bearing capacity of the ordinary reinforced concrete beam is significantly lower compared to the prestressed reinforced concrete beam.
4.1.2. Analysis of Characteristic Parameters of P2 Beam
The P2 beam, also prestressed, undergoes cyclic loading and shows distinct differences in the distribution of acoustic emission (AE) parameters compared to the P3 beam. Figure 9a,b show that before reaching a load of 60 kN, AE signals are only generated during the loading processes. However, during the loading process from 10 kN to 60 kN, a large number of dense AE signals are generated, with energy and ring count reaching approximately 11 V·ms and 110,000 counts, respectively. Similarly, noticeable AE signals are observed during the unloading process when returning to 10 kN. In each subsequent loading and unloading process after reaching 60 kN, AE signals are generated, but their intensity significantly decreases. The energy and ring count remain below 3.7 V·ms and 35,000 counts, respectively. This indicates that the P2 beam experiences severe damage when the load reaches 60 kN. When loaded to 70–75 kN, the concrete at the top of the mid-span of the P2 beam is crushed, accompanied by a significant number of AE signals, indicating complete beam failure. Additionally, through analysis, it was found that the distribution characteristics of energy and ring count closely follow the load. They are not significantly affected by prestress or loading methods.
4.2. Acoustic Emission Characteristic Waveform Analysis
This section further investigates the acoustic emission (AE) signal characteristics of the beam failure process by analyzing the AE signals of the three test beams using post-processing software for AE signal analysis. The AE signals underwent fast Fourier transform (FFT) processing to examine their waveform and frequency characteristics. Figure 10 illustrates the waveform and frequency characteristics of the AE signals for the P3 beam as an example.

Figure 10.
Acoustic emission signal and spectrum analysis at each loading stage. (a) The AE signal and its spectrum analysis in the compaction stage; (b) the AE signal and its spectrum analysis in the steady propagation stage of microcracks; (c) the AE signal and its spectrum analysis at the crack through propagation stage; (d) the AE signal and its spectrum analysis in the complete destruction stage.
Figure 10 shows that the AE signals of the P3 beam during the compaction stage are weak, with small amplitudes and a narrow frequency range, primarily concentrated around 165 kHz. During the stage of stable crack expansion, the internal energy of the beam continuously accumulates and releases, resulting in a large number of AE signals. However, their amplitude changes are relatively uniform. After undergoing fast Fourier transform (FFT) processing, it is found that the frequency range widens during this stage, mainly concentrated around 135 kHz and 175 kHz. During the experiment, at approximately 70 kN load (around 80% of the failure load), microcracks within the beam fully develop and extend. This leads to the formation of through-cracks, accompanied by a significant number of AE signals. Spectral analysis reveals a further widening of the frequency range, mainly concentrated around 175 kHz and 295 kHz. Therefore, 70 kN is considered the critical load for the P3 beam. As the load continues to increase and enters the stage of complete failure, the upper part of the test beam undergoes concrete crushing. During this stage, the waveform signals have reduced amplitudes compared to previous stages, and the frequency components are mainly concentrated around 165 kHz.
The P3 beam exhibits different central frequencies in each stage. The initial compaction stage and the stage of complete failure have only one central frequency. However, during the process of crack development and the formation of through-cracks, two central frequencies gradually change from low to high. Likewise, the central frequencies of each stage in the P1 and P2 beams can be obtained and are shown in Table 6.
Table 6.
Waveform analysis results of each test beam.
5. Result Discussion
This section compares the theoretical critical load values of each stage in the beam failure process with the results obtained from acoustic emission (AE) tests. Furthermore, a comprehensive analysis of the beam’s failure process is conducted. This analysis combines the collected data of mid-span strain, deflection, and prestress with the characteristics of AE signals.
5.1. Comparison of Critical Loads in Failure Stage
This section analyzes the relationship between the actual failure load and the theoretical values using the example of the P3 beam. As discussed in Section 3.3 and shown in Figure 8a,b, the load range determined from the acoustic emission (AE) test during the compaction stage precisely corresponds to the theoretical calculation of the load values for offsetting prestress and cracking of the bottom concrete of the beam, which is 19.92 kN. During the experiment, the load at which the top concrete of the mid-span was crushed was 85 kN, while the theoretical value was 89.92 kN, resulting in a difference of less than 5%. The strong correspondence between the failure stages identified based on AE signals and the actual calculation process indicates. This provides a robust validation of the rationale for dividing the failure stages based on AE signals.
5.2. Comparison of Acoustic Emission Signal and Strain Value
Figure 11 depicts the relationship between mid-span strain and load variation based on the strain data obtained from the beam in Section 3. From Figure 11a, when the P1 beam is loaded to 25 kN, the readings of strain gauges 4 and 5 at the mid-span disappear first. This indicates that these gauges have been pulled apart, and the bottom concrete of the mid-span has cracked. At this point, there is a significant increase in the acoustic emission (AE) signals, as shown in Figure 8c. When the load reaches 50 kN, strain gauge 1 at the top of the P1 beam loses its reading, indicating that the top concrete has also cracked, and the beam is completely damaged. During this stage, there is another increase in AE signals. This increase shows a good agreement between the strain data during the loading process of the P1 beam and the acoustic emission signals.

Figure 11.
Mid-span load-strain curve. (a) P1: load-strain curve; (b) P2: load-strain curve; (c) P3: load-strain curve.
From Figure 11b, it can be observed that when the P2 beam is loaded to around 60 kN, strain gauges 3, 4, and 5 are pulled apart, indicating the formation of through-cracks in the beam. This is accompanied by peak values in the acoustic emission (AE) signals, as shown in Figure 9a. Similarly, Figure 11c reveals that when the P3 beam is loaded to 70 kN, strain gauge 5 at the bottom of the mid-span suddenly shows no reading. This indicates that it has been pulled apart, and the bottom of the mid-span has cracked. As the load is increased from 70 kN to 75 kN, and strain gauges 3 and 4 also lose their readings. This indicates that they have been pulled apart, resulting in the formation of a through-crack at the mid-span. This is accompanied by a significant increase in the AE signals. The variation of strain with load in the P2 and P3 test beams is found to be in good agreement with the results obtained from the previous acoustic emission signal analysis.
5.3. Comparison of Acoustic Emission Signal and Deflection Value
Based on the experimental data presented in Section 3, the variation of mid-span deflection with load for P1 and P3 beams is shown in Figure 12.

Figure 12.
Mid-span load–deflection curves of P1 and P3 beams. (a) P1: load–deflection curve; (b) P3: load–deflection curve.
Figure 12a illustrates that the load–deflection curve for the P1 beam exhibits a roughly constant slope without significant inflection points prior to reaching 40 kN. The P1 beam undergoes the stages of stable crack propagation and through-crack propagation before reaching 40 kN, as evidenced by the characteristics of the acoustic emission (AE) signals. At the transition between these two stages, there are significant increases in AE signals. When the load is further increased to 50 kN, the P1 beam enters the stage of ultimate failure, which is reflected in an increased slope in the load–deflection curve. At this stage, the AE signal characteristics also show significant increases.
Figure 12b reveals that during the loading of the P3 beam from 0 to 10 kN, there is minimal change in deflection. As analyzed earlier, this stage corresponds to the balance between the external load and internal prestress. It leads to nearly zero stress at the mid-span section and minimal acoustic emission (AE) signals. When the load is in the range of 10 to 65 kN, two processes occur: the tensioning of the bottom concrete at the mid-span section until cracking and the combined action of the tensioned steel reinforcement and concrete after cracking occurs. Finally, when the load reaches 80 to 85 kN, there is a sudden increase in deflection. This phenomenon occurs as the beam approaches its ultimate load, where cracks and microdamage within the beam gradually accumulate and expand, leading to a sharp reduction in its rigidity and strength. Consequently, the beam’s deflection shows a significant increase at this stage due to its load-bearing capacity nearing its limit and being unable to withstand further loads, resulting in more significant deformations. At this point, the top concrete at the mid-span section of the test beam is crushed, indicating the complete failure of the beam. These observations lead to the conclusion that the four stages of loading and failure in prestressed concrete beams, as identified by the characteristics of AE signals, are not strictly separated but rather intertwined and overlapping. However, both the AE and deflection results show a notable deviation from the original trend as the load approaches 70 kN. This aligns with the occurrence of high-frequency, high-amplitude AE signals and the clear visibility of mid-span cracks, indicating that 70 kN can be considered a turning point in crack development.
5.4. Comparison of Acoustic Emission Signal and Prestress Value
An analysis of the prestress variation during the loading process of the P3 test beam was conducted. The load–prestress relationship is plotted in Figure 13. Figure 13 illustrates that the prestress in the P3 beam gradually increases at a relatively constant rate until the load reaches 80 kN. Although there are no significant variations in prestress, the analysis of the acoustic emission (AE) signal characteristics indicates that the P3 beam has already undergone the compaction stage, crack stable propagation stage, and crack breakthrough stage. This occurs when the beam is loaded to 80 kN. After reaching 80 kN, the test beam enters the stage of complete failure, indicating an imminent failure. At this stage, the rate of prestress growth significantly increases, and the numerical value rises noticeably. In conclusion, relying solely on the variation pattern of prestress with load is insufficient to accurately predict the various failure stages of the test beam.

Figure 13.
P3 beam load–prestress curve.
The analysis results from Section 5.1, Section 5.2, Section 5.3 and Section 5.4 indicate that the critical load values for the P1, P2, and P3 beams, when through-cracks appear, are approximately 20 kN, 60 kN, and 70 kN, respectively. On the contrary, the load–deflection curve of the P1 beam lacks a significant inflection point, whereas the load–deflection curve of the P3 beam displays noticeable inflections during the transitions between different failure stages. Similarly, the variation of prestress with load in different failure stages of the P3 beam shows no significant changes. Therefore, it can be concluded that relying solely on the collected data of mid-span strain, deflection, and prestress during the experimental process is insufficient to determine the critical load values for the various failure stages of the test beams. Therefore, it is necessary to utilize other methods such as acoustic emission to mutually validate the results and obtain more accurate timing of the occurrence of each failure stage in the beam.
6. Parameter Analysis
6.1. Effect of Loading Mode on Test Beam Damage
Both the P2 and P3 beams are prestressed reinforced concrete beams. The P2 beam is subjected to cyclic loading, while the P3 beam is subjected to hierarchical loading.
Comparing the experimental results and acoustic emission (AE) results of the P2 and P3 beams, it was observed that both beams exhibited no significant phenomena during the initial loading stage. When the load reached 40 kN, cracks started to appear in both the P2 and P3 beams, accompanied by detectable stable AE signals. At a load of 60 kN, multiple cracks emerged at the bottom of the P2 beam, accompanied by subtle splitting sounds. The strain readings from strain gauges 3, 4, and 5 vanished, indicating the formation of through-cracks. In contrast, when the load reached 70 kN for the P3 beam, the strain gauge readings vanished, and cracks formed at the bottom of the beam. Both the P2 and P3 beams demonstrated an increase in AE signals. With further load increase, the P2 beam underwent rapid crack propagation and brittle failure at 70–75 kN, whereas the P3 beam underwent the crushing of the top concrete and brittle failure between 80 and 85 kN.
The above analysis indicates that the use of hierarchical loading in pre-stressed reinforced concrete beams leads to an approximately 16.7% increase in the load required for the formation of through-cracks at the bottom of the beam. Additionally, there is an approximately 20% increase in the ultimate load resulting in complete failure, as shown in Figure 14a. This suggests that the cyclic loading method is more detrimental to prestressed reinforced concrete beams.

Figure 14.
The influence of each parameter on the failure stage of beam. (a) Influence of loading mode on failure stage of beam body; (b) influence of prestress on failure stage of beam.
6.2. The Law of Influence of Prestress on Test Beam Damage
Both the P1 and P3 beams were loaded using the hierarchical loading method. The P1 beam is an ordinary reinforced concrete beam, while the P3 beam is a prestressed reinforced concrete beam.
When comparing the experimental and acoustic emission results of the P1 and P3 beams, no significant changes were observed during the loading range of 0–10 kN for either beam. During this stage, the P1 beam exhibited weak acoustic emission signals, whereas the P3 beam showed no acoustic emission signals. The first crack appeared when the P1 beam was loaded to 10 kN, whereas the first crack appeared in the P3 beam at 40 kN. At a load of 20–25 kN, the strain gauge readings for the P1 beam vanished, indicating the formation of through-cracks and the presence of multiple cracks on the side of the beam. This was accompanied by a sudden increase in the acoustic emission signals. When the P3 beam was loaded to 70 kN, the strain gauge reading for gauge 5 vanished, indicating the formation of cracks at the bottom. Additionally, there was a significant increase in the acoustic emission signals. The P1 beam exhibited significant bending and a continuous increase in the percentage representation when loaded to 40–50 kN. Another substantial increase in the acoustic emission signals was observed, indicating that the P1 beam had reached its ultimate load-carrying capacity. In contrast, the P3 beam experienced complete failure when loaded between 80 and 85 kN.
Based on the comprehensive analysis, it was determined that the load required for the formation of the first crack in prestressed reinforced concrete beams increased by approximately twice compared to ordinary reinforced concrete beams. Similarly, the load for bottom crack formation increased by approximately three times. Moreover, the ultimate load increased by approximately 70%, as depicted in Figure 14b. These findings demonstrate that prestressed reinforced concrete beams possess a significantly enhanced load-bearing capacity compared to ordinary reinforced concrete beams.
7. Conclusions
This study performed static loading tests on simply supported reinforced concrete beams under three different conditions. Throughout the study, we examined the acoustic emission characteristics, beam deflections, strains, and prestress variations during the entire failure process. This investigation aimed to understand the propagation of damage in reinforced concrete beams. The main conclusions of the study are as follows:
- (1)
- The load values determined based on the acoustic emission characteristic parameters are in good agreement with the theoretical values. The load at which the top concrete of the P3 beam is crushed is determined to be 85 kN based on the acoustic emission characteristic parameters, which is within 5% of the theoretical load value of 89.92 kN. The strain variation trend of ordinary reinforced concrete beams correlates well with the acoustic emission signal characteristics. Furthermore, the strain and deflection variations of prestressed reinforced concrete beams closely align with the acoustic emission signal characteristics. This alignment provides additional validation for the accuracy of acoustic emission non-destructive testing.
- (2)
- The critical load for the prestressed reinforced concrete beam P3 is 70 kN, with an ultimate load of 85 kN. Typically, the critical load occurs at around 80% of the ultimate load during the process from intact to failure of the beam. In contrast, for the ordinary reinforced concrete beam P1, the critical load often appears at around 40% of the ultimate load. At the critical load point, significant acoustic emission signal characteristics are observed, and spectral analysis reveals a broad frequency range. Beyond this critical load, the beam experiences accelerated deterioration, indicating that it should no longer be used.
- (3)
- The ultimate load of prestressed reinforced concrete beams under cyclic loading conditions is approximately 20% lower than that under hierarchical loading conditions. Before reaching the critical load, significant acoustic emission signals are observed only during the loading process. There are no noticeable acoustic emission signals during the unloading process. However, after reaching the critical load, the unloading process continues to generate acoustic emission signals. This pattern can be utilized as a criterion for determining the critical load of prestressed beams subjected to cyclic loading.
- (4)
- During routine bridge operation and maintenance, it is advisable to use acoustic emission devices for structural damage monitoring when the maximum load on the bridge structure approaches 60% of the ultimate load. And a significant peak change in the acoustic emission signal analysis indicates proximity to the critical load. This stage suggests that the bridge structure may have developed or already experienced through-cracks, necessitating prompt reinforcement measures.
- (5)
- Further research should focus on noise signal filtering to achieve a more precise analysis of AE signal characteristics at different stages of failure. Changes in AE signals and wave velocities during the beam’s failure process can cause inaccuracies in AE source localization. Therefore, there is a need to explore the propagation behavior of elastic waves in beams with variable densities, with the aim of developing more accurate AE detection techniques. This will enhance the effectiveness and application of AE technology in structural health monitoring.
Author Contributions
Conceptualization, J.B. and J.Z.; methodology, Z.G. and J.Z.; software, Z.G. and J.Z.; validation, Z.G. and J.Z.; formal analysis, Z.G. and J.Z.; investigation, Z.G. and J.Z.; resources, J.B.; data curation, Z.G. and J.Z.; writing—original draft preparation, Z.G., J.Z. and Y.Z.; writing—review and editing, J.B. and J.Z.; visualization, Z.G., J.Z. and Y.Z.; supervision, J.B.; project administration, J.B.; funding acquisition, J.B. All authors have read and agreed to the published version of the manuscript.
Funding
This research was funded by the National Key R&D Program of China (grant No. 2021YFB2600600, 2021YFB2600605), the Key R&D Program of Hebei Province (grant No. 19275405D), and the Postgraduate Innovation Fund Project of Hebei Province (grant No. CXZZSS2023078).
Data Availability Statement
All data analyzed in this study have been included in this paper.
Acknowledgments
The author are thankful to Lei Yang who contributed to this study.
Conflicts of Interest
The authors declare no conflict of interest.
References
- Agrawal, A.K.; Washer, G.; Alampalli, S.; Gong, X.; Cao, R. Evaluation of the Consistency of Bridge Inspection Quality in New York State. J. Civ. Struct. Health Monit. 2021, 11, 1393–1413. [Google Scholar] [CrossRef]
- Abdallah, A.M.; Atadero, R.A.; Ozbek, M.E. A State-of-the-Art Review of Bridge Inspection Planning: Current Situation and Future Needs. J. Bridge Eng. 2022, 27, 03121001. [Google Scholar] [CrossRef]
- Tan, Y.; Fang, R.; Zhang, W.; Zhao, H.; Du, X. Theoretical Study on the Seismic Response of a Continuous Beam Bridge with Safe-Belt Devices. Soil Dyn. Earthq. Eng. 2021, 151, 106948. [Google Scholar] [CrossRef]
- Fang, R.; Zhang, W.; Chen, Y.; Zhang, L. Aseismic Effect and Parametric Analysis of the Safe-Belt Device for a Continuous Bridge with Equal Height Piers. Eng. Struct. 2019, 199, 109553.1–109553.19. [Google Scholar] [CrossRef]
- Rashidyan, S.; Ng, T.T.; Maji, A. Practical Aspects of Nondestructive Induction Field Testing in Determining the Depth of Steel and Reinforced Concrete Foundations. J. Nondestruct. Eval. 2019, 38, 19. [Google Scholar] [CrossRef]
- Xiao, H.; Qin, J.; Ogai, H.; Jiang, X. A New Standing-Wave Testing System for Bridge Structure Nondestructive Damage Detection Using Electromagnetic Wave. IEEJ Trans. Electr. Electron. Eng. 2015, 10, 157–165. [Google Scholar] [CrossRef]
- Aggelis, D.G.; De Sutter, S.; Verbruggen, S.; Tsangouri, E.; Tysmans, T. Acoustic Emission Characterization of Damage Sources of Lightweight Hybrid Concrete Beams. Eng. Fract. Mech. 2019, 210, 181–188. [Google Scholar] [CrossRef]
- Ren, D.; Liu, B.; Chen, S.; Yin, D.; Yu, M.; Liu, H.; Wu, L. Visualization of Acoustic Emission Monitoring of Fracture Process Zone Evolution of Mortar and Concrete Beams under Three-Point Bending. Constr. Build. Mater. 2020, 249, 118712. [Google Scholar] [CrossRef]
- An, T.; Zheng, X.; Zhu, D.; Qian, D.; Cao, J. Experimental Investigation of Pretensioned Bolts under Cyclic Loading: Damage Assessment Using Acoustic Emission. Int. J. Distrib. Sens. Netw. 2019, 15, 155014771984935. [Google Scholar] [CrossRef]
- Lacidogna, G.; Carpinteri, A.; Manuello, A.; Durin, G.; Schiavi, A.; Niccolini, G.; Agosto, A. Acoustic and Electromagnetic Emissions as Precursor Phenomena in Failure Processes. Strain 2011, 47, 144–152. [Google Scholar] [CrossRef]
- Iturrioz, I.; Lacidogna, G.; Carpinteri, A. Acoustic Emission Detection in Concrete Specimens: Experimental Analysis and Lattice Model Simulations. Int. J. Damage Mech. 2014, 23, 327–358. [Google Scholar] [CrossRef]
- Carpinteri, A.; Lacidogna, G.; Pugno, N. Structural Damage Diagnosis and Life-Time Assessment by Acoustic Emission Monitoring. Eng. Fract. Mech. 2007, 74, 273–289. [Google Scholar] [CrossRef]
- Yuan, L.; Xu, T.; Zhao, G.-F.; Yang, Y.-F.; Chen, G. Study of mode II crack propagation of quasi-brittle material under impact loading. Rock Soil Mech. 2011, 32, 8. [Google Scholar]
- Wang, Y.; Ge, L.; Zhang, T.T.; Zhou, L. Discussion of the Definition for Acoustic Emission Event in the Time Series of Concrete Damage Process. Russ. J. Nondestruct. Test. 2019, 55, 129–135. [Google Scholar] [CrossRef]
- Wu, L.-P.; Liang, T.-T.; Dai, P. Research progress of acoustic emission technology in the study of mechanical behaviors of concrete. Sci. Technol. Eng. 2018, 018, 168–174. [Google Scholar]
- Habib, M.A.; Rai, A.; Kim, J.-M. Performance Degradation Assessment of Concrete Beams Based on Acoustic Emission Burst Features and Mahalanobis—Taguchi System. Sensors 2020, 20, 3402. [Google Scholar] [CrossRef]
- Zhang, F.; Pahlavan, L.; Yang, Y. Evaluation of Acoustic Emission Source Localization Accuracy in Concrete Structures. Struct. Health Monit. 2020, 19, 2063–2074. [Google Scholar] [CrossRef]
- Van Steen, C.; Nasser, H.; Verstrynge, E.; Wevers, M. Acoustic Emission Source Characterisation of Chloride-Induced Corrosion Damage in Reinforced Concrete. Struct. Health Monit. 2022, 21, 1266–1286. [Google Scholar] [CrossRef]
- Mandal, D.D.; Bentahar, M.; El Mahi, A.; Brouste, A.; El Guerjouma, R.; Montresor, S.; Cartiaux, F.-B. Acoustic Emission Monitoring of Progressive Damage of Reinforced Concrete T-Beams under Four-Point Bending. Materials 2022, 15, 3486. [Google Scholar] [CrossRef]
- Ishibashi, A.; Matsuyama, K.; Alver, N.; Suzuki, T.; Ohtsu, M. Round-Robin Tests on Damage Evaluation of Concrete Based on the Concept of Acoustic Emission Rates. Mater. Struct. 2016, 49, 2627–2635. [Google Scholar] [CrossRef]
- Zarastvand, M.R.; Ghassabi, M.; Talebitooti, R. A Review Approach for Sound Propagation Prediction of Plate Constructions. Arch. Comput. Methods Eng. 2021, 28, 2817–2843. [Google Scholar] [CrossRef]
- Talebitooti, R.; Zarastvand, M.R. The Effect of Nature of Porous Material on Diffuse Field Acoustic Transmission of the Sandwich Aerospace Composite Doubly Curved Shell. Aerosp. Sci. Technol. 2018, 78, 157–170. [Google Scholar] [CrossRef]
- Barile, C.; Casavola, C.; Pappalettera, G.; Vimalathithan, P.K. Experimental Wavelet Analysis of Acoustic Emission Signal Propagation in CFRP. Eng. Fract. Mech. 2018, 210, S0013794418303357. [Google Scholar] [CrossRef]
- Arash, B.; Chai, H.K.; Navid, R.; Jumaat, M.Z. Damage Detection of SFRC Concrete Beams Subjected to Pure Torsion by Integrating Acoustic Emission and Weibull Damage Function. Struct. Control. Health Monit. 2016, 23, 51–68. [Google Scholar]
- Wu, C.; Shi, Q.-Y.; Yang, F. Experimental Study on Fractal Dimension of Acoustic Emissions on the Damage to Reinforced Concrete. J. Disaster Prev. Mitig. Eng. 2016, 36, 7. [Google Scholar]
- Rittgers, J.B.; Revil, A.; Planes, T.; Mooney, M.A.; Koelewijn, A.R. 4-D Imaging of Seepage in Earthen Embankments with Time-Lapse Inversion of Self-Potential Data Constrained by Acoustic Emissions Localization. Geophys. J. Int. 2015, 200, 758–772. [Google Scholar] [CrossRef]
- Liang, S.; Zhang, L.; Ge, D.; Wang, Q. Study on Pressure Relief Effect and Rock Failure Characteristics with Different Borehole Diameters. Shock and Vibration 2021, 2021, 3565344. [Google Scholar] [CrossRef]
- Chen, G.; Li, T.; Zhang, G.; Yin, H.; Zhang, H. Temperature Effect of Rock Burst for Hard Rock in Deep-Buried Tunnel. Nat. Hazards 2014, 72, 915–926. [Google Scholar] [CrossRef]
- Hassan, F.; Mahmood, A.K.B.; Yahya, N.; Saboor, A.; Abbas, M.Z.; Khan, Z.; Rimsan, M. State-of-the-Art Review on the Acoustic Emission Source Localization Techniques. IEEE Access 2021, 9, 101246–101266. [Google Scholar] [CrossRef]
- Liu, S.; Wu, C.; Zhou, J.; Liu, T.; Zhuang, S.; Luo, Y.; Yang, X. Relation between the Shear Stress Distribution and the Resulting Acoustic Emission Variation in Concrete Beams. Struct. Control. Health Monit. 2020, 27, e2528. [Google Scholar] [CrossRef]
Disclaimer/Publisher’s Note: The statements, opinions and data contained in all publications are solely those of the individual author(s) and contributor(s) and not of MDPI and/or the editor(s). MDPI and/or the editor(s) disclaim responsibility for any injury to people or property resulting from any ideas, methods, instructions or products referred to in the content. |
© 2023 by the authors. Licensee MDPI, Basel, Switzerland. This article is an open access article distributed under the terms and conditions of the Creative Commons Attribution (CC BY) license (https://creativecommons.org/licenses/by/4.0/).