Abstract
The high-altitude Hindu Kush-Himalayan region (HKH, average ~5 km from msl) and the adjacent Indo-Gangetic plains (IG plains, ~0–250 m msl), due to their geographical location and complex topography, are reported to be highly sensitive to climatic changes. Recent studies show that the impacts of climate change and associated changes in water resources (glacial/snow melt water and rainfall) in this region are multifaceted, thereby affecting ecosystems, agriculture, industries, and inhabitants. In this study, 45 years of Microwave Sounding Unit/Advanced Microwave Sounding Unit (MSU/AMSU)-derived mid-tropospheric temperature (TMT, 3–7 km altitude) and lower tropospheric temperature (TLT, 0–3 km altitude) data from the Remote Sensing Systems (RSS Version 4.0) were utilized to analyze the overall changes in tropospheric temperature in terms of annual/monthly trends and anomalies. The current study shows that the mid-tropospheric temperature (0–3 km altitude over the HKH region) has already alarmingly increased (statistically significant) in Tibet, the western Himalayas, and the eastern Himalayas by 1.49 °K, 1.30 °K, and 1.35 °K, respectively, over the last 45 years (1978–2022). As compared to a previous report (TMT trend for 30 years, 1979–2008), the present study of TMT trends for 45 years (1978–2022) exhibits a rise in percent change in the trend component in the high-altitude regions of Tibet, the western Himalayas, and the eastern Himalayas by approximately 310%, 80%, and 170%, respectively. In contrast, the same for adjacent plains (the western and eastern IG plains) shows a negligible or much lower percent change (0% and 40%, respectively) over the last 14 years. Similarly, dust source regions in Africa, Arabia, the Middle East, Iran, and Pakistan show only a 130% change in warming trends over the past 14 years. In the monthly breakup, the ‘November to March’ period usually shows a higher TMT trend (with peaks in December, February, and March) compared to the rest of the months, except in the western Himalayas, where the peak is observed in May, which can be attributed to the peak dust storm activity (March to May). Snow cover over the HKH region, where the growing season is known to be from September to February, is also reported to show the highest snow cover in February (with the peak in January, February, or March), which coincides with the warmest period in terms of anomaly and trend observed in the long-term mid-tropospheric temperature data (1978–2022). Thus, the current study highlights that the statistically significant and positive TMT warming trend (95% CI) and its observed acceleration over the high-altitude region (since 2008) can be attributed to being one of the major factors causing an acceleration in the rate of melting of snow cover and glaciers, particularly in Tibet and the Eastern Himalayas.
1. Introduction
The existence and stability of snow and ice cover on Earth are integral components of the global climate system. Glacier fluctuation due to climatic change is a natural occurrence that has been taking place throughout the history of the Earth. Over the past few decades, there has been a discernible shift in global climate patterns, exerting a pronounced influence on the high mountain glacial environment. Glaciers and discontinuous permafrost are exceptionally responsive to alterations in atmospheric conditions and changes in land cover, leading to changes in albedo. The Hindu Kush-Himalayan (HKH) region, which spans over 4,192,000 km2 in eight countries, is one of the most dynamic, fragile, and complex mountain systems. Renowned as the ‘Third Pole’, it holds the highest concentration of snow and glaciers outside the high-latitude polar regions [1]. The glacier meltwater of the HKH region sustains the ten largest river systems in South Asia, including the Amu Darya, Brahmaputra, Ganges, Indus, Irrawaddy, Mekong, Salween, Tarim Interior, Yangtze, and Yellow rivers. These rivers collectively provide vital resources to more than 1.3 billion people residing in the downstream basin regions [2]. The HKH region has already experienced discernible impacts attributed to changing climatic conditions. Numerous documented observations have highlighted the effects of climate change within the HKH region.
Studies have reported a concerning trend of heterogeneous mass loss in the HKH region for the past few decades. A thorough study of HKH glacier extent changes [3] reveals a slow and consistent retreat trend of Hindu Kush glaciers, especially in China, India, Nepal, and Pakistan, and a rapid retreat trend of more than the global average in Himalayan glaciers. However, over the Karakoram range, glaciers exhibit a more diverse response with comparatively less change and more stable conditions. A multi-temporal analysis and comparison study from 1991 to 2014 shows that the glaciers of the Ladakh range, Jammu and Kashmir, India, have shrunk by −12.8% (−45.3 km2) [4]. From 1968 to 2019, the Swetvarn and Thelu glaciers in the Rakvarn glacial valley of the Bhagirathi basin, Garhwal Himalaya, India, retreated by about 16.60% and 24.50%, respectively [5]. The largest glacier in the Sikkim Himalaya, Zemu, shrank by 30.67 ± 2.87% at a rate of 0.35% per year, and its snout retreated by ~797 ± 19.7 m at a rate of 9.1 ma−1 during the last 87 years between 1931 and 2018. However, the retreat rate has increased to ~20 ma−1 lately, from 2014 to 2018. A total of 147 glaciers from the Kashmir Himalaya show a notable loss of 28.82% (29.32 ± 12.09 km2) of covered area during the last 38 years. These glaciers covered an area of around 101 ± 16.79 km2 in 1980, which shrank to 72.41 ± 4.7 km2 in 2018. This recession is synchronous with the temperature increase during the period from 1980 to 2018 [6]. According to reports [7,8], 65 glaciers situated in the five mountain ranges of the North-Western Himalaya (the Karakoram range, the Zanaskar range, the Ladakh range, the Shamaswari range, and the Greater Himalaya) have shrunk to 1073 ± 24.6 km2 area in 2014 from 1106 ± 33.6 km2 in 1990, and the glacier volume has reduced to 211 ± 4.85 km3 from 219 ± 6.66 km3 during this period. Based on the glacier inventory prepared by the International Centre for Integrated Mountain Development (ICIMOD), Kathmandu, Nepal, 885 glaciers of the Bhutan Himalaya show around 23.3 ± 0.9% glacial cover fall-off between ~1980 and 2010, with a minimum fall-off of around 6.7 ± 0.1% (2000–2010) and a maximum of around 11.6 ± 1.2% (~1980–1990) [9]. Between 2000 and 2012, almost 12,243 glaciers with a 19,727 ± 1054 km2 area in the Upper Indus Basin of the Jammu and Kashmir Himalaya thinned by around −0.35 ± 0.33 ma−1. The highest and marginal thinning of −1.69 ± 0.60 ma−1 and −0.11 ± 0.32 ma−1 were observed in Pir Panjal and Karakoram glaciers, respectively. This thinning of glaciers is also influenced by topographic parameters [6].
In the western Himalayas, the total glacier cover of 77 glaciers in the Dras basin has dropped by 5.31 ± 0.33 km2 with a mean snout retreat of 155 ± 9.58 m (30 m to 430 m range) from 2000 to 2020 [7]. In the Chandra Basin, the glacier area dropped off to 608 ± 10.3 km2 in 2016 from 639.4 ± 5.8 km2 in 1971 at a rate of 0.7 ± 0.3 km2 per year, resulting in a total loss of 4.9 ± 1.9%, equivalent to 31.3 ± 11.8 km2 [10]. Reports show a 2.5% loss in glacier cover from 377.6 km2 to 368.2 km2 from 1980 to 2010 [11]. The average glacier snout retreated by 465.5 ± 169.1 m at an average rate of 15.5 ± 5.6 m per year during this period. Such extensive mass loss of Himalayan glaciers will have significant direct consequences for freshwater availability, irrigation, and hydropower generation, and can also increase the risk of glacial lake outburst floods (GLOFs) throughout Asia.
The large-scale glacial retreat observed worldwide since the latter half of the 1900s is widely attributed to global warming and climate change. Climatic elements such as monsoon circulation, wind patterns, temperature, and precipitation exhibit distinct characteristics between the western and eastern Himalayas, with the Tibetan Plateau also influencing their glacier retreat patterns. According to the projections of the Intergovernmental Panel on Climate Change (IPCC), the Asian land mass is expected to experience an average annual mean warming of approximately 3 °K by the 2050s and around 5 °K by the 2080s. However, it is anticipated that the Tibetan Plateau will undergo even more significant temperature increases [12]. The tropospheric warming trends between the western and eastern Himalayas and the Indo-Gangetic (IG) plains exhibit inequality in the magnitude of tropospheric warming trends in these regions [13]. Ice core studies from the Himalaya-Tibet region have identified the role of the South Asian monsoon and the mid-latitude westerlies in influencing the Himalayan glacier mass balance over millennial timescales and the intensified heating caused by dust and anthropogenic pollution, including black carbon, in the Indo-Gangetic (IG) plains, Himalayas, and Tibetan Plateau, affecting the temperature gradient and monsoon circulation [14,15,16]. Understanding the intricacies of climate change and their interaction with glacial dynamics is essential for devising effective policies and strategies to safeguard the Himalayan region and its dependent communities.
1.1. Atmospheric Temperature Trend (MSU/AMSU)
In order to estimate multidecadal changes in global atmospheric temperature, measurements from two different measuring systems, balloon-borne radiosondes and satellite-borne microwave-sounding equipment, have been largely used [17,18,19,20,21]. The Microwave Sounding Unit (MSU) and Advanced Microwave Sounding Unit (AMSU) were flown on a series of polar-orbiting weather satellites launched by NOAA in 1978 and 1998, respectively. The microwave measurements are constructed by merging measurements from both and are referred to as the MSU dataset. These satellite-based instruments provide measurements processed by different organizations and agencies to produce valuable data products that contribute to our understanding of climate dynamics, weather forecasting, and the detection of long-term temperature trends. The satellite microwave sounding observations of the lower troposphere and middle troposphere since 1979 show a rise in global temperature of 0.156 °K/decade and 0.091 °K/decade, respectively [22,23].
By incorporating the observed prevalence of vertically extended atmospheric brown clouds over the Indian Ocean and Asia into general circulation model (GCM) simulations [24], it is suggested that these clouds contribute significantly to regional lower atmospheric warming trends. The study proposed that the observed retreat of Himalayan glaciers could be attributed to the combined warming trend of 0.25 °K/decade associated with atmospheric brown clouds and greenhouse gas emissions. The findings indicate that the observed trend of warming in the mid-troposphere across west-central Asia in recent years has significant implications for the amplified variability of western disturbances and an elevated likelihood of intense winter precipitation events in the western Himalaya region [25]. However, the precise implications of this climate warming signal on the hydrological cycle of the HKH region are yet to be understood.
The long-term temperature trends in two cities, Delhi and Kolkata, in the Indo-Gangetic plains based on radiosonde data from 1973 to 2008 reveal that both cities experienced warming trends in the lower troposphere until 400 hPa, with the maximum increase occurring at 700 hPa [26]. A notable shift from cooling to warming trends occurred between 1958–1985 and 1973–2008. The study suggests that increased emissions from fossil fuels, urbanization, and aerosol distribution, including greenhouse gases and particulate matter, may have influenced these temperature trends, but further comprehensive observations are needed to establish their specific roles. Using radiosonde data, researchers in India have managed to examine the variability of annual and seasonal tropospheric temperature changes from 1971 to 2015 [27]. It was reported that the all-India mean annual temperature has experienced significant increasing trends at surface, 700 hPa, and 500 hPa levels, driven primarily by pronounced winter warming. Surface air temperatures in India have shown significant increases across all seasons. North and South India exhibit varying temperature trends, with surface and 700 hPa levels showing significant increases, influenced by differences in aerosol concentrations between the two regions. The layer average temperature was growing in the lower troposphere (surface–850 hPa) and falling in the lower stratosphere (100–50 hPa) in a trend study of 10 years of Aqua-AIRS sounding atmospheric temperature data over a few major Indian cities [28]. The decreasing trend in the lower stratosphere was found to be prominent. A literature review of the lower and middle tropospheric temperature trend studies in the HKH region using MSU datasets is tabulated below (Table 1).

Table 1.
Microwave Sounding Unit/Advanced Microwave Sounding Unit (MSU/AMSU) temperature trend over some of the regions in the Hindu Kush-Himalayan (HKH) region. TMT: temperature middle troposphere; TLT: temperature lower troposphere.
1.2. Climate Change Indicators: Glaciers
There has been a general trend of glacial retreat since the Little Ice Age, similar to many mountainous regions worldwide, but from the 1990s on, glacial retreat was more accelerated than during any other period in the 20th century [32]. On a regional scale, the glacier loss in the HKH region is influenced by its distinct climate variations, as the eastern part of the region experiences monsoonal-dominated precipitation during the summer, while the western part is influenced by mid-latitude westerlies bringing precipitation in the winter [33]. Individual glacier observations reveal that annual retreat rates differ from one basin to another, with some glaciers even advancing. The central Himalayan glaciers (from Uttarakhand to Bhutan) are receding at different rates than the western Himalayan glaciers [34]. The study also shows that the deglaciation rate in the Bhaga basin, western Himalayas, has drastically increased to 0.25% per year in the past two decades (2000–2020), compared to 0.12% per year in the previous decades (1971–2000). The Machoi glacier, distributed between the Greater Himalayan Mountain Range of Kashmir and Zanskar, experienced a shrinkage of 1.88 km2 area, equivalent to 29%, with a frontal retreat of 500 m at a rate of 10.6 ma−1 from 1972 to 2019 [35]. In the Trans-Himalayan Kang Yatze Massif, Ladakh, Northwest India, around 121 small glaciers have decreased in the area from 96.4 km2 in 1969 to 82.6 km2 in 2010 [36]. The loss in the glaciated area is 14% at a rate of 0.3% per year. Recent studies have reported shrinkage of glacier areas and surface elevation from 1975 to 2015 in the Kanchenjunga region of the Himalaya, which is attributed to increased air temperature [37]. The average change rates observed in the glacier area were −0.18 ± 0.07% a−1 and in the surface elevation were −0.32 ± 0.02 ma−1.
However, in the past two decades, the Karakoram mountains have been reported to be growing and showing stable or positive glacier budgets, known as the Karakoram anomaly [38,39,40]. A mass balance study of 19 glaciers covering 60% of the Astore basin, north-western Himalaya, using satellite images and DEM between 1999 and 2016 shows no net mass loss in that period, exhibiting a pattern similar to the Karakoram [41]. The inhomogeneous glacier response pattern across the Himalayas is linked to the interaction between increasing temperatures and the local topography [42]. The mean snow cover peak is observed in February, and the trough is in August and September from 2000 to 2017 across the entire HKH region [43]. Conducting a comprehensive examination of the long-term trend in upper air temperature within the high-altitude regions and evaluating its interplay with climatic dynamics would facilitate the comprehension of the fluctuations observed in the spatial distribution of snow and glacier coverage across the HKH region (Table 2).
Table 2.
Characteristics of the major glaciers and snow-covered regions in the Hindu Kush-Himalayan (HKH) region.
1.3. Importance of MSU/AMSU Datasets
The spatial distribution of meteorological stations providing long-term air temperature data is limited, especially in Himalayan and Tibetan regions, resulting in a lack of comprehensive coverage beyond their immediate vicinity [67]. This spatial data scarcity poses a significant obstacle when examining temperature variations across these heterogeneous regions. The ability to monitor the temperature of the planet and its atmosphere from orbit is made possible by remote sensing sensors. The data collected by Microwave Sounding Unit (MSU) and Advanced Microwave Sounding Unit (AMSU) sensors provide the longest continuous record of tropospheric temperature derived from satellite sensors. A dataset spanning over 45 years has been generated using measurements of brightness temperatures captured by the MSU and AMSU, which allows for long-term climate studies and trend analysis. This extensive dataset provides information on atmospheric temperatures across four distinct layers, including the lower, middle, and upper tropospheric and lower stratospheric regions.
MSU data sets have emerged as a potentially valuable tool for monitoring global temperatures. However, it monitors a physically different quantity than surface temperature. There is a fairly strong correlation between the temperature anomalies from the MSU and global surface datasets [68]. Recent studies have found a consistent and robust cooling trend of approximately 1–3 °K in the stratosphere as well as a consistent and robust warming trend of about 0.6–0.8 °K in the troposphere over the period of four decades from 1979 to 2018 [69]. The results remain consistent when comparing satellite-based average temperature measurements (MSU datasets) with vertically resolved radiosonde records. As most of the Himalayan high terrain plateau is situated above 4 km, the recorded tropospheric temperatures in this area primarily correspond to the mid-tropospheric temperature measured by the MSU.
The temperatures in mountainous areas are rising at a faster pace compared to the global average [70]. The glacial mass balance trends in the HKH region, being extremely sensitive to temperature changes, call for a holistic assessment of the long-term tropospheric temperature changes over the region and the factors inducing them.
The present study investigates the tropospheric temperature trends (lower and middle) over the Himalayan (western and eastern), Tibetan Plateau, Indo-Gangetic (IG) plains, and the major dust source regions in northern mid-latitudes that influence the Himalayan and IG plains [71] (Figure 1).
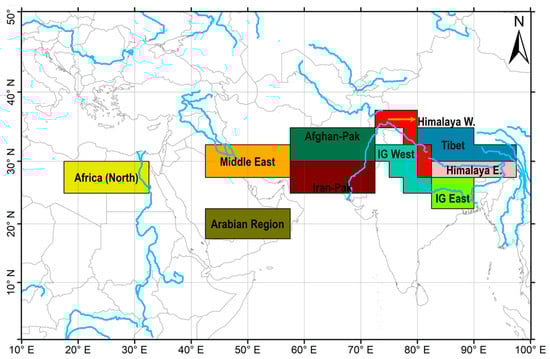
Figure 1.
The sub-division of the study region into high-altitude regions (Tibet, western and eastern Himalayas) and plains (western and eastern Indo-Gangetic plains (IG plains)). The major dust source regions of Asia-Africa affecting the IG plains and Himalayas are marked as Afghanistan-Pakistan, Iran-Pakistan-Thar desert, Middle East, Arabian region, and Sahara Desert.
2. Data Sources
RSS: MSU Temperature Data
The Remote Sensing Systems (RSS) provide a gridded monthly dataset of atmospheric temperature (lower and mid-tropospheric) since late 1978, derived from the satellite-based MSU and AMSU. The present study uses the latest versions of monthly mean tropospheric layer temperature (TMT: temperature middle troposphere; TLT: temperature lower troposphere) records from the MSU and AMSU available from the RSS. The complete dataset (1978–2022) is accessible online at the RSS website http://www.ssmi.com (latest v4.0; last accessed online on 18 January 2023).
From 1978 to 2005, a combined total of nine MSU instruments were used, followed by a sequence of AMSU instruments that commenced in the middle of 1998 and are still operational today. The Microwave Sounding Unit (MSU) operates by utilizing microwave radiation emitted by oxygen molecules in the Earth’s atmosphere to derive temperature profiles at different atmospheric layers. Molecular oxygen exhibits strong absorption lines around 60 GHz, allowing for the selection of specific frequencies to measure radiation from different atmospheric layers.
The MSU instruments, which are cross-track scanners mounted on polar-orbiting weather satellites, gather microwave radiance data across four channels within the range of 50.3 to 57.95 GHz. These channels are positioned on the lower edge of the Oxygen absorption band. The four channels enable the measurement of atmospheric temperature across four layers, starting from the lower troposphere in channel 1 and extending to the lower stratosphere in channel 4. Similar to the MSU, the AMSU component is a temperature sounder consisting of 15 channels. Among these channels, 11 (channels 4 through 14) are situated within the 60 GHz absorption complex, which makes them highly relevant for determining atmospheric temperatures at different altitudes above the Earth’s surface.
The specific MSU and AMSU channels that are combined to form the new TLT and TMT datasets that are used in this study are explained in [72,73]. The TLT and TMT records were extended beyond 2004 by merging data from channel 5 (AMSU5) in the newer AMSU instruments with data from channel 2 (MSU2) in the earlier MSU instruments. This long-term single-quality climate record suffers from several calibration issues, time variations, and diurnal variations that were addressed by several groups at Remote Sensing Systems (RSS), the University of Alabama, Huntsville (UAH), the University of Washington (UAW), the University of Maryland (UMD), and the NOAA National Environmental Satellite, Data, and Information Service (NOAA/NESDIS) [72,74,75,76], resulting in several different long-term Climate Data Record (CDR) versions for the different atmospheric layers (lower troposphere, middle troposphere, near the tropopause, and lower stratosphere). Determining trends from satellite data faces challenges such as calibration drift, temporal drift, and the need for inter-calibration among various satellites to ensure accurate and consistent measurements over time.
The stratospheric weight contributes significantly (5–15%) to the total, partially masking tropospheric warming [77]. Their analysis suggests that this effect led to a cooling influence of 0.04 °K/decade on global TMT trends from 1979 to 2005. Several lower tropospheric datasets were developed to minimize the impact of stratospheric cooling using different methods. The MSU instrument was used to quantify the weighted difference between near-limb and near-nadir images. Significant modifications were made to overcome calibration difficulties and time-varying biases [74,78]. The weighted combinations from multiple MSU channels were used, which depend on the vertical coherence of stratospheric trends to reduce stratospheric cooling [77]. The RSS v3.2 datasets were developed for the lower troposphere (TLT) and middle troposphere (TMT) and were specifically designed to eliminate stratospheric influences [73]. A comprehensive comparison of these datasets was conducted with homogenous radiosonde datasets, revealing a high level of agreement between the two. The present study provides error bounds that define the upper and lower limits of the TLT and TMT trend values to account for the uncertainty introduced by stratospheric contamination, if present.
In order to derive extended-term trends in tropospheric temperature using satellite data, it is crucial to remove the diurnally varying component from the observations. This step is essential due to the gradual shifts in the local observation times of the majority of satellites over time. As a result, the temperature measurements can be influenced by the natural daily temperature fluctuations caused by the Earth’s rotation and the Sun’s heating. A diurnal correction algorithm was derived for the tropics, where decadal-scale temperature changes in the lower troposphere indicated cooling [79]. Analysis revealed that the global trend (70° S to 82.5° N) of 0.193 °K per decade (1979–2003) was approximately 0.1 °K per decade higher compared to the trend calculated over the same geographical area based on the data [80]. Similarly, the trend observed in the tropics (20 °S to 20 °N) of 0.189 °K per decade was around 0.2 °K per decade warmer. This study suggested that the tropical troposphere experiences a slightly greater warming rate compared to the surface in most regions, aligning with expectations. Furthermore, the data is consistent with middle tropospheric findings obtained by removing the influence of the stratosphere from MSU2 data using MSU channel 4. This consistency indicates a measure of vertical consistency in RSS data.
NOAA’s Satellite Applications and Research (STAR) version 3.0 [81] scales the RSS diurnal cycle climatology to generate their version of the MSU/AMSU dataset. The UAH team determines the local diurnal slope by analyzing cross-scan differences [80]. Studies had confirmed that none of the models completely removed the effects of the diurnal cycle [75]. By adjusting GCM-derived diurnal cycles using information derived from comparing satellite observations at various local times, also known as the “optimized” or DIUR_OPT approach, an alternative model was used, resulting in the upgrade of the RSS V3.3 datasets to the RSS V4.0 datasets [82,83]. Long-term stable calibration methods to combine measurements from MSU and AMSU microwave sounders to produce long-term temperature lower troposphere (TLT) and temperature middle troposphere (TMT) products have been described in [72,73]. The RSS offers regularly updated TLT and TMT products, characterized by consistent and reliable long-term calibration. These products are valuable resources for evaluating climate change over decades.
3. Results
3.1. TMT Trend
The current study shows that mean temperature has already increased by 1.49 °K (0.330 ± 0.029 °K/decade), 1.30 °K (0.288 ± 0.028 °K/decade), and 1.35 °K (0.301 ± 0.027 °K/decade) over a period of 45 years in the Tibetan, western Himalayan, and eastern Himalayan regions, respectively. The western and eastern IG plains show a total increase of 0.80 °K (0.178 ± 0.025 °K/decade) and 0.79 °K (0.175 ± 0.021 °K/decade), respectively, for the same period. The warming trend in the dust source region ranges from 0.198 ± 0.025 °K/decade to 0.245 ± 0.025 °K/decade (Table 3). The notable features of the overall TMT anomaly, trend, and total change over specific regions (Table 3) are summarized below.
- The TMT trend in higher altitude snow and glacial-covered regions (average is 0.306 ± 0.028 °K/decade) is nearly double compared to the western and eastern IG plains (average is 0.176 ± 0.023 °K/decade) (Table 3).
- A previous study on the Tibetan region, western Himalayas, and eastern Himalayas from 1979–2008 revealed a warming trend of 0.008 ± 0.006 °K/year, 0.016 ± 0.005 °K/year, and ~0.016 °K/year, respectively. Thus, over the past 14 years, the percent change in the warming trends has been approximately 310%, 170%, and 80% in the Tibetan region, eastern Himalayas, and western Himalayas, respectively (Table 4).
- The IG west and IG east reportedly had a TMT warming trend of 0.018 ± 0.005 °K/year and 0.013 ± 0.004 °K/year, respectively, until 2008. The percent change calculation shows not much difference in IG west (0.018 ± 0.002 °K/year), but around a 40% increase in the warming trend of IG east over the past decade (last 14 years), with a TMT trend value now similar to IG west (0.018 ± 0.002 °K/year) (Table 4).
- The mean annual warming trend (1978–2022) over the dust source regions (ranging from 0.020 ± 0.002 °K/year to 0.025 °K/year) shows approximately 130% change in warming trends over the past decade compared to MSU temperature trend studies for the same dust source regions up to 2008 (ranging from 0.015 ± 0.006 °K/year to 0.022 ± 0.003 °K/year).
Table 3.
For mid-tropospheric temperature (TMT), the overall average anomaly (°K), trend, standard error (SE, °K/year), and total change (°K) as computed from the Microwave Sounding Unit/Advanced Microwave Sounding Unit (MSU/AMSU) data (1978–2022).
Table 3.
For mid-tropospheric temperature (TMT), the overall average anomaly (°K), trend, standard error (SE, °K/year), and total change (°K) as computed from the Microwave Sounding Unit/Advanced Microwave Sounding Unit (MSU/AMSU) data (1978–2022).
| Area Code | Area Name | Anom. (avg.) in °K | Anom. (st dev.) in °K | Trend (°K/year) | Trend SE (°K/year) | Trend (°K/decade) | Trend SE (°K/decade) | Total Change °K (1978–2022; 45 years) | Trend Is Significant |
|---|---|---|---|---|---|---|---|---|---|
| A | Tibet | 0.296 | 0.200 | 0.033 | 0.003 | 0.330 | 0.029 | 1.49 | Yes |
| B | Himalaya W. | 0.145 | 0.205 | 0.029 | 0.003 | 0.288 | 0.028 | 1.30 | Yes |
| C | Himalaya E. | 0.393 | 0.091 | 0.030 | 0.003 | 0.301 | 0.027 | 1.35 | Yes |
| D | IG West | 0.147 | 0.139 | 0.018 | 0.002 | 0.178 | 0.025 | 0.80 | Yes |
| E | IG East | 0.232 | 0.031 | 0.018 | 0.002 | 0.175 | 0.021 | 0.79 | Yes |
Table 4.
Mid-tropospheric temperature (TMT) trend using the Remote Sensing Systems (RSS) Microwave Sounding Unit/Advanced Microwave Sounding Unit (MSU/AMSU) (1978–2022, 45 years) data and its comparison with a previous report based on RSS MSU/AMSU (1979–2008, 30 years) data.
Table 4.
Mid-tropospheric temperature (TMT) trend using the Remote Sensing Systems (RSS) Microwave Sounding Unit/Advanced Microwave Sounding Unit (MSU/AMSU) (1978–2022, 45 years) data and its comparison with a previous report based on RSS MSU/AMSU (1979–2008, 30 years) data.
| Area Name | TMT Trend (°K/year) 1979–2008 (30 years) | TMT Trend (°K/year) 1978–2022 (45 years) | TMT Trend | |
|---|---|---|---|---|
| [13] | Current Study | Change | Percent Change | |
| Tibet | 0.008 | 0.033 | 3.125 | ~310% |
| Western Himalayas | 0.016 | 0.029 | 0.813 | ~80% |
| Eastern Himalayas | ~0.011 | 0.030 | 1.727 | ~170% |
| IG West | 0.018 | 0.018 | 0 | No increase |
| IG East | 0.013 | 0.018 | 0.385 | ~40% |
In the monthly breakup of warming trends (Table 5), it is notable that the Tibetan and eastern Himalayas show a relatively higher warming trend from November to March. The warming is found to be prominent during November, December, January, and March (Table 5 and Table 6, Figure 2). The notable features are:
Table 5.
Monthly breakup of mid-tropospheric temperature (TMT) trend and standard error (SE, °K/year), as derived from the Microwave Sounding Unit/Advanced Microwave Sounding Unit (MSU/AMSU) data over the last 45 years (1978–2022).
Table 6.
Monthly breakup of the average and standard deviation of the mid-tropospheric temperature (TMT) anomaly (°K) from the Microwave Sounding Unit/Advanced Microwave Sounding Unit (MSU/AMSU) data (1978–2022).
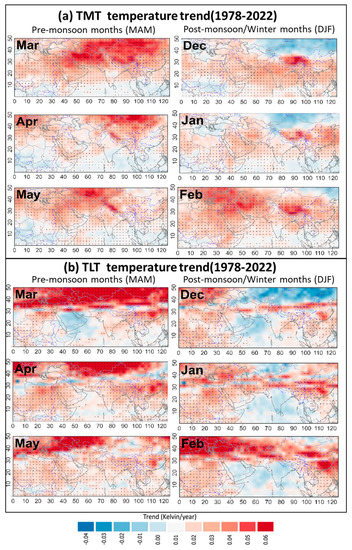
Figure 2.
The Microwave Sounding Unit/Advanced Microwave Sounding Unit (MSU/AMSU) (1978–2022)-derived temperature trend (°K/year) for pre-monsoon (March, April, and May, MAM) and post-monsoon/winter months (December, January, and February, DJF) for (a) mid-troposphere temperature (TMT) and (b) lower troposphere temperature (TLT). The dots on the trend maps indicate that the linear trend over the region (pixel or grid) is statistically significant.
- The western Himalayan region exhibits a strong seasonal TMT warming trend in the pre-monsoon months of March, April, and May (MAM), with a peak warming trend observed in March (0.015 ± 0.004 °K/year) and May (0.019 ± 0.005 °K/year) compared to the eastern Himalayas and the Tibetan region (Figure 2, Table 5).
- The peak temperature trend during November–March is observed in February for both the Tibetan region (0.034 ± 0.010 °K/year) and the eastern Himalayas (0.045 ± 0.013 °K/year). In contrast, the peak in the TMT trend for the western Himalayas is only 0.019 ± 0.005 °K/year, which corroborates the significant difference observed in the melting trends of glaciers and snow cover over the western Himalayas as compared to the Tibetan and eastern Himalayas.
- The IG west shows an increase in monthly warming trend from December to May, with peak trends in December (0.013 ± 0.006 °K/year), March (0.017 ± 0.006 °K/year), and May (0.014 ± 0.007 °K/year) (Figure 3).
 Figure 3. Monthly mid-tropospheric temperature (TMT) trend (°K/year) using the Microwave Sounding Unit/Advanced Microwave Sounding Unit (MSU/AMSU) data (1978–2022) over the high-altitude Tibet-Himalayan and adjacent plain regions.
 - The IG east also shows a monthly warming trend from December to March, with a peak trend in February (0.025 ± 0.009 °K/year) (Figure 3).
- The dust source regions show an increased warming trend in December, January, February, and March, with a peak trend in March (ranging from 0.027 ± 0.007 °K/year to 0.051 ± 0.013 °K/year), which coincides with the occurrence of peak warming in the IG west and western Himalayas (Figure 2).
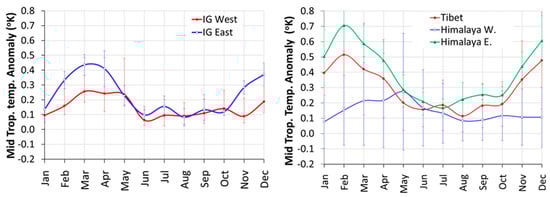
Figure 4.
Monthly mid-tropospheric temperature (TMT) anomaly (°K) using the Microwave Sounding Unit/Advanced Microwave Sounding Unit (MSU/AMSU) data (1978–2022) over the high-altitude Tibet-Himalayan and adjacent plain regions.
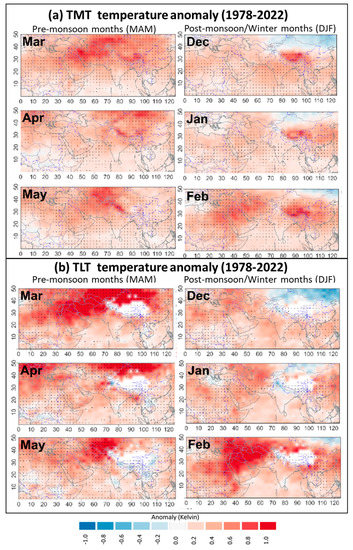
Figure 5.
The Microwave Sounding Unit/Advanced Microwave Sounding Unit (MSU/AMSU) (1978–2022)-derived anomaly (°K) for pre-monsoon (March, April, and May, MAM) and post-monsoon/winter months (December, January, and February, DJF) for (a) the mid-troposphere temperature (TMT) and (b) the lower troposphere temperature (TLT). The dots on the trend maps indicate that the linear trend over the region (pixel or grid) is statistically significant.
- The highest anomaly over the eastern Himalayas, with a peak in February (0.705 °K) and December (0.606 °K).
- Relatively, the anomaly in the western Himalayas is much lower in February (0.152 °K) and December (0.107 °K).
- Similarly, the TMT monthly anomaly is higher from November to March for Tibet, the Eastern Himalayas, and the IG plains (east and west) except for the western Himalayas, where the peak is in May (0.273 °K).
3.2. TLT Trend
It is observed that the lower tropospheric (0–3 km) temperature over the dust source (Afghan-Pak, Iran-Pak, Middle East, Arabian region, North African region) and dust sink regions (IG west, IG east) exhibits a general trend of warming (Table 7). Over a period of 45 years, there has been an average temperature increase of 1.01 °K in the dust source and sink regions. Specifically, the IG east region has experienced an annual mean trend of 0.70 °K (0.155 ± 0.029 °K/decade) between 1978 and 2022 (Table 7). This warming trend is more pronounced during six specific months, namely March, April, and May, and August, September, and October (Table 8, Figure 6). In the IG west, the pre-monsoon, monsoon, and winter months (June to January, except August) show a relatively negative TLT anomaly (Table 9, Figure 6). The important features are:
Table 7.
For lower troposphere temperature (TLT), the overall average anomaly (°K), trend, standard error (SE, °K/year), and total change (°K) as computed from the Microwave Sounding Unit/Advanced Microwave Sounding Unit (MSU/AMSU) data (1978–2022).
Table 8.
Monthly breakup of the lower troposphere temperature (TLT) trend and standard error (SE, °K/year), as derived from the Microwave Sounding Unit/Advanced Microwave Sounding Unit (MSU/AMSU) data over the last 45 years (1978–2022).
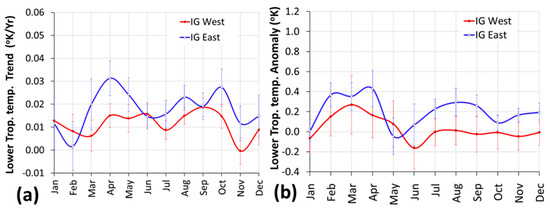
Figure 6.
The variation in (a) the monthly lower troposphere temperature (TLT) trend (°K/year) and (b) the monthly average of TLT “anomaly data (°K) from the Microwave Sounding Unit/Advanced Microwave Sounding Unit (MSU/AMSU) data (1978–2022).
Table 9.
Monthly breakup of the average and standard deviation of the lower troposphere temperature (TLT) anomaly (°K) from the Microwave Sounding Unit/Advanced Microwave Sounding Unit (MSU/AMSU) data (1978–2022).
During the period of March to June, the Indo-Gangetic Plain (IGP) is significantly influenced by locally produced and transported dust, primarily originating from dust source regions in western Asia, the Thar desert, and adjacent arid agriculture lands [84,85]. In general, the positive TLT anomaly during these months (Table 9) indicates the influence of the dust storm season. Although June exhibits higher aerosol concentrations, it is also a month characterized by a contrasting transition in the mid-troposphere temperature between the dust source and sink regions. This suggests that factors other than aerosols play a role in modulating the observed warming trends.
- The monthly breakup of the TLT trend of IG east (Table 8) shows an increase in warming trends during pre-monsoon months (MAM) ranging from 0.020 ± 0.011 °K/year to 0.031 ± 0.008 °K/year.
- The monthly TLT trends of IG west show an increase in warming trends from April to June, ranging from 0.014 ± 0.006 °K/year to 0.016 ± 0.005 °K/year. This can be attributed to the early arrival of the SW monsoon in the eastern Gangetic plains (first week of June) compared to the western Gangetic plains (last week of June), where the SW monsoon progresses rapidly from east to west during the month of June.
- The TLT anomaly (Table 9) in IG east shows a peak anomaly during February, March, and April (0.367 °K, 0.352 °K, and 0.428 °K, respectively), which is much higher compared to IG west, with a peak anomaly in the same months ranging from 0.152 °K to 0.165 °K.
4. Discussion
The mid-troposphere temperature (TMT, 3–7 km altitude) trend can be practically considered the lower troposphere temperature (TLT, 0–3 km altitude) trend over the high-altitude HKH region, where the average elevation is ~5 km. The TMT trend over the dust source, dust sink, and surrounding snow-covered and glacial regions (Himalayas and Tibetan Plateau) shows a statistically significant mean warming trend. The observed warming trends align with the overall warming of the tropical troposphere observed globally during the same period [69,86]. The HKH region is reported to show a warming of almost 1.8 °K by the end of the century [87].
The high-altitude glacial regions exhibit enhanced warming compared to other low-lying regions (Figure 7). The Tibetan region shows the highest warming trend, followed by the eastern Himalayas and the western Himalayas, respectively.
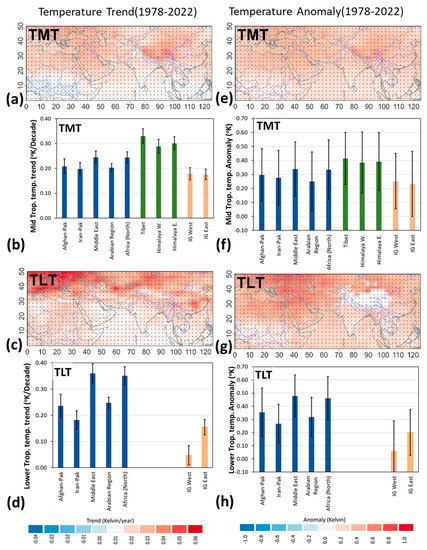
Figure 7.
The overall mid-troposphere and lower troposphere temperature (TMT/TLT) trend map (°K/year) (a,c), anomaly map (°K) (e,g), and its corresponding trend/decade (°K/decade) and anomaly (in °K) chart (b,f) and (d,h) over high-altitude Tibet, Himalayas (western and eastern), adjacent Indo-Gangetic (IG) plains (western and eastern), and dust source regions (as marked in Figure 1). The dots on the trend maps indicate that the linear trend over the region (pixel or grid) is statistically significant.
The monthly breakup of warming trends (Table 5) exhibits that the high-altitude glacial regions clearly show enhanced warming during winter and pre-monsoon months (November to May) and a decline during the other half of the year with a relatively neutral or slightly positive trend.
In general, an inequality of warming trend can be observed between the western and eastern Himalayas, where the western Himalayas show a relatively higher warming trend in pre-monsoon months (peak in May, 0.019 ± 0.005 °K/year) compared to other months, while the eastern Himalayas show much higher warming trends in winter months (peak in December through February, average of 0.041 ± 0.012 °K/year) compared to pre-monsoon months.
Previous studies had reported the unequal distribution of TMT warming with enhanced warming of the western sides of the Himalayas and IG plains compared to the eastern sides in the pre-monsoon months [13,30]. Significant dust storms originating from arid and desert areas in Africa, Arabia, and western India, including the Thar Desert, occur during the pre-monsoon season (April–June) in the Indian Gangetic (IG) plains [71,88]. These dust storms, along with locally produced anthropogenic pollutants, affect the entire IG plains during the pre-monsoon. The frequency and impact of these dust storms are higher in the western region and relatively lower in the eastern part of the IG plains. These dust-laden air masses form a layer of aerosols along the foothills of the Indian Himalayas, contributing to the “elevated heat pump” (EHP) mechanism [15,89]. This mechanism enhances convection, causing the vertical advection of dust aerosols to higher altitudes, increasing the seasonal heating during pre-monsoon (MAM) months, and resulting in a decreasing gradient of aerosol optical depth (AOD) towards the east [90,91]. Though the seasonal anomalous heating of the western Himalayas and IG west during MAM months was distinctly identified by the study, the disappearance of the decreasing TMT gradient from west to east and the strong jump in TMT trends in the eastern Himalayas and IG plains are conspicuous.
The annual TMT trends derived in the present study for the IG west and IG east exhibit similar degrees of warming trends (Table 3), in contrast to the earlier works on the TMT trends derived for the IG plains. The annual TMT trends of the Himalayas also show a similar pattern, with not much contrast between the western and eastern Himalayas (Table 3). Previous studies had identified unequal annual TMT warming trends between the western (western Himalayas, IG west) and eastern (eastern Himalayas, IG east) sides of dust sink and snow-glacier cover regions from MSU-derived TMT trends for the time period 1979–2008, with the western Himalayas and IG west showing a much higher annual TMT trend than the eastern Himalayas and IG east [13]. The present study clearly reveals that the warming of the middle troposphere in the eastern dust sink and snow-glacier cover regions has alarmingly increased over the past decade (Table 4).
The changes in western disturbances over the western Himalayas suggest that significant warming of the Tibetan region in recent decades will result in stronger temperature differences between the middle and upper troposphere over the sub-tropics and mid-latitudes, causing the mean westerly winds to become more unstable, leading to greater variability in the occurrence of weather disturbances and an increased likelihood of heavy precipitation events over the western Himalayas [25]. The enhanced warming of the Tibetan region over the past decade, as observed in the present study, could explain the increased winter precipitation and the anomalous advancement of glaciers in the western Himalayas.
5. Summary and Conclusions
The Microwave Sounding Unit/Advanced Microwave Sounding Unit (MSU/AMSU) tropospheric temperature data was used to derive the annual and monthly mid-tropospheric temperature (TMT) and lower tropospheric temperature (TLT) trends over the Hindu Kush-Himalayan (HKH) region, adjacent dust sink areas of Indo-Gangetic (IG) plains, and western arid dust source regions for a period of 45 years (1978–2022). The major highlights of the study are:
- The MSU/AMSU-derived temperature trend shows a conspicuous rise in the warming trend over high-altitude regions (Tibet, western Himalayas, and eastern Himalayas) compared to adjacent plains (IG west, IG east).
- A comparison of the TMT trends for a period from 1979–2008 (previous reports) and 1978–2022 (present study, 45 years) shows a tremendous rise in the warming of the mid-troposphere over the last 14 years, as mentioned below:
- Tibet: ~3.1 times; the eastern Himalayas: ~1.7 times; and the western Himalayas: ~0.8 times.
- In contrast, the rise in TMT trend is nearly zero and ~0.4 times for the IG west and IG east, respectively. Similarly, for the dust source regions, it is ~1.3 times.
- The monthly breakup of TMT and TLT anomalies also reveals the influence of the east-to-west progression of the southwest monsoon over the IG plains.
- The current study highlights the acceleration in warming trends in the mid-troposphere over the high-altitude HKH region compared to adjacent IG plains.
- The current study highlights that the peak in the monthly decadal TMT trend is 0.33 to 0.34 °K/decade and 0.41 to 0.45 °K/decade for Tibet and the eastern Himalayas, respectively. In contrast, the same for the western Himalayas is only 0.19, 0.15, and 0.06 °K/decade for May, March, and December, respectively.
- According to multiple reports, the rate at which snow or glaciers are melting varies significantly between the western Himalayas and Tibet, as well as the eastern Himalayas. The findings indicate that this divergence can mainly be attributed to the distinct variations in regional tropospheric warming patterns.
- The western Himalayan glaciers are therefore expected to decline at a slower rate compared to the eastern Himalayas.
- A significant increase in tropospheric warming trends (1978–2022) was observed in all the study areas, including the Himalayan region, dust sink areas of the IG plains, and the western arid dust source regions, indicating an overall regional increase in mid-troposphere temperature trends over the past 45 years.
- The mid-tropospheric temperature warming trend is higher than the lower-tropospheric warming trend over the snow-glacier-covered regions, including the Tibetan region and Himalayas, and the dust sink regions of the IG plains.
- The higher-altitude snow-glacier-covered regions show higher annual TMT warming trends than the low-lying IG plains.
- A strong seasonal increase in the TMT warming trend over the western Himalayas and western IG plains is observed during pre-monsoon months (MAM) compared to other months and can be attributed to the influence of increased dust storm activity.
- In general, the TMT warming anomaly and trend are found to be relatively higher in November–April (NDJFMA months) as compared to May–October (MJJASO months) in the Indian sub-continent, leading to increased melting of glaciers and snow cover during the primary phase of the snow accumulation season in November–February (NDJF months).
Author Contributions
Conceptualization, N.D. and A.K.P.; methodology, N.D. and A.K.P.; software, N.D.; validation, N.D.; formal analysis, N.D., A.V., S.M., A.S., S.N.; investigation, N.D., A.V., S.M., A.S., S.N.; resources, N.D.; data curation, N.D.; writing—original draft preparation, N.D., A.V., S.M., A.S., S.N.; writing—review and editing, N.D., A.K.P.; visualization, N.D., S.M., A.V.; supervision, A.K.P.; project administration, A.K.P.; funding acquisition, A.K.P. All authors have read and agreed to the published version of the manuscript.
Funding
This research received no external funding.
Institutional Review Board Statement
Not applicable.
Informed Consent Statement
Not applicable.
Data Availability Statement
The complete dataset (1978–2022) used in this study is accessible online at the RSS website http://www.ssmi.com (latest v4.0; last accessed online on 18 January 2023).
Acknowledgments
We acknowledge the laboratory and equipment support received from the Photogeology and Image Processing Laboratory, Department of Applied Geology, Indian Institute of Technology (Indian School of Mines), Dhanbad.
Conflicts of Interest
The authors declare no conflict of interest.
References
- Dyhrenfurth, G.O. To the Third Pole: The History of the High Himalaya; Laurie, W., Ed.; Werner Laurie: London, UK, 1955. [Google Scholar]
- Xu, J.; Grumbine, R.E.; Shrestha, A.; Eriksson, M.; Yang, X.; Wang, Y.; Wilkes, A. The Melting Himalayas: Cascading Effects of Climate Change on Water, Biodiversity, and Livelihoods. Conserv. Biol. 2009, 23, 520–530. [Google Scholar] [CrossRef] [PubMed]
- Bajracharya, S.R.; Maharjan, S.B.; Shrestha, F.; Guo, W.; Liu, S.; Immerzeel, W.; Shrestha, B. The Glaciers of the Hindu Kush Himalayas: Current Status and Observed Changes from the 1980s to 2010. Int. J. Water Resour. Dev. 2015, 31, 161–173. [Google Scholar] [CrossRef]
- Chudley, T.R.; Miles, E.S.; Willis, I.C. Glacier Characteristics and Retreat between 1991 and 2014 in the Ladakh Range, Jammu and Kashmir. Remote Sens. Lett. 2017, 8, 518–527. [Google Scholar] [CrossRef]
- Kumar, D.; Singh, A.K.; Taloor, A.K.; Singh, D.S. Recessional Pattern of Thelu and Swetvarn Glaciers between 1968 and 2019, Bhagirathi Basin, Garhwal Himalaya, India. Quat. Int. 2021, 575, 227–235. [Google Scholar] [CrossRef]
- Abdullah, T.; Romshoo, S.A.; Rashid, I. The Satellite Observed Glacier Mass Changes over the Upper Indus Basin during 2000–2012. Sci. Rep. 2020, 10, 14285. [Google Scholar] [CrossRef] [PubMed]
- Romshoo, S.A.; Murtaza, K.O.; Shah, W.; Ramzan, T.; Ameen, U.; Bhat, M.H. Anthropogenic Climate Change Drives Melting of Glaciers in the Himalaya. Environ. Sci. Pollut. Res. 2022, 29, 52732–52751. [Google Scholar] [CrossRef]
- Romshoo, S.A.; Abdullah, T.; Rashid, I.; Bahuguna, I.M. Explaining the Differential Response of Glaciers across Different Mountain Ranges in the North-Western Himalaya, India. Cold Reg. Sci. Technol. 2022, 196, 103515. [Google Scholar] [CrossRef]
- Bajracharya, S.R.; Maharjan, S.B.; Shrestha, F. The Status and Decadal Change of Glaciers in Bhutan from the 1980s to 2010 Based on Satellite Data. Ann. Glaciol. 2014, 55, 159–166. [Google Scholar] [CrossRef]
- Sahu, R.; Gupta, R. Glacier Mapping and Change Analysis in Chandra Basin, Western Himalaya, India during 1971–2016. Int. J. Remote Sens. 2020, 41, 6914–6945. [Google Scholar] [CrossRef]
- Pandey, P.; Venkataraman, G. Changes in the Glaciers of Chandra–Bhaga Basin, Himachal Himalaya, India, between 1980 and 2010 Measured Using Remote Sensing. Int. J. Remote Sens. 2013, 34, 5584–5597. [Google Scholar] [CrossRef]
- Solomon, S.; Qin, D.; Manning, M.; Marquis, M.; Averyt, K.; Melinda, M.B.; Tignor; Miller, H.L., Jr.; Chen, Z. Climate Change 2007—The Physical Science Basis; Contribution of Working Group I to the Fourth Assessment Report of the Intergovernmental Panel on Climate Change; Cambridge University Press: New York, NY, USA, 2007; pp. 235–336. [Google Scholar]
- Prasad, A.K.; Yang, K.-H.S.; El-Askary, H.M.; Kafatos, M. Melting of Major Glaciers in the Western Himalayas: Evidence of Climatic Changes from Long Term MSU Derived Tropospheric Temperature Trend (1979–2008). Ann. Geophys. 2009, 27, 4505–4519. [Google Scholar] [CrossRef]
- He, Y. Changing Features of the Climate and Glaciers in China’s Monsoonal Temperate Glacier Region. J. Geophys. Res. 2003, 108, 4530. [Google Scholar] [CrossRef]
- Lau, K.M.; Kim, M.K.; Kim, K.M. Asian Summer Monsoon Anomalies Induced by Aerosol Direct Forcing: The Role of the Tibetan Plateau. Clim. Dyn. 2006, 26, 855–864. [Google Scholar] [CrossRef]
- Lau, K.-M.; Kim, K.-M. Observational Relationships between Aerosol and Asian Monsoon Rainfall, and Circulation. Geophys. Res. Lett. 2006, 33, L21810. [Google Scholar] [CrossRef]
- Mears, C.A.; Wentz, F.J.; Thorne, P.W. Assessing the Value of Microwave Sounding Unit-Radiosonde Comparisons in Ascertaining Errors in Climate Data Records of Tropospheric Temperatures: Satellite-Radiosonde Comparisons. J. Geophys. Res. Atmos. 2012, 117. [Google Scholar] [CrossRef]
- Diao, M.; Jumbam, L.; Sheffield, J.; Wood, E.F.; Zondlo, M.A. Validation of AIRS/AMSU-A Water Vapor and Temperature Data with in Situ Aircraft Observations from the Surface to UT/LS from 87°N-67°S: GLOBAL AIRS/AMSU-A H 2 O AND T VALATIONS. J. Geophys. Res. Atmos. 2013, 118, 6816–6836. [Google Scholar] [CrossRef]
- Bernath, P.F. The Atmospheric Chemistry Experiment (ACE). J. Quant. Spectrosc. Radiat. Transf. 2017, 186, 3–16. [Google Scholar] [CrossRef]
- Nash, J.; Saunders, R. A Review of Stratospheric Sounding Unit Radiance Observations for Climate Trends and Reanalyses. Q. J. R. Meteorol. Soc. 2015, 141, 2103–2113. [Google Scholar] [CrossRef]
- Sofieva, V.F.; Dalaudier, F.; Hauchecorne, A.; Kan, V. High-Resolution Temperature Profiles Retrieved from Bichromatic Stellar Scintillation Measurements by GOMOS/Envisat. Atmos. Meas. Tech. 2019, 12, 585–598. [Google Scholar] [CrossRef]
- Christy, J.R.; Norris, W.B.; Spencer, R.W.; Hnilo, J.J. Tropospheric Temperature Change since 1979 from Tropical Radiosonde and Satellite Measurements. J. Geophys. Res. 2007, 112, D06102. [Google Scholar] [CrossRef]
- Mears, C.A.; Schabel, M.C.; Wentz, F.J. A Reanalysis of the MSU Channel 2 Tropospheric Temperature Record. J. Clim. 2003, 16, 3650–3664. [Google Scholar] [CrossRef]
- Ramanathan, V.; Ramana, M.V.; Roberts, G.; Kim, D.; Corrigan, C.; Chung, C.; Winker, D. Warming Trends in Asia Amplified by Brown Cloud Solar Absorption. Nature 2007, 448, 575–578. [Google Scholar] [CrossRef]
- Madhura, R.K.; Krishnan, R.; Revadekar, J.V.; Mujumdar, M.; Goswami, B.N. Changes in Western Disturbances over the Western Himalayas in a Warming Environment. Clim. Dyn. 2015, 44, 1157–1168. [Google Scholar] [CrossRef]
- Mallik, C.; Lal, S. Changing Long-Term Trends in Tropospheric Temperature over Two Megacities in the Indo-Gangetic Plain. Curr. Sci. 2011, 101, 637–644. [Google Scholar]
- Kothawale, D.R.; Singh, H.N. Recent Trends in Tropospheric Temperature over India during the Period 1971–2015: Indian Tropospheric Temperature Trend. Earth Space Sci. 2017, 4, 240–246. [Google Scholar] [CrossRef]
- Jindal, P.; Thapliyal, P.K.; Shukla, M.V.; Sharma, S.K.; Mitra, D. Trend Analysis of Atmospheric Temperature, Water Vapour, Ozone, Methane and Carbon-Monoxide over Few Major Cities of India Using Satellite Data. J. Earth Syst. Sci. 2020, 129, 60. [Google Scholar] [CrossRef]
- Guo, Y.; Weng, F.; Wang, G.; Xu, W. The Long-Term Trend of Upper-Air Temperature in China Derived from Microwave Sounding Data and Its Comparison with Radiosonde Observations. J. Clim. 2020, 33, 7875–7895. [Google Scholar] [CrossRef]
- Gautam, R.; Hsu, N.C.; Lau, K.-M. Premonsoon Aerosol Characterization and Radiative Effects over the Indo-Gangetic Plains: Implications for Regional Climate Warming. J. Geophys. Res. 2010, 115, D17208. [Google Scholar] [CrossRef]
- Qin, Z.; Zou, X. Modulation Effect of the Annual Cycle on Interdecadal Warming Trends over the Tibetan Plateau during 1998–2020. J. Clim. 2023, 36, 2917–2931. [Google Scholar] [CrossRef]
- Yao, T.; Pu, J.; Lu, A.; Wang, Y.; Yu, W. Recent Glacial Retreat and Its Impact on Hydrological Processes on the Tibetan Plateau, China, and Surrounding Regions. Arct. Antarct. Alp. Res. 2007, 39, 642–650. [Google Scholar] [CrossRef]
- Schmidt, S.; Nüsser, M. Changes of High Altitude Glaciers in the Trans-Himalaya of Ladakh over the Past Five Decades (1969–2016). Geosciences 2017, 7, 27. [Google Scholar] [CrossRef]
- Das, S.; Sharma, M.C.; Murari, M.K.; Nüsser, M.; Schmidt, S. Half-a-Century (1971–2020) of Glacier Shrinkage and Climatic Variability in the Bhaga Basin, Western Himalaya. J. Mt. Sci. 2023, 20, 299–324. [Google Scholar] [CrossRef]
- Rashid, I.; Majeed, U.; Najar, N.; Bhat, I. Retreat of Machoi Glacier, Kashmir Himalaya between 1972 and 2019 Using Remote Sensing Methods and Field Observations. Sci. Total Environ. 2021, 785, 147376. [Google Scholar] [CrossRef]
- Schmidt, S.; Nüsser, M. Changes of High Altitude Glaciers from 1969 to 2010 in the Trans-Himalayan Kang Yatze Massif, Ladakh, Northwest India. Arct. Antarct. Alp. Res. 2012, 44, 107–121. [Google Scholar] [CrossRef]
- Zhao, W.; He, J.; Wu, Y.; Xiong, D.; Wen, F.; Li, A. An Analysis of Land Surface Temperature Trends in the Central Himalayan Region Based on MODIS Products. Remote Sens. 2019, 11, 900. [Google Scholar] [CrossRef]
- Farinotti, D.; Immerzeel, W.W.; De Kok, R.J.; Quincey, D.J.; Dehecq, A. Manifestations and Mechanisms of the Karakoram Glacier Anomaly. Nat. Geosci. 2020, 13, 8–16. [Google Scholar] [CrossRef] [PubMed]
- Hewitt, K. The Karakoram Anomaly? Glacier Expansion and the ‘Elevation Effect’, Karakoram Himalaya. Mt. Res. Dev. 2005, 25, 332–340. [Google Scholar] [CrossRef]
- Scherler, D.; Strecker, M.R. Large Surface Velocity Fluctuations of Biafo Glacier, Central Karakoram, at High Spatial and Temporal Resolution from Optical Satellite Images. J. Glaciol. 2012, 58, 569–580. [Google Scholar] [CrossRef]
- Muhammad, S.; Tian, L.; Nüsser, M. No Significant Mass Loss in the Glaciers of Astore Basin (North-Western Himalaya), between 1999 and 2016. J. Glaciol. 2019, 65, 270–278. [Google Scholar] [CrossRef]
- Immerzeel, W.W.; Van Beek, L.P.H.; Bierkens, M.F.P. Climate Change Will Affect the Asian Water Towers. Science 2010, 328, 1382–1385. [Google Scholar] [CrossRef]
- Desinayak, N.; Prasad, A.K.; El-Askary, H.; Kafatos, M.; Asrar, G.R. Snow Cover Variability and Trend over the Hindu Kush Himalayan Region Using MODIS and SRTM Data. Ann. Geophys. 2022, 40, 67–82. [Google Scholar] [CrossRef]
- Ren, J.; Jing, Z.; Pu, J.; Qin, X. Glacier Variations and Climate Change in the Central Himalaya over the Past Few Decades. Ann. Glaciol. 2006, 43, 218–222. [Google Scholar] [CrossRef]
- Xu, J.; Liu, S.; Zhang, S.; Guo, W.; Wang, J. Recent Changes in Glacial Area and Volume on Tuanjiefeng Peak Region of Qilian Mountains, China. PLoS ONE 2013, 8, e70574. [Google Scholar] [CrossRef] [PubMed]
- Jianping, Y.; Yongjian, D.; Rensheng, C.; Shiyin, L.; Anxin, L. Causes of Glacier Change in the Source Regions of the Yangtze and Yellow Rivers on the Tibetan Plateau. J. Glaciol. 2003, 49, 539–546. [Google Scholar] [CrossRef][Green Version]
- Lu, A.; Yao, T.; Liu, S. Glacier Change in the Geladandong Area of the Tibetan Plateau Monitored by Remote Sensing. J. Glaciol. Geocryol. 2002, 24, 559–562. [Google Scholar]
- Khromova, T.E.; Dyurgerov, M.B.; Barry, R.G. Late-Twentieth Century Changes in Glacier Extent in the Ak-Shirak Range, Central Asia, Determined from Historical Data and ASTER Imagery: Changes in Glacier Extent in the Ak-Shirak Range. Geophys. Res. Lett. 2003, 30. [Google Scholar] [CrossRef]
- Cruz, R.V.; Harasawa, H.; Lal, M.; Wu, S.; Anokhin, Y.; Punsalmaa, B.; Honda, Y.; Jafari, M.; Li, C.; Huu Ninh, N. Climate Change 2007: Impacts, Adaptation and Vulnerability; Contribution of Working Group II to the Fourth Assessment Report of the Intergovernmental Panel on Climate Change; Cambridge University Press: Cambridge, UK, 2007; pp. 469–506. [Google Scholar]
- Raina, V.K.; Sangewar, C. Siachen Glacier of Karakorum Mountains, Ladakh Its Secular Retreat. J. Geol. Soc. India 2007, 70, 11–16. [Google Scholar]
- Karma, T.; Ageta, Y.; Naito, N.; Iwata, S.; Yabuki, H. Glacier Distribution in the Himalayas and Glacier Shrinkage from 1963 to 1993 in the Bhutan Himalayas. Bull. Glaciol. Res. 2003, 20, 29–40. [Google Scholar]
- Asahi, K.; Wataoabe, T. Past and Recent Glacier Fluctuations in Kanchenjunga Himal, Nepal. J. Nepal Geol. Soc. 2000, 22, 481–490. [Google Scholar] [CrossRef]
- Bajracharya, S.R.; Maharjan, S.B.; Shresth, F. Glaciers Shrinking in Nepal Himalaya. In Climate Change—Geophysical Foundations and Ecological Effects; Blanco, J.A., Ed.; InTech: London, UK, 2011; ISBN 978-953-307-419-1. [Google Scholar]
- Racoviteanu, A.E.; Glasser, N.F.; Robson, B.A.; Harrison, S.; Millan, R.; Kayastha, R.B.; Kayastha, R. Recent Evolution of Glaciers in the Manaslu Region of Nepal From Satellite Imagery and UAV Data (1970–2019). Front. Earth Sci. 2022, 9, 767317. [Google Scholar] [CrossRef]
- Munir, S. Satellite-Based Study of Glaciers Retreat in Northern Pakistan. In Proceedings of the 37th COSPAR Scientific Assembly, Montréal, QC, Canada, 13-20 July 2008; Volume 37, p. 2135. [Google Scholar]
- Mayewski, P.A.; Jeschke, P.A. Himalayan and Trans-Himalayan Glacier Fluctuations Since AD 1812. Arct. Alp. Res. 1979, 11, 267. [Google Scholar] [CrossRef]
- Li, X.; Cheng, G.; Jin, H.; Kang, E.; Che, T.; Jin, R.; Wu, L.; Nan, Z.; Wang, J.; Shen, Y. Cryospheric Change in China. Glob. Planet. Chang. 2008, 62, 210–218. [Google Scholar] [CrossRef]
- Kehrwald, N.M.; Thompson, L.G.; Tandong, Y.; Mosley-Thompson, E.; Schotterer, U.; Alfimov, V.; Beer, J.; Eikenberg, J.; Davis, M.E. Mass Loss on Himalayan Glacier Endangers Water Resources. Geophys. Res. Lett. 2008, 35, L22503. [Google Scholar] [CrossRef]
- Wang, Y.; Hou, S.; Hong, S.; Hur, S.D.; Liu, Y. Glacier Extent and Volume Change (1966∼2000) on the Su-Lo Mountain in Northeastern Tibetan Plateau, China. J. Mt. Sci. 2008, 5, 299–309. [Google Scholar] [CrossRef]
- Shangguan, D.; Liu, S.; Ding, Y.; Li, J.; Zhang, Y.; Ding, L.; Wang, X.; Xie, C.; Li, G. Glacier Changes in the West Kunlun Shan from 1970 to 2001 Derived from Landsat TM/ETM+ and Chinese Glacier Inventory Data. Ann. Glaciol. 2007, 46, 204–208. [Google Scholar] [CrossRef]
- Pu, J.-c.; Yao, T.-d.; Wang, N.-l.; Ding, L.-f.; Zhang, Q.-h. Recent Variation of the Malan Glacier in Hoh Xil Region of the Tibetan Plateau. J. Glaciol. Geocryol. 2001, 23, 189–192. [Google Scholar]
- Liu, J.; Yao, X.; Liu, S.; Guo, W.; Xu, J. Glacial Changes in the Gangdisê Mountains from 1970 to 2016. J. Geogr. Sci. 2020, 30, 131–144. [Google Scholar] [CrossRef]
- Berthier, E.; Arnaud, Y.; Kumar, R.; Ahmad, S.; Wagnon, P.; Chevallier, P. Remote Sensing Estimates of Glacier Mass Balances in the Himachal Pradesh (Western Himalaya, India). Remote Sens. Environ. 2007, 108, 327–338. [Google Scholar] [CrossRef]
- Kulkarni, A.; Bahuguna, I.; Rathore, B.; Singh, S.; Randhawa, S.; Sood, R.; Dhar, S. Glacial Retreat in Himalayas Using Indian Remote Sensing Satellite Data. Curr. Sci. 2007, 92, 69–74. [Google Scholar]
- Vohra, C.P. Himalayan Glaciers. In The Himalayan Aspect of Change; Oxford University Press: New Delhi, India, 1981; pp. 138–151. [Google Scholar]
- Bhambri, R.; Bolch, T.; Kumar, R. Chaujar Frontal Recession of Gangotri Glacier, Garhwal Himalayas, from 1965 to 2006, Measured through Highresolution Remote Sensing Data. Curr. Sci. 2012, 102, 489–494. [Google Scholar]
- Lu, N.; Trenberth, K.E.; Qin, J.; Yang, K.; Yao, L. Detecting Long-Term Trends in Precipitable Water over the Tibetan Plateau by Synthesis of Station and MODIS Observations. J. Clim. 2015, 28, 1707–1722. [Google Scholar] [CrossRef]
- Trenberth, K.E.; Christy, J.R.; Hurrell, J.W. Monitoring Global Monthly Mean Surface Temperatures. J. Clim. 1992, 5, 1405–1423. [Google Scholar] [CrossRef]
- Steiner, A.K.; Ladstädter, F.; Randel, W.J.; Maycock, A.C.; Fu, Q.; Claud, C.; Gleisner, H.; Haimberger, L.; Ho, S.-P.; Keckhut, P.; et al. Observed Temperature Changes in the Troposphere and Stratosphere from 1979 to 2018. J. Clim. 2020, 33, 8165–8194. [Google Scholar] [CrossRef]
- Mountain Research Initiative EDW Working Group. Elevation-Dependent Warming in Mountain Regions of the World. Nat. Clim. Chang. 2015, 5, 424–430. [Google Scholar] [CrossRef]
- Prasad, A.K.; Singh, R.P. Changes in Aerosol Parameters during Major Dust Storm Events (2001–2005) over the Indo-Gangetic Plains Using AERONET and MODIS Data. J. Geophys. Res. 2007, 112, D09208. [Google Scholar] [CrossRef]
- Mears, C.A.; Wentz, F.J. Construction of the Remote Sensing Systems V3.2 Atmospheric Temperature Records from the MSU and AMSU Microwave Sounders. J. Atmos. Ocean. Technol. 2009, 26, 1040–1056. [Google Scholar] [CrossRef]
- Mears, C.A.; Wentz, F.J. Construction of the RSS V3.2 Lower-Tropospheric Temperature Dataset from the MSU and AMSU Microwave Sounders. J. Atmos. Ocean. Technol. 2009, 26, 1493–1509. [Google Scholar] [CrossRef]
- Christy, J.R.; Spencer, R.W.; Braswell, W.D. MSU Tropospheric Temperatures: Dataset Construction and Radiosonde Comparisons. J. Atmos. Ocean. Technol. 2000, 17, 1153–1170. [Google Scholar] [CrossRef]
- Po-Chedley, S.; Thorsen, T.J.; Fu, Q. Removing Diurnal Cycle Contamination in Satellite-Derived Tropospheric Temperatures: Understanding Tropical Tropospheric Trend Discrepancies. J. Clim. 2015, 28, 2274–2290. [Google Scholar] [CrossRef]
- Zou, C.-Z.; Wang, W. Intersatellite Calibration of AMSU-A Observations for Weather and Climate Applications: Amsu-A Intersatellite Calibration. J. Geophys. Res. Atmos. 2011, 116. [Google Scholar] [CrossRef]
- Fu, Q.; Johanson, C.M.; Warren, S.G.; Seidel, D.J. Contribution of Stratospheric Cooling to Satellite-Inferred Tropospheric Temperature Trends. Nature 2004, 429, 55–58. [Google Scholar] [CrossRef] [PubMed]
- Spencer, R.W.; Christy, J.R. Precision and Radiosonde Validation of Satellite Gridpoint Temperature Anomalies. Part II: A Tropospheric Retrieval and Trends during 1979–90. J. Clim. 1992, 5, 858–866. [Google Scholar] [CrossRef]
- Mears, C.A.; Wentz, F.J. The Effect of Diurnal Correction on Satellite-Derived Lower Tropospheric Temperature. Science 2005, 309, 1548–1551. [Google Scholar] [CrossRef][Green Version]
- Christy, J.R.; Spencer, R.W.; Norris, W.B.; Braswell, W.D.; Parker, D.E. Error Estimates of Version 5.0 of MSU–AMSU Bulk Atmospheric Temperatures. J. Atmos. Ocean. Technol. 2003, 20, 613–629. [Google Scholar] [CrossRef]
- Zou, C.-Z.; Gao, M.; Goldberg, M.D. Error Structure and Atmospheric Temperature Trends in Observations from the Microwave Sounding Unit. J. Clim. 2009, 22, 1661–1681. [Google Scholar] [CrossRef][Green Version]
- Mears, C.A.; Wentz, F.J. Sensitivity of Satellite-Derived Tropospheric Temperature Trends to the Diurnal Cycle Adjustment. J. Clim. 2016, 29, 3629–3646. [Google Scholar] [CrossRef]
- Mears, C.A.; Wentz, F.J. A Satellite-Derived Lower-Tropospheric Atmospheric Temperature Dataset Using an Optimized Adjustment for Diurnal Effects. J. Clim. 2017, 30, 7695–7718. [Google Scholar] [CrossRef]
- Dey, S. Influence of Dust Storms on the Aerosol Optical Properties over the Indo-Gangetic Basin. J. Geophys. Res. 2004, 109, D20211. [Google Scholar] [CrossRef]
- Prasad, A.K.; Singh, R.P. Comparison of MISR-MODIS Aerosol Optical Depth over the Indo-Gangetic Basin during the Winter and Summer Seasons (2000–2005). Remote Sens. Environ. 2007, 107, 109–119. [Google Scholar] [CrossRef]
- Ladstädter, F.; Steiner, A.K.; Gleisner, H. Resolving the 21st Century Temperature Trends of the Upper Troposphere–Lower Stratosphere with Satellite Observations. Sci. Rep. 2023, 13, 1306. [Google Scholar] [CrossRef]
- Wester, P.; Mishra, A.; Mukherji, A.; Shrestha, A.B. (Eds.) The Hindu Kush Himalaya Assessment: Mountains, Climate Change, Sustainability and People; Springer International Publishing: Cham, Switzerland, 2019; ISBN 978-3-319-92287-4. [Google Scholar]
- Prasad, A.K.; Singh, R.P.; Singh, A. Seasonal Climatology of Aerosol Optical Depth over the Indian Subcontinent: Trend and Departures in Recent Years. Int. J. Remote Sens. 2006, 27, 2323–2329. [Google Scholar] [CrossRef]
- Chand, K.; Kuniyal, J.C.; Kanga, S.; Guleria, R.P.; Meraj, G.; Kumar, P.; Farooq, M.; Singh, S.K.; Nathawat, M.S.; Sahu, N.; et al. Aerosol Characteristics and Their Impact on the Himalayan Energy Budget. Sustainability 2021, 14, 179. [Google Scholar] [CrossRef]
- Guleria, R.P.; Kuniyal, J.C.; Rawat, P.S.; Sharma, N.L.; Thakur, H.K.; Dhyani, P.P.; Singh, M. The Assessment of Aerosol Optical Properties over Mohal in the Northwestern Indian Himalayas Using Satellite and Ground-Based Measurements and an Influence of Aerosol Transport on Aerosol Radiative Forcing. Meteorol. Atmos. Phys. 2011, 113, 153–169. [Google Scholar] [CrossRef]
- Guleria, R.P.; Kuniyal, J.C. Characteristics of Atmospheric Aerosol Particles and Their Role in Aerosol Radiative Forcing over the Northwestern Indian Himalaya in Particular and over India in General. Air Qual. Atmos. Health 2016, 9, 795–808. [Google Scholar] [CrossRef]
Disclaimer/Publisher’s Note: The statements, opinions and data contained in all publications are solely those of the individual author(s) and contributor(s) and not of MDPI and/or the editor(s). MDPI and/or the editor(s) disclaim responsibility for any injury to people or property resulting from any ideas, methods, instructions or products referred to in the content. |
© 2023 by the authors. Licensee MDPI, Basel, Switzerland. This article is an open access article distributed under the terms and conditions of the Creative Commons Attribution (CC BY) license (https://creativecommons.org/licenses/by/4.0/).