
Learning from the Past: Parametric Analysis of Cob Walls


Abstract
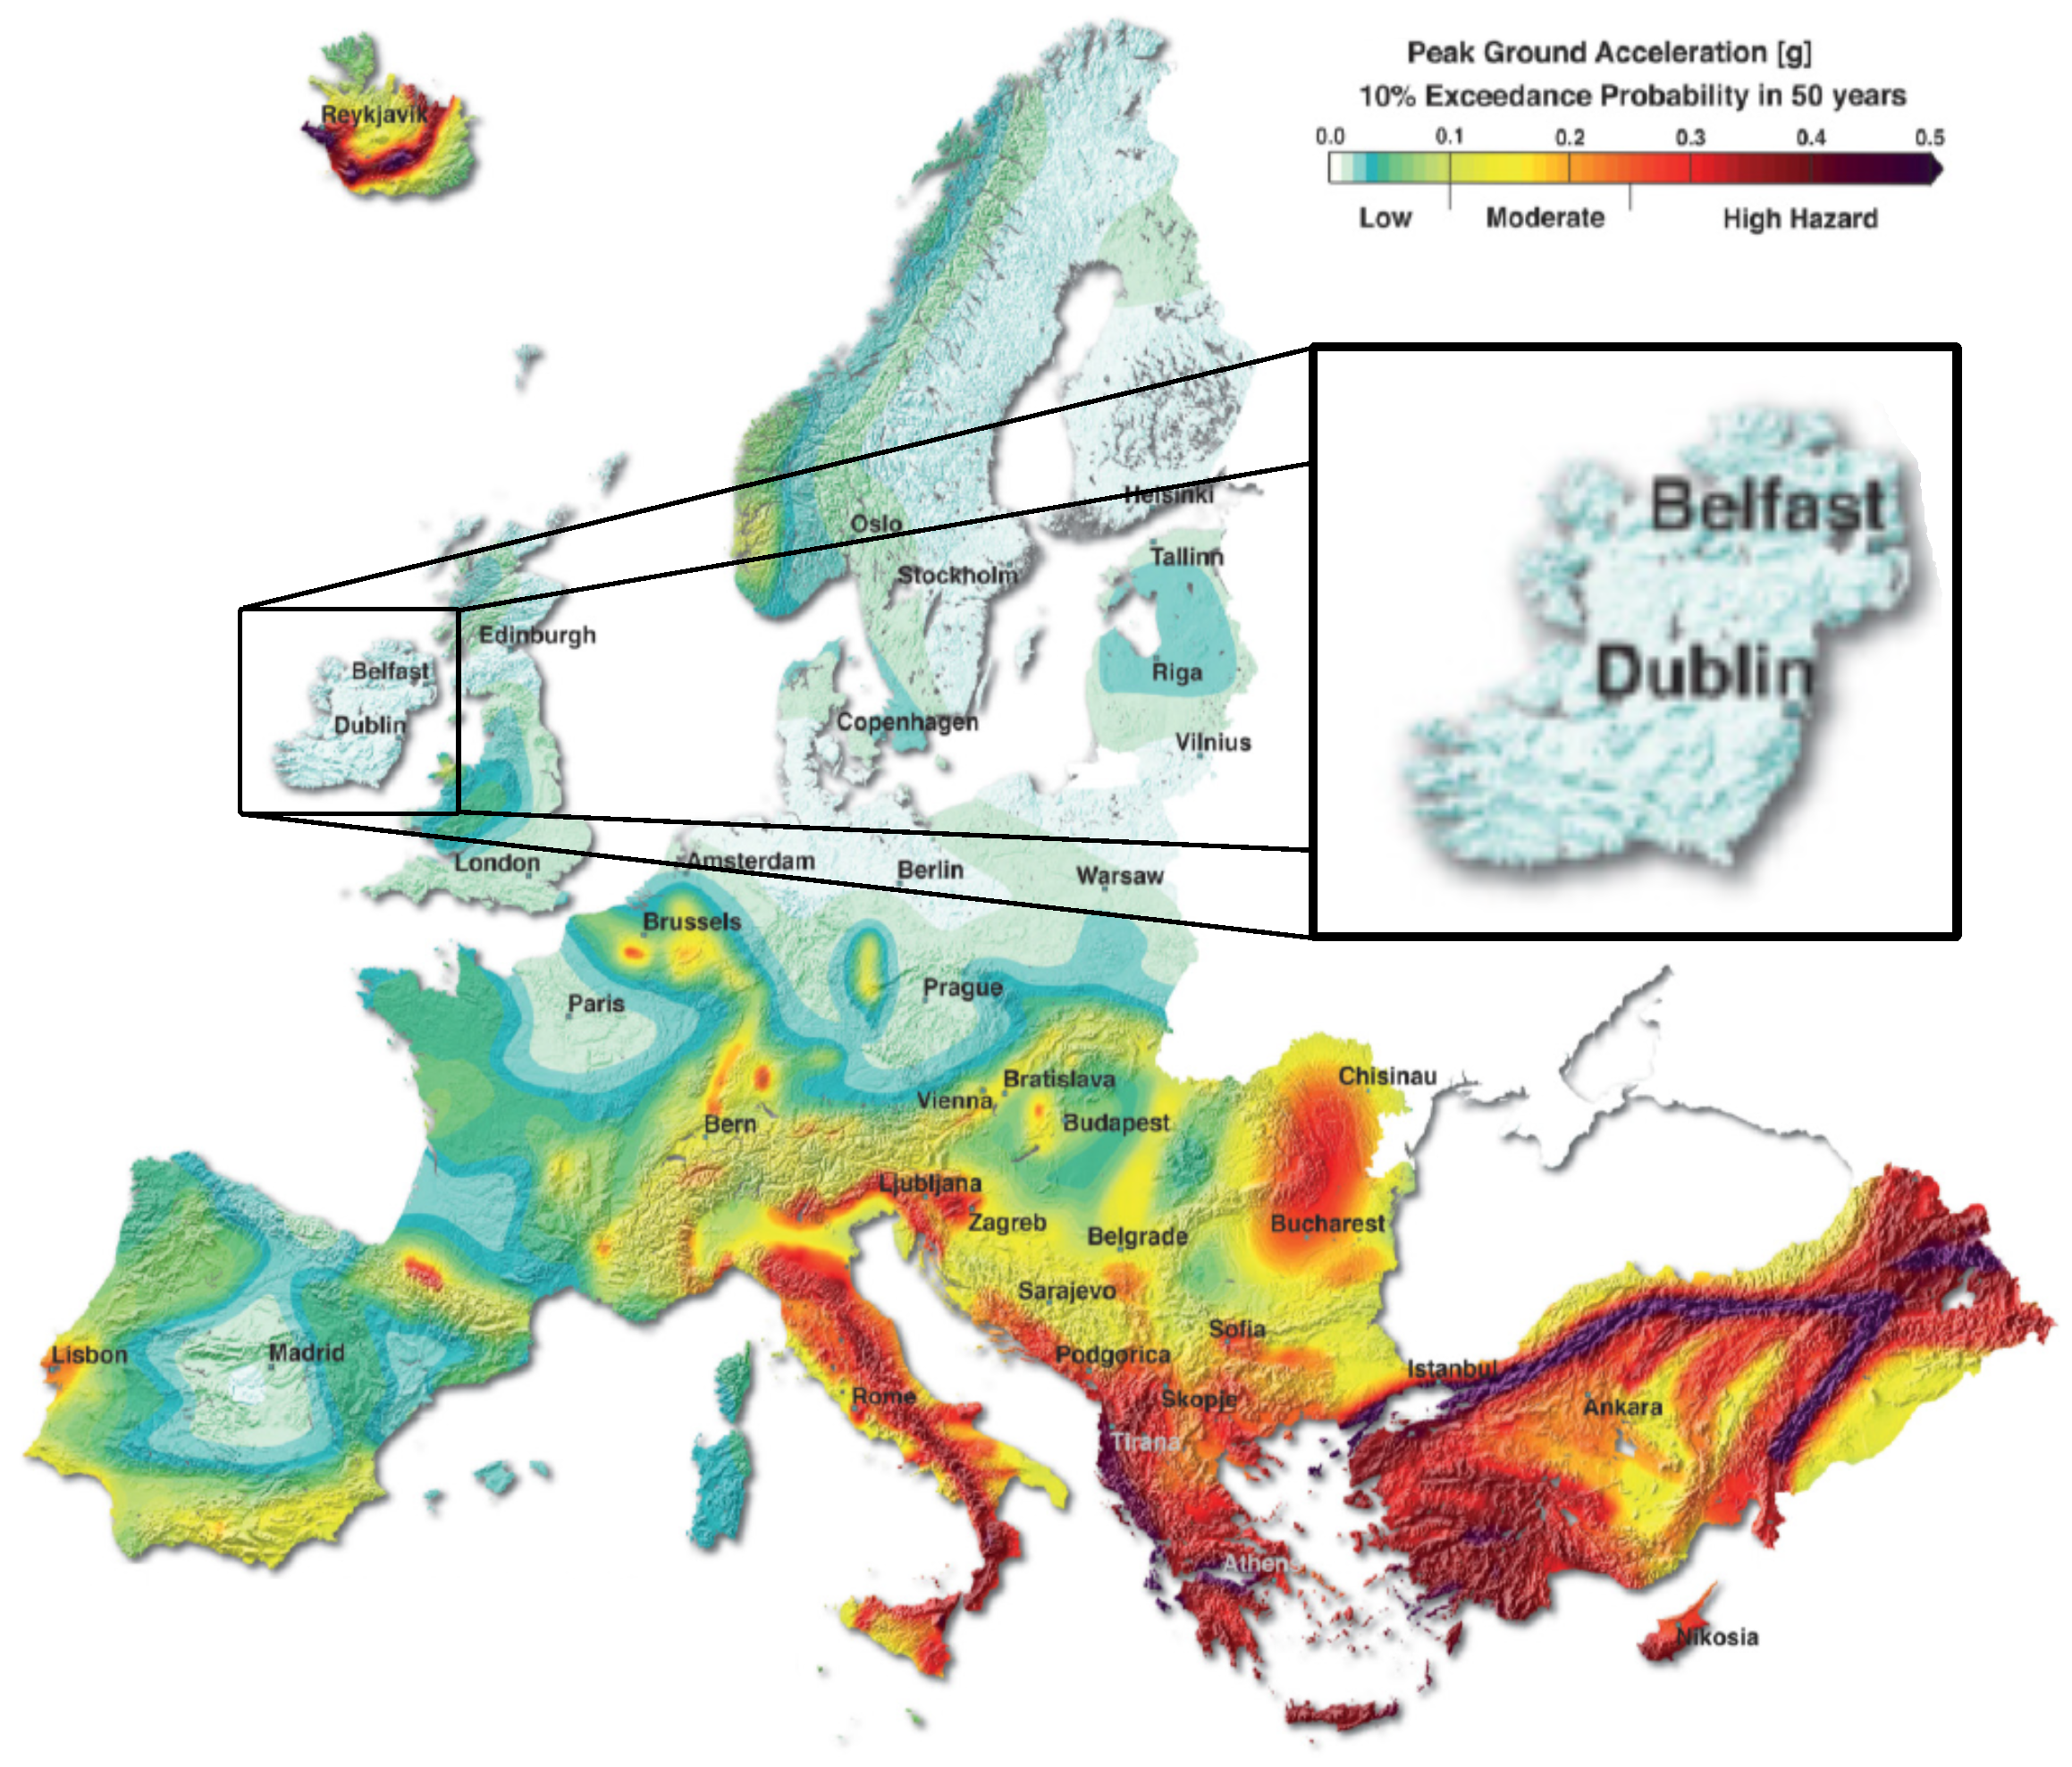
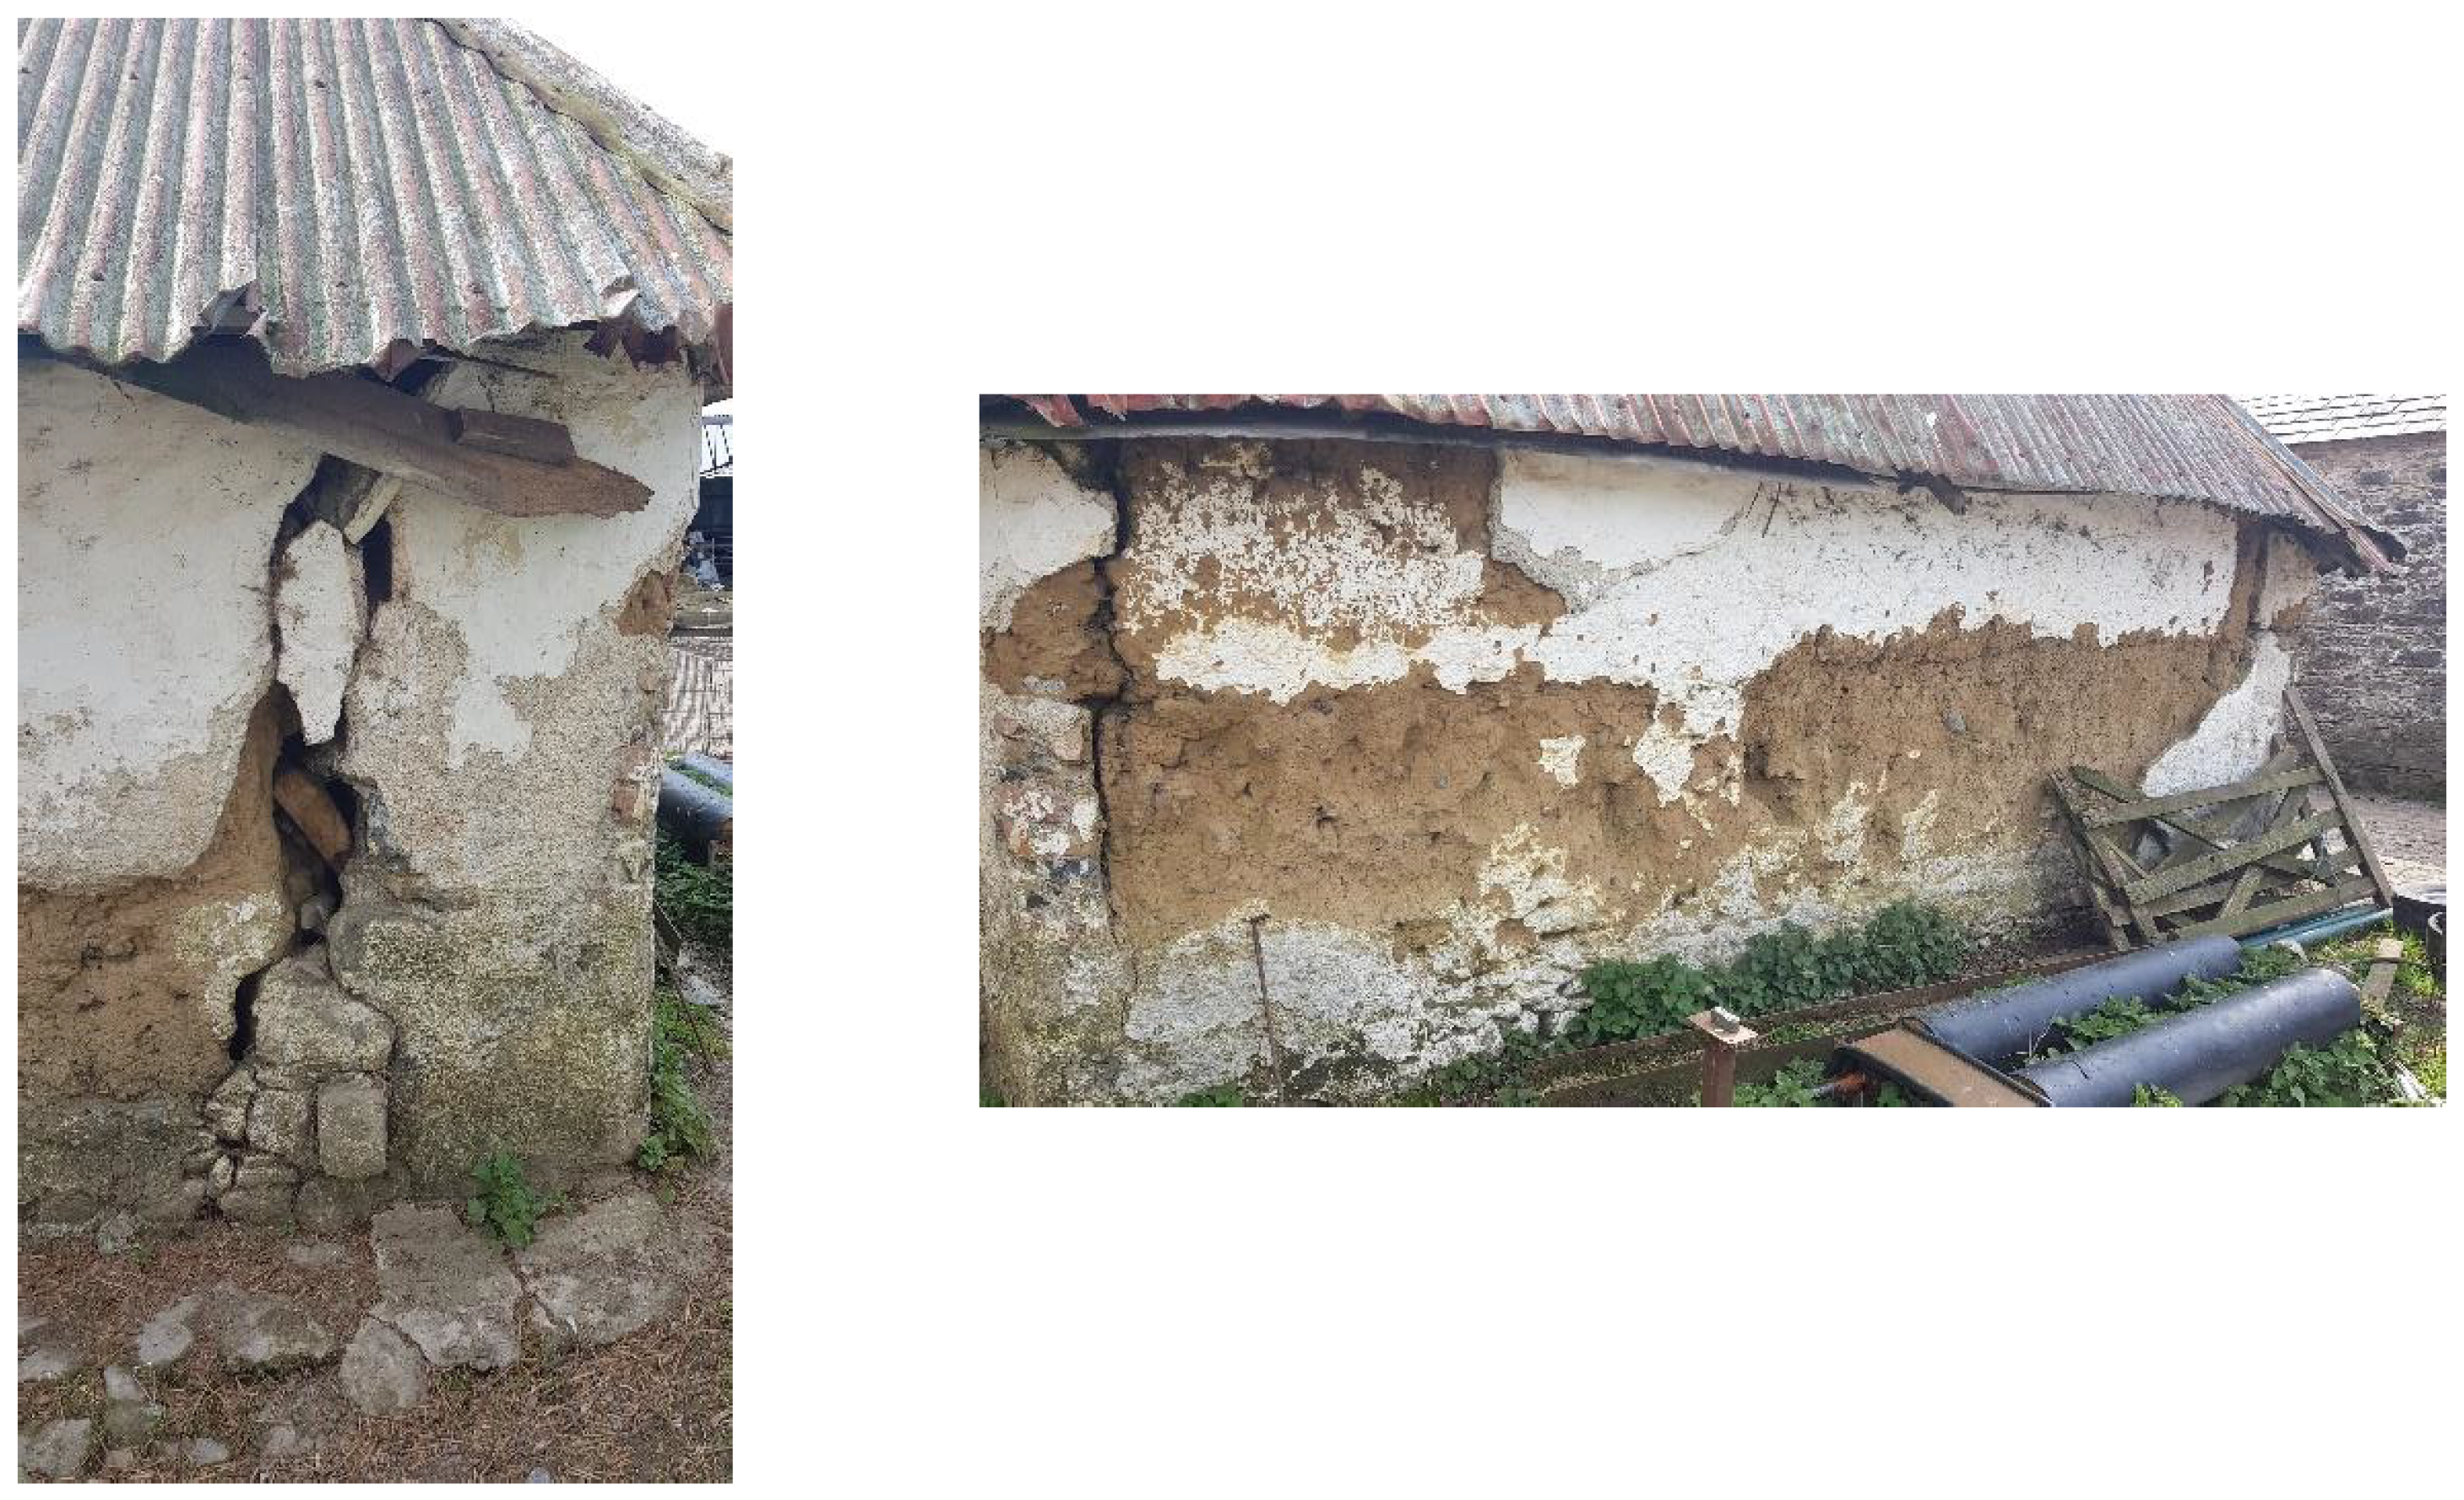
1. Introduction
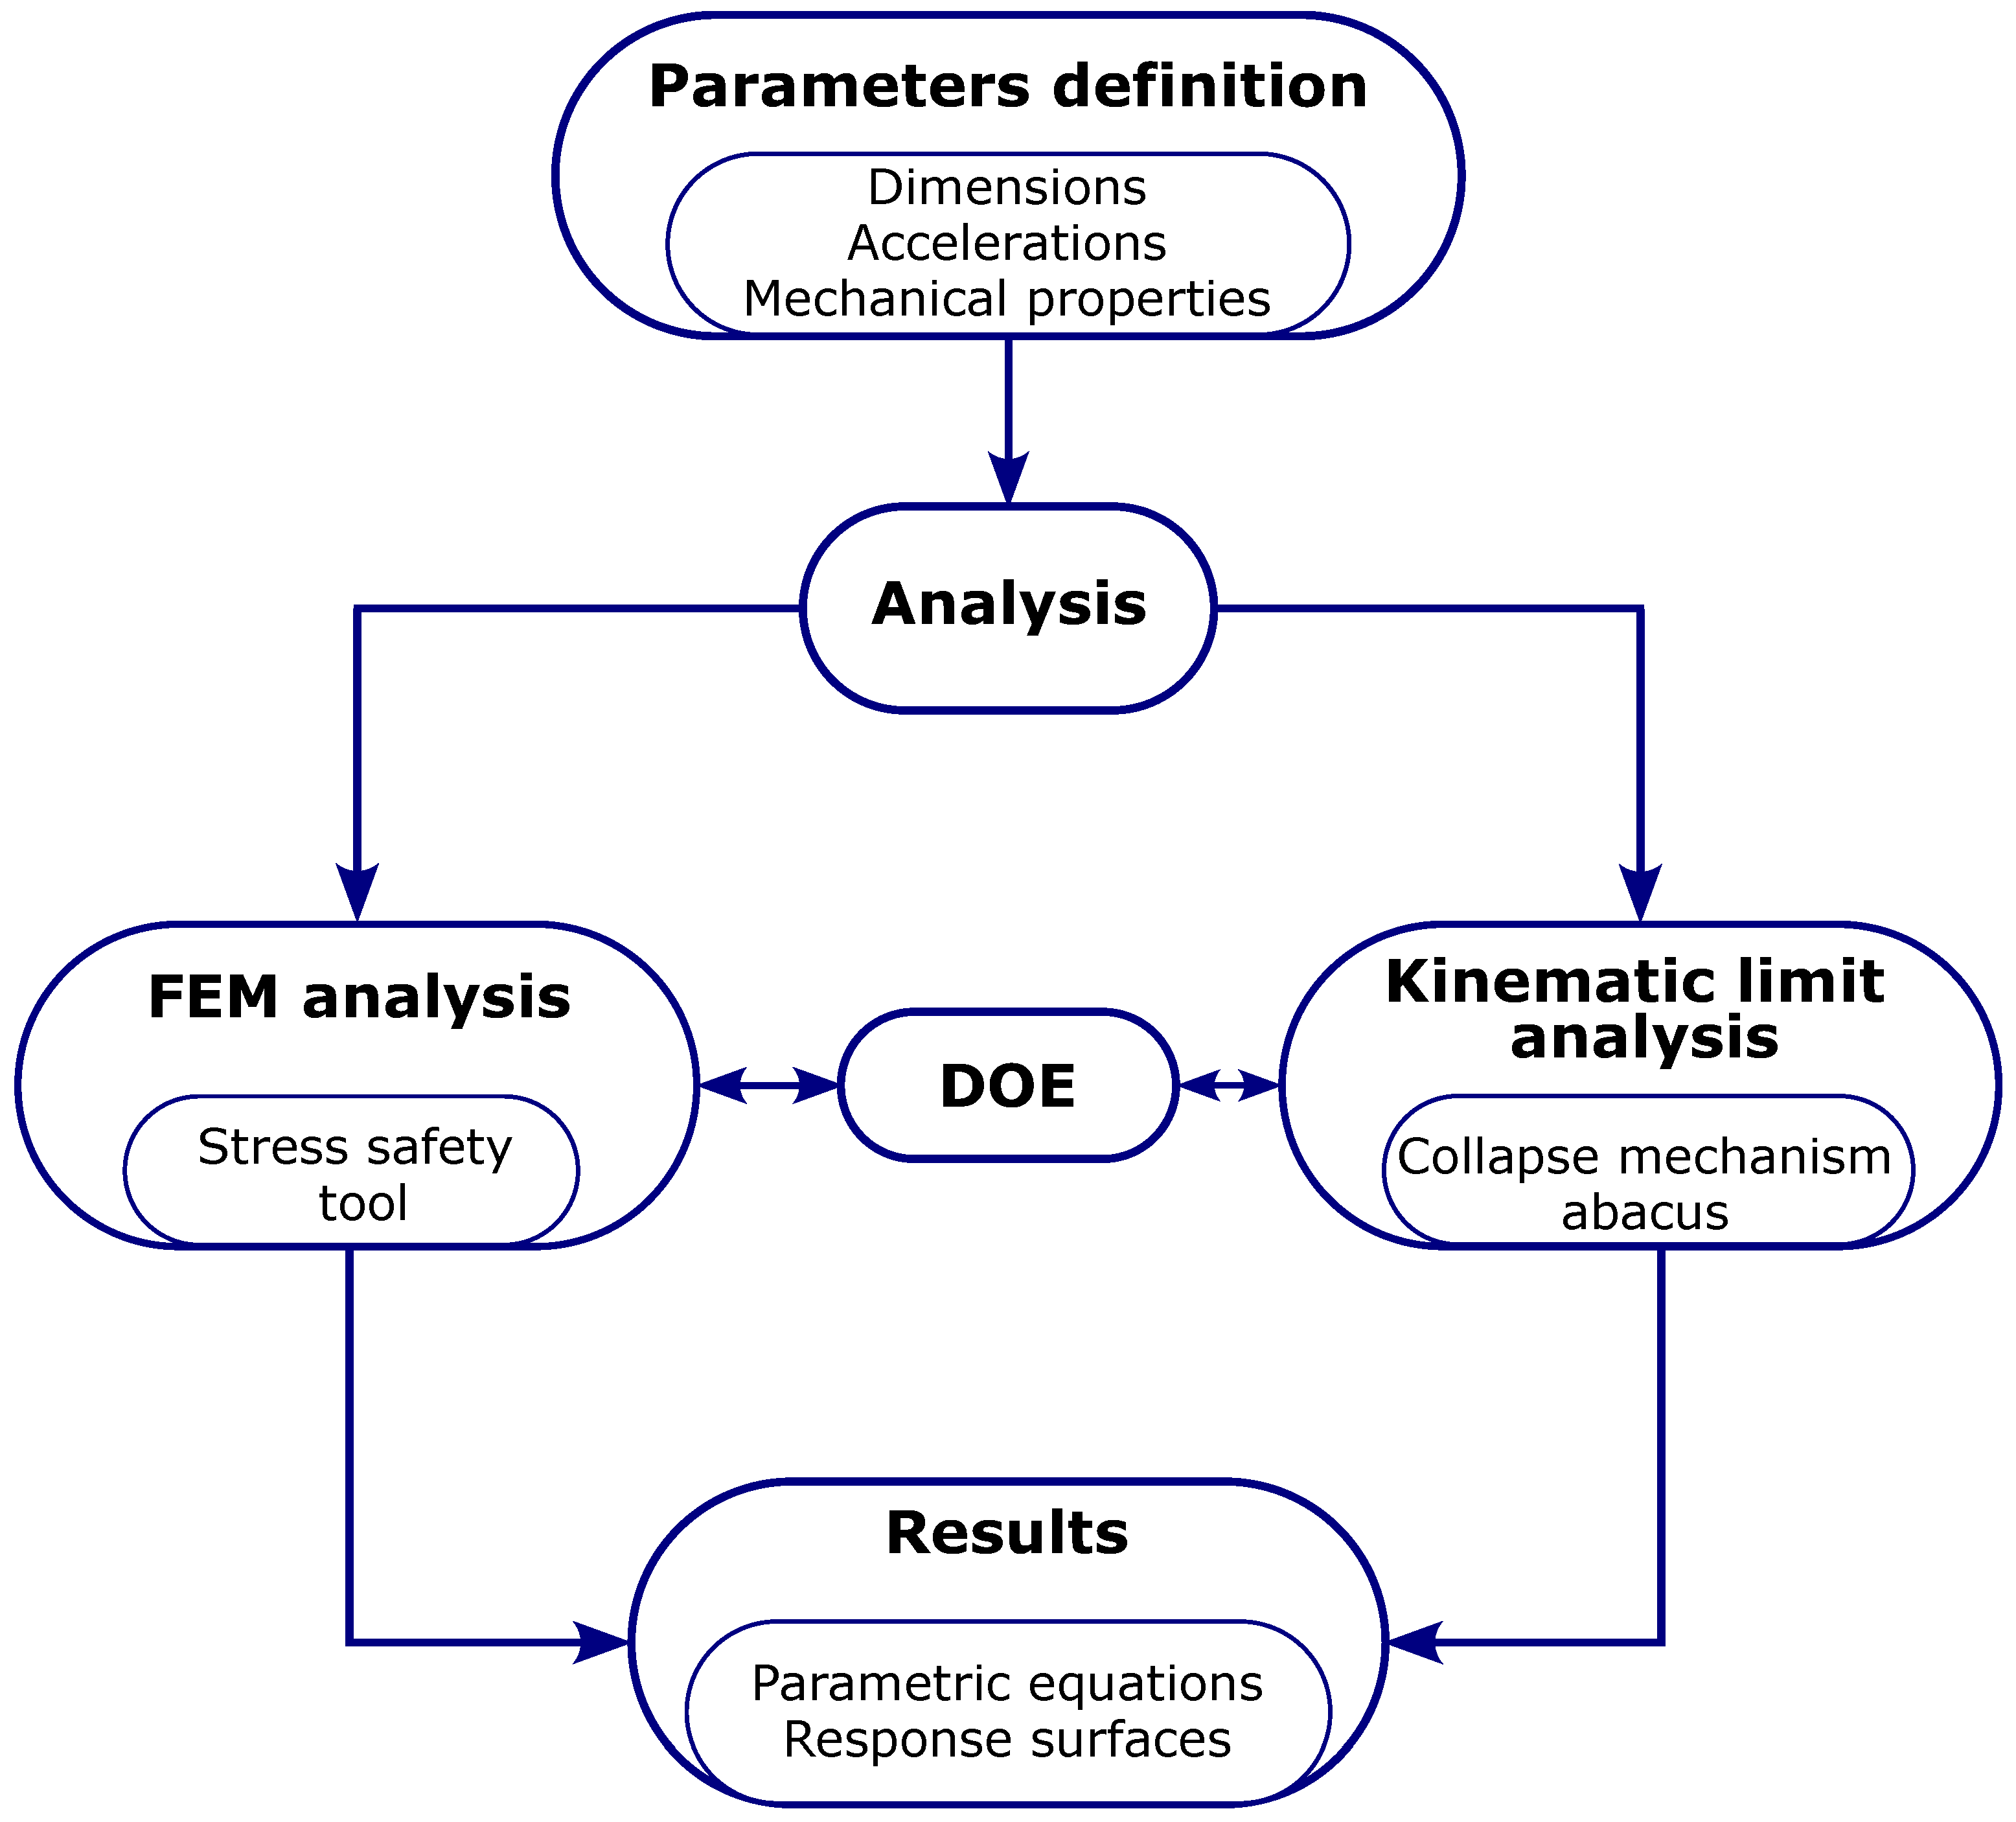
2. Materials and Methods
2.1. Parameters
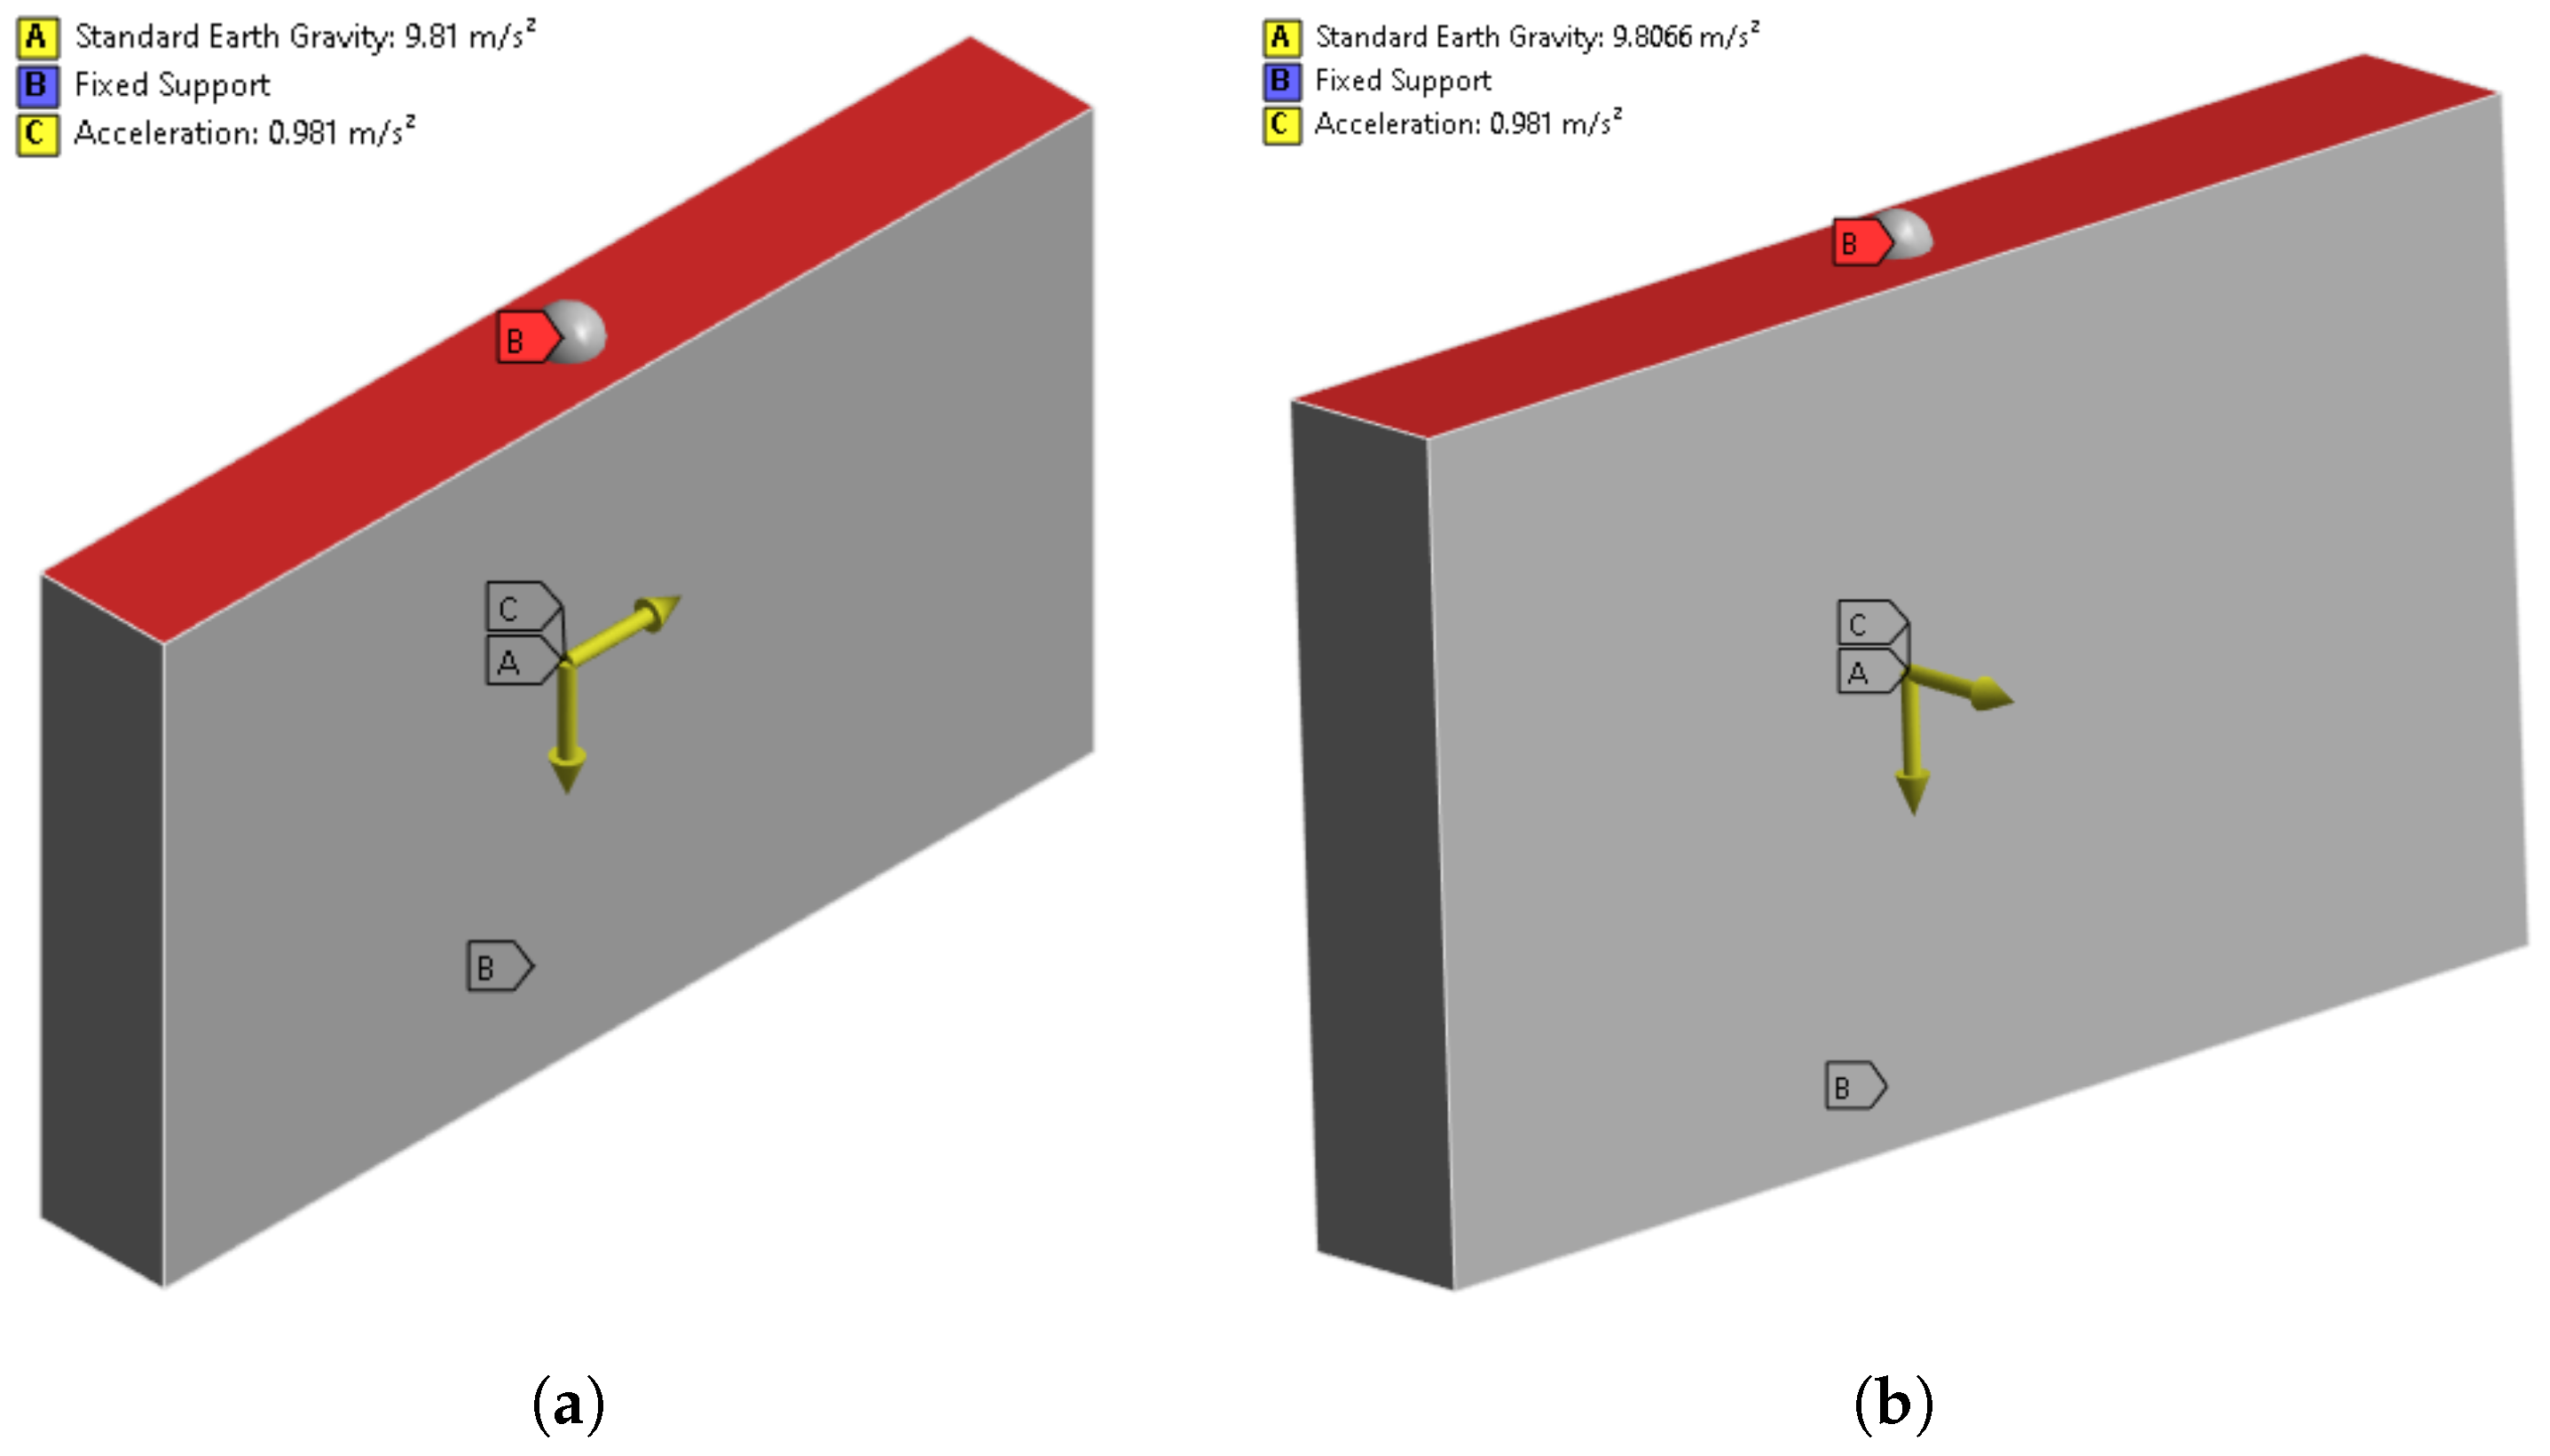
2.2. Linear Elastic FEM Analysis
- wall interconnectivity (perpendicular walls providing out-of-plane support);
- top restraint at roof level;
- “box-like” behavior (provided by a strengthening/retrofitting intervention).
2.3. Macro-Element Kinematic Limit Analysis
2.4. Design of Experiment (DOE)
2.5. Study Limitations
3. Results and Discussions
3.1. FEM Out-of-Plane Analysis
3.2. FEM In-Plane Analysis
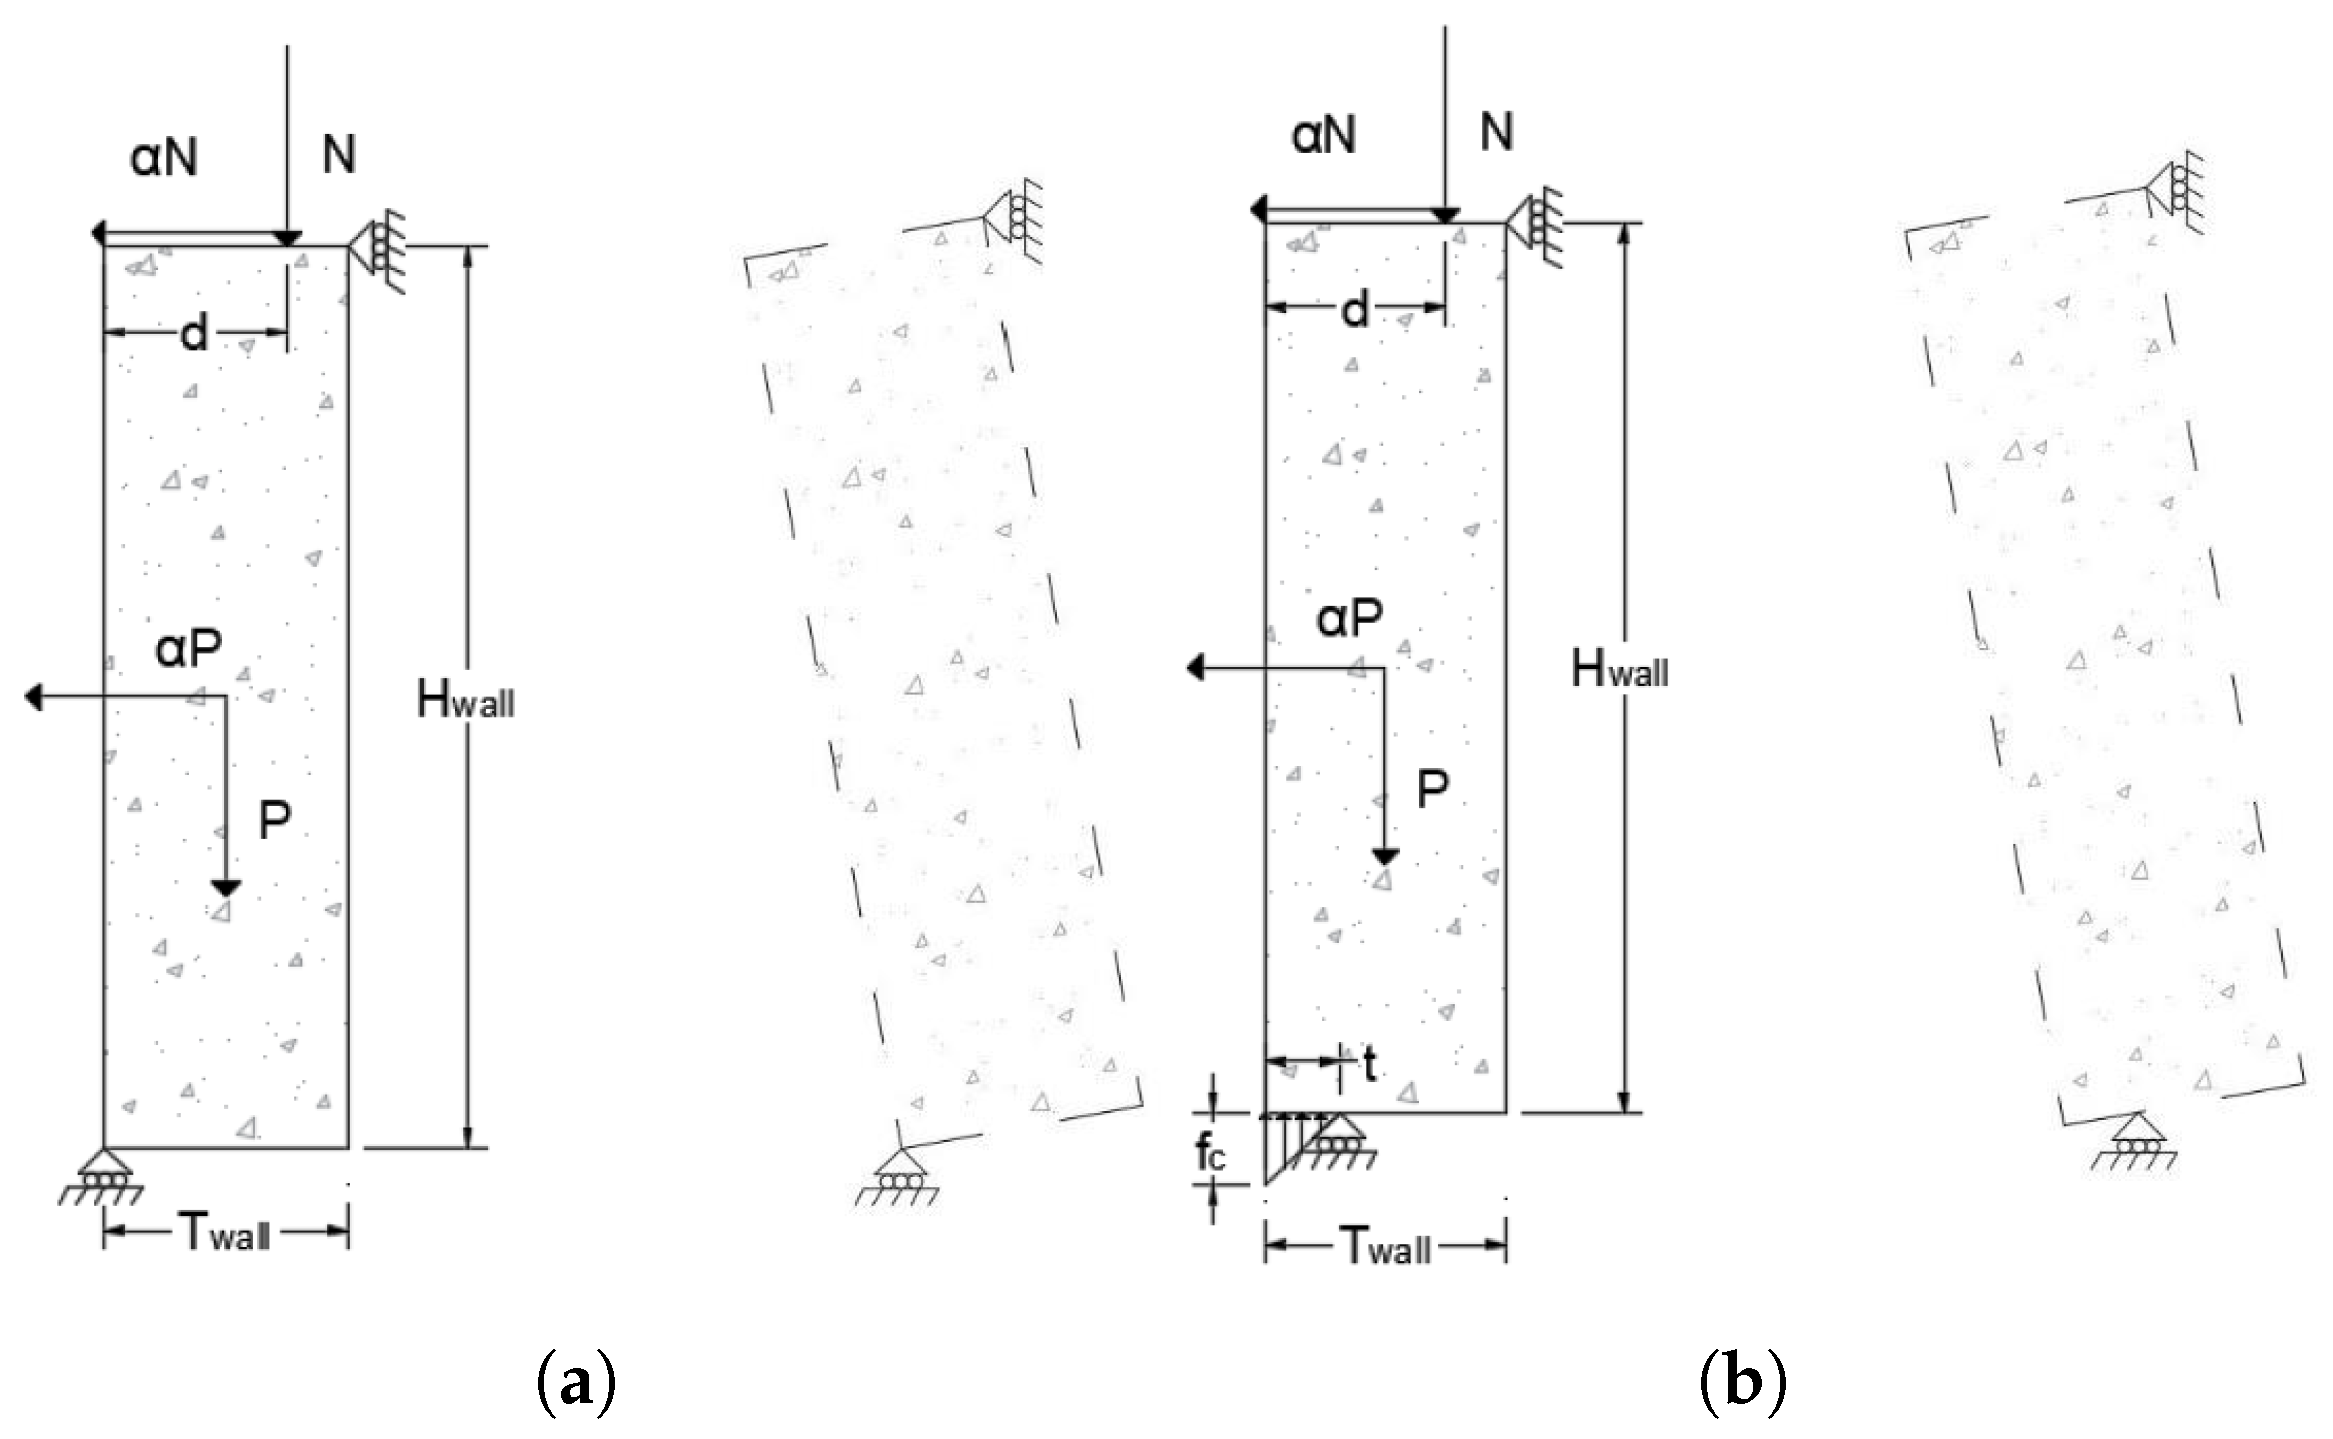
3.3. Macro-Element Out-of-Plane Analysis Assuming Infinite Compressive Strength
3.4. Macro-Element Out-of-Plane Analysis Taking into Account the Compressive Strength of the Material
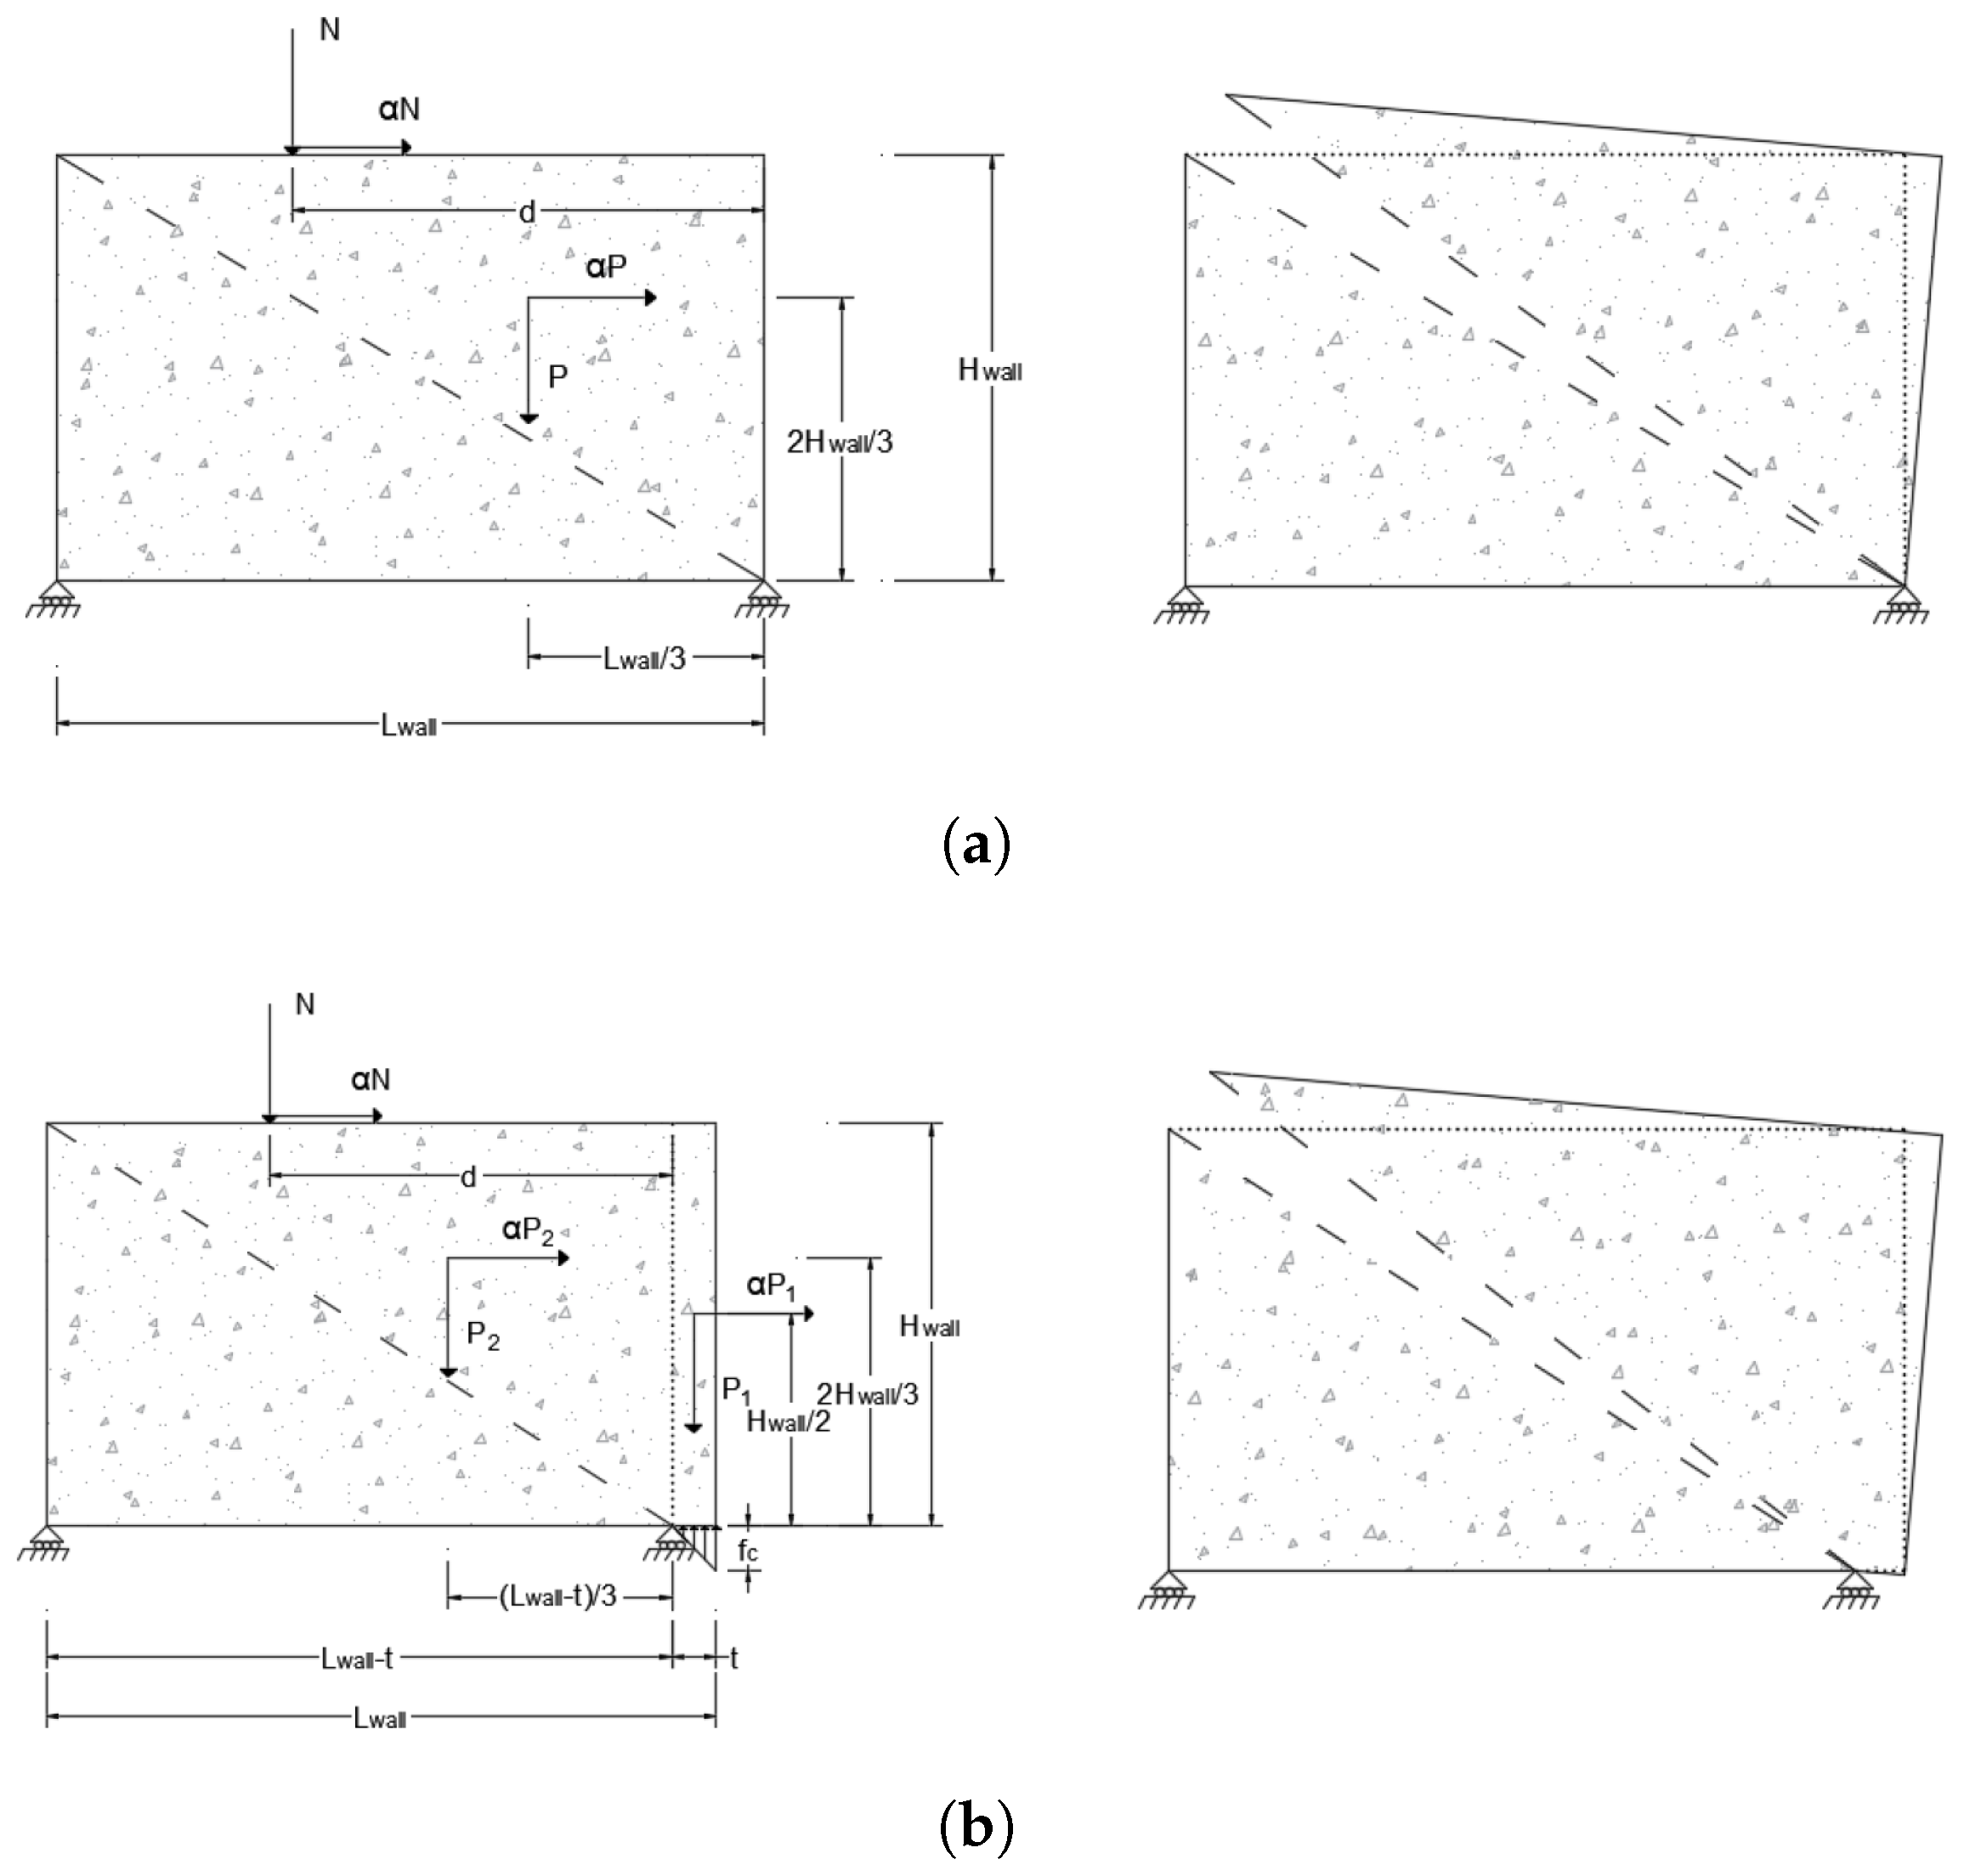
3.5. Macro-Element In-Plane Analysis Assuming Infinite Compressive Strength
3.6. Macro-Element In-Plane Analysis Taking into Account the Compressive Strength of the Material
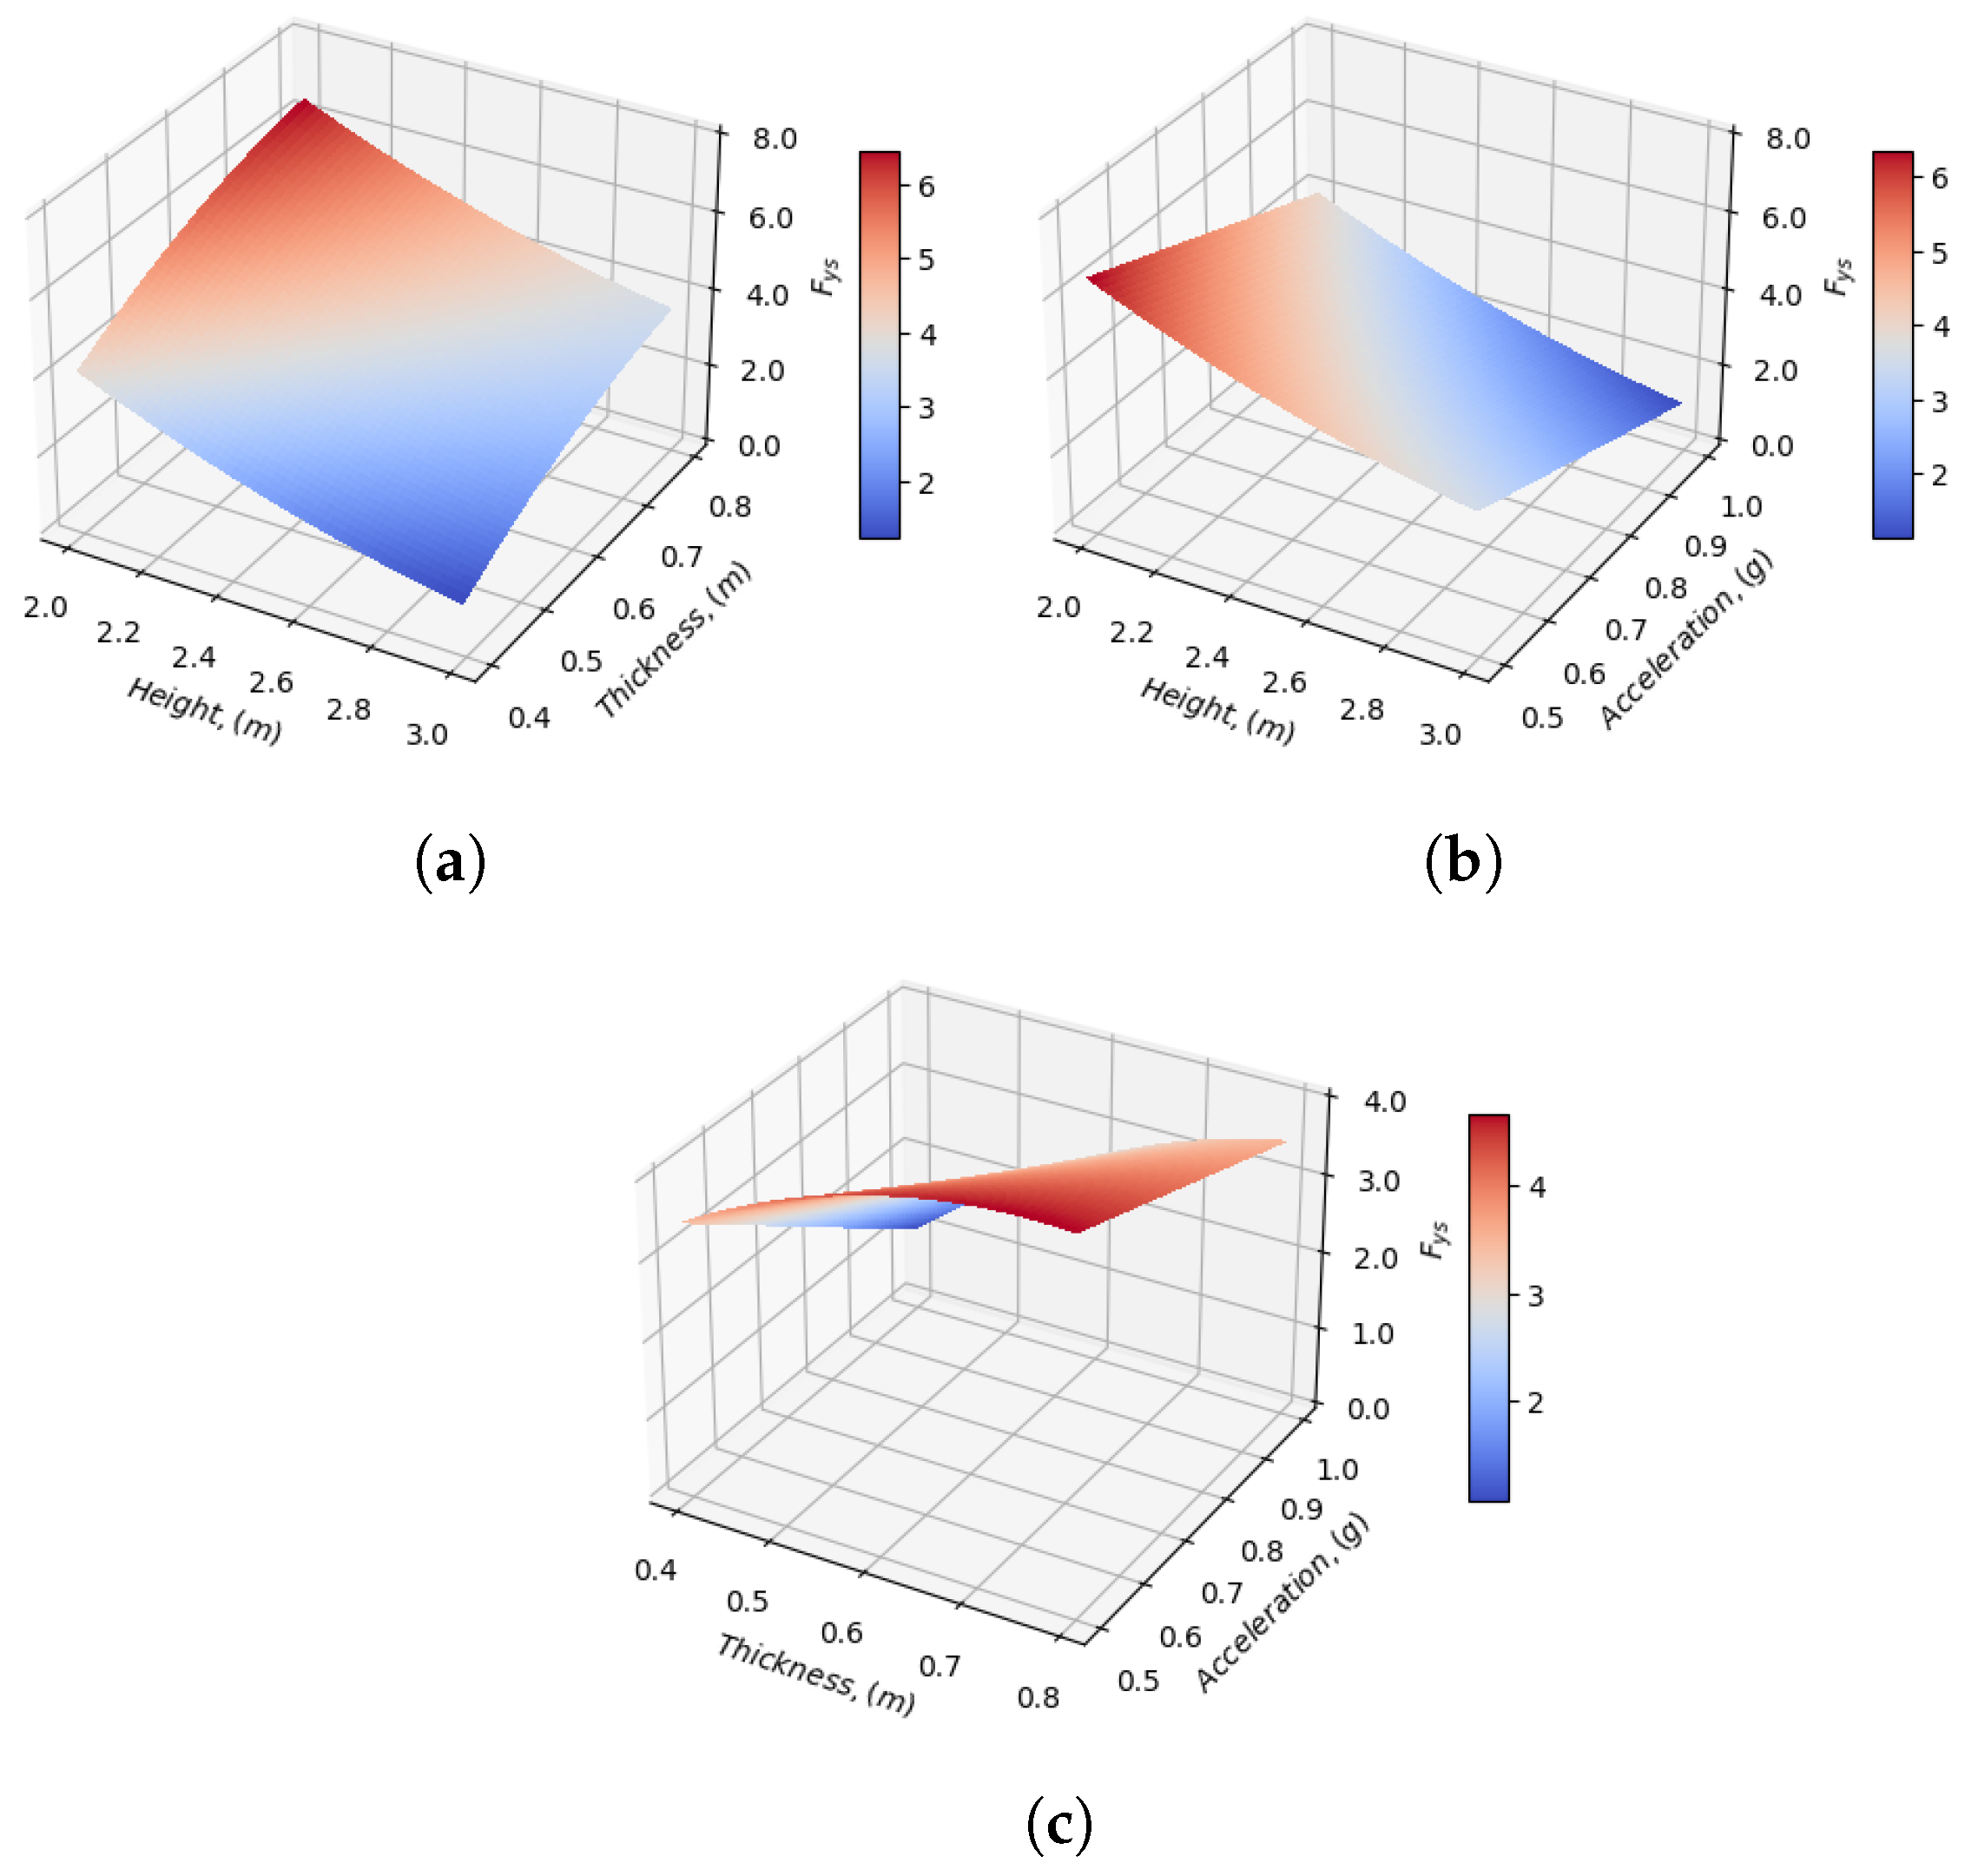
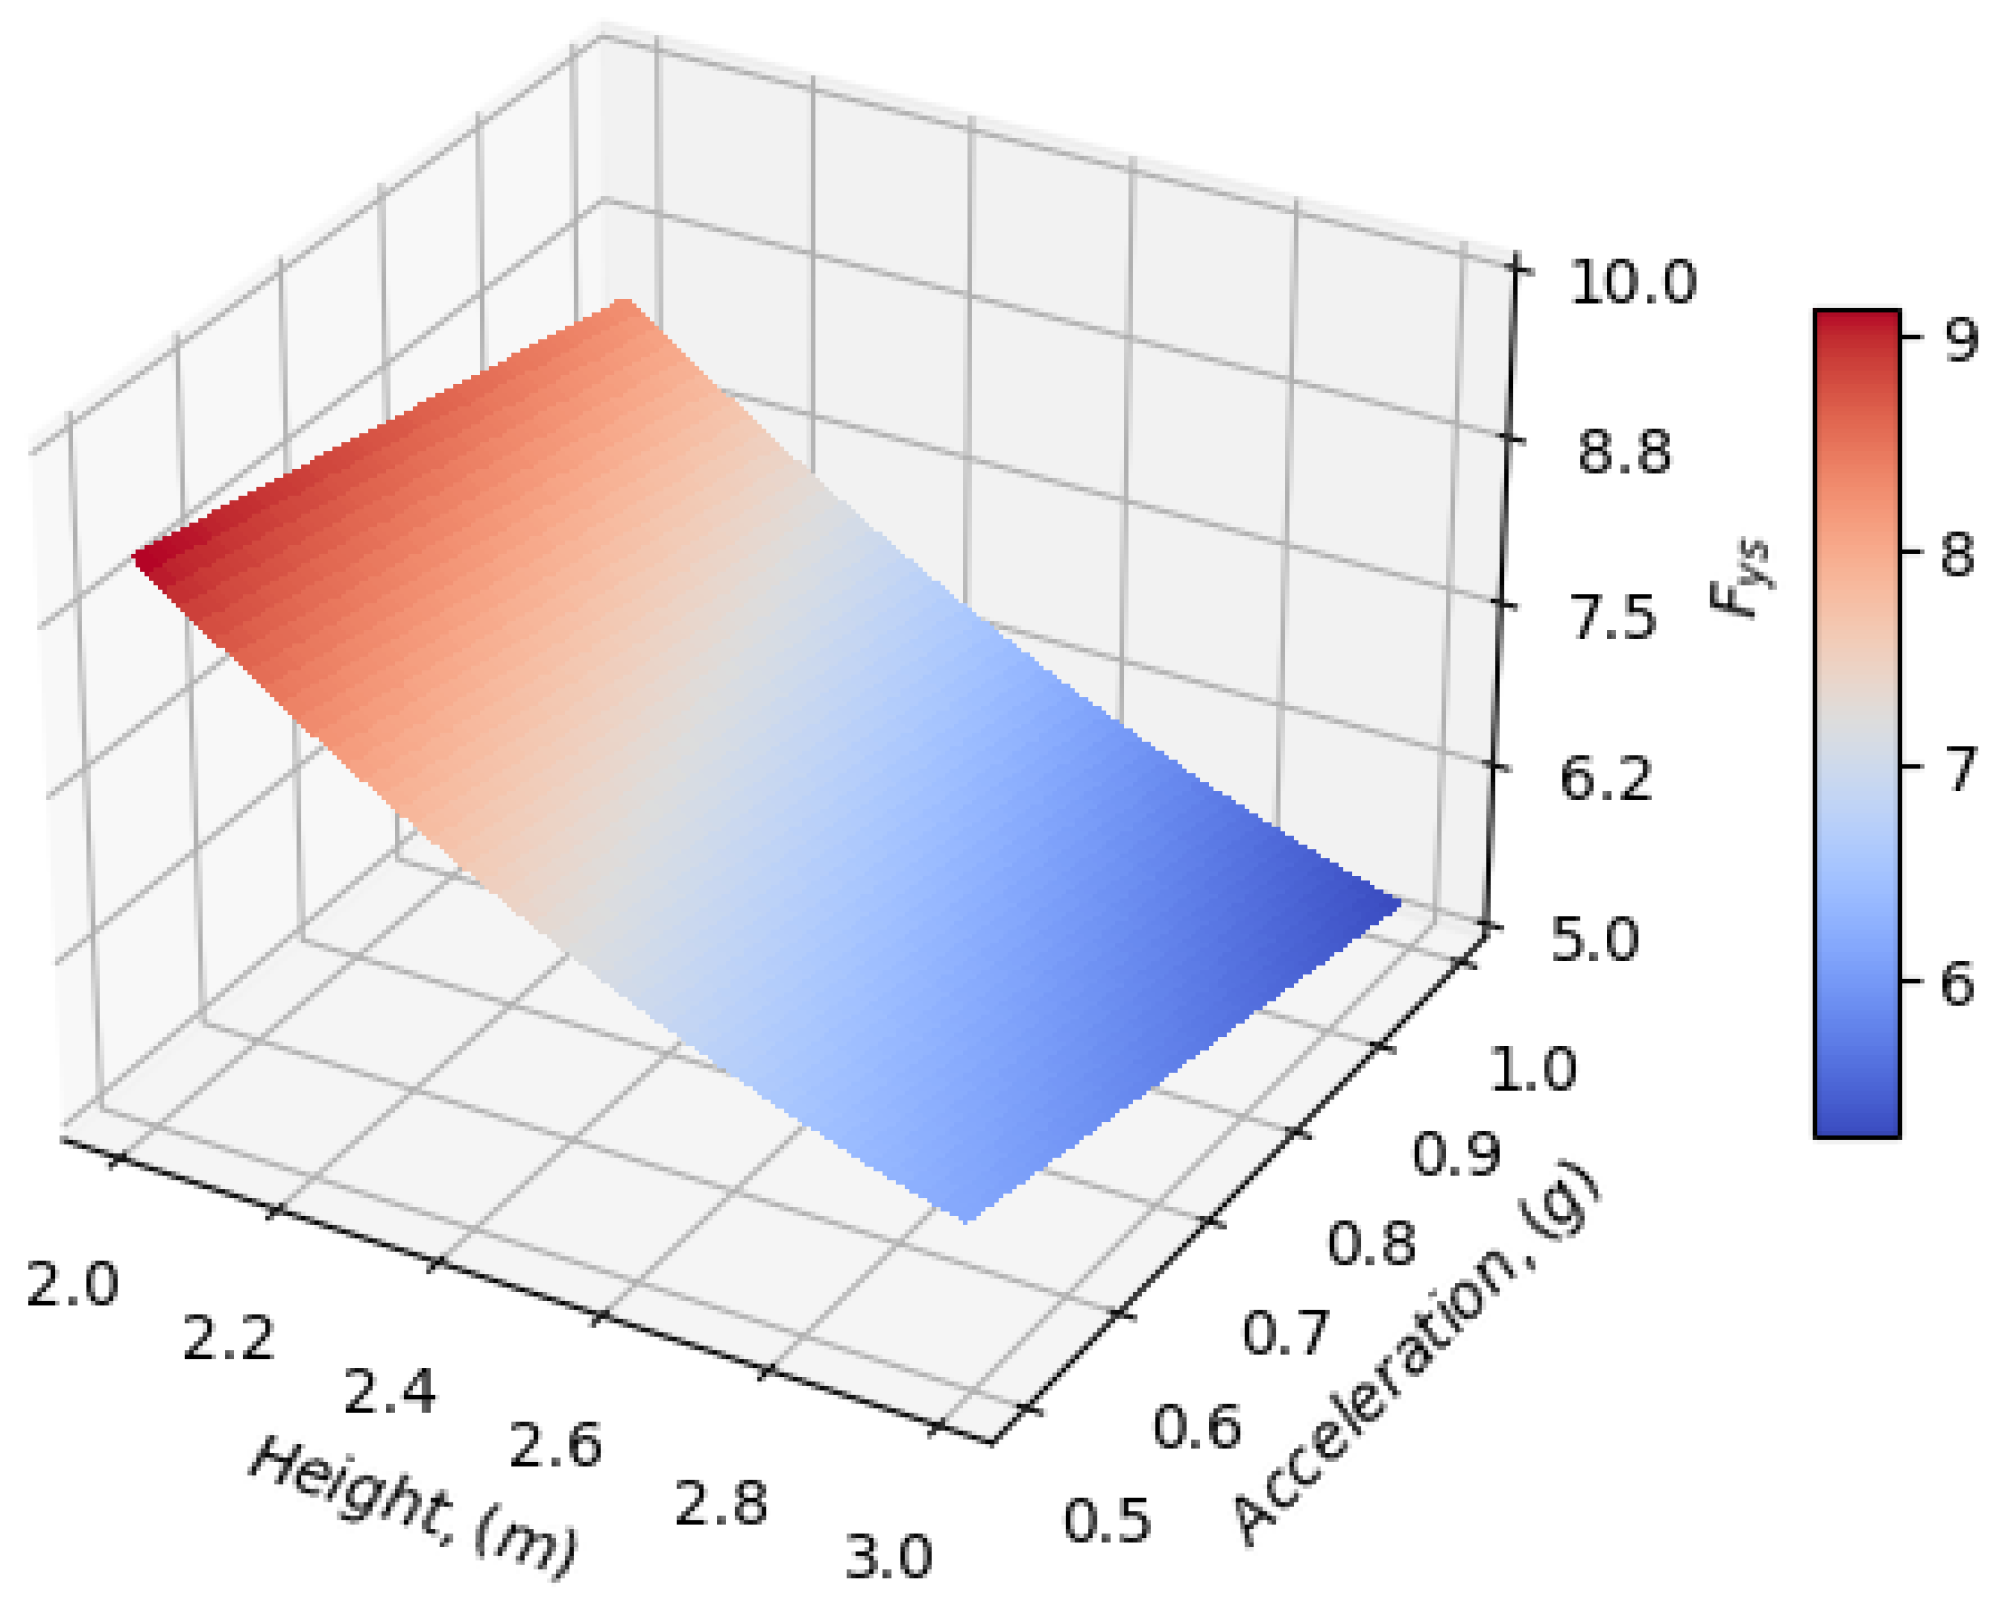
3.7. Key Numerical Findings Presentation and Discussion
4. Conclusions and Future Directions
Funding
Institutional Review Board Statement
Informed Consent Statement
Data Availability Statement
Conflicts of Interest
Abbreviations
| FEM | Finite element method |
| NIAH | National Inventory of Architectural Heritage |
| SHARE | Seismic Hazard Harmonization in Europe |
| PGA | Peak ground acceleration |
| NIKER | Earthquake-induced risk |
| DOEs | Design of experiments |
| CCD | Central composite design |
| ANOVA | Analysis of variance |
Appendix A. Sensitivity Analysis

| Case | Uncertainty | Parametric Equation Evaluation | Comparison to Reference Value |
|---|---|---|---|
| FEM OOP | −20 | 0.8773 | −19.77 |
| −10 | 0.9924 | −9.24 | |
| 0 * | 1.0934 | 0.00 | |
| 10 | 1.1866 | 8.52 | |
| 20 | 1.3141 | 20.18 | |
| FEM IP | −20 | 4.1603 | −19.93 |
| −10 | 4.6731 | −10.06 | |
| 0 * | 5.1960 | 0.00 | |
| 10 | 5.7191 | 10.07 | |
| 20 | 6.2308 | 19.91 | |
| LA OOP | −20 | 0.0654 | −18.95 |
| −20 | 0.1288 | −0.88 | |
| −10 | 0.0741 | −8.13 | |
| −10 | 0.1297 | −0.17 | |
| 0 * | 0.0807 | 0.00 | |
| 0 * | 0.1299 | 0.00 | |
| 10 | 0.0859 | 6.49 | |
| 10 | 0.1304 | 0.37 | |
| 20 | 0.0902 | 11.81 | |
| 20 | 0.1305 | 0.44 | |
| LA IP | −20 | 0.3315 | −9.53 |
| −20 | 0.5145 | 1.59 | |
| −10 | 0.3543 | −3.31 | |
| −10 | 0.5133 | 1.36 | |
| 0 * | 0.3664 | 0.00 | |
| 0 * | 0.5064 | 0.00 | |
| 10 | 0.3872 | 5.66 | |
| 10 | 0.5122 | 1.13 | |
| 20 | 0.3971 | 8.37 | |
| 20 | 0.5111 | 0.92 |
References
- Henderson, K.; Loreau, M. A model of Sustainable Development Goals: Challenges and opportunities in promoting human well-being and environmental sustainability. Ecol. Model. 2023, 475, 110164. [Google Scholar] [CrossRef]
- Alrashed, F.; Asif, M.; Burek, S. The Role of Vernacular Construction Techniques and Materials for Developing Zero-Energy Homes in Various Desert Climates. Buildings 2017, 7, 17. [Google Scholar] [CrossRef]
- Li, S.; Wang, M.; Shen, P.; Cui, X.; Bu, L.; Wei, R.; Zhang, L.; Wu, C. Energy Saving and Thermal Comfort Performance of Passive Retrofitting Measures for Traditional Rammed Earth House in Lingnan, China. Buildings 2022, 12, 1716. [Google Scholar] [CrossRef]
- Feiglstorfer, H.; Ottner, F. The Impact of Clay Minerals on the Building Technology of Vernacular Earthen Architecture in Eastern Austria. Heritage 2022, 5, 378–401. [Google Scholar] [CrossRef]
- Eudave, R.R.; Ferreira, T.M.; Vicente, R.; Lourenco, P.B.; Peña, F. Parametric and Machine Learning-Based Analysis of the Seismic Vulnerability of Adobe Historical Buildings Damaged After the September 2017 Mexico Earthquakes. Int. J. Archit. Herit. 2023, 2023, 2200739. [Google Scholar] [CrossRef]
- Lahbabi, S.; Bouferra, R.; Saadi, L.; Khalil, A. Evaluation of the void index method on the mechanical and thermal properties of compressed earth blocks stabilized with bentonite clay. Constr. Build. Mater. 2023, 393, 132114. [Google Scholar] [CrossRef]
- Borisov, A.V.; Krivosheev, M.V.; Mimokhod, R.A.; El’tsov, M.V. “Sod blocks” in kurgan mounds: Historical and soil features of the technique of tumuli erection. J. Archaeol. Sci. Rep. 2019, 24, 122–131. [Google Scholar] [CrossRef]
- Qi, Y.; Huang, H. Experimental Study on the Lateral Performance of Traditional Wooden Structure with Bamboo-Woven Mud Infill. In Proceedings of the 2022 International Conference on Green Building, Civil Engineering and Smart City, Stockholm, Sweden, 24–26 June 2022; Guo, W., Qian, K., Eds.; Springer: Berlin/Heidelberg, Germany, 2023; pp. 649–659. [Google Scholar]
- Zanichelli, A.; Vantadori, S.; Ronchei, C.; Scorza, D. Numerical simulation of fracture behaviour of the shot-earth 772. Procedia Struct. Integr. 2022, 42, 118–124. [Google Scholar] [CrossRef]
- Ávila, F.; Fagone, M.; Gallego, R.; Puertas, E.; Ranocchiai, G. Experimental and numerical evaluation of the compressive and shear behavior of unstabilized rammed earth. Mater. Struct. 2023, 56, 118. [Google Scholar] [CrossRef]
- Jiménez Rios, A.; O’Dwyer, D. Earthen Buildings in Ireland; CRC Press/Balkema: Brussels, Belgium, 2018; Volume 2, pp. 787–794. Available online: https://www.taylorfrancis.com/chapters/edit/10.1201/9780429446719-12/earthen-buildings-ireland-jim%C3%A9nez-rios-alejandro-dwyer-dermot (accessed on 1 June 2023).
- Khan, N.A.; Aloisio, A.; Monti, G.; Nuti, C.; Briseghella, B. Experimental characterization and empirical strength prediction of Pakistani brick masonry walls. J. Build. Eng. 2023, 71, 106451. [Google Scholar] [CrossRef]
- Miccoli, L.; Müller, U.; Fontana, P. Mechanical behaviour of earthen materials: A comparison between earth block masonry, rammed earth and cob. Constr. Build. Mater. 2014, 61, 327–339. [Google Scholar] [CrossRef]
- Jiménez Rios, A.; O’Dwyer, D. Numerical Modeling of Cob’s Nonlinear Monotonic Structural Behavior. Int. J. Comput. Methods 2020, 17, 1940013. [Google Scholar] [CrossRef]
- Belarbi, Y.E.; Sawadogo, M.; Poullain, P.; Issaadi, N.; Hamami, A.E.A.; Bonnet, S.; Belarbi, R. Experimental Characterization of Raw Earth Properties for Modeling Their Hygrothermal Behavior. Buildings 2022, 12, 648. [Google Scholar] [CrossRef]
- Affan, H.; Touati, K.; Benzaama, M.H.; Chateigner, D.; El Mendili, Y. Earth-Based Building Incorporating Sargassum muticum Seaweed: Mechanical and Hygrothermal Performances. Buildings 2023, 13, 932. [Google Scholar] [CrossRef]
- Spennemann, D.H.R. Earth to Earth: Patterns of Environmental Decay Affecting Modern Pise Walls. Buildings 2022, 12, 748. [Google Scholar] [CrossRef]
- Tan, J.; Liang, J.; Wan, L.; Jiang, B. Influence of Non-Constant Hygrothermal Parameters on Heat and Moisture Transfer in Rammed Earth Walls. Buildings 2022, 12, 1077. [Google Scholar] [CrossRef]
- Matos, A.M.; Varum, H. Self-Compacting Earth-Based Composites: Mixture Design and Multi-Performance Characterisation. Buildings 2022, 12, 612. [Google Scholar] [CrossRef]
- Correia, M.; Dipasquale, L.; Mecca, S. Terra Europae: Earthen Architecture in the European Union; Edizioni ETS: Pisa, Italy, 2011. [Google Scholar]
- Ramírez Eudave, R.; Ferreira, T.M.; Vicente, R. Parameter-based seismic vulnerability assessment of Mexican historical buildings: Insights, suitability, and uncertainty treatment. Int. J. Disaster Risk Reduct. 2022, 74, 102909. [Google Scholar] [CrossRef]
- Jiménez Rios, A.; O’Dwyer, D. Experimental validation for the application of the flat jack test in cob walls. Constr. Build. Mater. 2020, 254, 119148. [Google Scholar] [CrossRef]
- Jiménez Rios, A.; O’Dwyer, D. Adaptations of the flat jack test for its application in cob walls. MethodsX 2020, 7, 101003. [Google Scholar] [CrossRef]
- Jiménez Rios, A.; O’Dwyer, D. Data collected from the experimental validation for the application of flat jack tests in cob walls. Data Brief 2020, 31, 105764. [Google Scholar] [CrossRef] [PubMed]
- Young, A. A Tour in Ireland: With General Observations on the Present State of that Kingdom: Made in the Years 1776, 1777, and 1778. And Brought Down to the End of 1779; Number v. 1 in A Tour in Ireland; Bonham, G., Ed.; Adamant Media Corporation: Tampa, FL, USA, 1780. [Google Scholar]
- Gailey, A. Rural Houses of the North of Ireland; Donald: Victoria, Australia, 1984. [Google Scholar]
- Pfeiffer, W. Irish Cottages; Random House Value Publishing: New York, NY, USA, 1992. [Google Scholar]
- Keefe, L.; Trust, D.H.B. The Cob Buildings of Devon: Repair and Maintenance; Number v. 2; Devon Historic Buildings Trust: Devon, UK, 1993. [Google Scholar]
- O’Reilly, B. Hearth and home: The vernacular house in Ireland from c. 1800. Proc. R. Ir. Acad. Sect. Archaeol. Celt. Stud. Hist. Linguist. Lit. 2011, 111C, 193–215. [Google Scholar]
- Ahmadi, S.S.; Karanikoloudis, G.; Mendes, N.; Illambas, R.; Lourenco, P.B. Appraising the Seismic Response of a Retrofitted Adobe Historic Structure, the Role of Modal Updating and Advanced Computations. Buildings 2022, 12, 1795. [Google Scholar] [CrossRef]
- Giardini, D.; Wössner, J.; Danciu, L. Mapping Europe’s Seismic Hazard. Eos Trans. Am. Geophys. Union 2014, 95, 261–262. [Google Scholar] [CrossRef]
- Webster, F.A. Application of stability-based retrofit measures on some historic and older adobe buildings in California. In Proceedings of the Getty Seismic Adobe Project 2006 Colloquium, Los Angeles, CA, USA, 11–13 April 2006. [Google Scholar]
- Chopra, A. Dynamics of Structures; Prentice-Hall International Series in Civil Engineering and Engineering Mechanics; Pearson Education: London, UK, 2007. [Google Scholar]
- ANSYS Inc. ANSYS Academic Research Mechanical; ANSYS Inc.: Canonsburg, PA, USA, 2017. [Google Scholar]
- Roca, P.; Pelà, L.; Molins, C. The Iscarsah Guidelines on the Analysis, Conservation and Structural Restoration of Architectural Heritage. In Proceedings of the 12th International Conference on Structural Analysis of Historical Constructions (SAHC), Online, 29 September 2021. [Google Scholar]
- Janicki, D. Typical Weights of Building Materials. 2023. Available online: https://www.yourspreadsheets.co.uk/typical-weights-of-building-materials.html (accessed on 1 June 2023).
- ANSYS Inc. ANSYS Mechanical APDL Element Reference; ANSYS Inc.: Canonsburg, PA, USA, 2017. [Google Scholar]
- ANSYS Inc. ANSYS Mechanical User’s Guide; ANSYS Inc.: Canonsburg, PA, USA, 2017. [Google Scholar]
- Miccoli, L.; Silva, R.A.; Oliveira, D.V.; Müller, U. Static Behavior of Cob: Experimental Testing and Finite-Element Modeling. J. Mater. Civ. Eng. 2019, 31, 04019021. [Google Scholar] [CrossRef]
- Cantini, L.; da Porto, F.; Giacometti, G.; Lorenzoni, F.; Saisi, A.E.; Valluzzi, M. Creation of a structured catalogue. In Structural Analysis of Historical Constructions-SAHC 2012; Dolnośląskie Wydawnictwo Edukacyjne (DWE): Wroclaw, Poland, 2012; pp. 2861–2869. [Google Scholar]
- Jiménez Rios, A.; Pingaro, M.; Reccia, E.; Trovalusci, P. Statistical Assessment of In-Plane Masonry Panels Using Limit Analysis with Sliding Mechanism. J. Eng. Mech. 2022, 148, 04021158. [Google Scholar] [CrossRef]
- Jiménez Rios, A.; Nela, B.; Pingaro, M.; Reccia, E.; Trovalusci, P. Rotation and sliding collapse mechanisms for in plane masonry pointed arches: Statistical parametric assessment. Eng. Struct. 2022, 262, 114338. [Google Scholar] [CrossRef]
- Nela, B.; Jiménez Rios, A.; Pingaro, M.; Reccia, E.; Trovalusci, P. Limit analysis of locally reinforced masonry arches. Eng. Struct. 2022, 271, 114921. [Google Scholar] [CrossRef]
- Jiménez Rios, A.; Nela, B.; Pingaro, M.; Reccia, E.; Trovalusci, P. Parametric analysis of masonry arches following a limit analysis approach: Influence of joint friction, pier texture, and arch shallowness. Math. Mech. Solids 2023, 10812865231175385. [Google Scholar] [CrossRef]
- Valluzzi, M.R.; Munari, M.; Modena, C.; Binda, L.; Cardani, G.; Saisi, A. Multilevel Approach to the Vulnerability Analysis of Historic Buildings in Seismic Areas Part 2: Analytical Interpretation of Mechanisms for Vulnerability Analysis and Structural Improvement / Ansatz zur Analyse der Empfindlichkeit historischer Gebäude in Erdbeben gefährdeten Zonen auf mehreren Ebenen; Teil 2: Analytische Interpretation der Mechanismen für eine Empfindlichkeitsanalyse und für das Ertüchtigen von Tragwerken. Restor. Build. Monum. 2007, 13, 427–442. [Google Scholar] [CrossRef]
- The MathWorks Inc. MATLAB Version: 9.13.0 (R2022b); The MathWorks Inc.: Wroclaw, Poland, 2022. [Google Scholar]
- ANSYS Inc. ANSYS Design Exploration User’s Guide; ANSYS Inc.: Canonsburg, PA, USA, 2017. [Google Scholar]
- Minitab, LLC. Minitab; Minitab, LLC: State College, PA, USA, 2017. [Google Scholar]
- Minitab, LLC. MINITAB User’s Guide 2: Data Analysis and Quality Tools; Minitab, LLC: State College, PA, USA, 2017. [Google Scholar]
- Montgomery, D.C.; Runger, G.C. Applied Statistics and Probability for Engineers; John Wiley & Sons: Hoboken, NJ, USA, 2020. [Google Scholar]
- Jiménez Rios, A.; Ruiz-Capel, S.; Plevris, V.; Nogal, M. Computational methods applied to earthen historical structures. Front. Built Environ. 2023, 9, 1219108. [Google Scholar] [CrossRef]
- Heyman, J. The stone skeleton. Int. J. Solids Struct. 1966, 2, 249–279. [Google Scholar] [CrossRef]
- Heyman, J. The Mansonry Arch; Cambridge University Press: Cambridge, UK, 1982. [Google Scholar]


| Property | Value |
|---|---|
| Density (kg/m) | 1475 |
| Young’s modulus (Pa) | 1.021 × 10 |
| Poisson’s ratio (-) | |
| Tension yield strength (Pa) | 0.062 × 10 |
| Compression yield strength (Pa) | 0.477 × 10 |
| Parameter | Minimum Value | Maximum Value |
|---|---|---|
| Length (m) | ||
| Height (m) | ||
| Thickness (m) |
| Analysis Type | Mechanism | Response | Value |
|---|---|---|---|
| FEM | In-plane | ||
| Out-of-plane | |||
| Limit Analysis | In-plane | ||
| Out-of-plane | |||
Disclaimer/Publisher’s Note: The statements, opinions and data contained in all publications are solely those of the individual author(s) and contributor(s) and not of MDPI and/or the editor(s). MDPI and/or the editor(s) disclaim responsibility for any injury to people or property resulting from any ideas, methods, instructions or products referred to in the content. |
© 2023 by the author. Licensee MDPI, Basel, Switzerland. This article is an open access article distributed under the terms and conditions of the Creative Commons Attribution (CC BY) license (https://creativecommons.org/licenses/by/4.0/).
Share and Cite
Jiménez Rios, A. Learning from the Past: Parametric Analysis of Cob Walls. Appl. Sci. 2023, 13, 9045. https://doi.org/10.3390/app13159045
Jiménez Rios A. Learning from the Past: Parametric Analysis of Cob Walls. Applied Sciences. 2023; 13(15):9045. https://doi.org/10.3390/app13159045
Chicago/Turabian StyleJiménez Rios, Alejandro. 2023. "Learning from the Past: Parametric Analysis of Cob Walls" Applied Sciences 13, no. 15: 9045. https://doi.org/10.3390/app13159045
APA StyleJiménez Rios, A. (2023). Learning from the Past: Parametric Analysis of Cob Walls. Applied Sciences, 13(15), 9045. https://doi.org/10.3390/app13159045