Abstract
The recent seismic activity in Croatia has inflicted significant damage upon numerous buildings, with masonry structures being particularly affected. Consequently, experimental investigations and structural condition assessments’ have garnered increased attention, as they have become integral to the renovation process for such buildings. Additionally, assessing the structural condition prior to seismic events is vital for determining the extent to which earthquakes impact the stiffness of systems, such as masonry structures. This paper presents the results of experimental investigations and numerical analysis conducted on a damaged high school building in Sisak, Croatia. The experimental investigation involved shear testing, flat jack analysis, and operational modal analysis. Utilizing the available drawings and mechanical properties determined experimentally, an initial numerical model was developed. Subsequently, through the iterative process of finite element model updating, the initial numerical model was refined based on the structural dynamic properties. The updated numerical model was then employed to assess the structural condition prior to the earthquake event. This study contributes to the field by providing insights into the post-earthquake estimation of dynamic properties in intact masonry buildings, utilizing a comprehensive approach that combines experimental investigations and finite element model updating. By quantifying the changes in dynamic parameters, such as natural frequencies and mode shapes, the study provides valuable insights into the response characteristics of damaged masonry building. The observed differences in natural frequencies between the damaged and undamaged states are as follows: 9% for the first mode shape, 6% for the second mode shape, and 2% for the third mode shape.
1. Introduction
During the past few decades, natural hazards such as earthquakes have remained as one of the grand challenges in structural and earthquake engineering. These challenges have led to an increasing emphasis on structural assessment and health monitoring to evaluate the structural conditions and gave recommendations for further procedures related to the renovation, rehabilitation, and maintenance of buildings.
During such hazards, masonry buildings, which were mostly built at a time when there were no legal regulations for the design of seismically resistant buildings, take a significant hit (a series of damages and collapses). Due to the lack of the knowledge about their condition and mechanical properties, experimental investigation plays an important role. To evaluate the performance of such structures, different damage assessment methods based on the qualitative and/or quantitative data have been developed [1,2,3,4,5,6,7]. The main aim of them is an identification of the existence, location, and severity of the damage and estimation of the remaining structural life. In addition, the experimental investigations are important segment for numerical modelling of existing structures [8]. Combining it with numerical modelling is often used to obtain the real structural behaviour numerically and interpretate it with ideal boundary conditions and constitute materials [9,10]. The whole process of improving the numerical model according to the experimental investigation test results is performed as a part of finite element model updating (FEMU) procedure [11]. The FEMU process is based on the iteratively updating the design variables (material properties, geometry, boundary conditions, etc.) to obtain the experimental investigation test results numerically [12]. The experimental investigations that are performed most frequently include the dynamic test, i.e., determination of natural frequencies and mode shapes [13]. These parameters are the best indicators of any changes on structure. If there are any changes in form of damage that could affect the change in stiffness, it will also affect the change in natural frequencies and mode shapes [14]. On the other hand, if we move to the local level of the model and the mechanical properties of the materials of structural systems such as masonry buildings, a series of laboratory and field tests are carried out. They usually include shear tests [15], tensile tests [16], flat jack tests [17], and other destructive [8] and non-destructive [18] tests. Performing these tests, shear and compressive strength, vertical stress, modulus of elasticity, relationship between deformation, and other mechanical properties can be obtained. They become a very important source of information for designers.
The research focuses on assessing the dynamic parameters of masonry buildings prior to earthquakes, with a novel approach combining experimental investigations and numerical analysis. The study aims to quantify the changes in dynamic parameters, such as natural frequencies and mode shapes, providing valuable insights into the response characteristics of damaged masonry buildings. The paper discusses the potential masking of severe damage by other factors that influence the alteration of dynamic parameters, highlighting the need for a comprehensive understanding of the dynamic behavior of masonry structures before seismic events. Through iterative model updating, including modifications to boundary conditions, partition walls, damages, and global stiffness, the researchers successfully improve the numerical model’s accuracy in describing the current structural condition. The resulting model allows for the creation of a behavior model that describes the structure before earthquake-induced damage, contributing to improved structural condition assessment and effective mitigation strategies.
The paper is organized as follows: the Section 2 provides an analysis of the structural dynamic properties’ changes due to seismic action. Section 3 describes the experimental investigation performed on the structure which includes the visual inspection, determination of the mechanical properties of masonry walls, and the determination of the structural dynamic properties. In Section 4, the development and the analysis of the initial numerical model is described. Section 5 gives an overview of the performed the finite element model updating steps. In Section 6, an assessment of the structural condition of the case study building before the earthquake is performed. In the last section, Section 7, concluding remarks are made.
2. Dynamic Properties’ Changes Due to the Seismic Action
Damage-induced stiffness reduction often leads to changes in the vibration characteristics of the structural system. Consequently, tracking variations in the modal parameters over time can serve as a means to detect damage. The alterations in dynamic characteristics yield crucial information for evaluating the structural integrity of civil engineering structures. The correlation between structural damage and dynamic characteristics can be addressed by employing natural frequencies, mode shapes, and damping ratios.
Following an earthquake, masonry structures typically exhibit a decrease in their natural frequencies. Cavalagli et al. [19] observed a general decrease in the statistics of natural frequencies in terms of mean, extreme, and standard deviation of a bell tower that had experienced several far-field earthquakes. The permanent frequency decays were roughly estimated to be of the order of 1–2%. Gazques et al. [20] record the changes of natural frequencies due to the earthquake of 4% means value for the three observed modes of 10-story reinforced-concrete building. To simulate various levels of realistic seismic damage in high rise structural buildings, Xiaodong et al. [21] conducted a series of full-scale tests on the shaking table. From the conducted studies, the authors observed the changes on natural frequencies decreasing on average 4.1, 5.4, and 11.9%. Sivori et al. [22] present the changes of the natural frequency of the Pizzoli town hall building during the 2016–2017 central Italy earthquake sequence from 6 to 14% for the first bending mode in x direction and 6 to 19% for the bending mode in y direction. Mendes et al. [23] analyze the dynamic identification results of the scale model tested of the typical Gaioleiro building subjected to several seismic test on shaking table with increasing amplitude. They recorded a first frequency change of 19% after the earthquake for the first step increase in the amplitude of 25%. Kaya et al. [24] noted the natural frequencies’ value changes as 3.91% for transverse mode, 0.66% for longitudinal mode, and 8.69% for torsion mode, according to undamaged condition of unreinforced masonry building laboratory model. The aforementioned studies suggest that natural frequencies can be a valuable means of detecting damage and assessment to structural condition after the earthquake. While this approach is straightforward and various tools can be utilized to extract natural frequencies from experimental data, it has two inherent limitations. Firstly, it can potentially yield misleading results in terms of damage detection. Secondly, assessing damage localization becomes challenging, if not impossible, using this method. Ohba and Fukuda [25] performed the research on five-story apartment buildings and the changes of natural frequencies caused by earthquakes. They concluded based on this research that the changes of natural frequencies can be significantly affected by variances in soil stiffness. On the other hand, Wiliam et al. [26], after a strong earthquake that hit the area of Southern California, found a decrease in frequency of 12% (north–south) and 22% (east–west), which the authors attributed to minor structural damage and changes in the ground structure system caused by large earthquakes. Damage detection can be highly inaccurate if natural frequencies are used only, regardless of the associated mode shapes. Thus, researchers [27] observed the effectiveness of vibration-based methods for dynamic identification and damage detection on masonry structures using experimental tests and operational modal analysis, focusing on the entire set of modal parameters obtained from the test.
As the natural frequencies of masonry buildings change due to seismic load, so do the vibration patterns. Generally, the mode shapes show the spatial distribution of displacement patterns within the structure at specific frequencies. In comparison to natural frequencies, the estimation of mode shapes is generally more difficult and requires both a high signal to noise ratio and a large number of optimally located sensors. In addition to natural frequencies, Mendes et al. [23] in their study analyze the changes of mode shapes in form of the MAC factor due to the earthquake. Through their research, they showed that higher mode shapes are not suitable for direct comparison of seismic properties. During testing, the first transverse mode shown on the average MAC is equal to 0.95. Other modes showed lower MAC (lower than 0.80). This means that although the shape of the mode is similar, the mode is not exactly the same due to the damage caused. Pepi et al. [27] in their work shows that the small variation in the natural frequency’s values (in their case for the first and third modes) corresponds to large MAC factor variation. Thus, this confirms that the combination of the natural frequencies and mode shapes can avoid misleading conclusions for outcomes of dynamic identification of complex structural system such as masonry structures. In addition to the MAC, several other mode shapes comparison criteria [28] can be used for damage detection of masonry buildings such as Modal Displacement Index (MDI), Modal Strain Energy (MSE), Modal Curvature Changes, etc.
Third, dynamic parameters which change can also serve for damage detection is the modal damping. These incorporate the contribution of hysteretic damping arising from non-linear phenomena and yielding of structural members. Therefore, they serve as a highly sensitive indicator of the magnitude of inelastic deformation occurring during intense vibrations. The understanding of damping mechanisms in structural dynamics and modal testing problems is currently limited. In general, assume viscous damping does not accurately represent the true damping characteristics of structures. Modal damping ratios tend to increase gradually as oscillation levels rise [29]. Genc et al. [30] studied the effect of the damping ratio on the seismic behavior of historical structures. Based on the analysis performed on the historical masonry structure they concluded that the displacement, stress level, and strain values increase, and the damping ratio decrease. It is also highlighted that the damping ratio is a valuable source of information for structures that are weak to external effects, especially earthquakes, and that before the numerical evaluation of seismic behavior, the damping ratio should be experimentally determined. Other relevant studies [31,32,33] also discuss changes in the damping coefficient with respect to seismic action, where only estimates of this value are given without comparing the initially undamaged and damaged state. In addition, the mentioned studies point out that with the cracking of the walls, significant increases occur in the period values and damping ratios. Consequently, accurately determining modal damping ratios poses a significant challenge due to considerable variability associated with estimates of natural frequency and mode shape. In practical scenarios, conducting a free vibration test can be an effective means of identifying modal damping ratios.
Based on the review, the following can be highlighted. The phenomenon of decreasing the natural frequencies can be attributed primarily to the deterioration of structural stiffness due to the deterioration of masonry elements. The presence of cracks, displacements, and the loss of material strength all contribute to a reduction in structural stiffness and thus lead to a decrease in natural frequencies. In conjunction with the decrease in natural frequencies, the mode shapes of masonry buildings may change after an earthquake. The appearance of new cracks or changes in the stiffness distribution can trigger shifts in mode shapes that manifest as changes in the dominant vibration patterns of the building. After an earthquake, the presence of additional cracks and damaged masonry elements can increase the damping characteristics of the building system. As a result, there may be a slight increase in the damping ratio, which affects the decay rate of the vibration amplitudes.
Although the change of dynamic parameters due to earthquakes is a very detailed and long-studied area, there is still a lack of studies that provide concrete information about the changes in a real structure [34]. The above confirms the need to consider each structure individually and to adapt certain proposed approaches. Furthermore, it is also about the change of dynamic parameters due to changes in environmental conditions [35], which can also be significant and do not necessarily mean the occurrence of damage.
3. Experimental Investigation
As a case study, a building of a high school in Sisak (Figure 1) built in 1935 was taken. The building has four floors: basement, ground floor, and two upper floors. In the central part of the building there is a three-legged staircase with a landing. The foundations are constructed as a reinforced concrete slab. The load-bearing part of structure consists of walls made of solid bricks of 29(39) cm × 15 cm × 6.5 cm, floor slabs and reinforced concrete ribbed floor slabs. The thickness of the load-bearing walls in the basement is 60 cm and 75 cm, and 50 cm and 60 cm on the ground floor and upper floors. The partition walls are 15 cm, 18 cm, 25 cm or 30 cm thick and are made of hollow blocks. The floor slab is 25 cm thick and the reinforced concrete ribbed floor slab has a total height of 33 cm. The clear distance between the ribs is 60 cm, the width of the ribs is 13 cm, and the height is 23 cm. At the entrance of the building on the first and second floors, there is a load-bearing part of the structure that rests on columns with the square section of 75 cm × 75 cm and a height of 470 cm. The columns are arranged in two rows of four or six columns at equal centre distance of 330 cm. The mezzanine structure in this part is reinforced with beams of 75 cm × 123 cm, placed at an axial distance of 330 cm above the columns. The supporting structure of the roof is made of wood and is 418 cm high. The geometrical dimensions of the building are 37 m × 37 m.
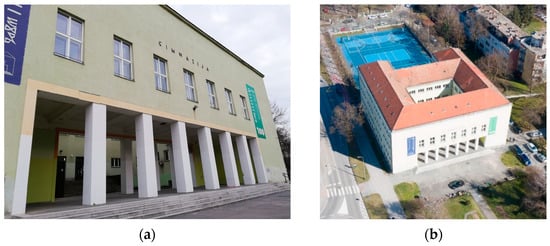
Figure 1.
High school building in Sisak (a) entrance in school (b) bird view.
Within the experimental investigation of case study determination of mechanical properties (Figure 2) of the masonry walls and operational modal analysis (OMA) were considered in addition to visual inspection (Figure 3).
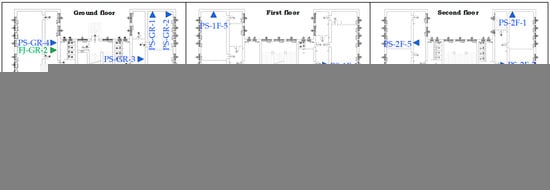
Figure 2.
Measurement points for determination of mechanical properties of walls on the (a) Ground Floor (b) First Floor (c) Second Floor.
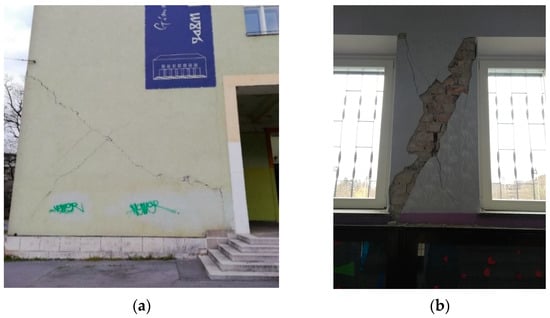
Figure 3.
Observed characteristic damages on (a) the load bearing walls (b) the walls between the openings.
3.1. Visual Inspection
A detailed visual inspection was performed to visually evaluate the structure. During the inspection, some guidelines of the RVS (Rapid Visual Screening) method were applied [36]. The building was inspected by a team of four engineers. The inspection lasted approximately six hours. During the inspection, damage on load bearing and partition walls was observed on the ground floor and first floor. Special attention was paid to crack widths on structural and non-structural elements, separation between structural elements, and displacement of structural components. The cracks were generally diagonal and occurred both in the mortar joints and in the masonry units themselves. Some characteristic and specific damage can be seen in Figure 3. There was frequent evidence of crushing and spalling on many non-structural elements, seen in Figure 4a. Extensive detachment of the surface layer was evident on some parts of the ceiling, seen in Figure 4b. Considering the observation during the visual inspection, the finite element model of the structure in the updating phase is adapted to the found state.

Figure 4.
Observed damage on (a) the partition wall and (b) the ceiling.
3.2. Determination of the Mechanical Properties of Masonry Walls
To determine the mechanical properties of bearing walls, a shear test and flat jack test were performed. As a result of conducted shear test [8], the shear strength, , with the contribution of normal compressive stress, , is obtained. On the observed structure, a total of 15 measurement locations were selected (Figure 2), 5 at each floor in which the shear strength test was performed. The obtained test results are shown in Table 1.

Table 1.
Experimentally obtained values of the compressive stress with their standard deviation (st. dev.) and mean value in megapascals [MPa] for different floors (m).
The obtained compressive stress by performing the shear test are in line with the expected values for this type of building. Its value decreases as the number of floors of the structure increases, which is expected, while the standard deviation is acceptable regarding the number of tests performed on each of the floors.
In the subjected structure, a total of three flat jack tests were performed: two on the first floor and one on the second floor. The obtained values of the existing compressive stress , in the wall are shown in Table 2.
Table 2.
Experimentally determined existing compressive stress , modulus of elasticity and shear strength without compressive stress in megapascals [MPa] for different floors (m).
In addition to existing compressive stress, using the flat jack, the modulus of elasticity is also determined (Table 2). The obtained value is significantly higher than the expected value and the one recommended by the literature [8]. The obtained value of shear strength without compressive stress , using the flat jack test, within one floor varies significantly (test results on the ground floor). The above can be supported by the assumption that the wall at the measurement location FJ-GR-2 is perhaps one of the walls on which rehabilitation work was carried out in a previous period.
3.3. Dynamic Properties
As a part of OMA, structural dynamic properties were obtained. In the following section, each test is described in detail. Operational modal analysis was performed by using piezoelectric accelerometer (PCB Piezotronics, type 393B31) with the nominal sensitivity of 10 V/g (PCB Piezotronics, Depew, NY, USA) an analyzer (Brüell&Kjaer, type 3560C, Brüell&Kjaer, Naerum, Denmark) and associated software. The measurement was performed in total 64 points, 32 points per floor (1st and 2nd) in two perpendicular, x and y, directions (Figure 5) during 128 s in each point. In this way, 128 degrees of freedom were obtained, the sum of which corresponds to two horizontal directions.
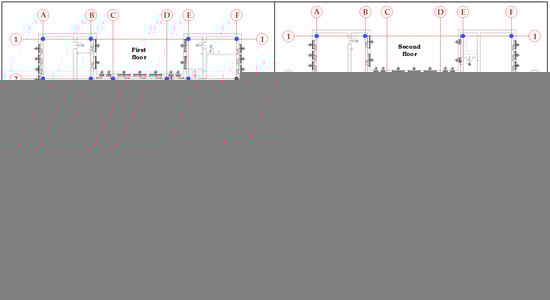
Figure 5.
Arrangement of measurement points for determination of the structural dynamic properties at the (a) first and (b) second floor.
The structural response was measured during the ambient excitation. The reference point was located at the measurement point C3 on the second floor. Classical frequency domain decomposition (FDD) and enhanced frequency domain decomposition (EFDD) methods were used for estimation of structural dynamic properties, natural frequencies (Table 3, Figure 6), and mode shapes (Figure 7). The values of experimentally obtained frequencies for the concerned mode shapes were read from the characteristic record (Figure 6).
Table 3.
Experimentally determined natural frequency values with the standard deviation for observed mode i.
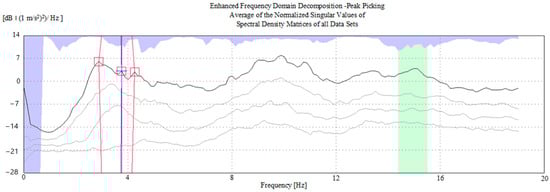
Figure 6.
Characteristic record of frequency domain decomposition (FDD) for the determination of natural frequencies.
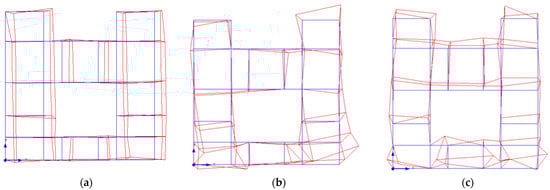
Figure 7.
Experimentally determined (a) first (b) second and (c) third mode shape. The blue lines represent the undeformed shape, while the red line represent deformed shape.
4. Numerical Analysis
Experimentally obtained results were used to update the numerical model of the high school (Figure 8a). The model was developed in the commercial software SCIA Engineering 22 [19]. Considering the fact that the determination of the dynamic parameters is based on the ambient excitation in the vicinity of the real structure, with respect to a very low (hardly measurable) vibration level, it is sufficient for the comparison of the experimentally and numerically determined dynamic parameters to create and analyze a linear numerical model. Walls and slabs were modelled with shell elements, slabs reinforced with ribs are modelled using coupled shell elements, and a slab reinforced with beams is modelled with a shell element that is connected with a beam using rigid elements. Columns and beams are modelled using beam elements. Boundary conditions under the load bearing walls are assumed to be fixed, while for the columns it is proposed that they are clamped. The dimensions of the elements are taken from the drawings. Material properties assigned to the modelled elements are listed in Table 4.
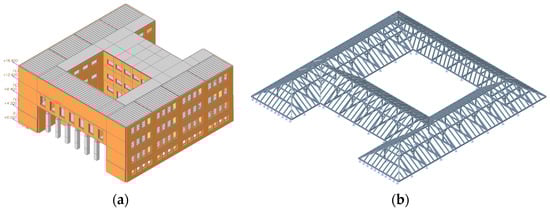
Figure 8.
Numerical model of the case study: (a) 3D model and (b) 3D sub-model of the roof.
Table 4.
Initial mechanical properties of materials assigned to the elements of the case study’ numerical model.
To consider the effect of the roof, i.e., its weight, a sub-model was created (Figure 8b). The basic mechanical properties of the material are taken from the experimental investigation, while the dimensions are defined according to the available drawings. The elements of the roof are modelled using the beam elements. By calculating the sub-model of the roof, reactions from the self-weight were obtained, which were transferred to the 3D model of the structure. Staircases are entered into the 3D model of the structure in the same way (Figure 9a). Since all partition walls were damaged in the earthquake, it was assumed that they did not contribute to the structural stiffness and are introduced to numerical model as additional mass (Figure 9b). The mezzanine structure is modeled as a ribbed slab with additional layers.
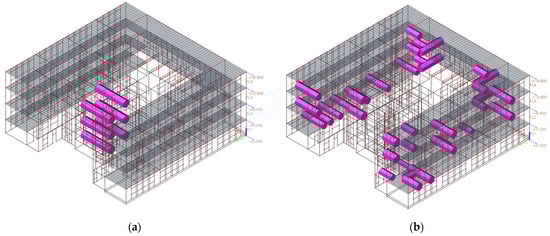
Figure 9.
Initial numerical model of the case study: (a) mass of the staircase and (b) representation of the mass of partition walls in the numerical model.
4.1. Evaluation of the Initial Numerical Model
Evaluation of the reliability of the initial numerical model was performed considering the vertical compression stress and structural dynamic properties, whereby each level of deviation from the experimentally obtained results are discussed.
4.1.1. Evaluation of the Vertical Compression Stress
In the numerical model of the structure, the vertical compressive stress caused by self-weight was validated at the measurement points where the compressive stress determination test was carried out (Table 5).
Table 5.
Comparison of the vertical compressive stress numerically obtained with the experimentally obtained in form of their differences .
In the numerical model, the concentration of tensile or compressive stress occurs in the corners and at the joints of finite elements of different directions. The numerically obtained vertical stress level at the ground floor corresponds approximately to the experimental results, but the stress level on the 1st floor is slightly differ from the experimental result. The difference in results in both cases can be justified by the floor plan position of the load-bearing walls. The wall of the FJ-GR-1 measurement point is an internal load-bearing wall and, as such, transmits the load of the slab on both sides, while the wall of the FJ-GR-2 measurement point can be considered as an external load-bearing wall and, therefore, transfers the load of the slab from one side only.
4.1.2. Evaluation Based on the Structural Dynamic Properties
To determine how the developed numerical model describes actual structural behaviour, a comparison of natural frequencies was carried out (Table 6). According to the results of the comparison of the natural frequency values (Table 6), the numerically predicted structural behavior deviates significantly from the actual one. Thus, in the following section the initially developed numerical model is updated in order to better correspond to the actual structural behaviour.
Table 6.
Comparison of the experimentally and numerically obtained natural frequency values in form of deviation .
5. Finite Element Model Updating
A more detailed control of the reliability of the model and given assumptions was carried out in the following Section 5.1, Section 5.2, Section 5.3, Section 5.4 and Section 5.5 through the control of the influence of various characteristics on the observed results of the experimental test. Thus, the effects of boundary conditions, partition walls, the way of modelling damage to load-bearing system elements, and the influence of the global modulus of elasticity of load-bearing walls as elements that contribute the largest percentage to the modal deformation energy of the system, i.e., to the observed dynamic parameters—frequencies and forms of vibration—were taken into account.
5.1. Analysis of the Influence of the Boundary Conditions—Model 1
To determine the influence of the boundary conditions on the change in the value of the natural frequencies of the structure, a model with fixed and clamped boundary conditions was developed. In the numerical model, the values of the entered masses of partition walls, roofs, and staircases were retained. A graphical comparison of the experimentally obtained natural frequency values with the frequencies obtained for both clamped and hinge boundary conditions is given in the Figure 10.
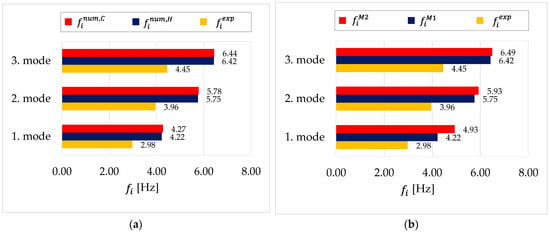
Figure 10.
Graphical comparison of the experimentally obtained natural frequency values with the frequencies obtained for hinge and clamped boundary conditions for (a) Model 1 and (b) Model 2.
Based on the analysis of the influence of the boundary conditions on the first natural frequency values, it can be seen and concluded from the graphical representation (Figure 10a) that there are no differences between the natural frequency values for the hinge and clamped boundary conditions, i.e., boundary conditions do not affect the natural frequency values. A clamped boundary condition, also known as fixed or fully restrained boundary condition, means that a structure is completely fixed or immobilized at a particular boundary. A hinge boundary condition, also referred to as a pinned or simply supported boundary condition, allows rotation at a specific boundary while preventing translation. Based on this observation and conclusion, for the further analysis and updating steps, the numerical model with hinge boundary conditions is considered. For the sake of simplicity, the selected model is referred to as M1 in the following text.
5.2. Analysis of the Influence of the Partition Walls Modelling Method—Model 2
To reduce the difference in the frequencies of the initial numerical model and the real structure, the influence of the partition wall modelling was analyzed. Instead of the partition walls in the initial numerical model, in which they were included with the appropriate mass, standard types of finite elements walls were modelled. The material of the walls was considered hollow brick, and the unit mass was taken from the literature [21]. According to the standard [23], the characteristic bending stiffness of the walls was introduced. The values of natural frequencies were compared for the initial model in which the partition walls were considered as masses and the numerical model, Model 2, in which the partition walls were modelled as shell elements . Based on the analysis of the influence of the partition walls modelling it can be seen and concluded that the frequency values in the numerical model with the partition walls included as shell elements increase as the modelled partition walls elements increase the stiffness of the whole structure (Figure 10b). Regardless, in the further numerical analysis, a model was considered in which the partition walls were considered as the mass (initial model), since it is observed during the visual inspection that the partition walls are largely damaged and do not contribute to the current state (stiffness) of the structure.
5.3. Analysis of the Influence of Damaged Load Bearing Walls with Reduced Elasticity Modulus—Model 3
To be able to numerically predict the real structural behavior, the damaged structural elements in this step of analysis are modelled with reduced elasticity modulus. These elements were selected based on a visual inspection and their positions are marked in Figure 11.
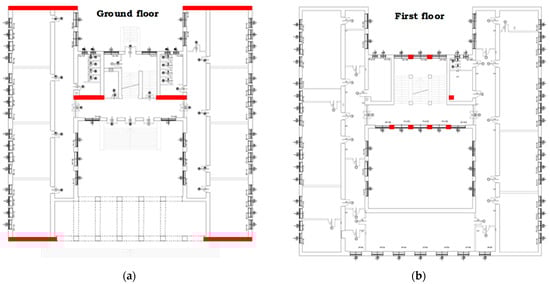
Figure 11.
The elements of the model with a reduced modulus of elasticity (red bars) at the (a) ground and (b) first floor.
In the numerical model, the damaged elements were modelled by finite elements with associated material with changed characteristics, i.e., reduced modulus of elasticity. Within a few steps, the reduction in the modulus of elasticity was performed.
Based on the analysis (Figure 12) of the elasticity modulus reduction for the damage construction elements , a decrease in the first natural frequency can be noticed. However, by imitating the damaged parts of the structure with finite elements with a reduced modulus of elasticity, satisfactory results were not achieved. Regardless of the fact that the previous iteration and analysis did not provide satisfactory results (matching values of numerically predicted and experimentally measured natural frequencies), in the next iteration, the simulation of damages in the specified load-bearing walls is retained.
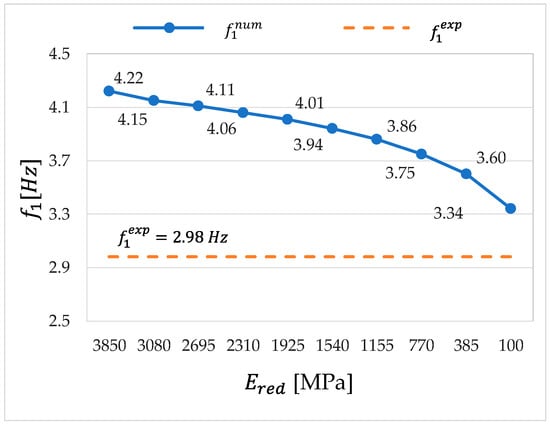
Figure 12.
Changes of the first natural frequency of the numerical Model 3 for different levels of modulus of elasticity reduction with the comparison of the experimentally obtained natural frequency .
5.4. Analysis of Influence of Introducing the Diagonal Cracks in Damaged Load Bearing Walls—Model 4
Since the behavior of the structure obtained by experimental testing was not achieved with the previously analyzed updated numerical models, the numerical analysis was carried out on the new model (Model 4). The new model is developed in such a way that the finite elements of the initial numerical model, whose locations correspond to the location of the diagonal cracks determined by visual inspection (Figure 13), were associated with a modulus of elasticity close to 0 (in order to avoid errors in calculation).
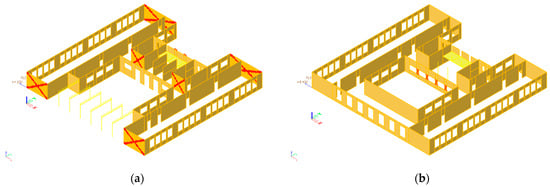
Figure 13.
The finite elements of the model with a reduced modulus of elasticity at the (a) ground and (b) first floor.
A numerical modal analysis was performed on such updated numerical model (Model 4), the results of which were compared with the results obtained by experimental testing of the structure (Table 7).
Table 7.
Comparison of the experimentally and numerically obtained natural frequency values in form of deviation for the numerical Model 4.
The introduction of the assumption of a decrease in the modulus of elasticity of the finite elements corresponding to the location of the cracks resulted in a decrease in the frequency values. However, the frequency obtained by numerical modal analysis is still significantly higher than the one obtained by experimental investigation. For this reason, in the next section, the effect of reducing the global modulus of elasticity of walls is analyzed. Since the results of the analysis of the numerical model with introduced diagonal damage (Model 4) and that with a reduced modulus of elasticity of load-bearing walls where damage was observed (Model 3) are similar, according to the recommendations from the literature [24], a model with introduced diagonal damage (Model 5) was adopted to check the effect of the reduction in the global modulus of elasticity .
5.5. Analysis of the Influence of Global Elasticity Modulus’ Reduction—Model 5
In this section, an analysis of the reduction in the global modulus of elasticity of the walls was carried out, since the value obtained by experimental testing using the flat jack test is much higher than the expected value for this type of structure obtained by conducting experimental tests on similar types of structures which were from 1200 to 2000 MPa. Model 4 was taken as the initial model in this analysis, while the change of the global modulus of elasticity of the walls was carried out with a step of 500 MPa (Figure 14). The obtained results of the change in the value of the natural frequency depending on the change in the global modulus of elasticity for the first mode shape are shown in Figure 14. In this model, activation of 90% of the mass was achieved in the first 35 modal forms.
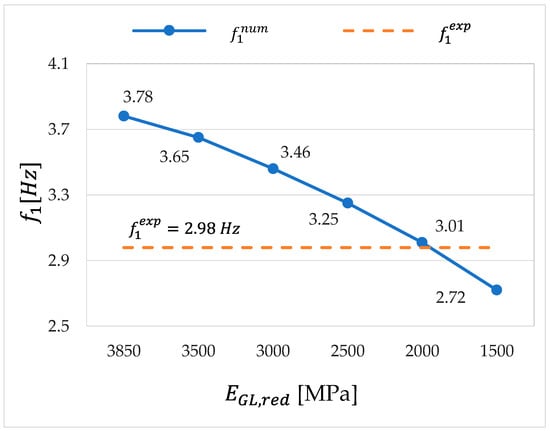
Figure 14.
Changes of the first natural frequency of the numerical Model 5 for different levels of global modulus of elasticity reduction with the comparison of the experimentally obtained natural frequency .
The changes in the natural frequency values obtained by numerical modal analysis with respect to the experimental values are visible. The modulus of elasticity around the 2000 MPa gives a very small difference compared to the experimentally obtained results. The next table (Table 8) shows a comparison of the experimentally determined values of the natural frequencies with the frequencies obtained by the numerical modal analysis of Model 5, to which the global modulus of elasticity in the amount of 2000 MPa is assigned.
Table 8.
Comparison of the experimentally and numerically obtained natural frequency values in form of deviation for the numerical Model 5.
From the results of the comparison (Table 8), a small difference in natural frequency can be observed, the value of which is acceptable for further analysis. In addition, the value of the global modulus of elasticity of the walls in the amount of 2000 MPa represents the expected value for this type of structure.
6. Assessment of the Structural Condition before the Earthquake
In the mechanical properties determined by the shear test and the flat jack, differences can be observed in the results for the same wall specimen. This may be supported by the fact that there is no information about the construction phase and the way the masonry walls were built. At the same time there is a possibility that the walls were locally strengthened in an earlier period. The assumption can also be supported by the difference in the level of vertical stress on the same floor determined by the flat jack method, and, in addition, the position of the wall (external/internal load-bearing wall) in this case also has a great influence. On the other hand, the modulus of elasticity of walls determined by the flat jack method also has a value that is not specific for this type of construction. Considering the overall picture of the determination of the mechanical properties of masonry walls, it is necessary to be extremely careful in the interpretation of the results, and the obtained values should be additionally controlled by numerical analysis (Figure 15).
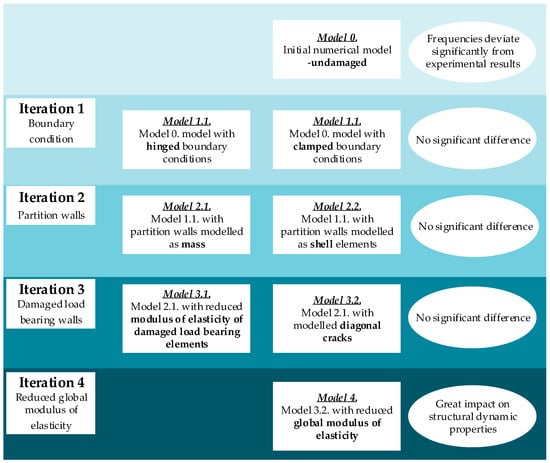
Figure 15.
Flowchart of numerical model iteration.
Structural dynamic properties can be used as the best control for this purpose and for the assessment of the structural condition. The initial numerical model of the case study was based on the drawings and the mechanical properties of the materials obtained during the experimental investigation, while the results of the numerical model analysis were not satisfactory. The observed problem required the analysis of different effects: boundary conditions, the way damaged elements were considered in the numerical model, and the control of the mechanical property’s values obtained through experimental investigation. No significant differences in the frequencies of the structure were obtained by changing the boundary conditions of the numerical model. On the other hand, the modelling of partition walls as shell elements only affected the increase in frequency since this approach contributed to an increase in the global stiffness of the system. In addition, the reduction in the modulus of elasticity of load-bearing walls, where significant damage was found during the visual inspection, did not significantly affect the change in the natural frequency of the system. In the end, the found state of the structure was best described by introducing diagonal damage into the numerical model and reducing the global modulus of elasticity of the masonry walls, since the value obtained by the flat jack test was not expected. Satisfactory results were obtained with the mentioned approach and, based on the obtained model, an assessment of the condition of the structure before the damage caused by the earthquake was carried out. It was conducted based on a comparison (Figure 15) between the model of the undamaged state before the earthquake and the final damaged model (Model 5). Hinged boundary conditions, global modulus of elasticity of load bearing walls (without the simulated diagonal cracks) equal to 2000 MPa, and partition walls modelled as the shell elements are considered in the undamaged numerical model.
The comparison shows approximately equal results of the undamaged numerical model compared to the experimental results for the first three experimentally determined mode shapes, Figure 16. The difference in the natural frequency of the damaged and undamaged state is 9% for the first, 6% for the second, and 2% for the third mode shape. The ratio between the frequency of the numerical model before the earthquake and the frequency of the final numerical model shows the greatest difference in frequency results for the first mode, so it can be assumed that the greatest damage occurred in the first mode shape.
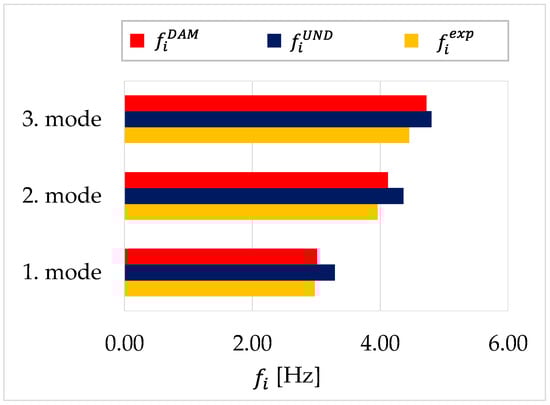
Figure 16.
Comparison of experimentally obtained and natural frequencies of numerical models for damage and undamaged state .
The changes in the natural frequency of a masonry building after an earthquake are contingent upon various factors, including the seismic intensity, structural properties, and extent of damage incurred. Since in this case there was no change in the modal shapes, it was aimed only at changing the values of the natural frequencies.
7. Conclusions
In this paper, an assessment of the condition of a masonry structure damaged by an earthquake before the earthquake is presented. An experimental determination of the mechanical properties of the masonry walls was carried out on the observed building through a shear test and a flat jack test. In addition, the structural dynamic properties, natural frequencies and mode shapes were determined to obtain information about the global structural behaviour. The determined mechanical properties of the material were used to develop an initial numerical model, while the dynamic parameters were used for finite element model updating to describe the real structural behavior. As the changes in mode shapes were not observed during the earthquake, the paper is focused only on the changes of natural frequencies. Based on the updated numerical model, an assessment of the structural condition was performed. It was found that the stiffness of the structure decreased by 9% during the earthquake, which can be seen from the change in the value of the first natural frequency. The main goal of this paper is to provide approximate values of the natural frequency change during an earthquake for the observed type of building, not only through the implementation of dynamic testing, but dynamic parameters can also be monitored through a monitoring system where depending on the change in the value of the natural frequency, alarms can be set for intervention in case of their change. Each construction requires an individual approach, one of which is presented in this paper. The novelty of this article is the structural condition assessment before the earthquake based on the structural dynamic properties determined after the earthquake, as well as the assessment of the decrease in the natural frequency value caused by the earthquake. Considering the extensive experimental and numerical analyses carried out in the present paper, it is necessary to emphasize the importance of combining experimental tests and numerical analyses, so that the results obtained by experimental tests can be controlled and correlated with the real values. For the following research, it is recommended to perform a nonlinear numerical analysis of the observed structure. It would be interesting to perform similar assessments on a larger sample of masonry structures damaged by earthquakes. This would help validate the results and allow for a fuller understanding of the behavior of such structures. In addition, it would be interesting to further develop the practical implementation of the findings and to propose guidelines or recommendations for engineers and practitioners involved in assessing the condition of masonry structures after earthquakes. This could include proposals for monitoring systems, intervention thresholds based on natural frequency changes, and strategies for structural rehabilitation or retrofitting.
Author Contributions
Conceptualization, I.D. and M.F.S.; methodology, I.D. and S.E.; software, I.D. and S.E.; validation, I.D. and D.D.; formal analysis, S.E.; investigation, I.D., S.E. and D.D.; resources, I.D.; data curation, S.E. and M.F.S.; writing—original draft preparation, M.F.S.; writing—review and editing, S.E., M.F.S. and D.D.; visualization, M.F.S. and S.E.; supervision, I.D. and D.D.; project administration, I.D.; funding acquisition, I.D. All authors have read and agreed to the published version of the manuscript.
Funding
This research received no external funding.
Institutional Review Board Statement
Not applicable.
Informed Consent Statement
Not applicable.
Data Availability Statement
Not applicable.
Conflicts of Interest
The authors declare no conflict of interest.
References
- Lulić, L.; Ožić, K.; Kišiček, T.; Hafner, I.; Stepinac, M. Post-earthquake damage assessment-case study of the educational building after the zagreb earthquake. Sustainability 2021, 13, 6353. [Google Scholar] [CrossRef]
- Simoen, E.; De Roeck, G.; Lombaert, G. Dealing with uncertainty in model updating for damage assessment: A review. Mech. Syst. Signal Process. 2015, 56, 123–149. [Google Scholar] [CrossRef]
- Catbas, F.N.; Brown, D.L.; Aktan, A.E. Use of Modal Flexibility for Damage Detection and Condition Assessment: Case Studies and Demonstrations on Large Structures. J. Struct. Eng. 2006, 132, 1699–1712. [Google Scholar] [CrossRef]
- Law, S.S.; Yong, D. Substructure methods for structural condition assessment. J. Sound Vib. 2011, 330, 3606–3619. [Google Scholar] [CrossRef]
- Lyu, M.; Zhu, X.; Yang, Q. Condition assessment of heritage timber buildings in operational environments. J. Civ. Struct. Health Monit. 2017, 7, 505–516. [Google Scholar] [CrossRef]
- Valente, M. Seismic behavior and damage assessment of two historical fortified masonry palaces with corner towers. Eng. Fail. Anal. 2022, 134, 106003. [Google Scholar] [CrossRef]
- Valente, M. Earthquake response and damage patterns assessment of two historical masonry churches with bell tower. Eng. Fail. Anal. 2023, 151, 107418. [Google Scholar] [CrossRef]
- Krolo, J.; Damjanović, D.; Duvnjak, I.; Smrkić-Frančić, M.; Bartolac, M.; Košćak, J. Methods for determining mechanical properties of walls. J. Croat. Assoc. Civ. Eng. 2021, 73, 127–140. [Google Scholar] [CrossRef]
- Ramos, L.F.; Marques, L.; Lourenço, P.B.; De Roeck, G.; Campos-Costa, A.; Roque, J. Monitoring historical masonry structures with operational modal analysis: Two case studies. Mech. Syst. Signal Process. 2010, 24, 1291–1305. [Google Scholar] [CrossRef]
- Ereiz, S.; Duvnjak, I.; Damjanović, D.; Bartolac, M. Analysis of seismic action on the tie rod system in historic buildings using finite element model updating. Buildings 2021, 11, 453. [Google Scholar] [CrossRef]
- Ereiz, S.; Duvnjak, I.; Fernando Jiménez-Alonso, J. Review of finite element model updating methods for structural applications. Structures 2022, 41, 684–723. [Google Scholar] [CrossRef]
- Marwala, T. Finite-Element-Model Updating Using Computional Intelligence Techniques: Applications to Structural Dynamics, 1st ed.; Springer: London, UK, 2010; ISBN 9781849963220. [Google Scholar]
- Chen, H.-P. Structural Health Monitoring of Large Civil Engineering Structures, 1st ed.; John Wiley and Sons Inc.: Oxford, UK, 2018; ISBN 9781119166627. [Google Scholar]
- Jarosińska, M.; Berczyński, S. Changes in Frequency and Mode Shapes Due to Damage in Steel–Concrete Composite Beam. Materials 2021, 14, 6232. [Google Scholar] [CrossRef] [PubMed]
- Borri, A.; Castori, G.; Corradi, M. Determination of Shear Strength of Masonry Panels Through Different Tests. Int. J. Archit. Herit. 2015, 9, 913–927. [Google Scholar] [CrossRef]
- Celano, T.; Argiento, L.U.; Ceroni, F.; Casapulla, C. Literature Review of the In-Plane Behavior of Masonry Walls: Theoretical vs. Experimental Results. Materials 2021, 14, 3063. [Google Scholar] [CrossRef] [PubMed]
- Lulić, L.; Stepinac, M.; Bartolac, M.; Lourenço, P.B. Review of the flat-jack method and lessons from extensive post-earthquake research campaign in Croatia. Constr. Build. Mater. 2023, 384, 131407. [Google Scholar] [CrossRef]
- Altunişik, A.C.; Adanur, S.; Genç, A.F.; Günaydin, M.; Okur, F.Y. Non-destructive testing of an ancient Masonry Bastion. J. Cult. Herit. 2016, 22, 1049–1054. [Google Scholar] [CrossRef]
- Cavalagli, N.; Comanducci, G.; Gentile, C.; Guidobaldi, M.; Saisi, A.; Ubertini, F. Detecting earthquake-induced damage in historic masonry towers using continuously monitored dynamic response-only data. Procedia Eng. 2017, 199, 3416–3421. [Google Scholar] [CrossRef]
- Gaile, L.; Ratnika, L.; Pakrastins, L. RC Medium-Rise Building Damage Sensitivity with SSI Effect. Materials 2022, 15, 1653. [Google Scholar] [CrossRef]
- Ji, X.; Fenves, G.L.; Kajiwara, K.; Nakashima, M. Seismic Damage Detection of a Full-Scale Shaking Table Test Structure. J. Struct. Eng. 2011, 137, 14–21. [Google Scholar] [CrossRef]
- Sivori, D.; Cattari, S.; Lepidi, M. A methodological framework to relate the earthquake-induced frequency reduction to structural damage in masonry buildings. Bull. Earthq. Eng. 2022, 20, 4603–4638. [Google Scholar] [CrossRef]
- Mendes, N.; Lourenço, P.B.; Campos-Costa, A. Shaking table testing of an existing masonry building: Assessment and improvement of the seismic performance. Earthq. Eng. Struct. Dyn. 2014, 43, 247–266. [Google Scholar] [CrossRef]
- Kaya, A.; Adanur, S.; Bello, R.A.; Genç, A.F.; Okur, F.Y.; Sunca, F.; Günaydin, M.; Altunişik, A.C.; Sevim, B. Post-earthquake damage assessments of unreinforced masonry (URM) buildings by shake table test and numerical visualization. Eng. Fail. Anal. 2023, 143, 106858. [Google Scholar] [CrossRef]
- Ohba, S.; Fukuda, T. Chnages in natural frequency of apartment buildings before and after the Hyogoken-Nanbu earthquake. In Proceedings of the 12th World Conference of Earthquake Engineering, Auckland, New Zealand, 30 January–4 February 2000; pp. 1679–1687. [Google Scholar]
- Williams, E.F.; Heaton, T.H.; Zhan, Z.; Lambert, V.R. Variability in the Natural Frequencies of a Nine-Story Concrete Building from Seconds to Decades. Seism. Rec. 2022, 2, 237–247. [Google Scholar] [CrossRef]
- Pepi, C.; Cavalagli, N.; Gusella, V.; Gioffrè, M. Damage detection via modal analysis of masonry structures using shaking table tests. Earthq. Eng. Struct. Dyn. 2021, 50, 2077–2097. [Google Scholar] [CrossRef]
- Ramos, L.F.; Laurenco, P.B.; De Roeck, G.; Campos-Costa, A. Structural Analysis of Historic Construction: Preserving Safety and Significance; Two Volume Set; D’Ayala, D., Fodde, E., Eds.; CRC Press: Boca Raton, FL, USA, 2008; ISBN 9780429151965. [Google Scholar]
- Cunha, Á.; Caetano, E. Experimental Modal Analysis of Civil Engineering Structures. Sound Vib. 2006, 6, 12–20. [Google Scholar]
- Genç, A.F.; Ertürk, E.; Altunişik, A.C.; Günaydin, M.; Okur, F.Y. Effect of Damping Ratios on the Seismic Behavior of a Historical Masonry Guesthouse Building. Recep Tayyip Erdogan Univ. J. Sci. Eng. 2021, 2, 60–71. [Google Scholar] [CrossRef]
- Cruz, C.; Miranda, E. Damping Ratios of the First Mode for the Seismic Analysis of Buildings. J. Struct. Eng. 2021, 147, 04020300. [Google Scholar] [CrossRef]
- Işık, E.; Avcil, F.; Büyüksaraç, A.; İzol, R.; Hakan Arslan, M.; Aksoylu, C.; Harirchian, E.; Eyisüren, O.; Arkan, E.; Şakir Güngür, M.; et al. Structural damages in masonry buildings in Adıyaman during the Kahramanmaraş (Turkiye) earthquakes (Mw 7.7 and Mw 7.6) on 6 February 2023. Eng. Fail. Anal. 2023, 151, 107405. [Google Scholar] [CrossRef]
- Furukawa, A.; Kiyono, J.; Parajuli, R.R.; Parajuli, H.R.; Toki, K. Evaluation of Damage to a Historic Masonry Building in Nepal through Comparison of Dynamic Characteristics before and after the 2015 Gorkha Earthquake. Front. Built Environ. 2017, 3, 62. [Google Scholar] [CrossRef]
- Murty, C.V.R.; Goswami, R.; Vijayanarayanan, A.R.; Mehta, V. Some Concepts in Earthquake Behaviour of Buildings; Gujarat State Disaster Management Authority: Gujarat, India, 2012. [Google Scholar]
- Keshmiry, A.; Hassani, S.; Mousavi, M.; Dackermann, U. Effects of Environmental and Operational Conditions on Structural Health Monitoring and Non-Destructive Testing: A Systematic Review. Buildings 2023, 13, 918. [Google Scholar] [CrossRef]
- Kassem, M.M.; Beddu, S.; Ooi, J.H.; Tan, C.G.; Mohamad El-Maissi, A.; Mohamed Nazri, F. Assessment of Seismic Building Vulnerability Using Rapid Visual Screening Method through Web-Based Application for Malaysia. Buildings 2021, 11, 485. [Google Scholar] [CrossRef]
- Wang, G.; Li, Y.; Zheng, N.; Ingham, J.M. Testing and modelling the in-plane seismic response of clay brick masonry walls with boundary columns made of precast concrete interlocking blocks. Eng. Struct. 2017, 131, 513–529. [Google Scholar] [CrossRef]
Disclaimer/Publisher’s Note: The statements, opinions and data contained in all publications are solely those of the individual author(s) and contributor(s) and not of MDPI and/or the editor(s). MDPI and/or the editor(s) disclaim responsibility for any injury to people or property resulting from any ideas, methods, instructions or products referred to in the content. |
© 2023 by the authors. Licensee MDPI, Basel, Switzerland. This article is an open access article distributed under the terms and conditions of the Creative Commons Attribution (CC BY) license (https://creativecommons.org/licenses/by/4.0/).