Article

Evaluation of Mechanical Performance of a New Disc Spring-Cable Counter Pressure Shock Absorber

1
Power Grid Planning Research Center of Guangdong Power Grid Co., Ltd., Guangzhou 510080, China
2
School of Civil Engineering, Guangzhou University, Guangzhou 510006, China
*
Author to whom correspondence should be addressed.
Appl. Sci. 2023, 13(15), 8718; https://doi.org/10.3390/app13158718
Submission received: 4 May 2023 / Revised: 7 June 2023 / Accepted: 7 June 2023 / Published: 28 July 2023

Abstract

:
Mechanical performance evaluation of a new disc spring-cable counter pressure shock absorber is focused on in this study. The proposed shock absorber is always in a compressive working state with energy dissipation capacity under both tension and compression loadings. The design formulas of its axial bearing capacity, vertical stiffness, deformation energy of the shock absorber were derived, and the corresponding specific design process was provided in detail. Experimental and numerical investigations of the mechanical performance were conducted under static and dynamic loadings. The parameters influencing the laws of the mechanical performance of the shock absorber, including loading frequency, pre-compression deformation and loading amplitude, were investigated. The rationality of the proposed shock absorber was firstly verified through comparative analysis using experimental, numerical and theoretical calculations. The shock absorber with a friction coefficient of 0.005 between disc springs, and a friction coefficient of 0.3 between the disc spring and cover plate has the smallest error between experiment and theory for the flattening force. The bearing capacity of the shock absorber exhibits a linear relationship with the loading displacement in static loading. In dynamic loading, however, the bearing capacity shows a trend of slow growth followed by rapid growth. The energy dissipation capacity of the shock absorber shows an increase with the increase of loading displacement. The minimum equivalent damping ratio of all of the dynamic test cases is 7%, with a maximum up to 15.3%. Under the same loading frequency, the equivalent stiffness and equivalent damping ratio have a linear amplification trend with the increase of pre-compression deformation, and the maximum increase of equivalent stiffness is equal to 41.37%. Under the same loading frequency and pre-compression deformation, the energy consumption capacity can be improved by increasing the loading amplitude.

1. Introduction

When earthquakes break out, the seismic effects on buildings and related structures are not only horizontal, but also vertical. However, during the earthquake process that people have been experiencing, the horizontal action is far greater than the vertical action, thus ignoring the harm of vertical action. However, a large number of facts have proven that vertical earthquakes in high-intensity areas (especially epicenter areas) can also bring huge economic losses, threaten people’s safety, and bring harm to society that cannot be underestimated [1,2]. Among the 30 seismic records obtained during the 1979 Imperial Valley earthquake in the United States, the average ratio between vertical and horizontal peak acceleration was 0.77. What is more, the average ratio of 11 records near the fault was 1.12, with the maximum ratio reaching 2.4 [3]. The record of maximum vertical and horizontal ratio exceeding 1.6 was found during the Northridge earthquake in the United States and the Hanshin earthquake in Japan [4]. In 1957, Qian proposed at the first national seismic conference in China that the vertical seismic motion was the main cause of damage to certain brick chimneys [5]. Yin et al. [6] conducted response spectrum analysis on the acceleration of the horizontal and bidirectional components of earthquakes, and found that the vertical effect of near-field earthquakes is significantly higher than that of far-field earthquakes. In addition, such phenomena as objects being thrown from the ground in the near-field earthquake area also occurred from time to time, such as the Wenchuan and Ya’an earthquakes in China [7], and the Türkiye earthquake this year. It can be seen that vertical seismic ground motion and structural vertical seismic response have attracted widespread attention from scholars at home and abroad.
Hason et al. [8] developed novel models to forecast PGA in case of the Iraqi database, which utilizes the particle swarm optimization (PSO) approach. A consistent prediction of PGA can be obtained by the proposed PSO models with a high degree of accuracy. Through comparative analysis of a large number of earthquake records, Xin [9] found that vertical seismic action can have a significant impact on buildings, and explained the importance of vertical seismic action in seismic analysis of structures that cannot be ignored. Li & Xue [10] conducted research on the isolation mechanism and vertical isolation devices, in which the relationship between the vertical stiffness and characteristic frequency of input excitations is established, and the formula for stiffness in the vertical direction is developed. Han & Zhou [11,12] analyzed 94 sets of earthquake records in Sichuan, Gansu, Shaanxi, and other regions during the Wenchuan earthquake, focusing on studying the vertical and horizontal peak accelerations, acceleration response spectra, and predominant periods. This research found that the average ratio of vertical and horizontal peak accelerations is 0.58, and about 30% greater than 0.67. Ahmedelgamal et al. [13] conducted near-field and far-field response spectrum analysis on 111 free field strong earthquake records in California, and found that the top of the structure has a significant amplification effect when considering vertical ground motions. Wu & Tan [14] synthesized the near-field vertical ground motion of the Fukuoka earthquake in Japan, and compared the synthesized results with the observed records, which found that the difference in peak acceleration between the two is not significant. Dang et al. [15] studied the seismic response of multi-layer isolation structures, showing that vertical earthquakes amplified the vertical seismic response. The top peak accelerations of the non-isolation and isolation structures were 0.095 m/s2 and 0.107 m/s2, respectively, with an increase of 12%. He & Ding [16] took the Shanghai Center Tower as the research object, and studied the axle–weight ratio of the giant column and the core tube, the internal force response and acceleration response of the outrigger truss and the ring truss under the vertical seismic action. The results showed that the vertical seismic response of the structure gradually increases with the increase of the structure height. Li [17] studied the impact of vertical seismic force on the seismic performance of different structural forms of bridge piers based on Midas Civil platform. It was found that the main impact of vertical seismic force on bridge piers is to weaken their strength, while the impact on pier top displacement is relatively small. Castiglioni & Kanyılmaz [18] studied the seismic protection effect of the vertical isolation devices on ancient statues in a base isolated museum building, which showed that the ancient statue can be protected efficiently against three dimensional earthquake excitations using suitable isolation devices. Zhou & Sun [19] conducted structural response spectrum analysis on building structure of the Fukushima Nuclear Power Plant in Japan, indicating that the peak acceleration recorded near the foundation is greater than the design basis seismic motion, and isolation structures may amplify the vertical seismic effect.
In recent years, disc springs have been increasingly favored due to their central self-resetting ability and convenient application in vibration control of different types of engineering structures [20,21,22]. Almen & Laszlo [23] derived calculation formulas of uniform-section disc springs to aid the designer in arriving at suitable characteristics by choice of spring geometry. Since then, many scholars have conducted further in-depth researches. Zheng [24] proposed a correction calculation formula for the disc spring considering the friction between the discs based on the Almen–Laszlo research. Zhang [25] used experimental data and LS-DYNA simulation data to test the hypothesis proposed by Almen and Laszlo during the formula derivation—“the disc part of the diaphragm spring only has rigid rotation without bending deformation after being subjected to external loads”, and obtained a conclusion that contradicts this hypothesis with reality. Ozaki et al. [26] proposed a more simplified calculation method for the force and deformation of the disc spring based on the principles of energy equivalence and friction, and verified the correctness and rationality of this method through finite element simulation and experimental comparison. Sun [27] tested the combination disc spring under continuous loading and loading-unloading test methods, and compared the load-displacement curve of the disc spring with the simulation results of the traditional Almen–Laszlo formula, verifying the rationality of the traditional calculation method. Fawazi1 & Lee [28] also proposed an improved method for calculating the load-displacement of the disc spring by considering the radial rotation side of the disc spring in the form of energy method, and verified it through finite element and experimental comparison. Xu et al. [29], and Mohamed et al. [30] studied the mechanical behavior and failure mechanism of pre-compressed composite disc springs. The results showed that the disc springs exhibited good center self-resetting performance and energy dissipation capacity. Dong et al. [31] proposed a novel self-centering buckling restrained brace (SC-BRB), which consists of a square outer steel tube, a group of disc springs, a steel core and so on. The results showed that the SC-BRB exhibits a flag-shaped hysteresis response with a small residual deformation and a moderate energy dissipation capability. Fan et al. [32] assessed the seismic performance of pre-pressed spring self-centering energy dissipation (PS-SCED) braces in comparison to conventional steel-braced frames (CSBFs) and buckling restrained-braced frames (BRBFs). Results showed that the PS-SCED braces reduced the residual deformations more effectively than the BRBFs and CSBFs. Carrella et al. [33], and Kovacic et al. [34] obtained the characteristic of the system’s dynamic stiffness approaching zero by combining a spring in an inclined device to form a quasi-zero-stiffness system. Guerreiro et al. [35] designed a new safety chair, provided with shock-absorber systems and auxiliary retaining devices, to keep the occupants properly seated and safe under life-threatening earthquake risk.
In this study, based on the characteristic of the disc spring, a new vertical disc spring-cable counter pressure shock absorber (DSCCP shock absorber) was proposed. The new DSCCP shock absorber is always in compression motion and causes energy dissipation, regardless of whether the shock absorber is in a compression or tension working state. The vertical bearing capacity, vertical stiffness, deformation energy, equivalent stiffness, and equivalent damping ratio of the new DSCCP shock absorber were firstly investigated, and the design process was developed. Secondly, combined with a finite element model, static and dynamic performance analyses were carried out to obtain the equivalent stiffness and equivalent damping ratio of the new shock absorber under different cases of loading frequencies, pre-compression deformations, and loading amplitudes. Finally, mechanical performance tests were further conducted to verify the rationality and effectiveness of the proposed new DSCCP shock absorber under static and dynamic loading conditions.

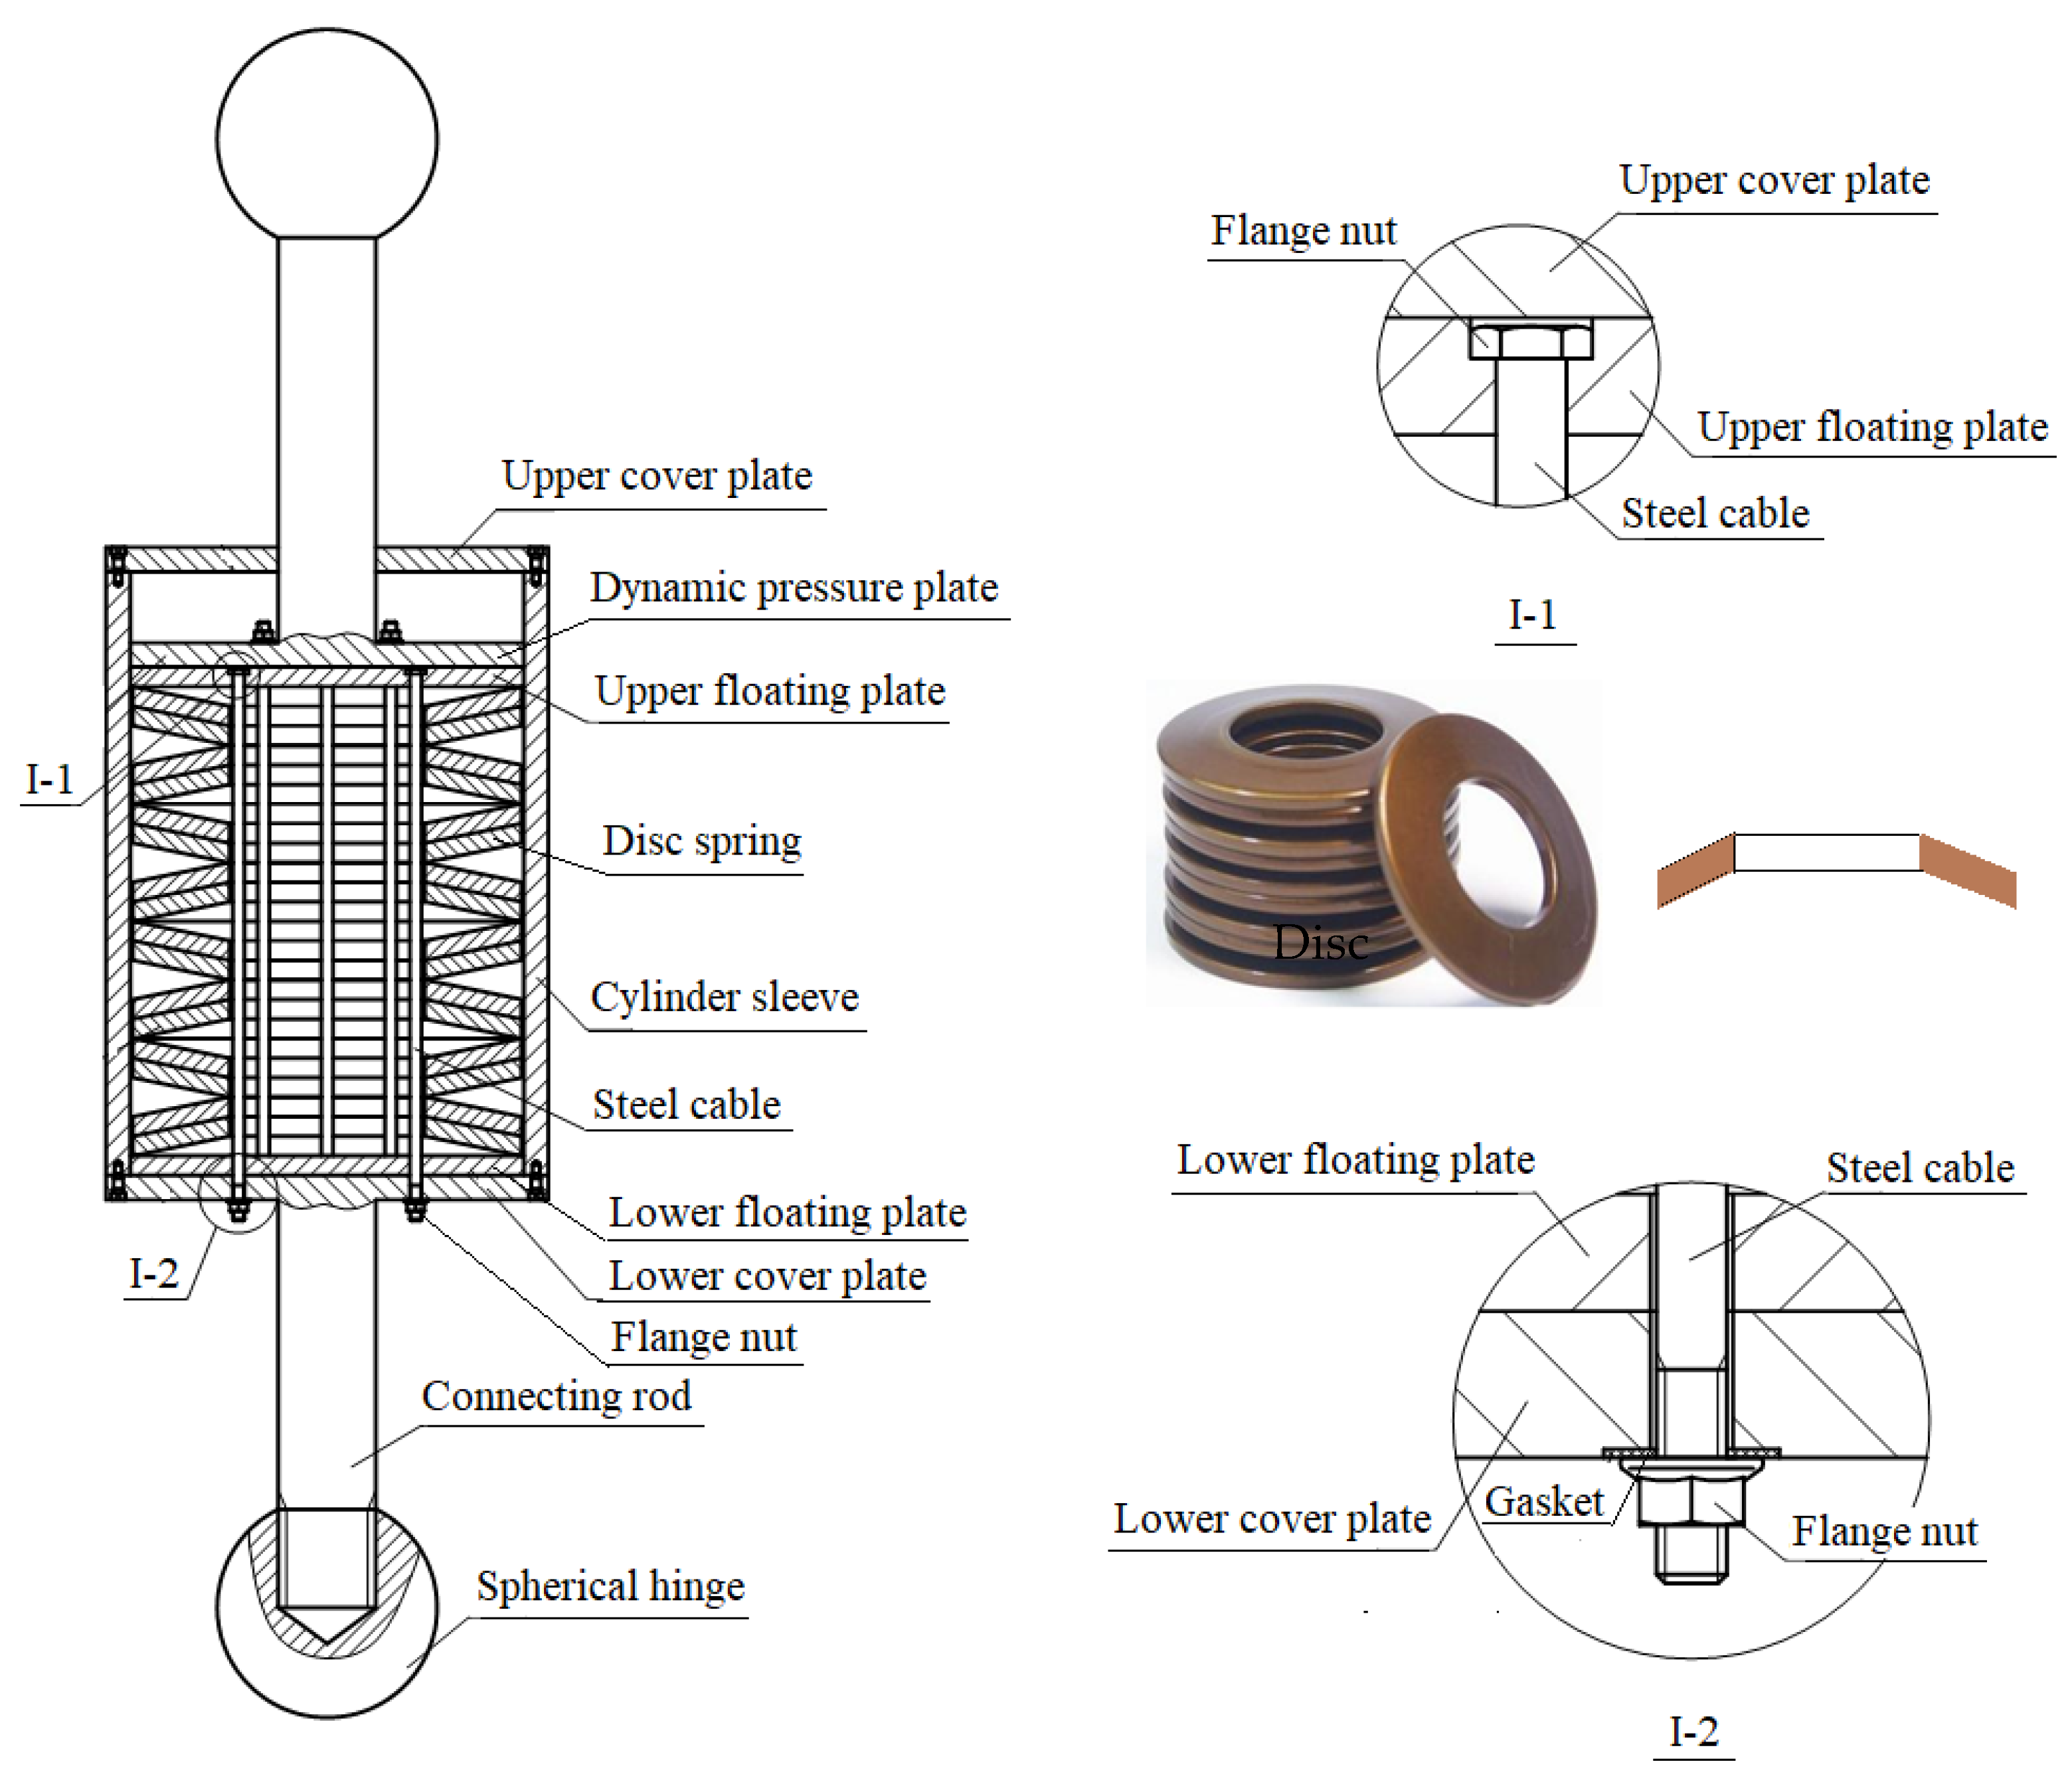
2. Design of the DSCCP Shock Absorber

2.1. Design Principle

The DSCCP shock absorber mainly consists of disc springs, steel cables, cover plate, sleeve and so on, which work together to resist vertical seismic action. The basic structural diagram is shown in Figure 1. The innovative ideas of the DSCCP shock absorber are as follows: (1) when the absorber is under pressure, sufficient vertical stiffness can be provided to withstand the weight of the upper structure and meanwhile deformation energy consumption can also be produced to dissipate seismic input energy, meaning it plays a buffering and energy-consuming role. (2) When a structure experiences an overturning effect and the shock absorber is in a tensile state, the steel cable fixed on the upper floating pressure plate starts to work, namely, pulling the lower floating pressure plate so it moves to the upper floating pressure plate. Obviously, when the shock absorber is in a pressure working state, it has sufficient vertical stiffness to bear the load of the upper structure. At this time, the disc spring group undergoes deformation and energy dissipation due to compression motion. When the shock absorber is in a tensile working state with upward motion, the lower floating plate moves to the upper floating plate by the action of the steel cable, because the steel cable is fixed on the dynamic pressure plate. Obviously, the disc spring group also undergoes compression deformation due to the action of the steel cable, which also generates energy dissipation. Therefore, regardless of whether the shock absorber is in a compression or tension working state, the internal disc spring group generates compression motion and consumes energy, which is the main innovation of the proposed DSCCP shock absorber.

2.2. Key Parameter Calculation and Design Process

2.2.1. Axial Bearing Capacity

When using a combination of disc springs, the influence of the frictional force between the disc springs must be considered. The magnitude of the frictional force depends on the method of combining the disc springs, the number of discs in each group, and the lubrication of the disc surfaces. Due to the damping effect caused by the frictional force, the use of multiple-disc spring combinations increases the number of discs compared to the theoretical calculation of a single-disc spring. As the number of disc springs in the combined group increases, the deformation of each disc in the group gradually decreases, so the number of discs in a composite disc spring group should not be too high. Frictional force mainly exists between the contact surfaces of the disc springs and between the contact surfaces of the external world. When an axial load is applied to the disc spring, the load increases. When considering the friction force, the vertical bearing capacity PR of shock absorber can be calculated according to the following equation [22]:
P R = P n 1 ± f M ( n 1 ) ± f R = P c × f h 0 [ ( h 0 t f t ) ( h 0 t f 2 t ) + 1 ] n 1 ± f M ( n 1 ) ± f R
in which, the negative sign is taken when applying the load, otherwise, the positive sign is taken. fM is the friction coefficient between the contact surfaces of the disc spring pieces; fR is the friction coefficient at the edge of the disc spring carrying the load, h0, t are the free height and thickness of disc spring; n is the number of disc spring; f is the deformation of the disc spring. In this study, the vertical bearing capacity of the DSCCP shock absorber is designed to be 498 kN and allows a maximum deformation of 33 mm. Under this condition, the special design parameters of the disc spring are as follows: D = 250 mm, d = 127 mm, t = 14 mm, h0 = 5.6 mm, H0 = 19.6 mm. Based on the GB1972-2005, when f = 0.75h0, P = 249 kN, σOMb = −1200 N/mm2, σIIc = 1220 N/mm2, the friction coefficients between the discs are fM = 0.02, fR = 0.03 [36]. Using 2 stacked and 8 paired disc spring sets, the relationship between the vertical bearing capacity PR and the deformation f (0 ≤ f ≤ 0.75h0) of the DSCCP shock absorber can be expressed as:
P R = P c × f h 0 [ ( h 0 t f t ) ( h 0 t f 2 t ) + 1 ] × n 1 ± f M ( n 1 ) ± f R = 57770 × f [ ( 2 5 f 14 ) ( 2 5 f 28 ) + 1 ] × 2 1 ± 0.02 ± 0.03
When loading:
P R + = 121621 × f [ ( 2 5 f 14 ) ( 2 5 f 28 ) + 1 ]
When unloading:
P R = 110038 × f [ ( 2 5 f 14 ) ( 2 5 f 28 ) + 1 ]
Figure 2 shows the load-deformation relationship curve during loading and unloading.

2.2.2. Vertical Stiffness

The theoretical calculation formulas for the stiffness K1 of a single disc spring, the stiffness K2 of a stacked disc spring group are as follows:
K 1 = d P d f = P c h 0 [ K 4 2 [ ( h 0 t ) 2 3 h 0 t f t + 3 2 ( f t ) 2 ] + 1 ]
K 2 = K 1 n 1 ± f M ( n 1 ) ± f R
K = K 2 i
In which, D, d are the outer and inner diameters of disc spring, i is the number of paired disc spring groups, K is the total stiffness of the DSCCP shock absorber. Thus, it can be obtained that the initial stiffness of the DSCCP shock absorber is 33.5 kN/mm, and the relationship between the stiffness K and the deformation f is as follows:
K R + = 15202 × ( 29 25 3 f 35 + 3 f 2 392 )   ( when   loading )
K R = 13755 × ( 29 25 3 f 35 + 3 f 2 392 )   ( when   unloading )

2.2.3. Deformation Energy

The deformation energy dissipation is an important indicator for evaluating energy absorbing and storing capacity, which can be expressed as:
U 1 = 0 f P d f = 2 E 1 μ 2 t 5 K 1 D 2 K 4 2 ( f t ) 2 [ K 4 2 ( h 0 t f 2 t ) 2 + 1 ]
Equation (10) can be simplified by:
U 1 = P c f 2 2 [ K 4 2 ( h 0 t f 2 t ) 2 + 1 ]
U = n i U 1
where, U1 is the deformation energy of a single disc spring, and U is the deformation energy of a stacked disc spring group. Based on Equations (10)–(12), the relationship between the deformation energy U and the deformation f of the DSCCP shock absorber proposed in this study can be derived:
U = 2588112 × f 2 [ ( 0.4 f 28 ) 2 + 1 ]

2.2.4. Design Process

Given the vertical bearing capacity P and the vertical deformation f, the design process of DSCCP shock absorber can be summarized as follows:
(1)
The outer and inner diameters D and d are selected and determined based on the space situation of the disc spring. Generally speaking, C = D/d = 1.7~2.5. The reason is that poor space utilization may be caused if D is too large; and difficult installation of the internal cable may be caused if d is too small.
(2)
Designing the ratio between the free height h0 and thickness t based on the self-deformation characteristics of the disc spring. The ratio is suggested to be h0/t < 0.5 if a linear relationship is required between bearing capacity and deformation, which is the common choice. The ratio is suggested to be 0.5 < h0/t < 2 if zero stiffness characteristic is required.
(3)
Choosing a stacking and pairing method to form the disc spring group, which is then used to determine the deformation and bearing capacity of each disc spring. The number i of paired disc spring group can be calculated according to the total vertical deformation.
(4)
Verifying the stress σOM of the disc spring at the OM point, as shown in Figure 3, which should be less than the ultimate stress of the material. Besides, the stresses at points II and III should also be checked to meet the design requirements.
(5)
Selecting the pre-compression deformation f2 and then calculating the initial stiffness. Usually, f2 = 0.15~0.2h0.
(6)
Calculating the bearing capacity of the steel cable based on the pre-compression deformation of disc spring, which is then used to select suitable steel cable.
Based on the above key parameters of design and calculation, the relevant parameters of the DSCCP shock absorber used in the numerical model can be obtained, as shown in Table 1.

3. Numerical Simulation and Modal Validation

3.1. Model Establishment

The DSCCP shock absorber consists of a group of 16 disc springs, which are stacked in pairs of two and coupled in eight sets, as shown in Figure 4. A disc spring is mainly made of spring steel materials such as 60Si2MnA or 50CrVA, with an elastic modulus of 206,000 N/mm2, a yield strength of 1375 MPa, an ultimate tensile strength of 1570 MPa, and a Poisson’s ratio of 0.3. The ideal elastic–plastic model is adopted for a disc spring.
The contact surface between discs is thought to be a free contact surface, which includes two parts: the normal force and the tangential force. The normal force on the contact surface works once the contact pressure is greater than 0. At the same time, the tangential force on the contact surface also begins to work, which is defined as the product of the friction coefficient and normal stress. The contact surfaces are initially maintained in a static friction equilibrium state. The tangential force increases linearly with the increase of normal pressure. After that, once the tangential force reaches the critical shear stress τbond, the contact surface begins to slide. The friction coefficient between disc springs is taken as μ1 = 0.005 based on the study of Cai [37]. The disc spring model established using the ABAQUS platform is shown in Figure 4. The C3D8R element is used, which is a three-dimensional solid reduced integration element with only one integration point at the center of the element. This element has eight nodes, with each node having translational degrees of freedom along the X/Y/Z directions and rotational degrees of freedom around the X/Y/Z axes. The element has the ability to handle hyper elasticity, stress stiffening, creep, swelling, large deformation, and large strain, which can effectively simulate the deformation characteristics of disc springs and the stress characteristics of the upper and lower floating pressure plates.
To ensure that the disc spring group does not experience lateral displacement during loading, horizontal constraints are applied at the bottom of the disc spring set, i.e., U1 = U3 = 0. The upper floating pressure plate is located inside the sleeve, and its horizontal displacement is also restricted to ensure the horizontal constraint of the disc spring set. The load is applied on the upper surface, which is coupled at a point. The grid division of the disc spring is: 50 grids for the inner ring, 100 grids for the outer ring, 16 grids for the radial direction, and three grids for the thickness direction. Two types of static loadings are adopted, namely linear static loading and semi-periodic sin-function loading, as shown in Figure 5. During static loading, the loading velocity is very slow to eliminate the dynamic effect of the DSCCP shock absorber.

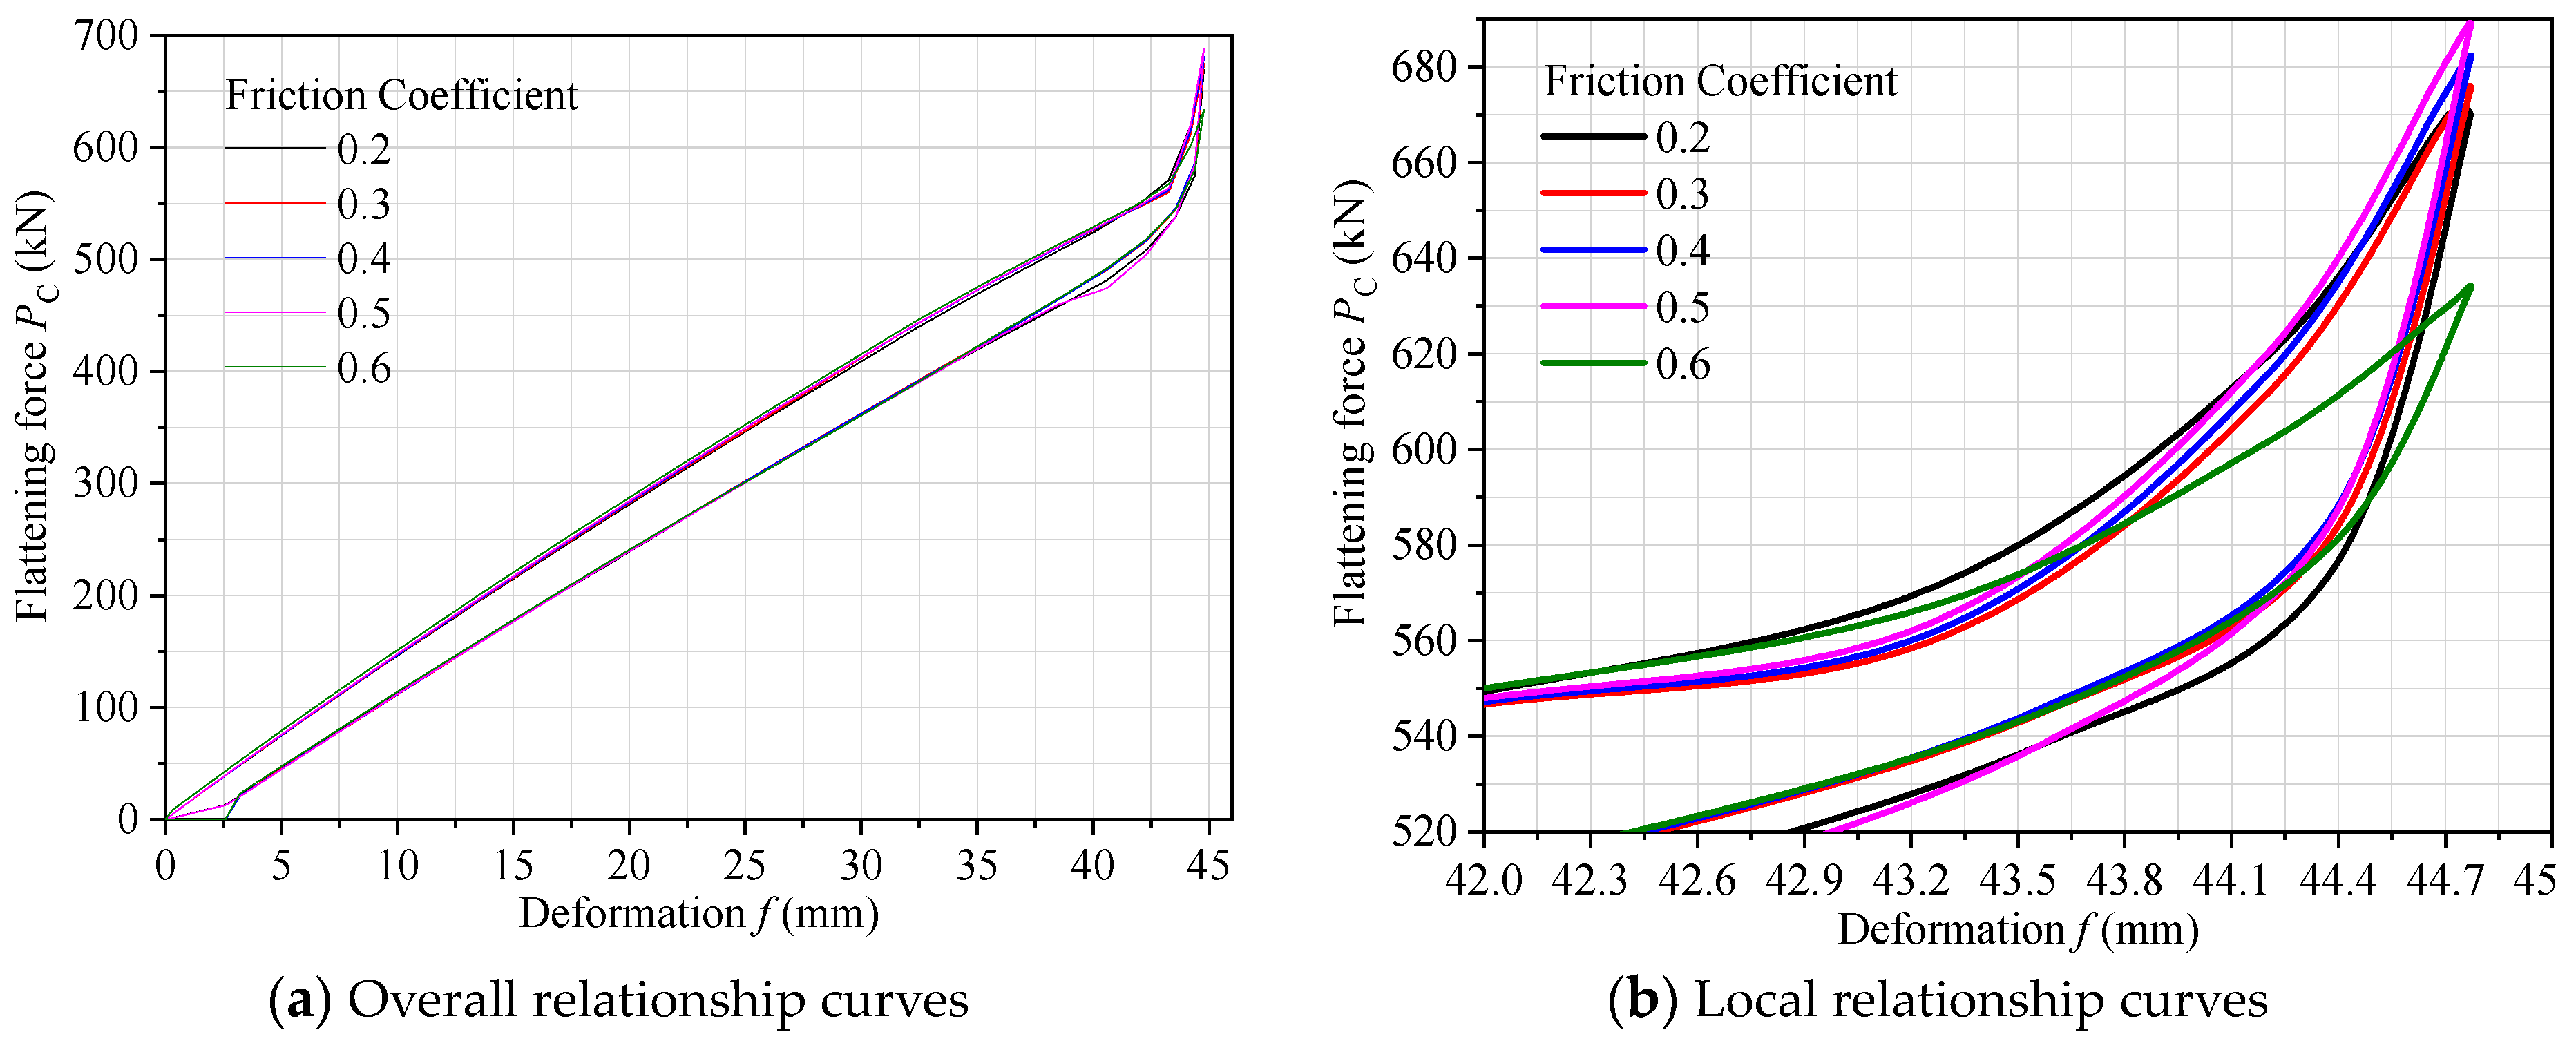
3.2. Analysis of Friction Coefficient μ2

It is known that the friction coefficient μ1 between disc springs is taken as = 0.005 based on the study of Cai [37]. Actually, there is another important friction coefficient μ2, namely the friction between disc spring and the floating pressure plate. To determine a reasonable friction coefficient μ2, the mechanical properties of a DSCCP shock absorber with different friction coefficients μ2 are compared with theoretical calculation results, as shown in Figure 6 and Table 2. It can be found that the flattening force firstly decreases and then increases with the increase of friction coefficient μ2 under linear loading. When μ2 = 0.3, the flattening forces are 678 kN, 647 kN for the numerical and theoretical results, respectively. The error is a minimum of 4.58% at this condition. Under sin-function loading, it can be found that the flattening force gradually increases with the increase of friction coefficient μ2. When μ2 = 0.3, the flattening forces are 675 kN, 647 kN for the numerical and theoretical results, respectively. The error is also relatively small, which is 4.14%. Therefore, it is suggested that the friction coefficient μ2 will be appropriate if taken as 0.3.

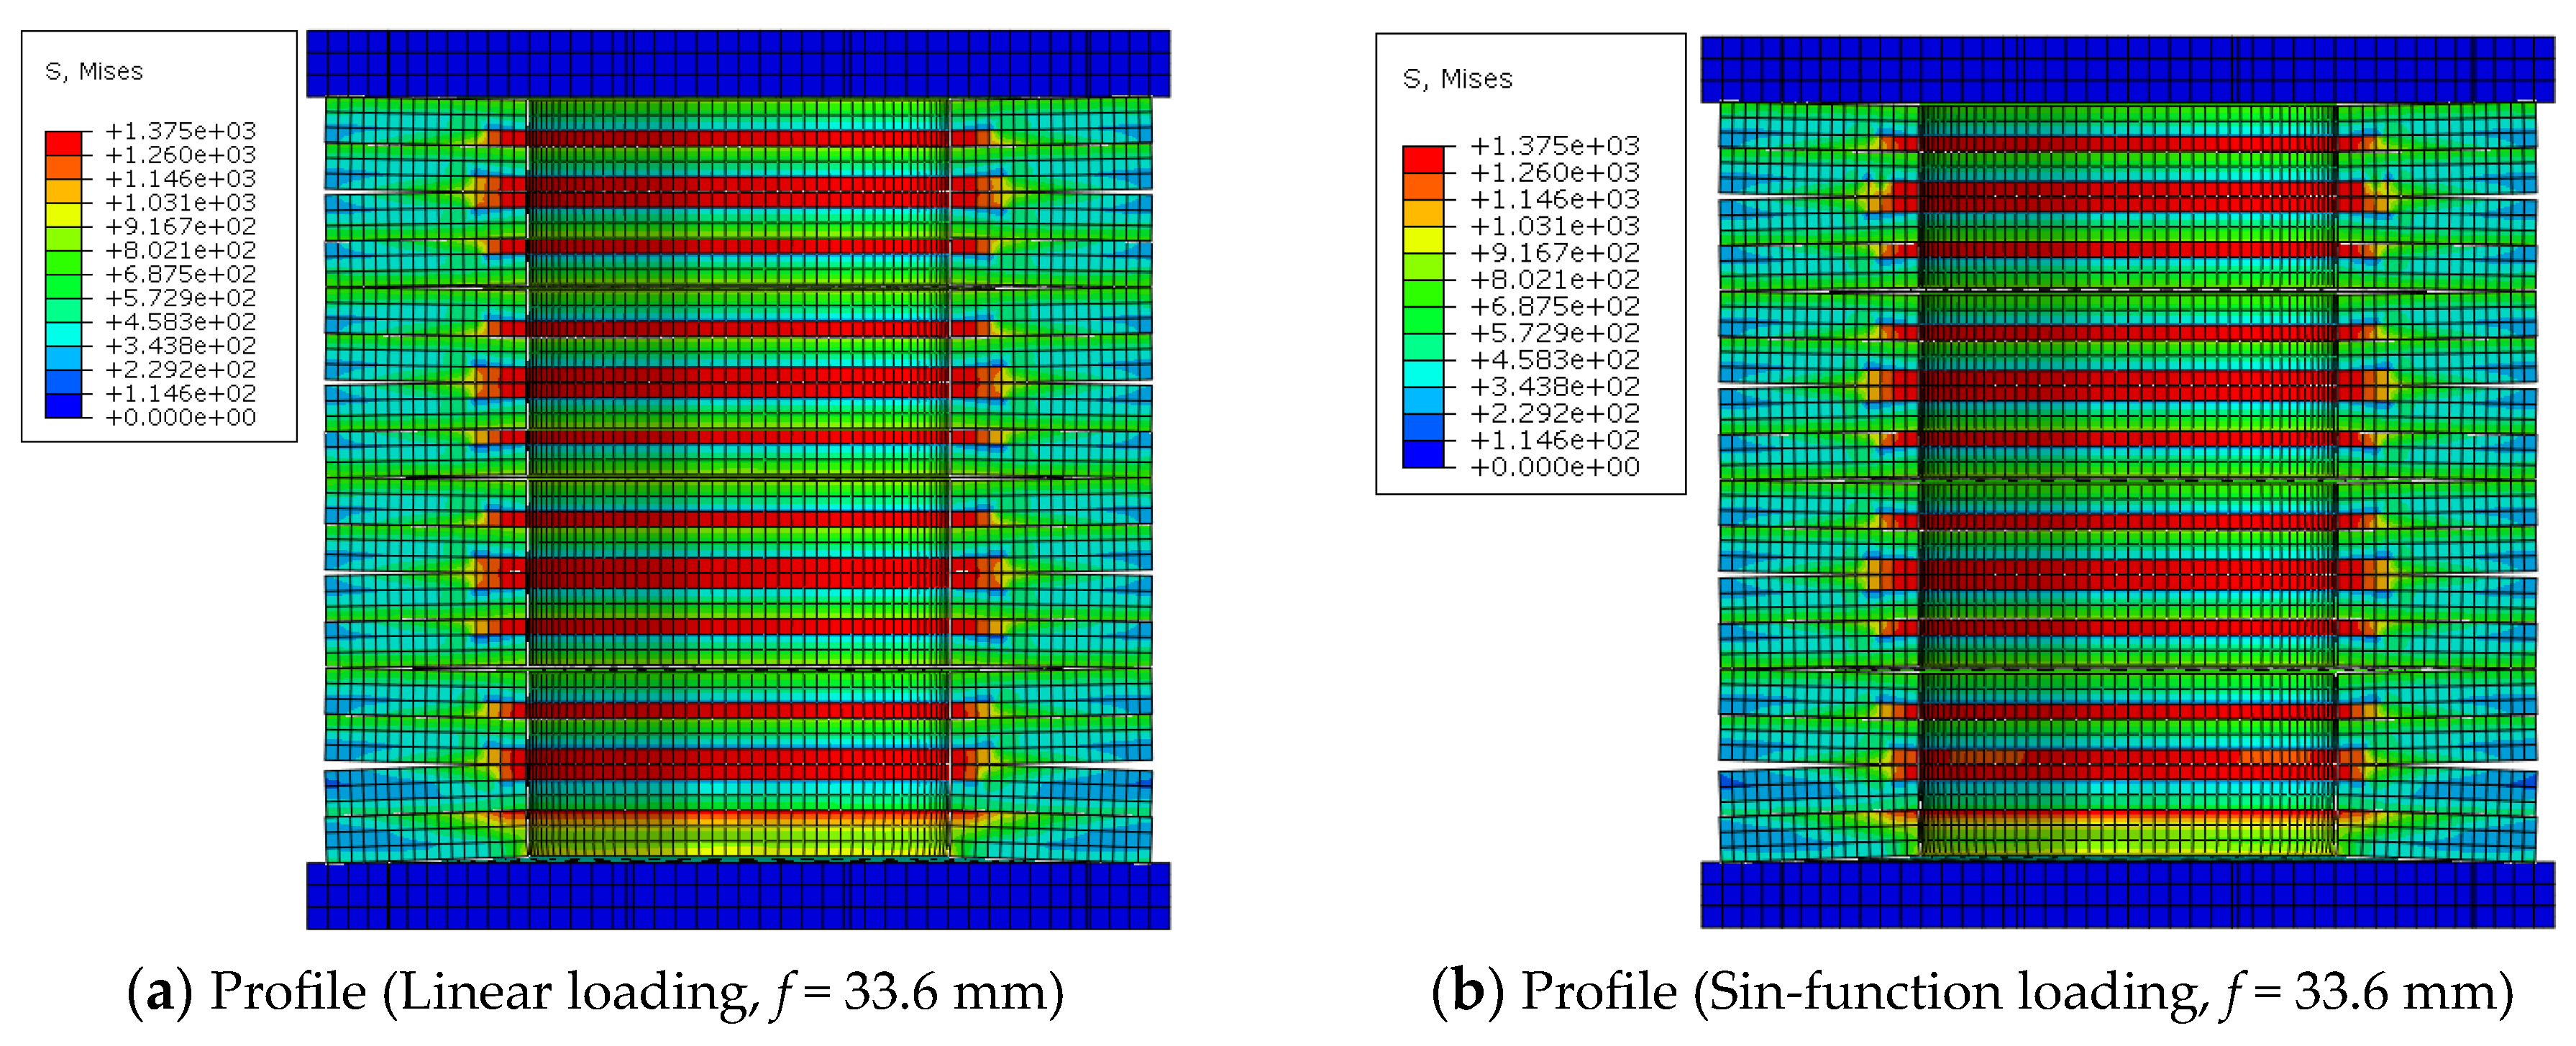
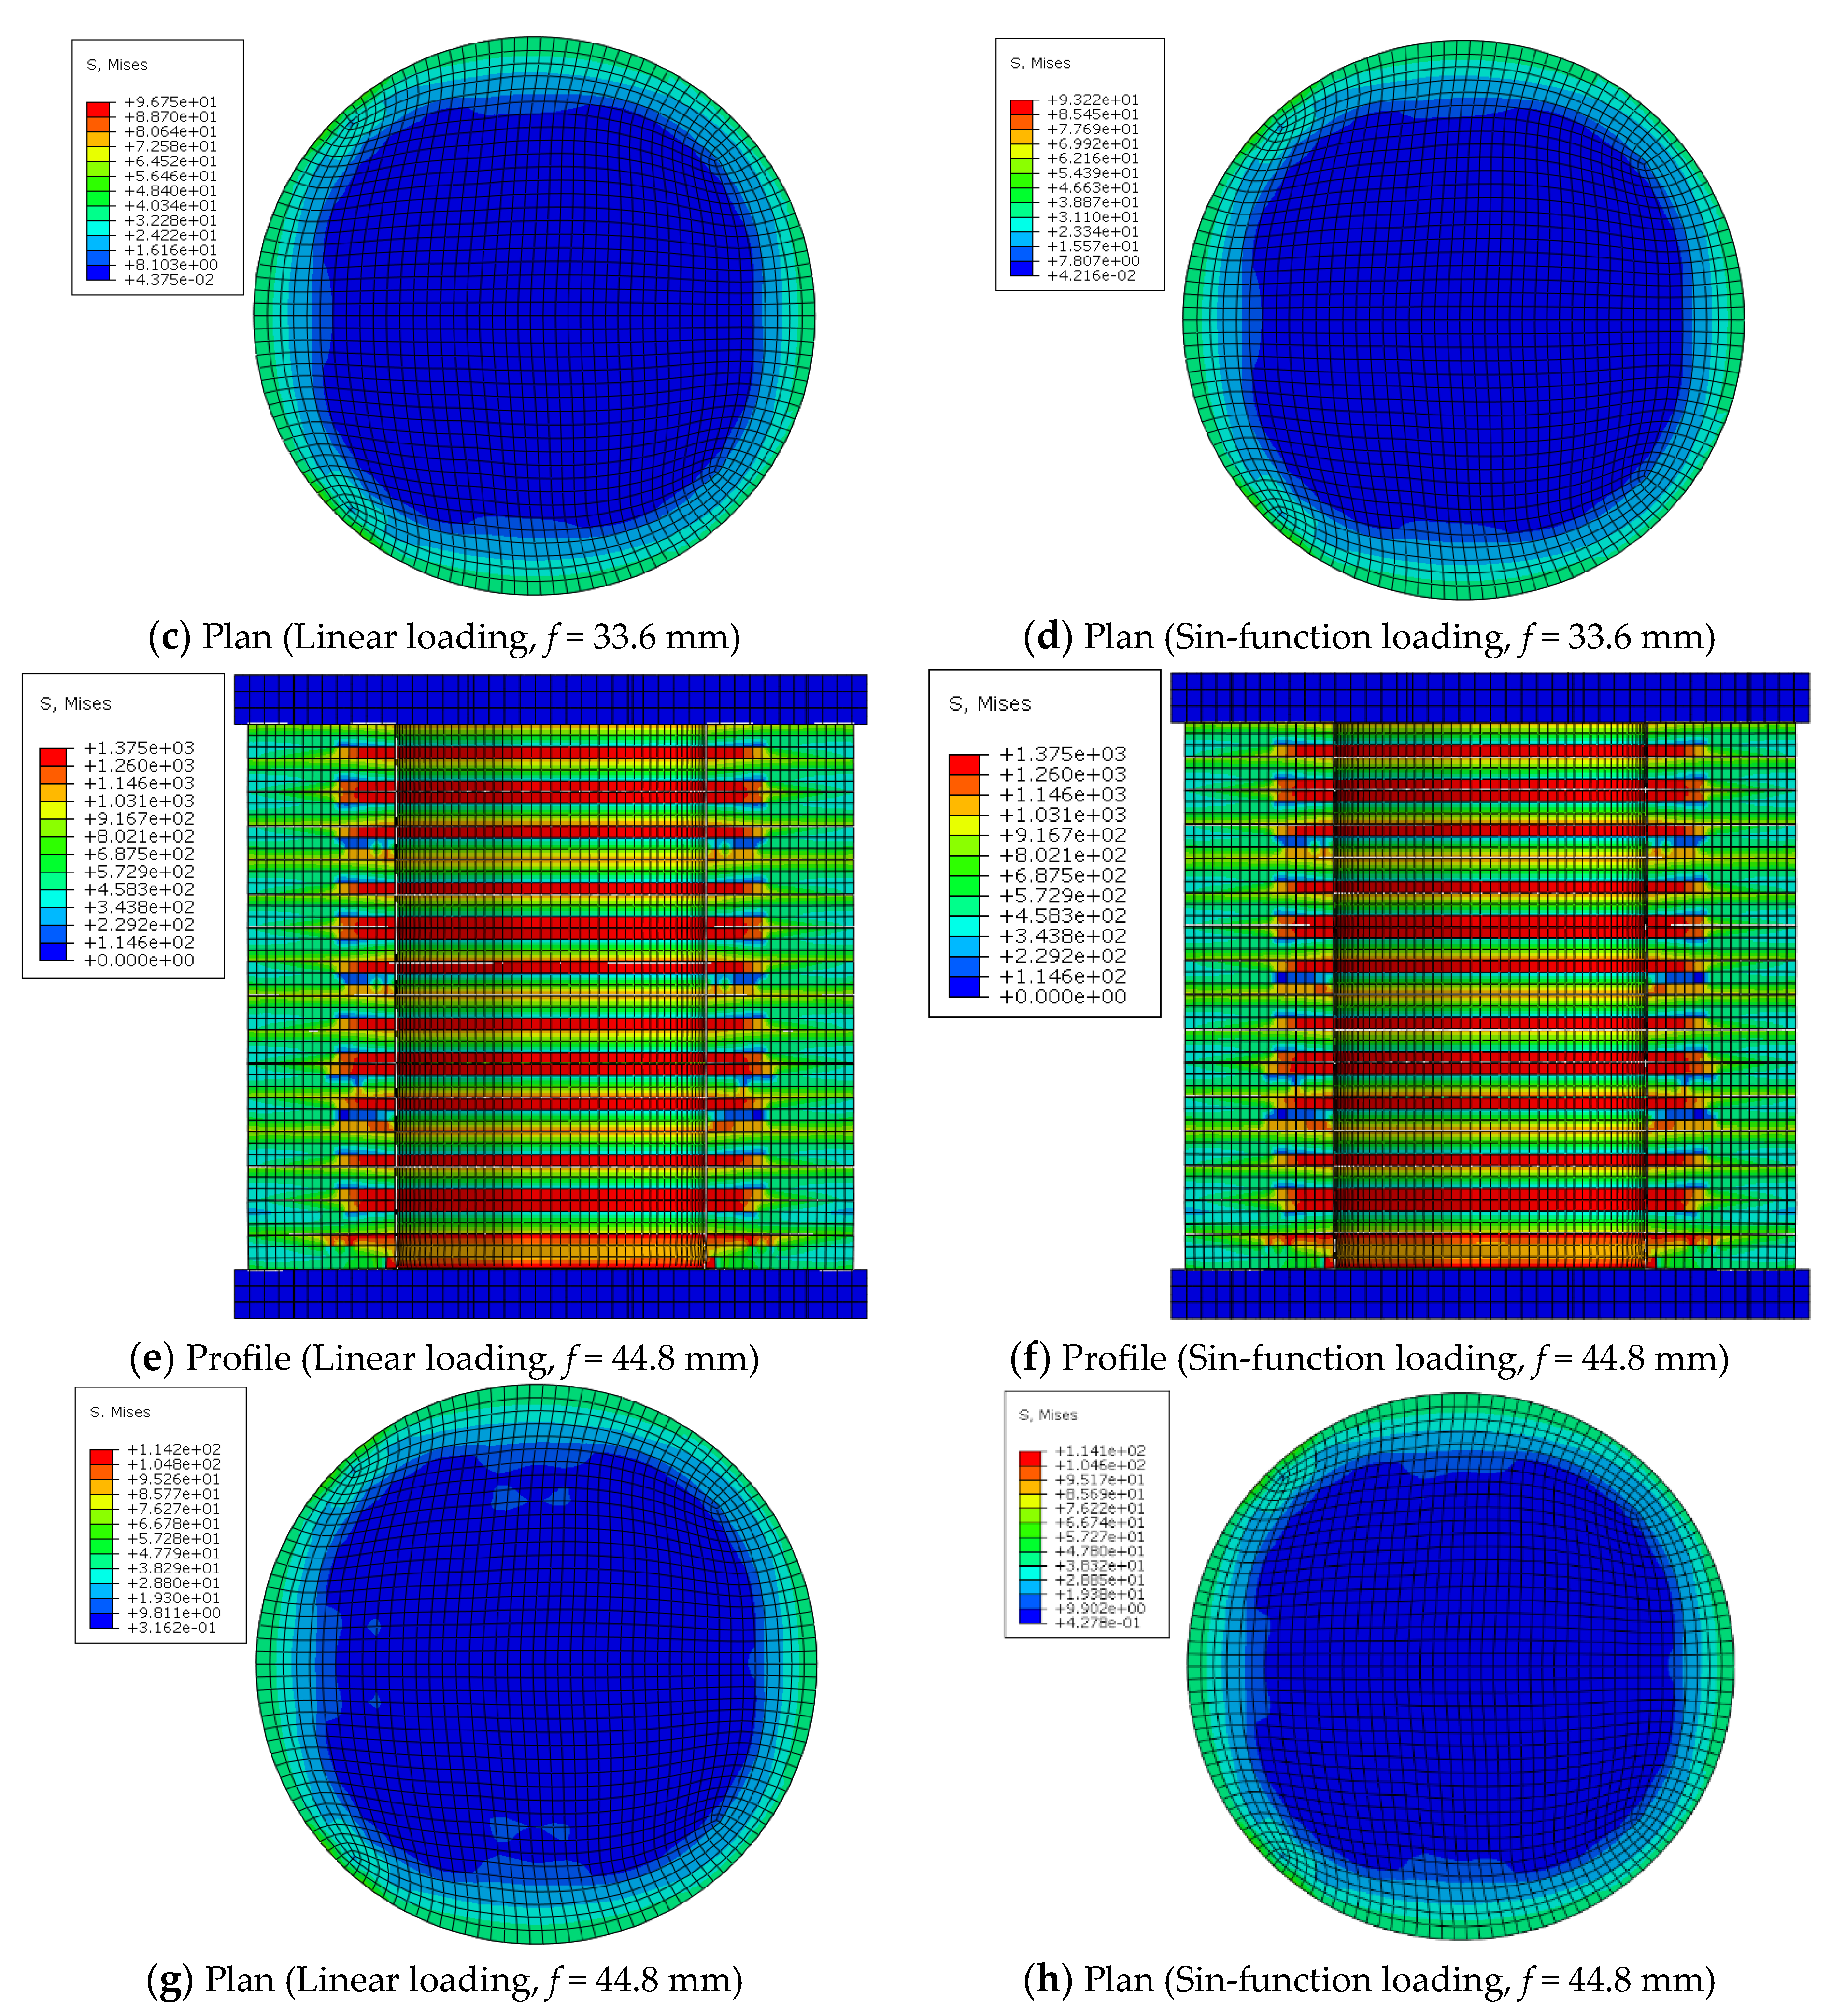
3.3. Model Validation

Figure 7 and Table 3 show the results of the DSCCP shock absorber model under the two static loadings. It can be seen that the relationship is basically proportional between loading and deformation under linear static loading. When the maximum deformation of 44.8 mm is reached, the flattening load is 643,225 N, which has an error of only 0.59% with the theoretical calculation. When sin-function static loading is adopted, there is a phenomenon of non-coincidence of loading and unloading. The reason is that there is friction behavior between the disc spring plates, as well as between the disc spring plates and the upper and lower floating pressure plates. This frictional behavior is the main contributions for the energy consumption of disc springs. Under this static loading, the flattening force at maximum deformation is 635,456 N, which has an error of 1.82% with the theoretical calculation. Therefore, the effectiveness and rationality of the numerical model of the DSCCP shock absorber can be guaranteed.
Stress contours of the profile and top surface of the DSCCP shock absorber model are shown in Figure 8 under the deformations of 0.75h0 = 33.6 mm and h0 = 44.8 mm, respectively. It can be seen that the stress contours of the disc springs are basically the same between the two static ladings. The maximum stress occurs at the upper inner edge of disc spring, where the stress gradually decreases from inside to outside. The stress contours of the top plate are relatively consistent and uniform. Under the vertical deformation of 33.6 mm, the maximum and minimum stress values are 96.75 MPa and 0.044 MPa for the linear loading, 93.22 MPa and 0.042 MPa for the sin-function loading. Under the vertical deformation of 44.8 mm, the maximum and minimum stress values are 114.2 MPa and 0.32 MPa for the linear loading, 114.1 MPa and 0.42 MPa for the sin-function loading. It can be concluded that differences of the stresses between the two loadings are very small, supporting the rationality of the numerical model.

4. Mechanical Property Test

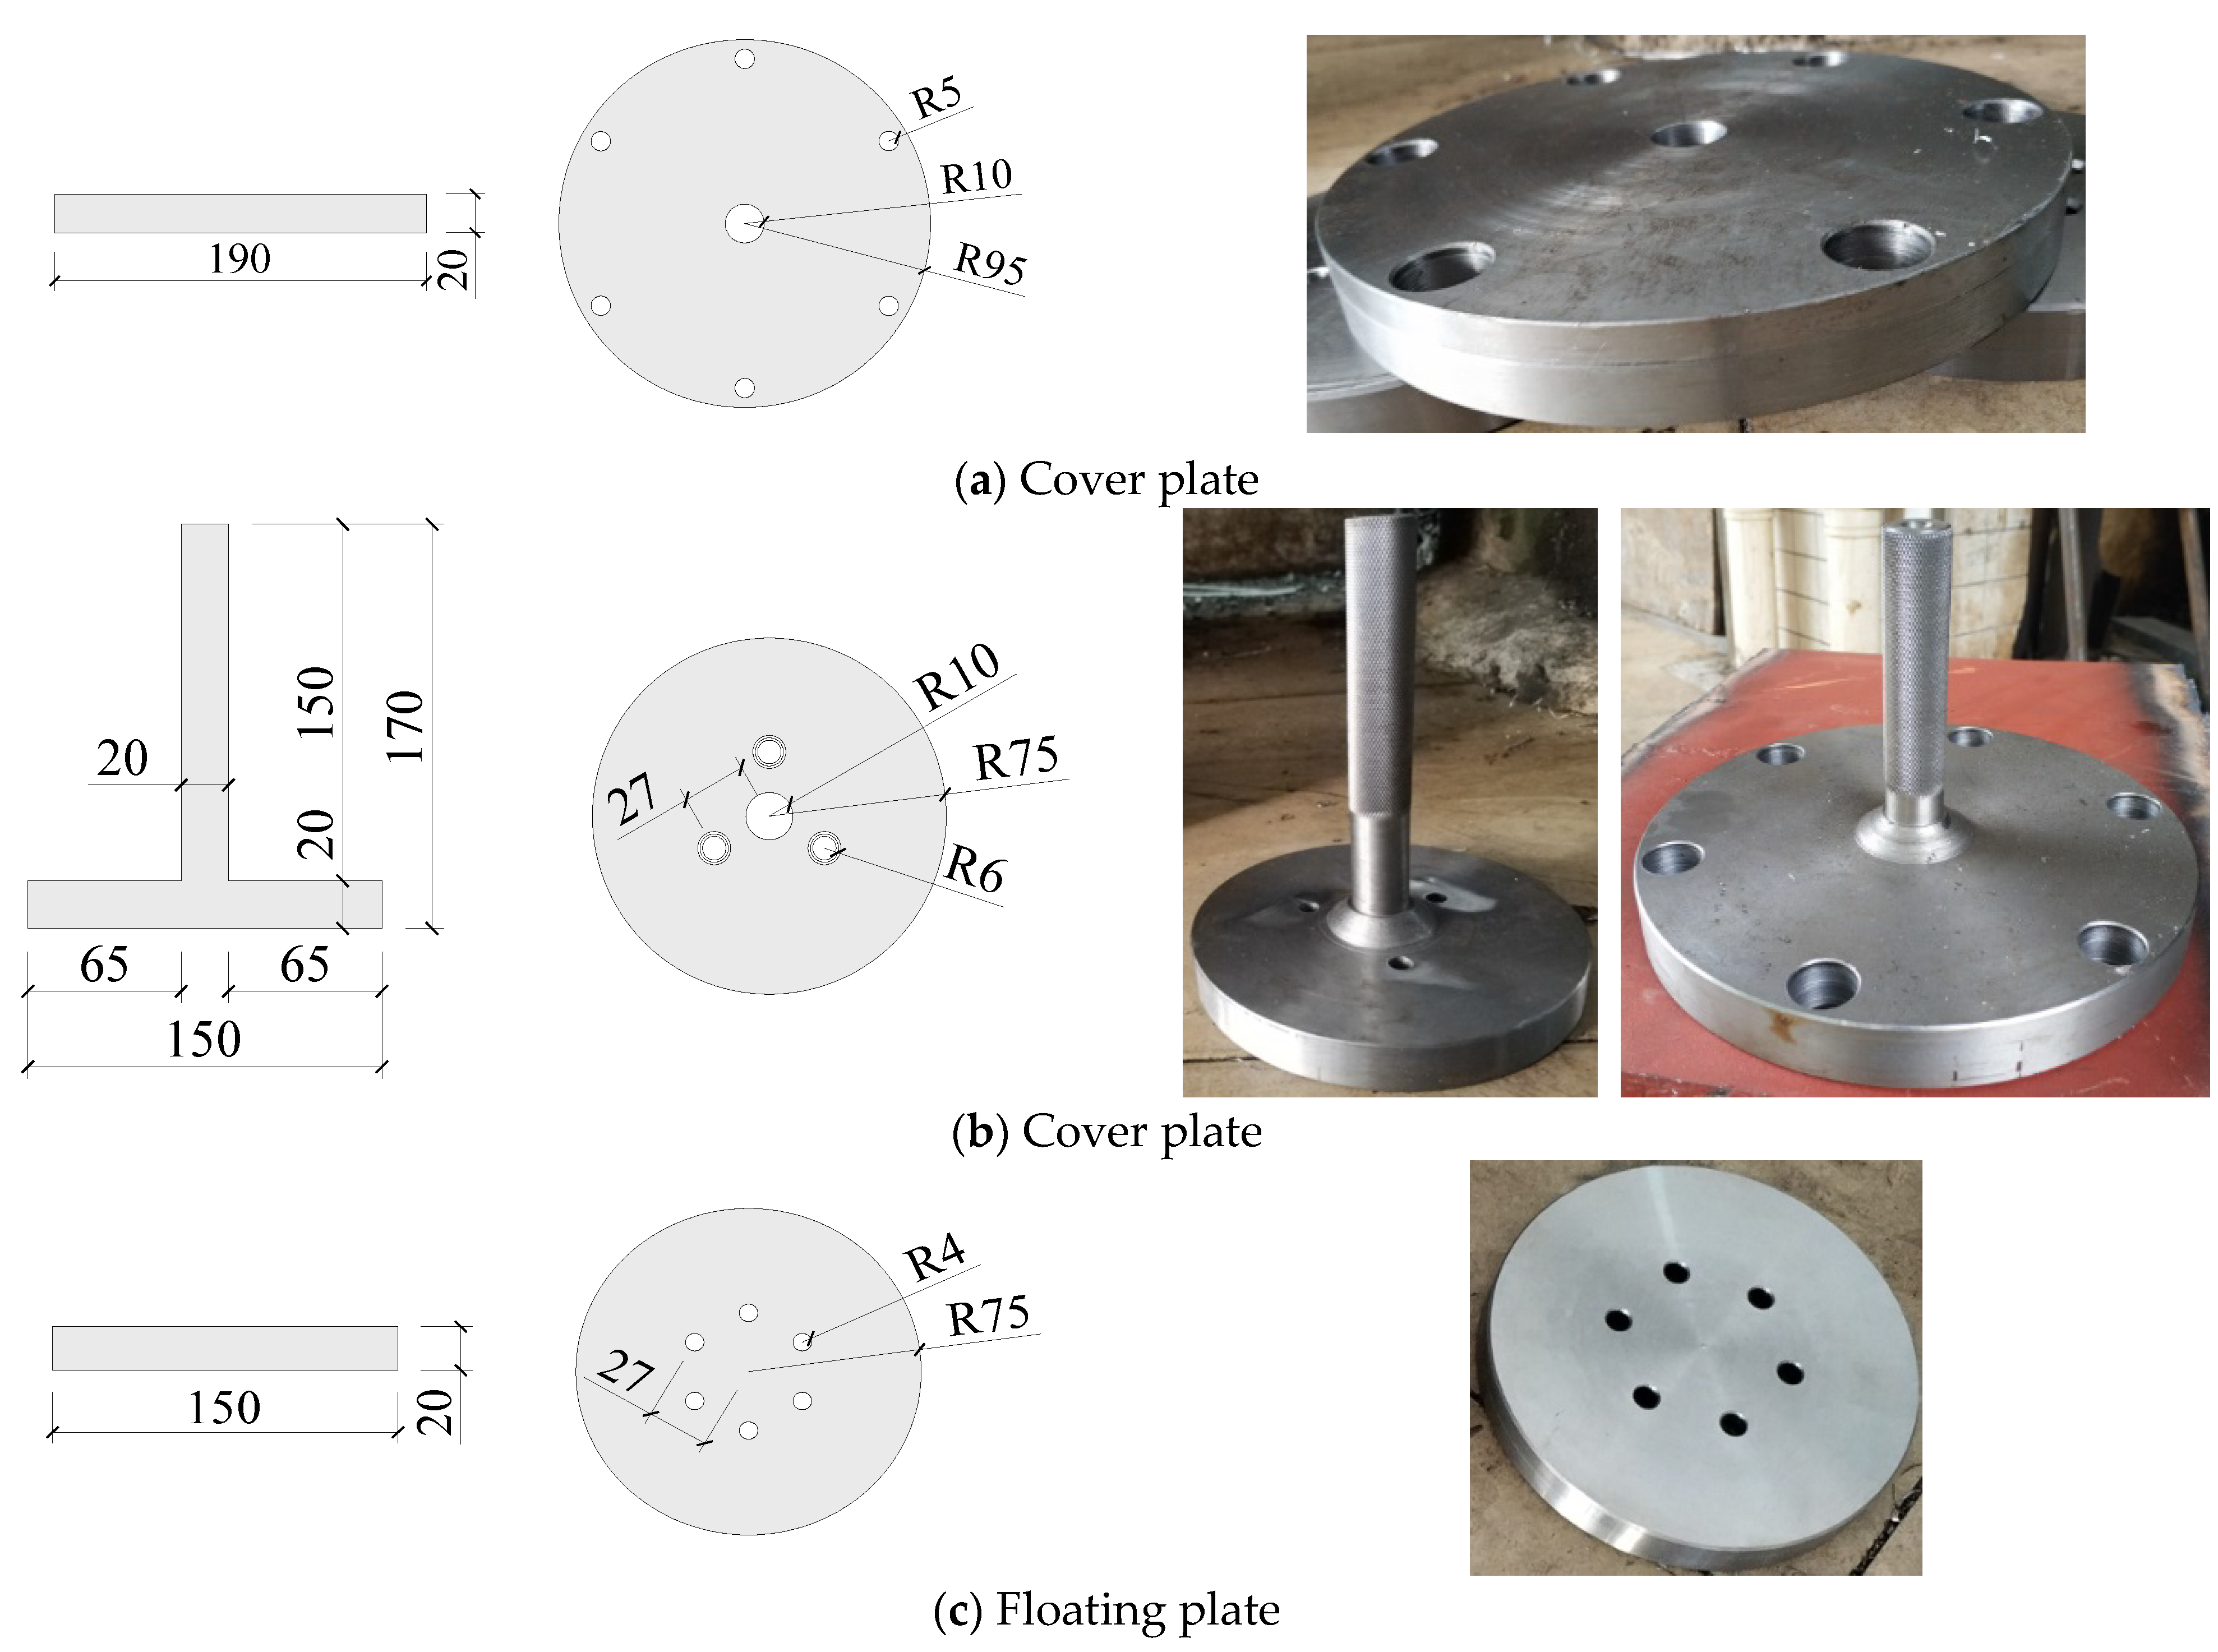
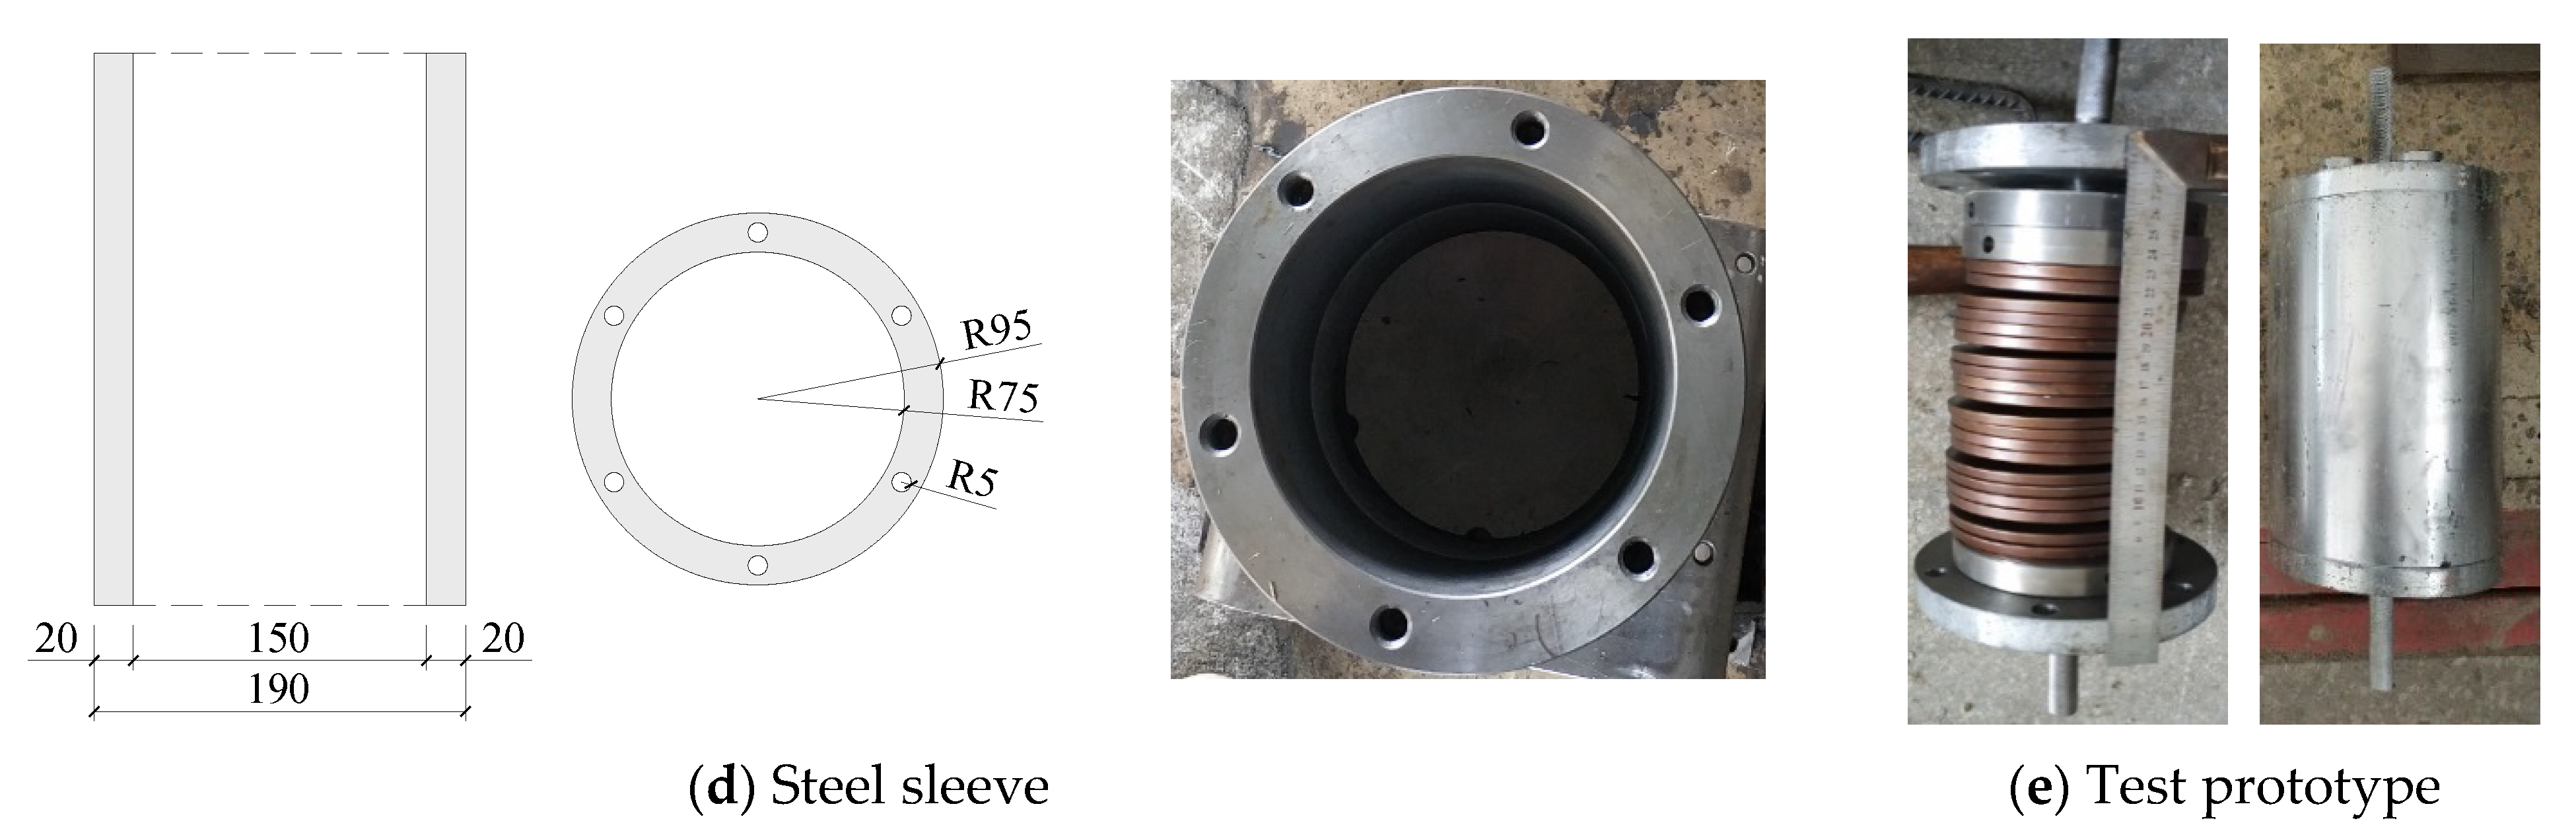
4.1. Design and Production of Test Prototype

The experimental specimen the DSCCP shock absorber is made of a cover steel plate, floating pressure steel plate, steel sleeve, disc spring and cables. The upper cover plate serves as the sealing plate for the DSCCP shock absorber, which has five through-holes, as shown in Figure 9a. The center hole with a diameter of 20 mm serves as the exit hole for the upper floating pressure plate. The four surrounding holes serve as reserved bolt holes for connecting to the sleeve. The upper and lower floating plates have diameters of 150 mm and 190 mm, respectively, with unified thickness of 20 mm. A connecting rod with a length of 150 mm and a diameter of 20 mm is used to connect to the fixture of the testing machine, which is fixed on the floating plate, as shown in Figure 9b. The upper and lower plates of the disc spring group are both cylindrical bodies with a thickness of 20 mm and a diameter of 150 mm. Each of the plate has three through-holes and three bolt holes with a diameter of 8 mm, as shown in Figure 9c. The sleeve is a steel cylinder with an outer diameter of 190 mm, an inner diameter of 150 mm, and a height of 282 mm. Six bolt holes with depth of 50 mm are reserved for connecting to the cover plate, as shown in Figure 9d.
The upper and lower floating plates are connected by six two-group steel cables with a diameter of 6 mm. One end of the steel cable is fixed on the spring bottom plate connected to the lower floating pressure plate, and the other end is fixed by passing through the upper plate and being secured by a self-locking anchor on the upper floating pressure plate. The distance between the upper floating pressure plate and the upper cover plate is 30 mm. The size of the upper cover plate is designed according to the construction requirements. To ensure that the disc spring works properly and avoid lateral displacement during loading, the disc spring is placed inside the sleeve with a distance of 1.5 mm between the disc spring and the sleeve. The assembly-type components are used in the experiment specimen, which is easy to assemble, disassemble, and replace. The final physical prototype of the test specimen is shown in Figure 9e. The parameters of the disc spring used in the test specimen are given in Table 4.

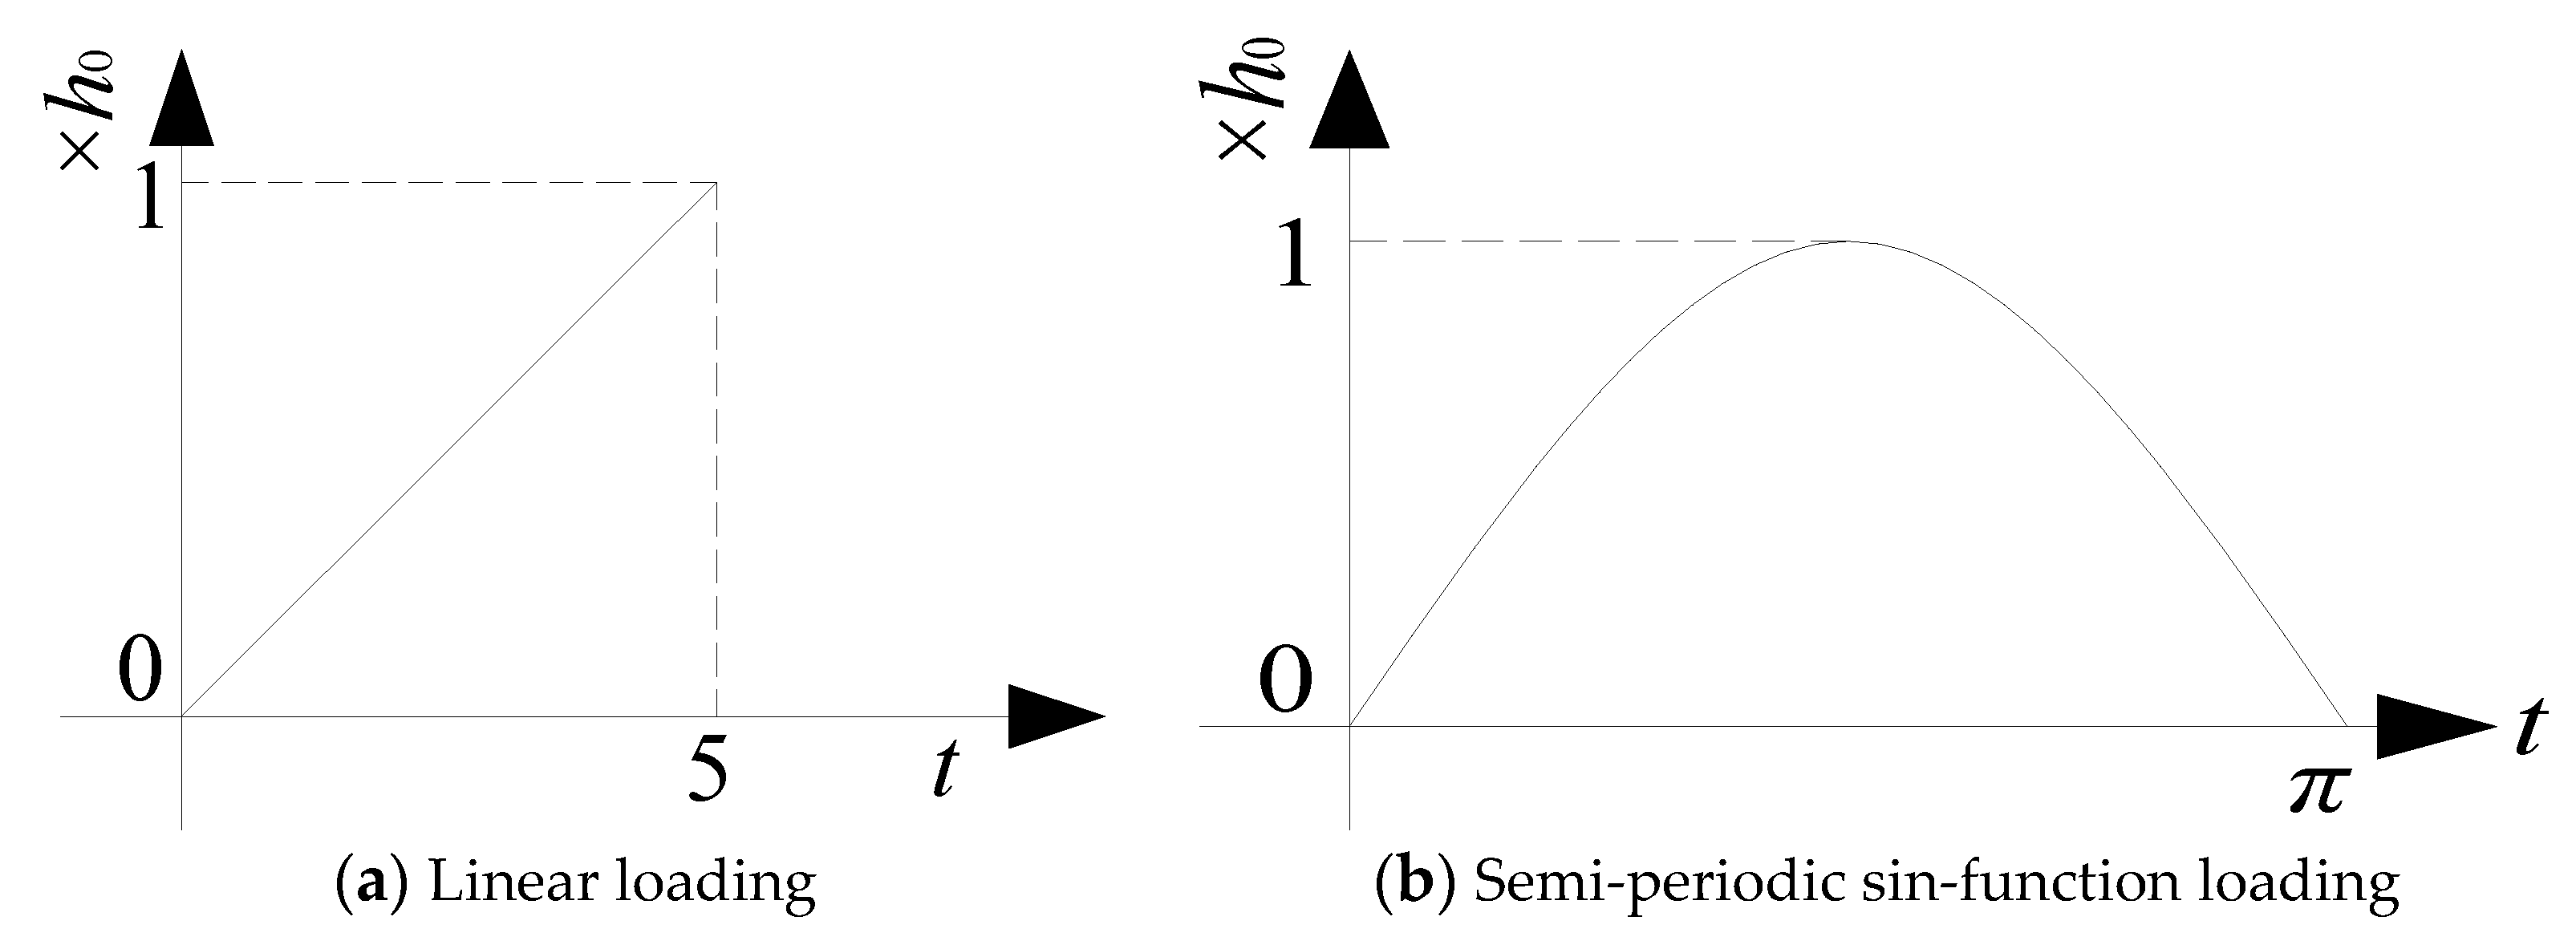
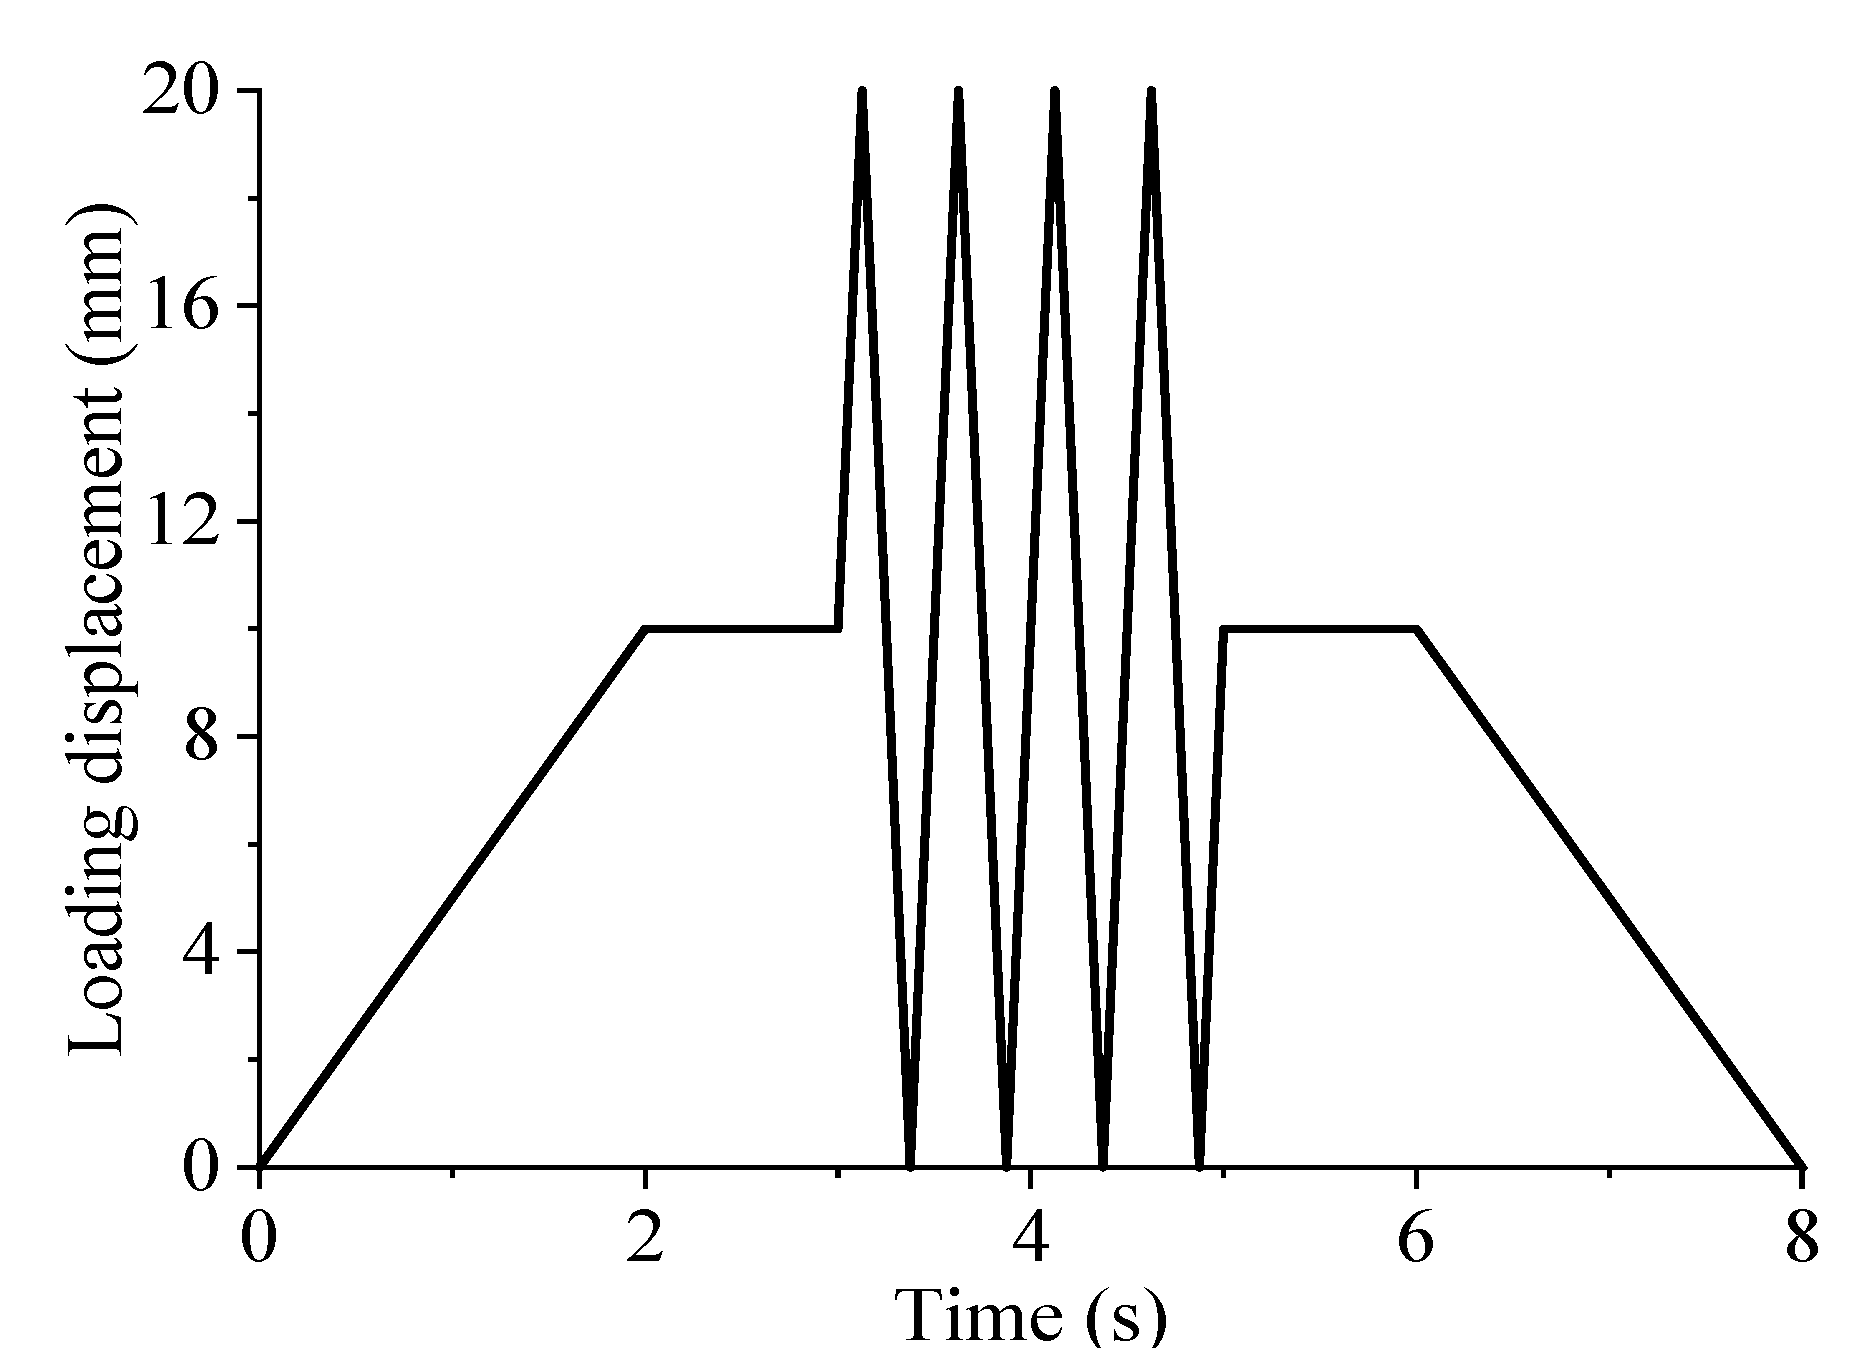
4.2. Test Loading Scheme Design

The DSCCP shock absorber specimens were loaded using an MTS 250 kN electro-hydraulic servo fatigue testing system. The maximum stroke of the testing machine is 1000 mm, which meets the loading requirements of the specimens. The loading force and displacement are both measured and obtained within the loading system. The loading schematic of the specimen is shown in Figure 10.
In order to study the mechanical performance of the DSCCP shock absorber, static and dynamic loading tests were conducted. The mechanical performance, such as tensile and compressive forces, equivalent stiffness and equivalent damping ratio, was analyzed based on experimental data. A displacement control loading method was adopted during the static and dynamic loadings. The static loading test included axial tensile and compressive tests. Static loading was applied slowly from the equilibrium position until it reached the designed operating deformation position of 24 mm, in which the maximum deformation of the DSCCP shock absorber is 32 mm. Dynamic loading involved reciprocating motion at the equilibrium position of the shock absorber, taking into account parameter effects, such as different loading frequencies, loading amplitudes and pre-compression deformations. The dynamic loading cases of the shock absorber are shown in Table 5, and the dynamic loading schematic is shown in Figure 11. Correspondingly, the numerical calculations were also conducted for these cases.

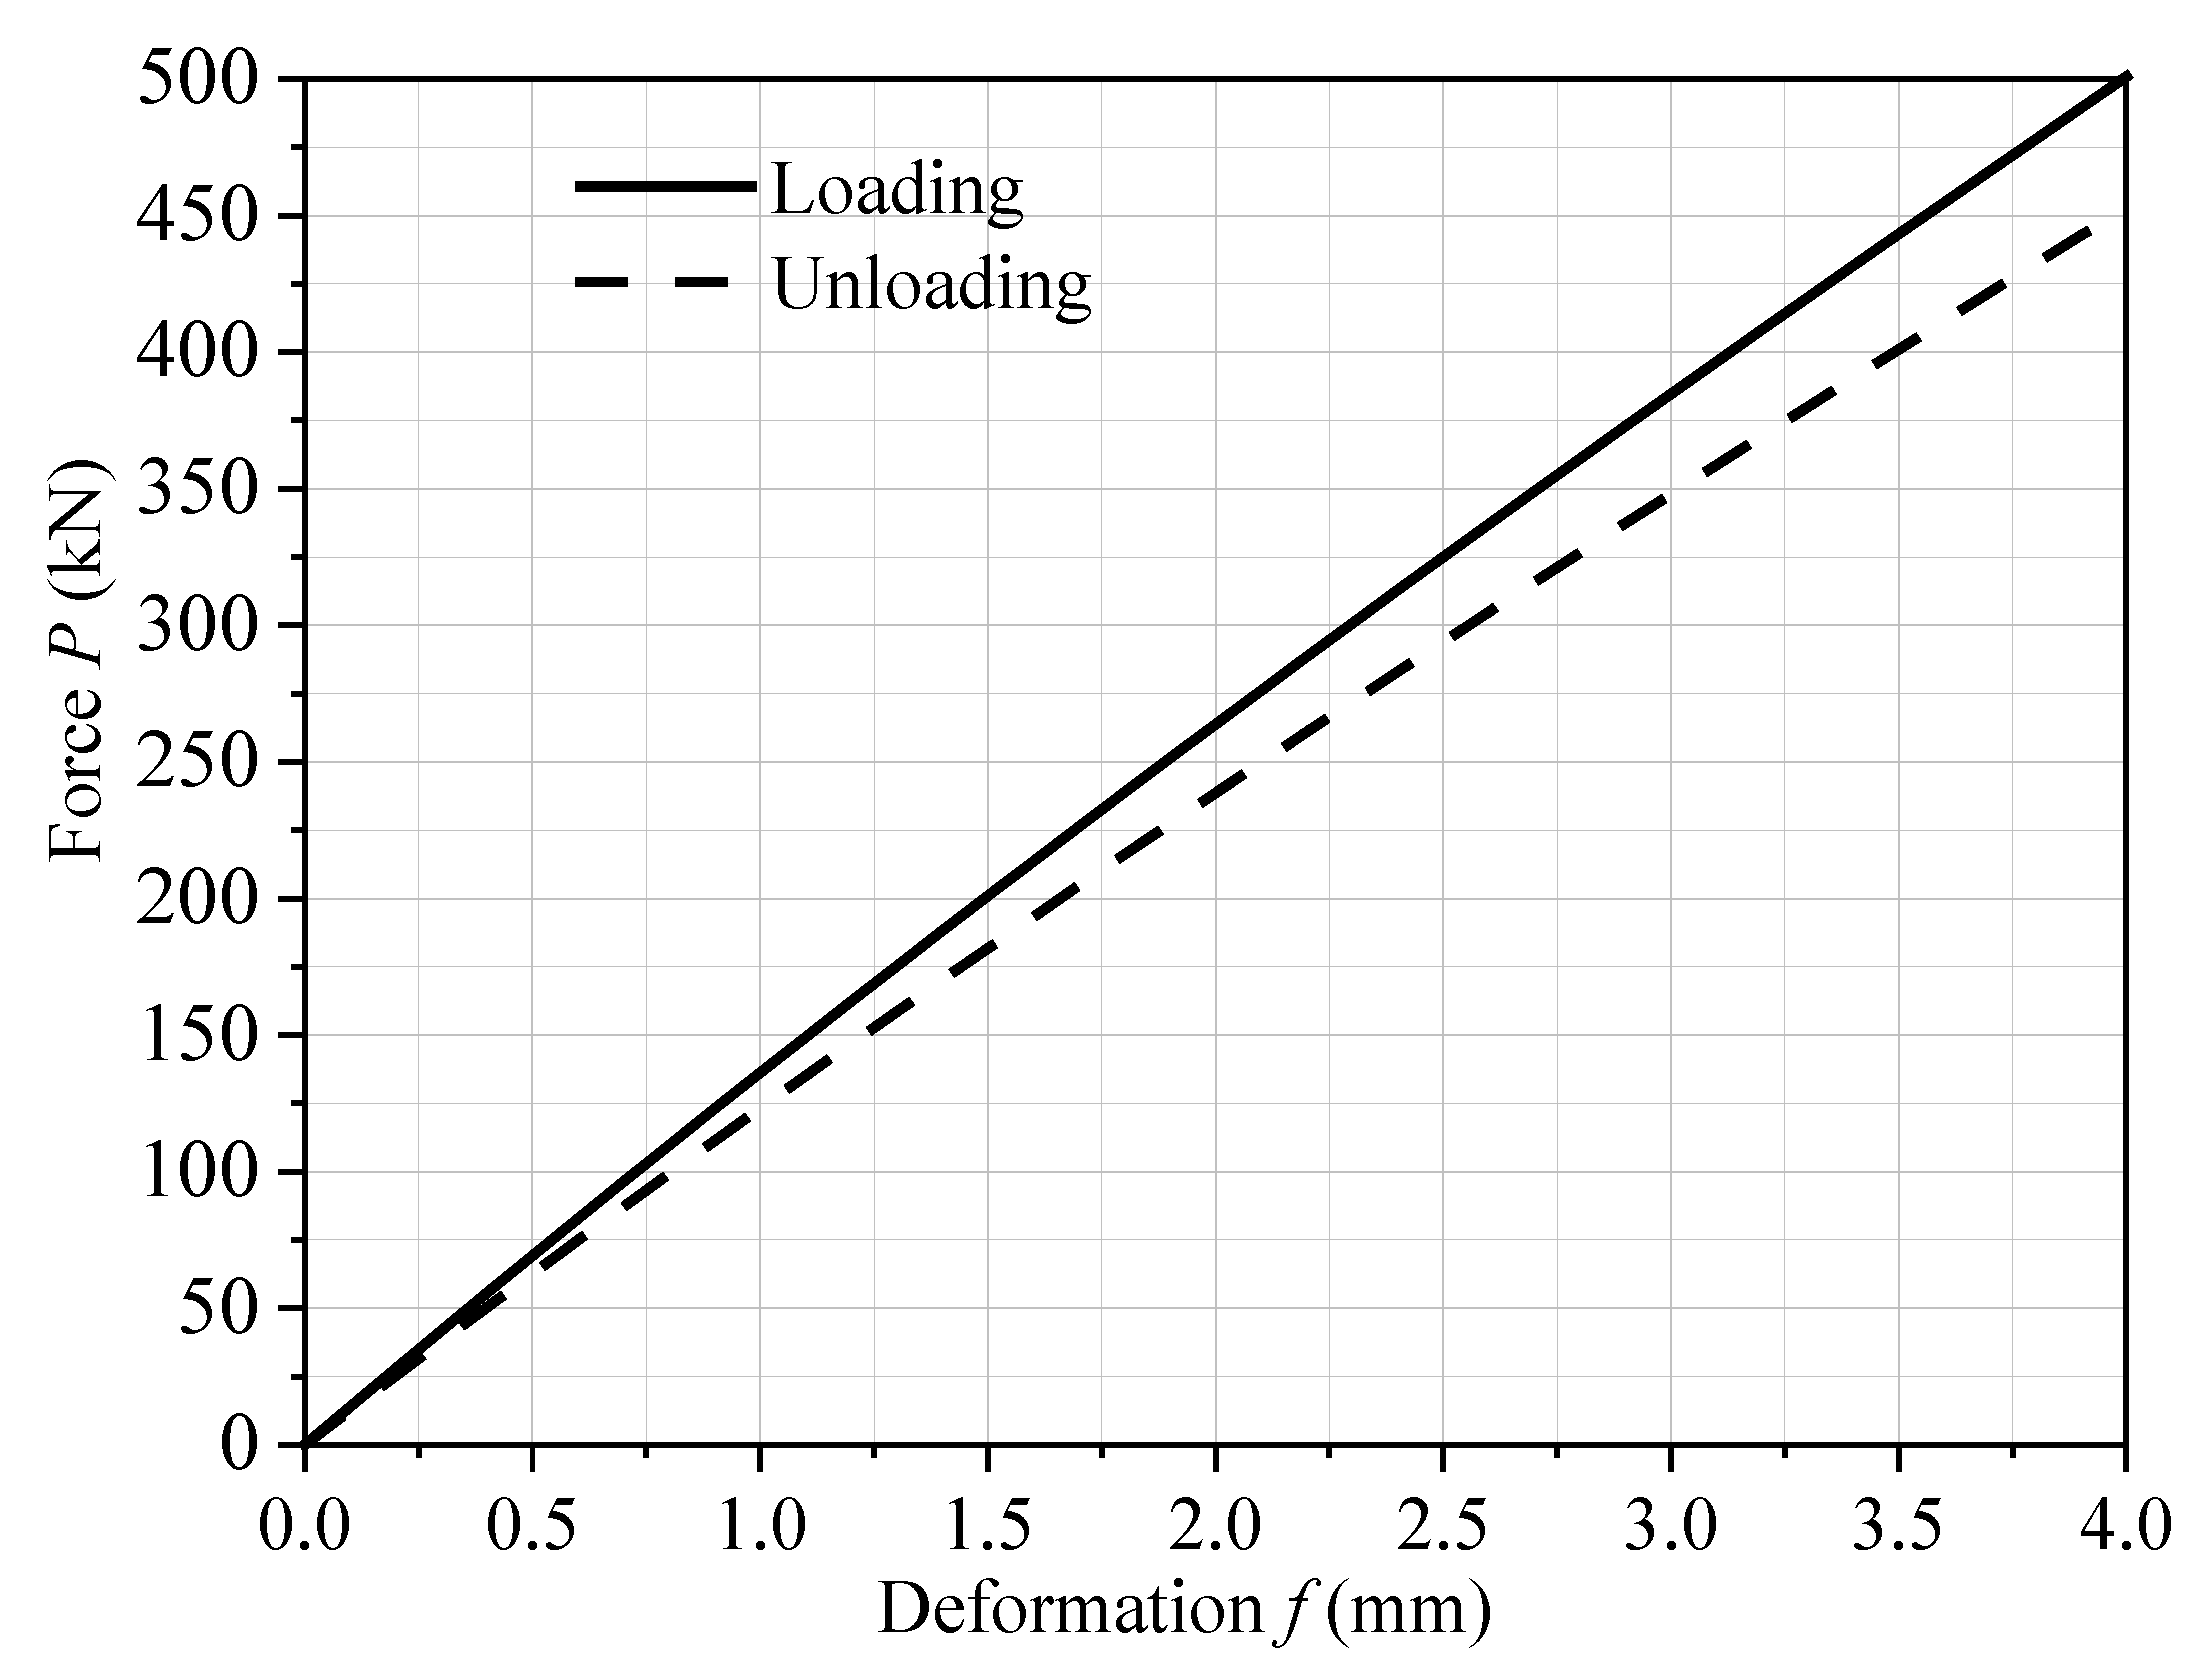
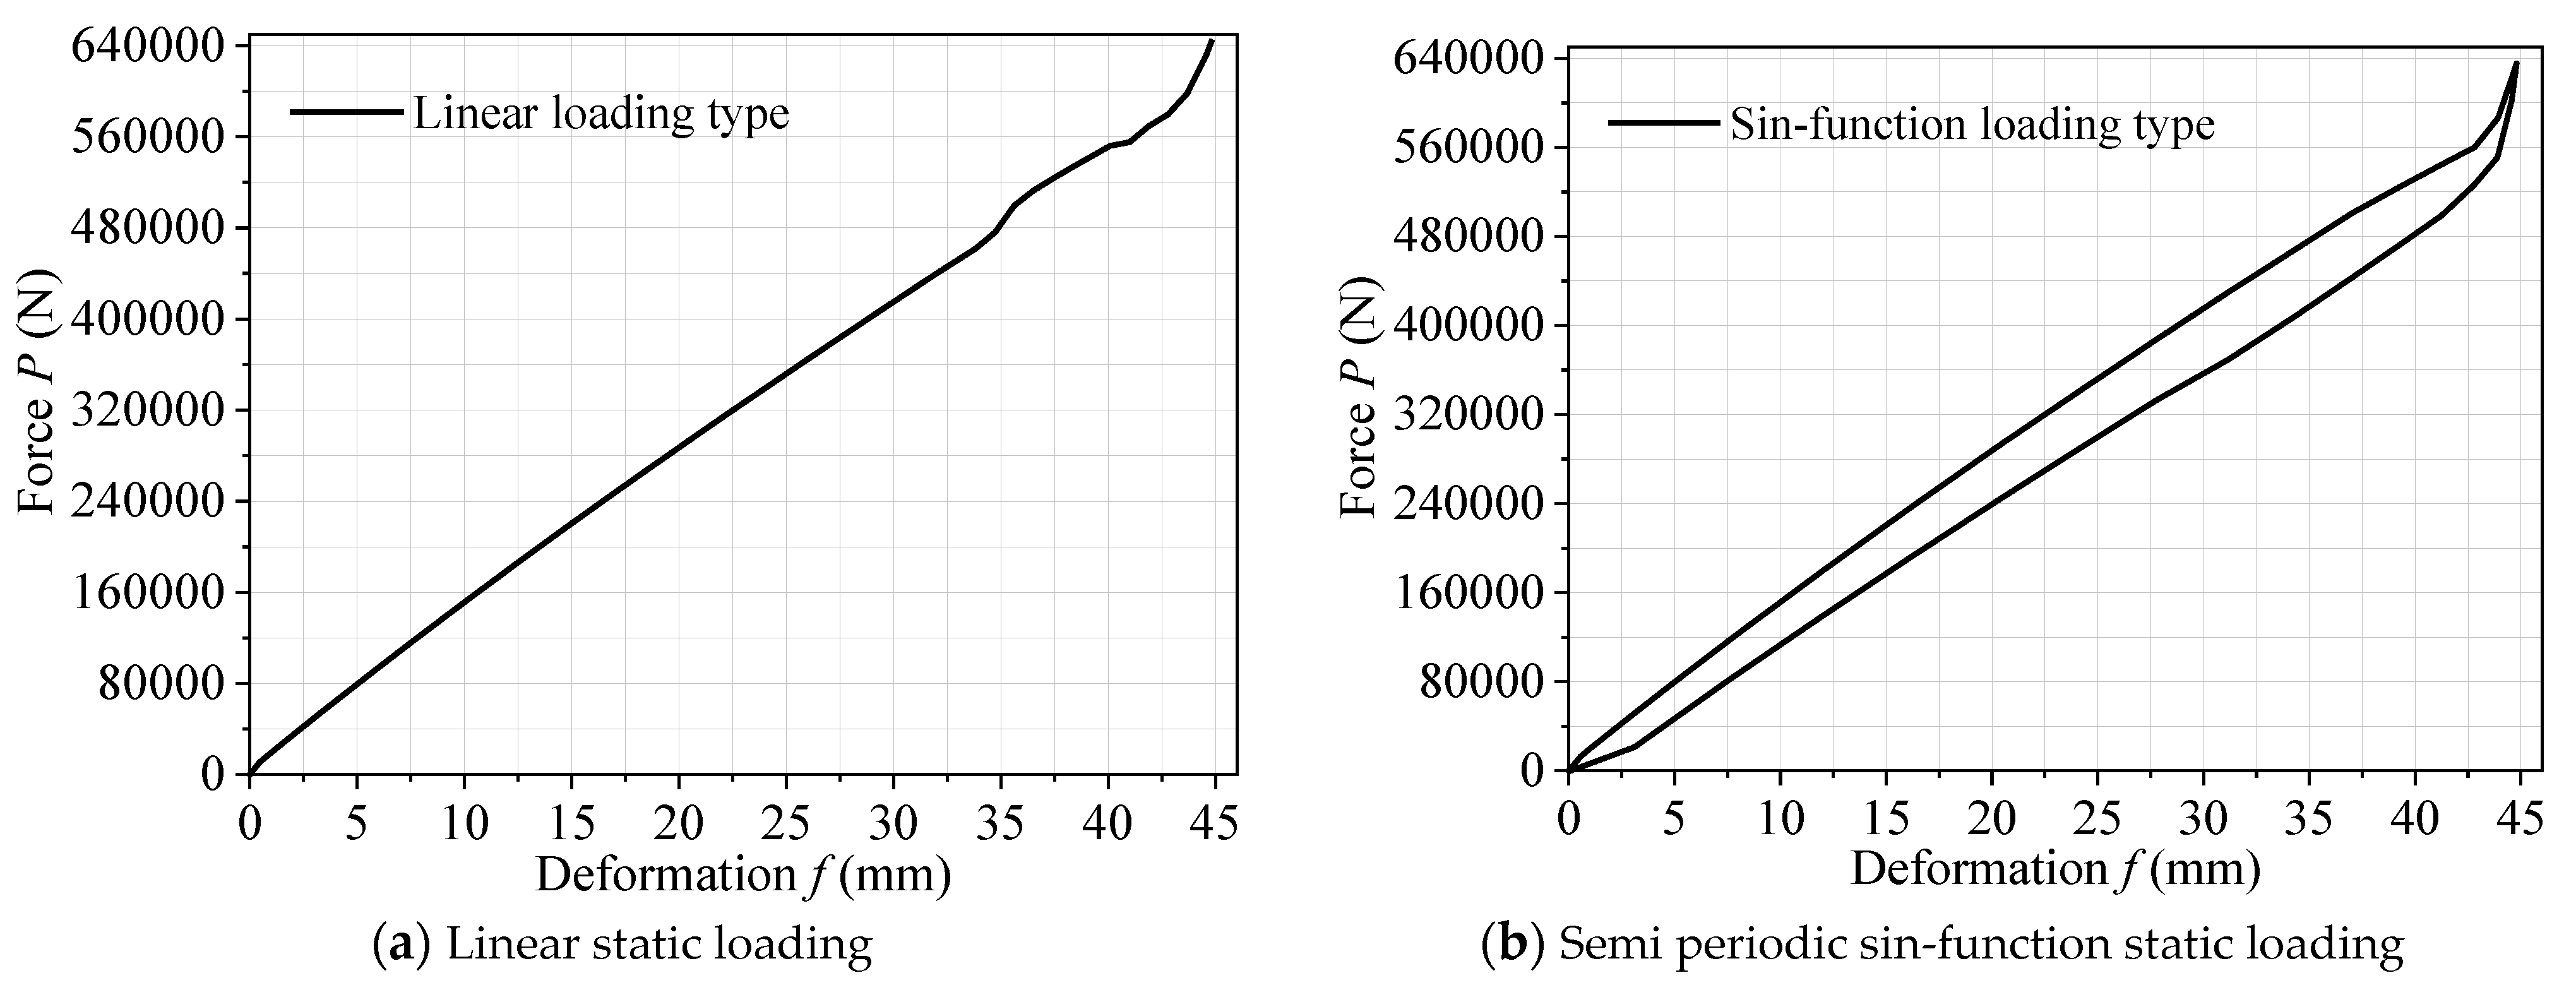
4.3. Static Test Results

The maximum deformation of the designed DSCCP shock absorber is 32 mm, and the allowable deformation in the design is 75% of the maximum deformation [22], which is 24 mm. The force–deformation relationship curve of the DSCCP shock absorber can be obtained through static tension and compression tests. The result comparison with theoretical calculation results and numerical simulation results is shown in Figure 12. From Figure 12a, it can be seen that the bearing capacity of the DSCCP shock absorber under the design compression deformation condition is 178 kN, which is slightly different from the theoretical calculation and numerical simulation results, with errors of 3.82% and 4.21%, respectively, as given in Table 6. The bearing capacity under the condition of ultimate compressive deformation is 227 kN, with errors of 1.77% and 8.97% compared to theoretical calculation and numerical simulation results, respectively. From the Figure 12b, it can be seen that the bearing capacity of the DSCCP shock absorber under the design tension deformation condition is 183 kN, which is also slightly different from the theoretical calculation and numerical simulation results, with errors of 7.32% and 7.73%, respectively, as given in Table 6. The bearing capacity under the condition of ultimate tension deformation is 232 kN, with errors of 4.47% and 6.56% compared to theoretical calculation and numerical simulation results, respectively. Therefore, it can be concluded that the designed DSCCP shock absorber is reasonable and feasible, and can reflect the mechanical behavior of the actual shock absorber device.

4.4. Dynamic Test Results

4.4.1. Test Result

The hysteresis curve of the shock absorber under different pre-compression deformations, loading frequencies, and loading amplitudes is shown in Figure 13. Comparison results of equivalent stiffness and equivalent damping ratio of the DSCCP shock absorber are shown in Table 7. It can be seen that the hysteresis envelope of the DSCCP shock absorber is very small when the loading displacement is small. However, as the loading displacement increases, the corresponding envelope continues to increase, indicating that the energy dissipation capacity of the shock absorber gradually increases with the increase of loading displacement. In addition, as the loading displacement gradually increases, the bearing capacity of the DSCCP shock absorber shows a trend of slow growth and then rapid linear growth under different cases. It can also be found that the force–deformation relationship curves of the DSCCP shock absorber obtained based on numerical and experimental results have good consistency under different pre-compression deformations, loading frequencies, and loading amplitudes. The average errors of equivalent stiffness and equivalent damping ratio of the shock absorber are 2.31% and 4.99% among the 15 loading cases, respectively. Correspondingly, the maximum errors are 6.82% and 9.86% among the 15 cases, respectively, which further validates the rationality of the proposed shock absorber.

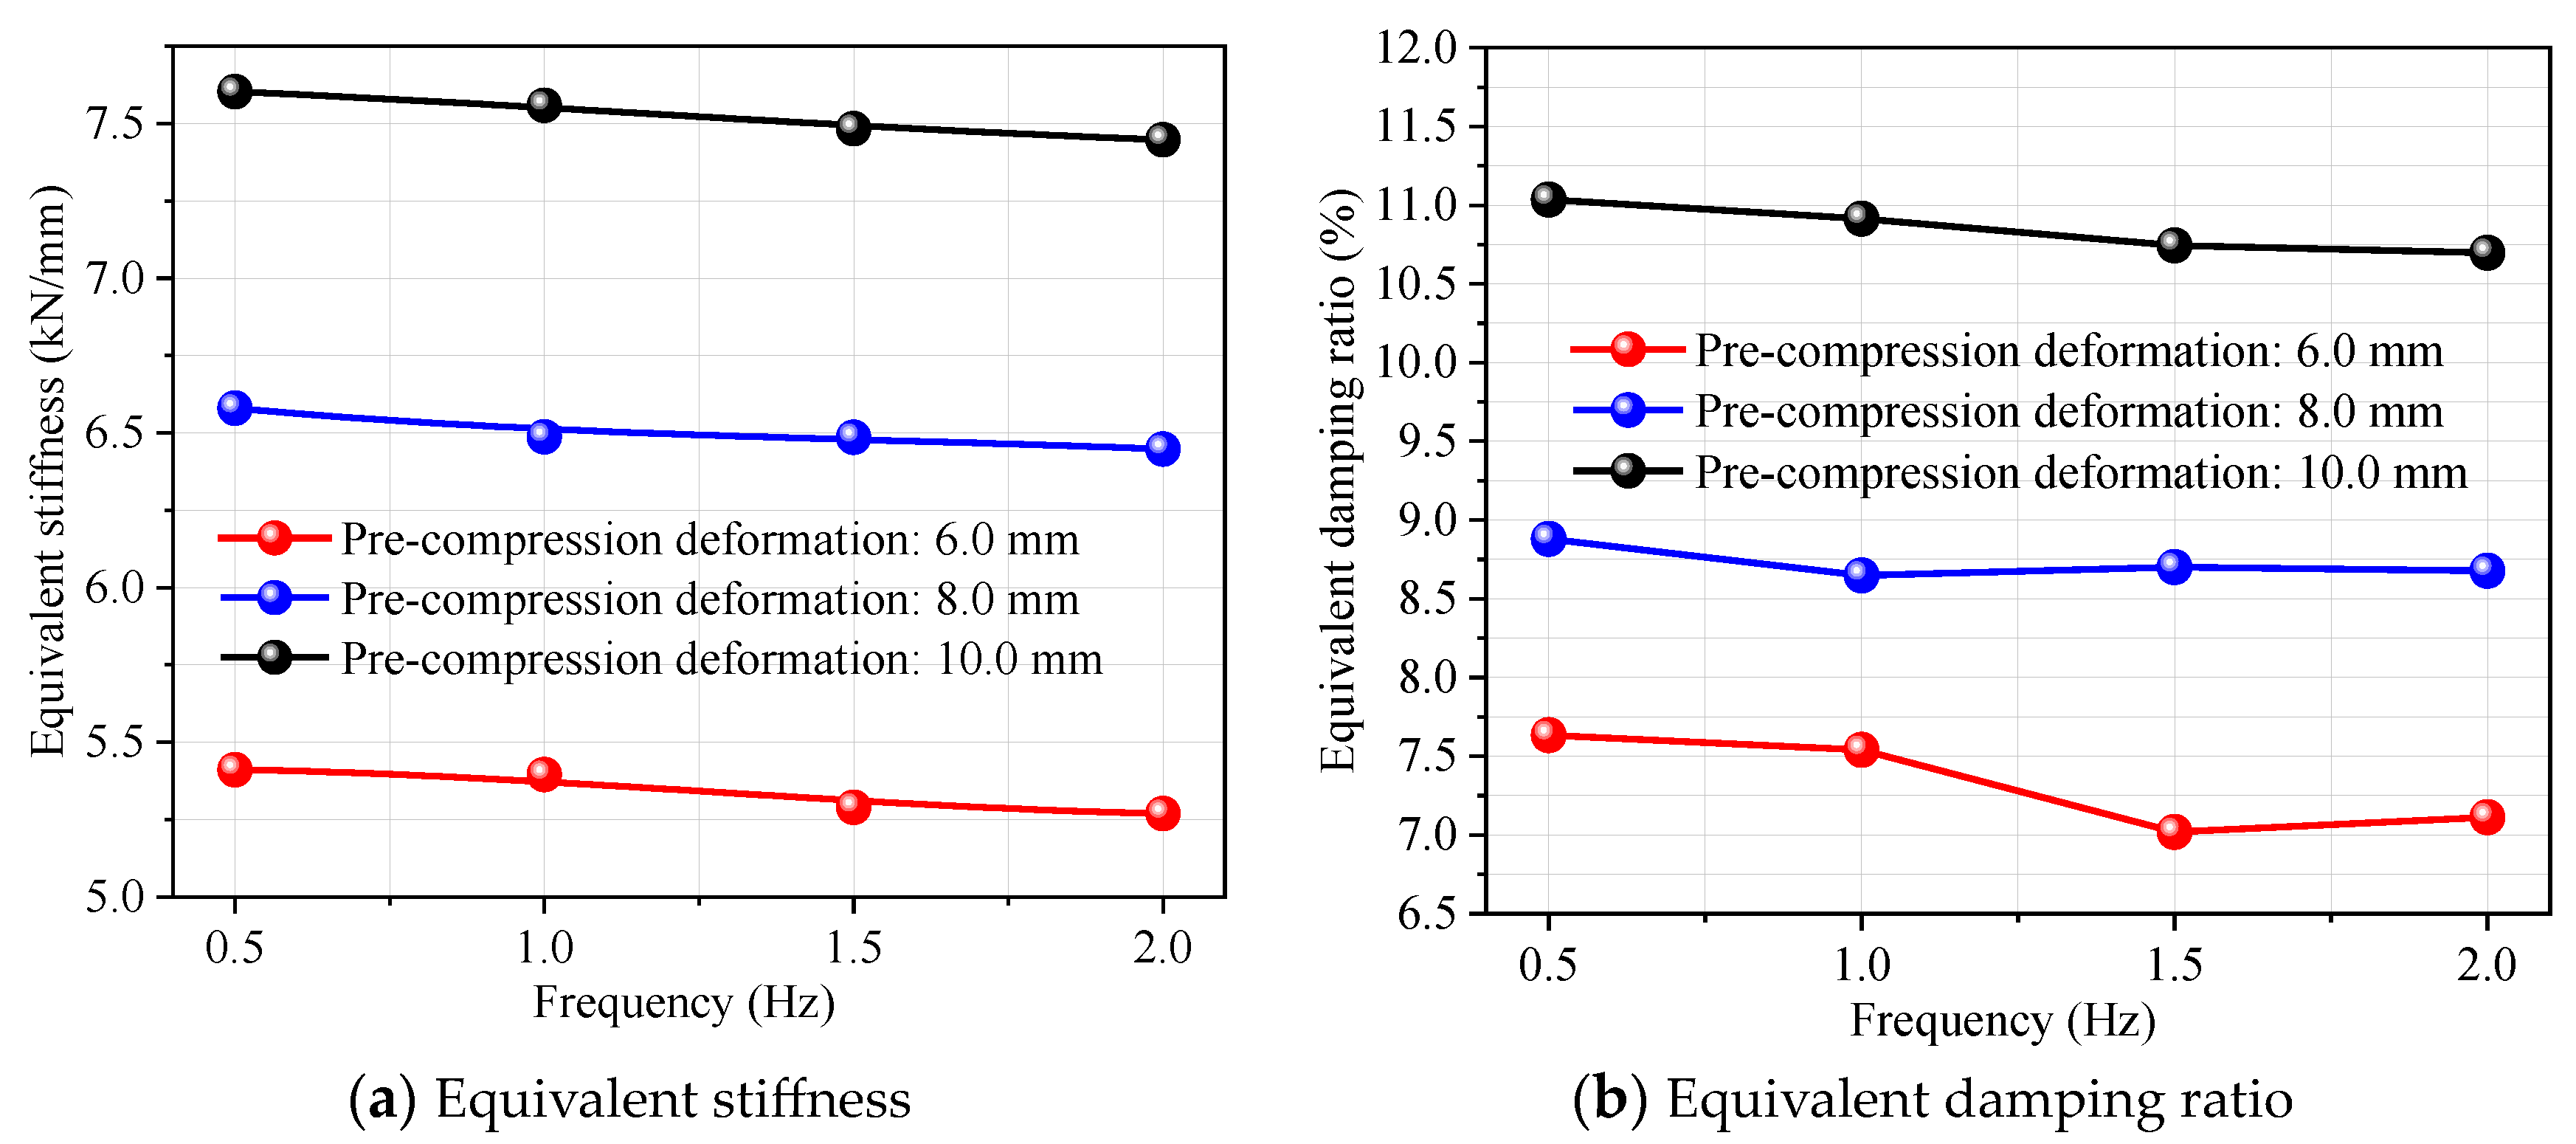
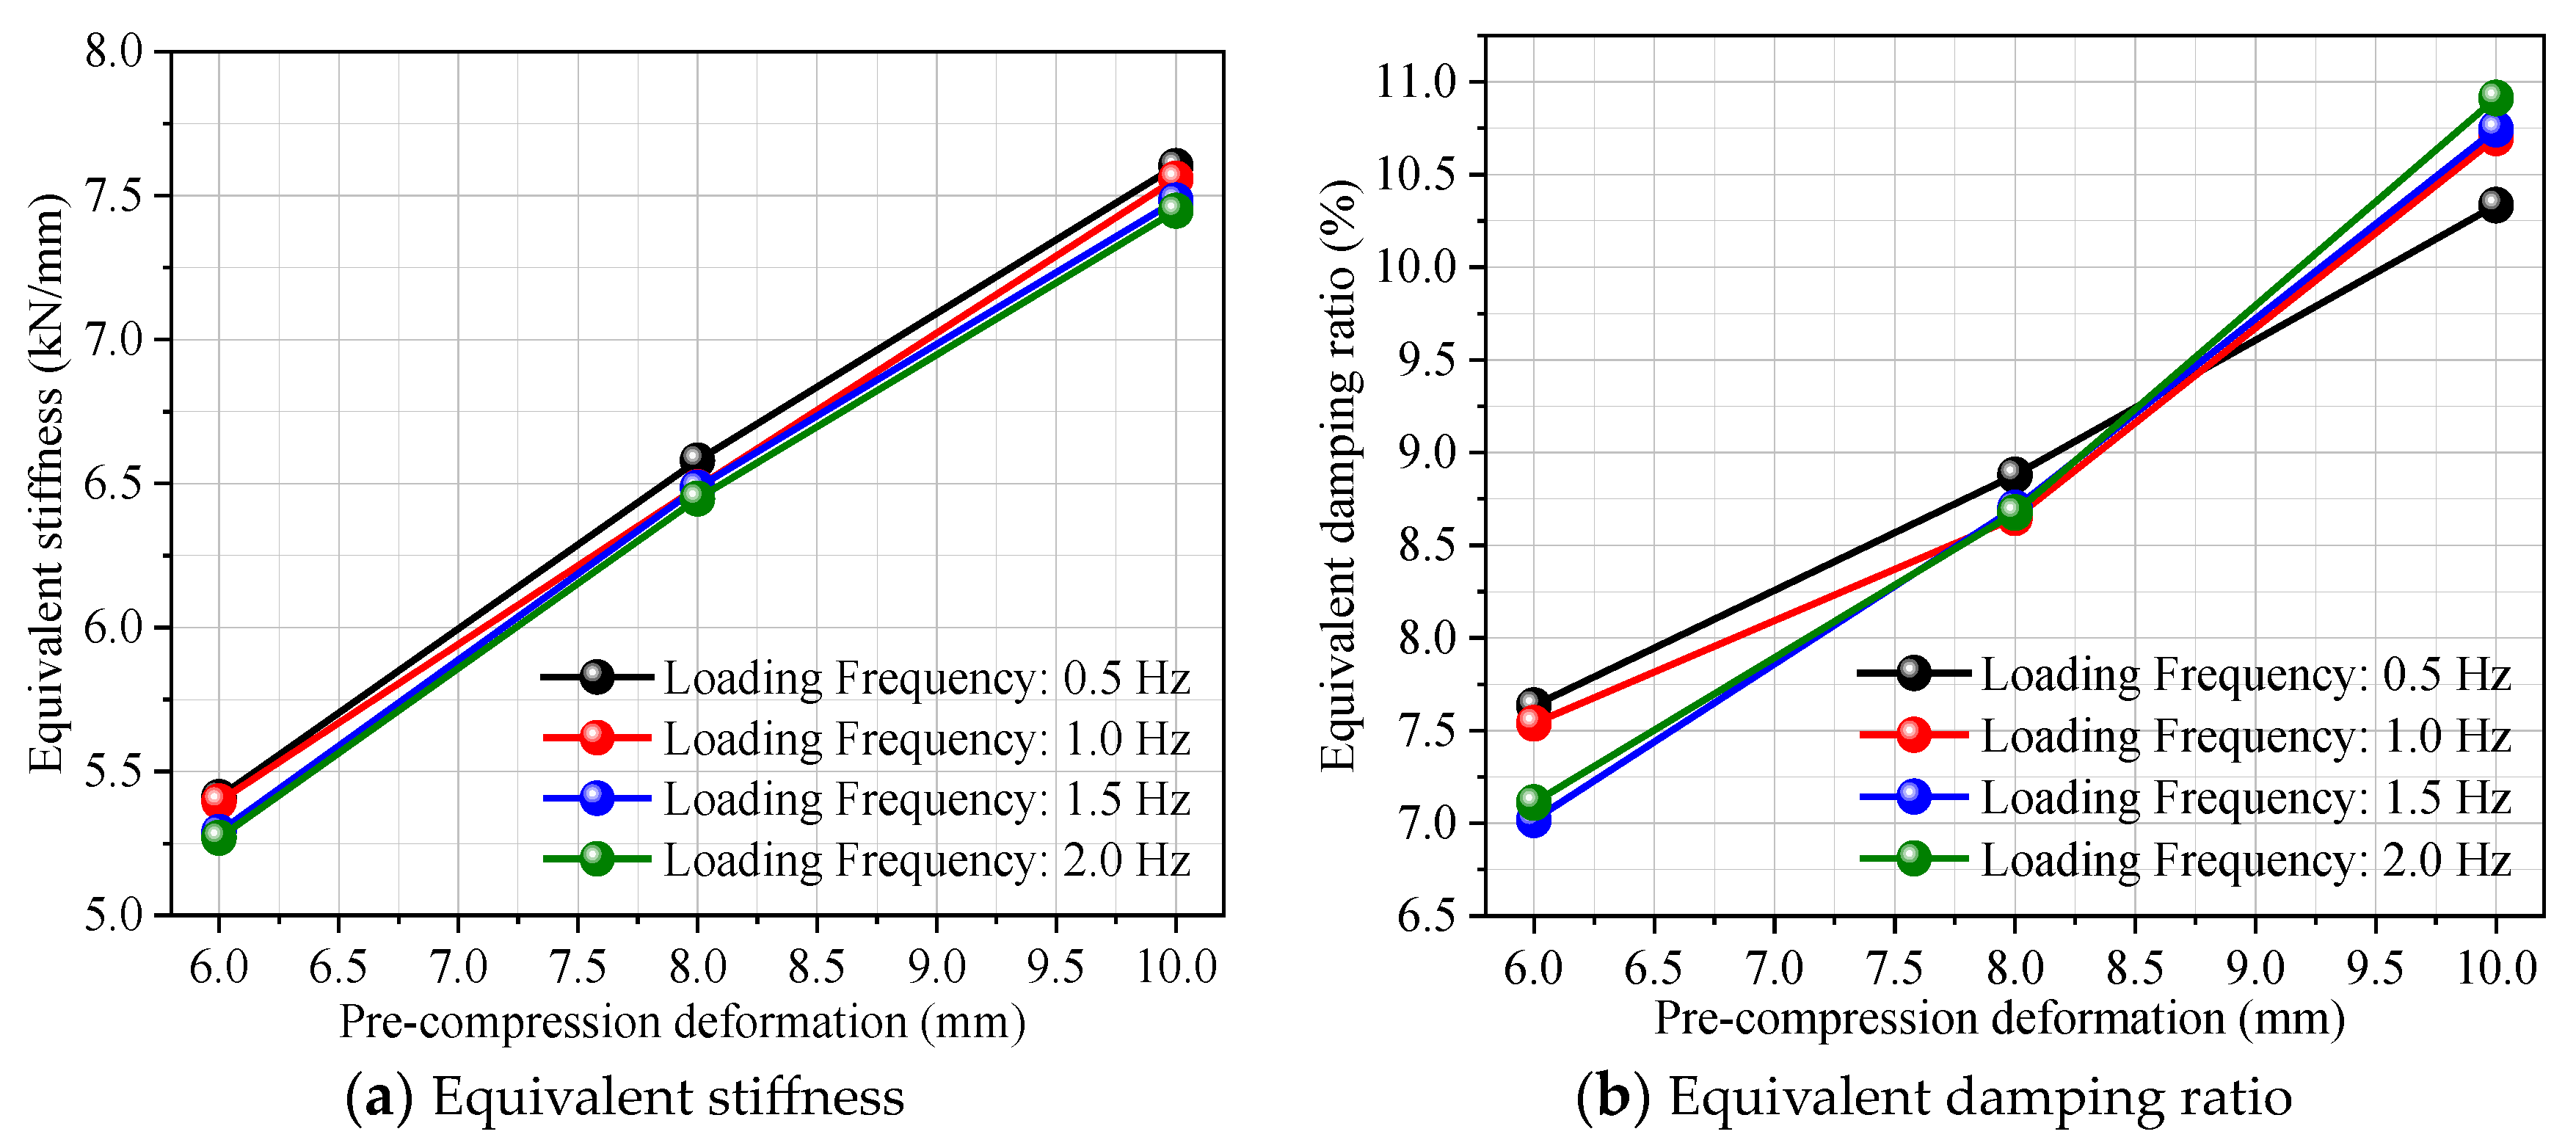
4.4.2. Result Discussion

The influence of loading frequency on the equivalent stiffness and damping ratio of the DSCCP shock absorber is shown in Figure 14. It can be seen that the loading frequency has a certain degree of influence on the equivalent stiffness and damping ratio for the shock absorber under different pre-compression deformations. As the loading frequency increases, the equivalent stiffness and equivalent damping ratio show a gradually decreasing trend, but the degree of reduction is not significant. For example, when the loading frequency increases from 0.5 Hz to 2 Hz, reductions of equivalent stiffness are 2.59%, 1.98%, and 1.97% under pre-compression deformation of 6 mm, 8 mm, and 10 mm, respectively. Correspondingly, reductions of equivalent damping ratio are 7.89%, 3.37%, and 5.31%, respectively.
Figure 15 shows the curves of the equivalent stiffness and additional damping ratio of the DSCCP shock absorber with changing of the pre-compression deformation in different loading frequencies. Figure 16 shows the force-deformation relationship curves in different pre-compression deformations. It can be observed that as the pre-compression deformation increases, the equivalent stiffness and equivalent damping ratio of the DSCCP shock absorber show a linear increasing trend. For example, under the condition of the loading frequency of 1.0 Hz, the equivalent stiffness of the shock absorber at pre-compression deformations of 6 mm, 8 mm, and 10 mm are 5.4 kN/mm, 6.5 kN/mm, and 7.6 kN/mm, respectively. Correspondingly, the equivalent damping ratios are 7.5%, 8.6%, and 10.7%, respectively. Under the conditions of the other loading frequencies, the relationships between equivalent stiffness and pre-compression deformation, equivalent damping ratio and pre-compression deformation are also similar. The reason is that the pressure between the disc springs will be increasing with the increase of pre-compression deformation, leading to an increase in Coulomb friction. Therefore, the equivalent damping ratio of the DSCCP shock absorber increases gradually.
Figure 17 shows the relationship curves between the equivalent stiffness and additional damping ratio of the DSCCP shock absorber as a function of the loading amplitude. Figure 18 shows the force–deformation relationship curves in different loading amplitudes. As shown in these figures, under the same loading frequency and pre-compression deformation, the equivalent stiffness of the DSCCP shock absorber shows a linear decreasing trend as the loading amplitude increases. When the loading frequency and pre-compression deformation are constant, as the loading amplitude increases, the equivalent damping ratio also increases. For example, the equivalent damping ratio is 9.48% for a loading amplitude of 6 mm, which increases to 14.32% for an amplitude of 10 mm, indicating that the higher the loading amplitude, the more the energy dissipation capacity of the DSCCP shock absorber.

5. Conclusions

(1)
A new vertical disc spring-cable counter pressure (DSCCP) shock absorber was proposed and validated, which has a function such that the disc spring group is always in a compression working state and causes energy dissipation, regardless of whether it is in tension or compression motion.
(2)
The friction coefficients between disc springs, and between the disc spring and cover plate, are suggested to be 0.005 and 0.3, respectively, to achieve the best agreement between numerical and theoretical results for the mechanical performance of the DSCCP shock absorber. For example, the errors of the flattening force of the DSCCP shock absorber between simulation and theory are only 4.58% under linear static loading, and 4.14% under sin-function static loading.
(3)
Under static loading, the bearing capacity of the DSCCP shock absorber shows a linear relationship with the loading displacement. The static compression and tensile results show consistent agreement with theory, simulation and experiment. Under the condition of ultimate tensile deformation, the errors between the experimental results and the theoretical and numerical results are only 4.47% and 6.56%, respectively.
(4)
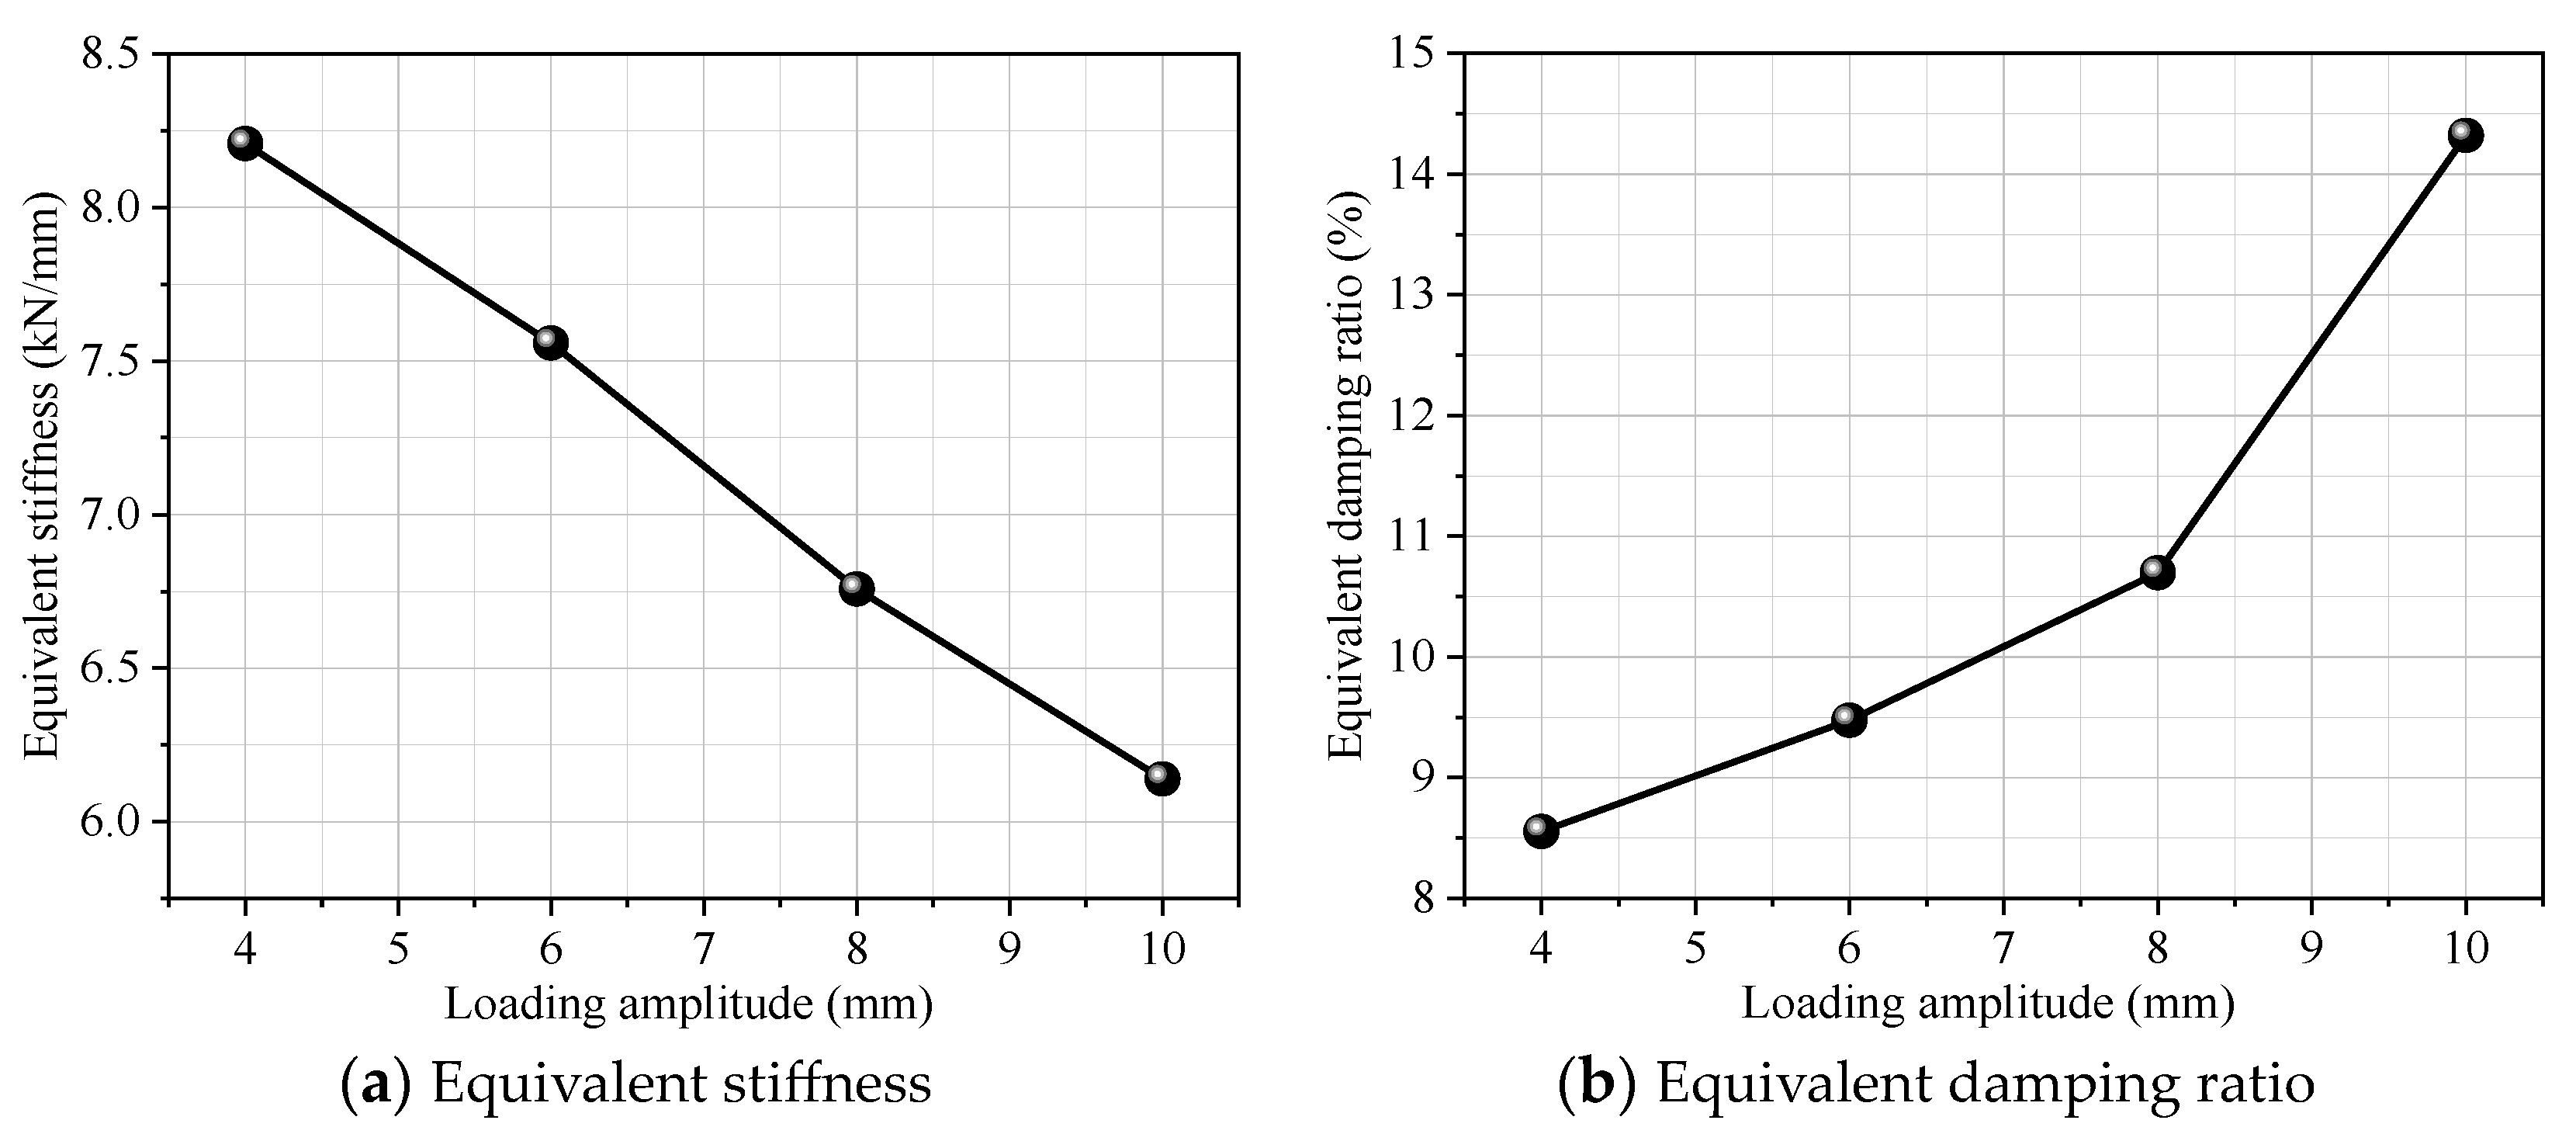
Under dynamic loading, the bearing capacity of the DSCCP shock absorber first shows a trend of slow growth, then rapid growth with the increase of loading displacement. The energy dissipation capacity of the shock absorber shows an increase with the increase of loading displacement. The minimum equivalent damping ratio of all the dynamic test cases is 7% (case 3), and the maximum is up to 15.3% (case 9).
(5)
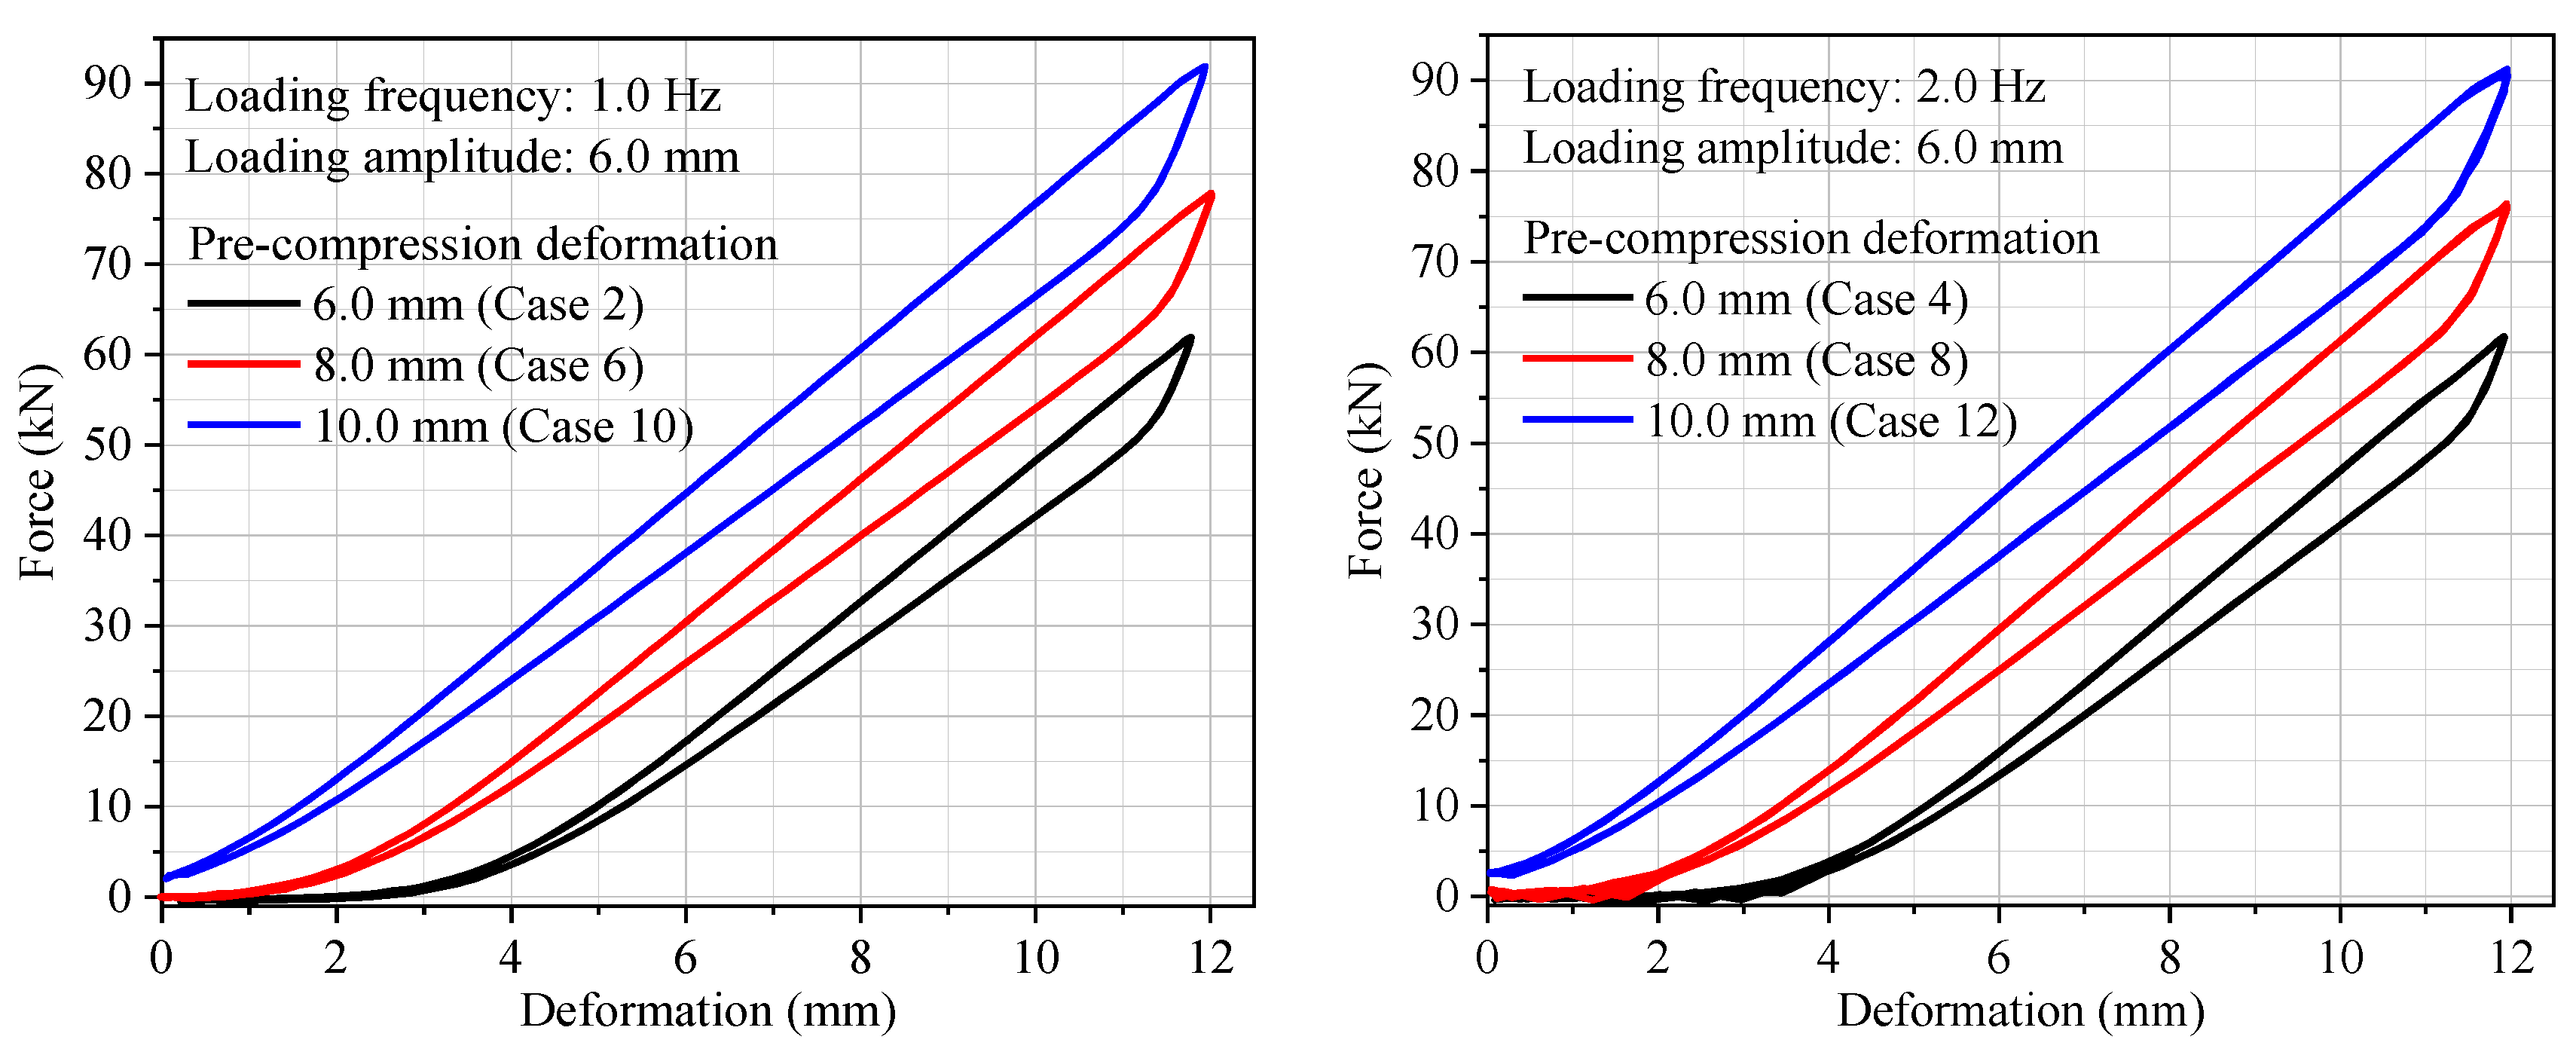
Under the same pre-compression deformation conditions, the equivalent stiffness and equivalent damping ratio of the shock absorber slowly decrease with the loading frequency, with a maximum decrease of only 2.59%. Under the same loading frequency, the equivalent stiffness and equivalent damping ratio of the shock absorber exhibit a linear and significantly increasing trend with pre-compression deformation. Under the same loading frequency and pre-compression deformation conditions, the equivalent stiffness of the shock absorber decreases continuously with the increase of loading frequency, but the equivalent damping ratio increases continuously with the loading frequency.

Author Contributions

Conceptualization, Y.W.; methodology, X.W.; investigation, S.J.; data curation, X.W. and S.J.; writing—original draft preparation, Y.W. and F.X.; writing—review and editing, D.W.; supervision, X.W.; project administration, F.X. and D.W. All authors have read and agreed to the published version of the manuscript.

Funding

This project is supported by the National Natural Science Foundation of China (52178467), and the Science and Technology Program of Guangzhou (202235058), Technology Project of China Southern Power Grid (037700KK52220039), which are gratefully acknowledged.

Institutional Review Board Statement

Not applicable.

Informed Consent Statement

Not applicable.

Data Availability Statement

Data are available upon request.

Conflicts of Interest

The authors declare no conflict of interest.

Correction Statement

This article has been published with a minor correction to the Funding statement. This change does not affect the scientific content of the article.

References

  1. Sun, Y.B.; Cao, T.J.; Xiao, Y. Full-scale steel column tests under simulated horizontal and vertical earthquake loadings. J. Constr. Steel Res. 2016, 163, 105767. [Google Scholar] [CrossRef]
  2. Ruiz-García, J. Examination of the vertical earthquake ground motion component during the September 19, 2017 (Mw = 7.1) earthquake in Mexico City. Soil Dyn. Earthq. Eng. 2018, 110, 13–17. [Google Scholar] [CrossRef]
  3. Quin, H. Dynamic stress drop and rupture dynamics of the October 15, 1979 Imperial Valley, California, earthquake. Tectonophysics 1990, 175, 93–117. [Google Scholar] [CrossRef]
  4. Trifunac, M.D.; Todorovska, M.I. Duration of strong ground motion during Northridge, California, earthquake of January 17, 1994. Soil Dyn. Earthq. Eng. 2012, 38, 119–127. [Google Scholar] [CrossRef]
  5. Chen, L.Y. Dynamical Response of High-Rise Structure under the Vertical Seismic Action; Xi’an University of Architecture and Technology: Xi’an, China, 2007. [Google Scholar]
  6. Yin, Q.; Hu, Q.G.; Li, P. The near-field seismic vertical and horizontal response spectra and design spectra. Ind. Constr. 2013, 43, 57–60. [Google Scholar]
  7. Cui, X.L. The Isolation Performance Study of a New Three-Dimensional Seismic Isolation Pier; Hunan University: Changsha, China, 2016. [Google Scholar]
  8. Hason, M.M.; Hanoon, A.N.; Abdulhameed, A.A. Particle swarm optimization technique based prediction of peak ground acceleration of Iraq’s tectonic regions. J. King Saud Univ.-Eng. Sci. 2021; in press. [Google Scholar] [CrossRef]
  9. Xin, Y.Y. Importance of the vertical seismic effect. In Proceedings of the The Second Academic Symposium on Earthquake Prevention and Disaster Reduction Engineering, Kunming, China, 3–5 December 2005. [Google Scholar]
  10. Li, X.Y.; Xue, S.D. Mechanism and Devices for 3-dimensional seismic isolation Bearing in Vertical Direetion. J. Beijing Univ. Technol. 2008, 34, 1043–1047. [Google Scholar]
  11. Han, J.P.; Zhou, W. Preliminary investigation on characteristics of vertical ground motion during Wenchuan earthquake. Eng. Mech. 2012, 29, 211–219. [Google Scholar]
  12. Zhou, W. Analysis on Seismic Performance of Reinforced Concrete Frame Structure including Vertical Ground Motion Based on Wenchuan Earthquake; Lanzhou University of Technology: Lanzhou, China, 2011. [Google Scholar]
  13. Elagamal, A.; He, L. Vertical Earthquake Ground motion records: An overview. J. Earthq. Eng. 2012, 8, 663–697. [Google Scholar] [CrossRef]
  14. Wu, D.; Tan, P. Research on vertical strong ground motion simulation of Fukuoka earthquake. J. Guangzhou Univ. 2013, 12, 40–43. [Google Scholar]
  15. Dang, Y.; Huo, K.C. Vertical earthquake response of multi-storey isolated buildings. J. Earthq. Eng. Eng. 2010, 30, 139–145. [Google Scholar]
  16. He, Z.J.; Ding, J.M.; Lu, T.T. Vertical earthquake action analysis for mega frame-core tube structure of the Shanghai Tower. J. Build. Struct. 2014, 35, 27–33. [Google Scholar]
  17. Li, Y. Research on Seismic Behavior of Piers Considering Vertical Earthquake Force; Chang’an University: Xi’an, China, 2015. [Google Scholar]
  18. Castiglioni, C.A.; Kanyılmaz, A. Vertical Seismic Isolation of Ancient Statues Displayed in Base Isolated Museum Buildings. In Proceedings of the XIV European Conference on Earthquake Engineering, Ohrid, North Macedonia, 30 August–3 September 2010. [Google Scholar]
  19. Zhou, Z.G.; Sun, C.X. Seismic response analysis of Fukushima nuclear power plants under the 2011 Great Eastern Japan Earthquake. J. Earthq. Eng. Eng. Vib. 2016, 1, 8–15. [Google Scholar]
  20. Ma, L.; Shi, Q.; Wang, B.; Tao, Y.; Wang, P. Research on design and numerical simulation of self-centering prefabricated RC beam-column joint with pre-pressed disc spring devices. Soil Dyn. Earthq. Eng. 2023, 166, 107762. [Google Scholar] [CrossRef]
  21. Chou, C.C.; Chung, P.T. Development of cross-anchored dual-core self-centering braces for seismic resistance. J. Constr. Steel Res. 2014, 101, 19–32. [Google Scholar] [CrossRef]
  22. Xiao, F. Design of New Type Three-Dimensional Seismic Isolation Device and Application Study in Ancient Timber Structure; Guangzhou University: Guangzhou, China, 2018. [Google Scholar]
  23. Almen, J.O.; Laszlo, A. The uniform-section disk spring. Trans. Am. Soc. Mech. Eng. 1936, 58, 305–314. [Google Scholar] [CrossRef]
  24. Zheng, L.J. Study on Theoretical Analysis and Numerical Simulation of the Load in Conical Disk Springs. Mach. Des. Manuf. Eng. 2002, 31, 12–13. [Google Scholar]
  25. Zhang, T.S. Discuss on Assumptions of the Almen-Laszlo Equation for Diaphragm Spring. Automob. Technol. 2003, 12, 12–14. [Google Scholar]
  26. Ozaki, S.; Tsuda, K.; Tominaga, J. Analyses of static and dynamic behavior of coned disk springs: Effects of friction boundaries. Thin-Walled Struct. 2012, 59, 132–143. [Google Scholar] [CrossRef]
  27. Sun, L.M.; Wang, X.B.; Shi, L. Research on stiffness of combination disk spring. J. Zhengzhou Univ. 2007, 28, 120–123, 127. [Google Scholar]
  28. Fawazi, N.; Lee, J.Y. An improved load-displacement prediction for a coned disc spring using the energy method. ARPN J. Eng. Appl. Sci. 2016, 11, 833–836. [Google Scholar]
  29. Xu, L.H.; Fan, X.W.; Li, Z.X. Development and experimental verification of a prepressed spring self-centering energy dis-sipation brace. Eng. Struct. 2016, 127, 49–61. [Google Scholar] [CrossRef]
  30. Noureldin, M.; Memon, S.A.; Gharagoz, M.; Kim, J. Performance-based seismic retrofit of RC structures using concentric braced frames equipped with friction dampers and disc springs. Eng. Struct. 2021, 243, 112555. [Google Scholar] [CrossRef]
  31. Dong, H.H.; Du, X.L.; Han, Q.; Hao, H.; Bi, K.M.; Wang, X.Q. Performance of an innovative self-centering buckling restrained brace for mitigating seismic responses, of bridge structures with double column piers. Eng. Struct. 2017, 148, 47–62. [Google Scholar] [CrossRef]
  32. Fan, X.W.; Xu, L.H.; Li, Z.X. Seismic performance evaluation of steel frames with pre-pressed spring self-centering braces. J. Constr. Steel Res. 2019, 162, 105761. [Google Scholar] [CrossRef]
  33. Carrella, A.; Brennan, M.; Waters, T. Static analysis of a passive vibration isolator with quasi-zero-stiffness characteristic. J. Sound Vib. 2007, 301, 678–689. [Google Scholar] [CrossRef]
  34. Kovacic, I.; Brennan, M.J.; Waters, T.P. A study of a nonlinear vibration isolator with a quasi-zero stiffness characteristic. J. Sound Vib. 2008, 315, 700–711. [Google Scholar] [CrossRef]
  35. João, G.; Luís, G.; Seyedsajjad, H.; Rita, M.; João, G.F. The Design of a Structural Hy-per-Resisting Element for Life-Threatening Earthquake Risk (SHELTER) for Building Collapse Scenarios: The Safety Chairs. Appl. Sci. 2022, 12, 4103. [Google Scholar]
  36. Wang, X.B. A Study on the Mechanical Properties of Disc Springs; Zhengzhou University: Zhengzhou, China, 2007. [Google Scholar]
  37. Cai, Y. Test Research of Disc Spring Vertical Isolation Device; Guangzhou University: Guangzhou, China, 2012. [Google Scholar]
Figure 1. Construction of the DSCCP vertical shock absorber.
Applsci 13 08718 g001
Figure 2. Loading and unloading curves obtained by theoretical calculation.
Applsci 13 08718 g002
Figure 3. Sketch of disc spring.
Applsci 13 08718 g003
Figure 4. Finite element model.
Applsci 13 08718 g004
Figure 5. Static loading.
Applsci 13 08718 g005
Figure 6. Relationship between force and deformation under sin-function loading.
Applsci 13 08718 g006
Figure 7. Load–displacement relationship curves under static loadings.
Applsci 13 08718 g007
Figure 8. Stress contours of the profile and top plan under deformation of 33.6 mm and 44.8 mm.
Applsci 13 08718 g008aApplsci 13 08718 g008b
Figure 9. Design and physical drawings of the shock absorber.
Applsci 13 08718 g009aApplsci 13 08718 g009b
Figure 10. Loading schematic of DSCCP shock absorber.
Applsci 13 08718 g010
Figure 11. Dynamic loading schematic.
Applsci 13 08718 g011
Figure 12. Force–deformation curves under static loading.
Applsci 13 08718 g012
Figure 13. Force–deformation relationship curves.
Applsci 13 08718 g013
Figure 14. Influence of loading frequency on equivalent stiffness and damping ratio.
Applsci 13 08718 g014
Figure 15. Influence of pre-compression deformation on equivalent stiffness and damping ratio.
Applsci 13 08718 g015
Figure 16. Force-deformation relationship curves in different pre-compression deformations.
Applsci 13 08718 g016
Figure 17. Influence of loading amplitude on equivalent stiffness and damping ratio.
Applsci 13 08718 g017
Figure 18. Force–deformation relationship curves in different loading amplitudes.
Applsci 13 08718 g018
Table 1. General parameters of the DSCCP shock absorber.
D (mm)d (mm)t (mm)h0 (mm)H0 (mm)F = 0.75h0
f (mm)F (kN)σII/σIII (N/mm2)
250127145.619.64.22491220
Table 2. Flattening force comparisons for DSCCP shock absorber with different friction coefficient μ2.
Loading
Type
μ1μ2Maximum DeformationNumerical Simulation
I (kN)
Theoretical Calculation
II (kN)
Error
|(I − II)/I| × 100%
Linear
loading
0.0050.244.8 mm72764711.01%
0.344.8 mm6786474.58%
0.444.8 mm6856475.48%
0.544.8 mm73264711.60%
0.644.8 mm73664712.05%
Sin-function
loading
0.0050.244.8 mm6706473.33%
0.344.8 mm6756474.14%
0.444.8 mm6816475.04%
0.544.8 mm6886475.97%
0.644.8 mm6966477.51%
Table 3. Flattening force comparison between numerical simulation and theoretical calculation.
Loading
Type
μ1μ2Maximum
Deformation
Numerical
Simulation/I
Theoretical
Calculation/II
Error
|(I − II)/I| × 100%
Linear
loading
0.0050.344.8 mm643,225 N647,028 N0.59%
Sin-function
loading
0.0050.344.8 mm635,456 N647,028 N1.82%
Table 4. Parameters of the disc spring used in the test specimen.
Outer Diameter
D (mm)
Inner Diameter
d (mm)
Thickness
t (mm)
Free Height
h0 (mm)
Total Height
H0 (mm)
Deformation f = 0.75h0
f (mm)F (kN)σII or σIIIc (N/mm2)
1407283.211.22.475.31280
Table 5. Cases of the dynamic loading.
CasePre-Compression Deformation/mmLoading Frequency/HzLoading Amplitude/mm
1~46.00.5/1.0/1.5/2.06.0
5~88.00.5/1.0/1.5/2.06.0
9~1210.00.5/1.0/1.5/2.06.0
13~1510.01.04.0/8.0/10.0
Table 6. Comparison of the force of the DSCCP shock absorber among test, simulation and theory.
LoadingItemsTheorySimulationTestError
IV = (I − III)/I × 100%
Error
V=(II − III)/II × 100%
Static compression
test
f = 0.75h024 mm24 mm24 mm00
P (0.75h0)171 kN171 kN178 kN−3.82%−4.21%
f = h032 mm32 mm32 mm00
P (h0)223 kN249 kN227 kN−1.77%8.97%
Static tension testf = 0.75h024 mm24 mm24 mm00
P (0.75h0)171 kN171 kN183 kN−7.32%−7.73%
f = h032 mm32 mm32 mm00
P (h0)223 kN249 kN232 kN−4.47%6.56%
Table 7. Comparison results of equivalent stiffness and equivalent damping ratio.
CaseFrequency
(Hz)
Equivalent Stiffness
(kN/mm)
Error
(I − II)/I × 100%
Equivalent Damping RatioError (III − IV)/III × 100%
Test/ISimulation/IITest/IIISimulation/IV
10.55.415.115.55%0.0760.0751.32%
215.45.360.74%0.0750.077−2.67%
31.55.295.290.00%0.070.075−7.14%
425.275.270.00%0.0710.078−9.86%
50.56.586.550.46%0.0890.0863.37%
616.496.283.24%0.0860.091−5.81%
71.56.496.115.86%0.0870.09−3.45%
826.456.016.82%0.0870.091−4.60%
90.57.67.63−0.39%0.1530.158−3.27%
1017.567.392.25%0.1070.16.54%
111.57.487.213.61%0.1070.1015.61%
1227.457.193.49%0.1090.1080.92%
1318.218.071.71%0.0860.0789.30%
1416.766.750.15%0.1070.112−4.67%
1516.146.120.33%0.1430.1346.29%
Disclaimer/Publisher’s Note: The statements, opinions and data contained in all publications are solely those of the individual author(s) and contributor(s) and not of MDPI and/or the editor(s). MDPI and/or the editor(s) disclaim responsibility for any injury to people or property resulting from any ideas, methods, instructions or products referred to in the content.

