1. Introduction
In the face of climate change, one of the key design aspects is related to the development of energy-saving technologies, as they form an important stage in achieving sustainable development and have a positive effect on the human environment. Therefore, scientific research and research and development in this area form a necessity. The areas taken into account in such processes should include adequate planning of production processes, minimization of material losses, as well as the introduction of innovative technologies that can offer effective and economical use of natural resources.
The application of a magnetic field for the purposes of activating substances offers an enhancement in various processes in technology and leads to increasing energy efficiency of these processes. Scientific research carried out in this area demonstrates that minimal energy losses can be achieved as a result of the design of devices that include the conversion of the energy of an electromagnetic field directly into kinetic energy of ferromagnetic bodies. This method of energy conversion is applied, for example, in devices that use methods of comminution of materials by application of millstones in their working chambers (WC). Electromagnetic mills (EMMs) are a good example of such devices. Nowadays, in spite of their potential, EMMs are not yet applied on a mass scale. They perform their function by utilizing a rotating magnetic field and moving ferromagnetic bodies (millstones) in the WC of the mill which ensures low energy losses. Mechanical interaction between those bodies and the milled substance (WS) results in grinding and mixing of the substances [
1,
2,
3,
4].
Currently, EMMs are applied not only for grinding and mixing solids, but also for emulsifying liquids and mixing gases, obtaining aerosols and increasing chemical activity of solid particles through their grinding in impact or abrasive mode.
We can also note certain advantages of EMMs when they are compared to the traditional mill mode, especially in terms of better efficiency, greater accuracy and flexibility in controlling the grinding process [
5,
6].
The analysis of experimental research into EMMs revealed a few problems previously discussed in publications, in particular:
Establishing the impact of different external factors on the distribution of WS particles depending on the size and finding optimal conditions for achieving the preferred granulometric composition of the ground substance [
7,
8,
9];
Comparison of wet and dry grinding in an EMM with different grinding process parameters, such as grinding time, WS volume, WS particle size, thickness of the suspension, etc. [
10,
11].
Comparison of efficiency indicators of an EMM and a traditional ball mill, taking into consideration the fractions of the obtained ground substance [
12].
The particle size in grinding result samples is measured using a laser diffraction method or by digital image recognition systems [
13]. The authors of [
7,
10,
11] introduce indicators showcasing the efficiency of the grinding process.
Research has also been conducted to design EMMs using specific efficiency indicators. The technological process structure and the control system have been developed, which allow for automation of the grinding process and the classification of the end product on the basis of various criteria [
11,
14]. Specialized mathematical models for calculation of an optimal ratio of the air transport streams of working substance, which are constantly delivered to the WC in order to obtain desired ground product particle distribution for their size, are also processed [
5].
Another area of EMM research is related to its thermal state [
15,
16]. The authors of [
17] present a method of analysis of EMM thermal processes, which uses the thermal equivalent (TEC) of the active area of an EMM.
The latest research also focuses on the use of EMMs in increasing the rate of mechanochemical reactions in solids [
1,
2,
18].
However, only a few publications attempt to establish a relation between EMM design indicators, such as size and inductor winding data, the magnetic properties of the core material and the ground substance and its efficiency indicators. The manner applied to determine this relation is outlined in detail in earlier publications [
19,
20]. The results of such research are not confirmed by experiments and require additional verification.
The objective in the research was to develop an original method applicable for quantitative assessment of the efficiency and quality of EMM performance. This method can be utilized for optimizing design parameters (dimensions, winding data, etc.) and technology-based indicators of the grinding process (mass of substance, mass of millstones, grinding time, etc.).
2. Problem Statement
The analysis of the EMM research literature demonstrates that progress has been achieved in the areas related to solving problems of identifying the operation mode of mills, quantitative assessment of their energy efficiency, and in developing control systems that allow for accurate adjustment of the operation mode to various external factors in real time. However, establishing a deterministic relation between EMM design indicators and its efficiency indicators remains an unsolved problem. In order to formulate such indicators, the efficiency and quality of grinding were considered.
The EMM efficiency is the ratio of WS ground mass
to the time the process took
[kg/s]
The quality of the grinding is the ratio of the mass of smallest fraction of the WS
to the total ground WS mass
, expressed in relative units
A WS is considered to be ground when the average size of its molecules has been reduced in comparison with the smallest particles of the substance that did not undergo grinding.
A mathematical model has been developed for calculation of trajectories of ferromagnetic millstones moving in a rotating magnetic field under the electrodynamic and hydrodynamic resistance forces [
19]. Processing of the results of this modeling shows the average number of millstone impacts and their impulse in a particular period. Such values cannot be directly applied for evaluation, although they demonstrate the effectiveness of the grinding process, according to (1) and (2).
The aim of this study was to determine the effect of variations in the calculation parameters of the grinding process of calcium carbonate derived from the WKG Sp. z o. o. in Raciszyn, determined by means of mathematical modeling on EMM efficiency indicators obtained in an experimental manner. The dimensions, winding data, magnetic properties of materials, grinding time, mass of millstones and WS were taken into account.
Achieving such a goal will offer the possibility to apply the results in predicting indicators of EMM performance already at the design stage. This may be converted into a decrease in the production costs of aggregates of various fractions. The highest costs result from the process of drying and grinding the material, which has a significant impact on the energy efficiency of grinding [
21].
3. Laboratory Setup Description
The experiment described in this paper was conducted at a laboratory setup provided by the company MEGATECH Zbigniew Gałuszkiewicz. It comprises an EMM with a rotating magnetic field and a WC with a diameter of 120 mm, power supply with a reactive power compensation system, a cooling system and equipment for separation and weighing of ground products (
Figure 1). The EMM was energized with a three-phase alternating voltage of 130 V and a frequency of 50 Hz. The value of the phase current was 150 A, and the value of the magnetic induction in the center of the WC was 0.15 T.
The EMM contains a rotating magnetic field inductor and a working chamber, into which ferromagnetic millstones and the working substance are deposited.
The EMM inductor comprises a core and winding. The core is made out of sheets of electrotechnical M600-50A steel with a thickness of 0.5 mm, insulated on both sides with lacquered foil. The sheets are glued together into a bundle, creating a cylindrical magnetic circuit with six indentations into which a three-phase bipolar winding was placed. The phase coils are made out of copper tubing with external diameter of 8 mm and wall thickness of 1 mm.
Inductor and the winding are contained in a textolite case and impregnated with a thermally conductive insulating lacquer.
An electrical diagram of the EMM is displayed in
Figure 2.
In order to compensate for reactive power drawn from the grid by the EMM, the laboratory station is equipped with a capacitor bank with a sufficient capacity.
4. Analysis of Results of the Experiment
The experimental study primarily focused on the quantitative analysis of the relation between a set of technological indicators of the grinding process and its efficiency. An experiment forms the most suitable way of verifying the validity of the assumptions that were utilized and to verify the results of the mathematical modeling of the dynamic process inside the working chamber of the mill based on a two-dimensional approach to the process.
A natural mineral, calcium carbonate (CaCO3) was identified as the grinding medium. Its average density is 2540 kg/m3 and hardness on the Mohs scale is 4.3 ÷ 4.5. Particles of this material had the average size of 2 ÷ 5 mm before grinding.
A four-dimensional space of the experiment factors was established, namely: —grinding duration; —millstone diameter; —millstone mass; —grinding substance mass.
Discreet values of those factors are: = 60 s, 120 s, 180 s, 240 s, 300 s, 360 s, 420 s; = 2 mm, 3 mm, 4 mm (the ratio of the mill length to its diameter was 10 in all cases); = 50 g, 100 g, 200 g, 400 g, 800 g; = 50 g, 100 g, 200 g, 400 g, 600 g.
On the basis of those values, research was conducted in a 22-step plan of the experiment. The obtained results (including the mass of the fractions of ground WS and mass of the unground leftovers) are presented in
Table 1. Measurements no. 1 to 7 demonstrate quantitative variations of the individual fractions depending on the duration of the grinding process in the conditions of constant ratios of millstones and ground substance for a 2:1 ratio of ground substance to millstones. In experiments no. 8 to 10, the dependence of the distribution of masses in individual fractions in relation to the dimensions of the millstones was examined for a constant grinding time equal to 420 s and for a constant ratio of ground mass and millstones of 2:1. Experiments no. 11 to 16 indicate the dependence of the mass distribution in individual fractions on the number of millstones and their size at a constant mass of ground substance and grinding time. Experiments no. 17 to 22 examined the dependence of the mass distribution in individual fractions on the amount of the ground substance and the dimensions of the millstones at a constant mass of millstones and grinding time.
Figure 3 shows the distribution of the WS fraction recorded after experiment no. 10 in an illustrative form (
Table 1). It presents the distribution of WS fraction prior to grinding (fraction 2 ÷ 5 mm, weight 400 g) and individual fractions after grinding: fraction > 2 mm, weight 72 g; fraction 1 ÷ 2 mm, weight 22 g; fraction 0.5 ÷ 1 mm, weight 11 g; fraction 0.25 ÷ 0.5 mm, weight 56 g; fraction < 0.25 mm, weight 239 g. A set of sieves presented in
Figure 1c was used for the selection of the mentioned fractions.
The obtained experiment results are non-deterministic. In order to analytically describe this particular set of results regression analysis was utilized, which is used on functions defined by tables (TF). It represents the dependence of the field of the electrodynamic force acting on the grinding medium in the center of WC, on parameters such as the phase φ of the resultant EMM of the inductor winding, the length of the radius of the location of the center of mass of the grinding medium and inclination angle of this radius .
In order to approximate each particular table function, an analytical expression describing the function is used, for a function closest to the TF giving its properties (power polynomials, trigonometric polynomials, elementary or special functions). However, in this case (TF
Table 1), no information for any such function exists; therefore, power polynomials are commonly utilized. For a TF with one or more independent variables, a Taylor series forms the most appropriate one. The regression formula was expressed as a Taylor series with four squared variables.
The least squares method was used to calculate the regression parameters.
The sum of squares of deviations of a dependent variable value (3) from the experimental values in a set of plan points is defined by the formula:
The value Δ is a function of regression parameters
. By comparing partial derivatives of this function to zero, respectively, through variables
, an algebraic system of equations (ASE) was obtained in the form:
Regression Equation (3) in vector form is:
where
denotes row of Taylor series of degree II with 4 independent variables;
is regression parameter column.
ASE (5) utilizing designations (7), (8) can be expressed as
or
where
denotes value of a Taylor pair in the
n-th plan point.
To calculate regression parameters
(6) of the TF it is necessary to define a linear ASE (10), based on the data in
Table 1 and to solve it numerically. The value of function
in this TF is the total mass of the ground WS
.
For the purposes of the quantitative analysis of the impact of factors and their mutual effect on the course of the function, a linear transformation of the factor space was conducted. Tabulated values of the TF argument vector elements were normalized to values in range of 0 ÷ 1, using the formula:
where
—tabulated argument value;
—maximum value of this argument.
For a normalized vector argument, the regression coefficients
are presented in
Table 2.
On the basis of an analysis of these coefficients, it is clear that it is impossible to reduce the number of the polynomial components without a loss of the accuracy of approximation, since all the values are of the same order of magnitude.
Figure 4 shows obtained relations of total ground substance mass and all factors in a particular factor of the experiment, and also for deviations of those factors of values obtained in the experiment. Red ‘x’-s in the figure mark undetermined function values obtained directly from the experiment (
Table 1).
The curves presented in
Figure 4 indicate a good correlation between the measurement points (‘x’) and the interpolated waveforms.
Figure 4a shows the dependence of the volume of ground mass on the grinding time. The initial, almost linear growth is transformed into a saturation state, which is characterized by a lower efficiency of the grinding process.
Figure 4b shows the dependence of the resulting ground mass on the millstone diameter. The waveforms show that the diameter equal to approximately 4 mm forms the most beneficial diameter of the grinding medium in the tested environmental conditions.
Figure 4c shows the dependence of the ground mass of the substance on the mass of millstones at constant grinding time. From the waveforms obtained, the 2:1 ratio proved to be most effective, i.e., the mass of the millstones is two times lower than the mass of the ground substance.
Figure 4d shows the dependence of the ground mass on the initial mass of the ground substance. These relations demonstrate that grinding 50% of the initial mass of the ground substance for a grinding medium with a diameter of 2 mm is the most effective. On the other hand, for millstones with a diameter of 3 mm, approximately 60%, and for millstones with a diameter of 4 mm, this figure is approximately 70%. This confirms that the use of millstones with a diameter of 4 mm can prove to be the most effective. On this basis, we can conclude that by changing the grinding parameters (diameter of millstones, number of millstones and their initial mass WS), it is possible to achieve the planned grinding results, for example, the maximum mass of the ground substance while high efficiency of the grinding process is maintained.
5. Mathematical Model of the Grinding Process
The mathematical model for studying the dynamics of the mix of millstones and WS particles is composed of two connected subsystems. The first one is the subsystem of creating a TF, which approximates the fields of electrodynamic forces and torques affecting the ferromagnetic millstone in a rotating magnetic field described in detail in an earlier study [
22]. The second involves the calculation of the trajectories of the millstone and WS particles moving in the WC of the EMM under the influence of aforementioned forces defined in the first subsystem described already in a study reported in [
19].
Defining the fields of forces and torques depending on the phase angle of the vector of the resultant magnetomotive force (MMF) of the inductor winding φ, length and angle of inclination of the position vector of the center of the mass of each millstone in the working chamber was performed using a two-dimensional finite element method analysis.
The force acting on the millstones was calculated using the rule of calculating work with a possible ‘virtual’ movement (a virtual work method [
23]). The derivative of magnetic field energy in a possible ‘virtual’ movement in any direction was calculated. Those calculations were performed for the layer of finite elements at the border separating the millstones from the environment. The vector of this force is equal to
where
—force acting in direction s;
—magnetic field induction;
—derivative of field intensity over movement s;
s—virtual movement in nodal coordinates (subsequently for x, y);
V—finite element volume.
For a two-dimensional task, the electromagnetic torque around axis +z was defined as:
Based on (13), (14) the TF with three independent variables
were generated, for modulus of force
, acting upon a ferromagnetic millstone in a magnetic field, direction of that force
and torque
. The force is applied to the center of mass of the millstone. The torque acts upon the millstone relative to the axis passing through its center of mass perpendicular to the calculation plane. A graph representing those relations in relation to variable
for millstones with a diameter of 4 mm is presented in
Figure 5. The dimensions of forces and torques in these graphs are expressed in [N/m] and [Nm/m], which results from the two-dimensional formulation of the field problem solved by FEM analysis.
Figure 5a presents the courses representing the variability of the dependence between the force vector modulus
and the angular position of the grinding medium for different values of the phase MMF
φ. The courses show three maxima for the millstones angles close to 0°, 120° and 240°. The first maximum for the angle of the millstones along the line of the MMF (
φ = 0°) generates the largest value of the force modulus
, whereas the smallest value
is generated by the millstones inclined at an angle of 216° in relation to the MMF vector.
Figure 5b shows graphs of the dependence between the direction of the force
, and the angular position of the grinding medium for different values of the MMF phase
φ. These graphs indicate the correlations of the maximum deviation of the direction of the force acting on the grinding medium for the vectors
φ equal to 0°, 216° and 288° at the angular position of the grinding medium equal to 60°. This correlation does not keep the same form over the later part of the course. For the remaining millstone orientations, such a correlation can no longer be recorded, as the variability of
φ and the variability of the grinding medium position are variable due to the adjacent millstones and the MMF phase change
φ.
Figure 5c shows the variability of the relation between the moment
and the angular position of the grinding medium for different values of the MMF phase
φ. The courses show qualitative convergence for angles
φ equal to 216° and 288°. The correlation is consistent for different angular millstones positions in a very wide range from 0° to 360°. A similar correlation occurs for angles
φ equal to 72° and 144°, but in a smaller range of the angular position of the grinding medium from approximately 140° to 360°.
The calculation of the trajectories of the millstones was performed based on the FEM analysis of a dynamic system, which is a two-dimensional cross-section of the mill working chamber filled with a system of millstones and WS particles of a specified size. Ferromagnetic media act under the influence of electrodynamic forces, projections of which at every step of integration are defined by TF interpolation
,
and
at every step of integration. The displacement of all the elements of such a system is considered to be flat. The mathematical formulation of the problem of calculating the trajectories of the elements of such a system is as follows:
where
,
,
—coordinates of the center of mass and the angular position of the body (millstone or WS particle);
—mass of the body;
,
—inertia moment, torque of the force
in relation to the axis passing through the center of mass;
—angular velocity.
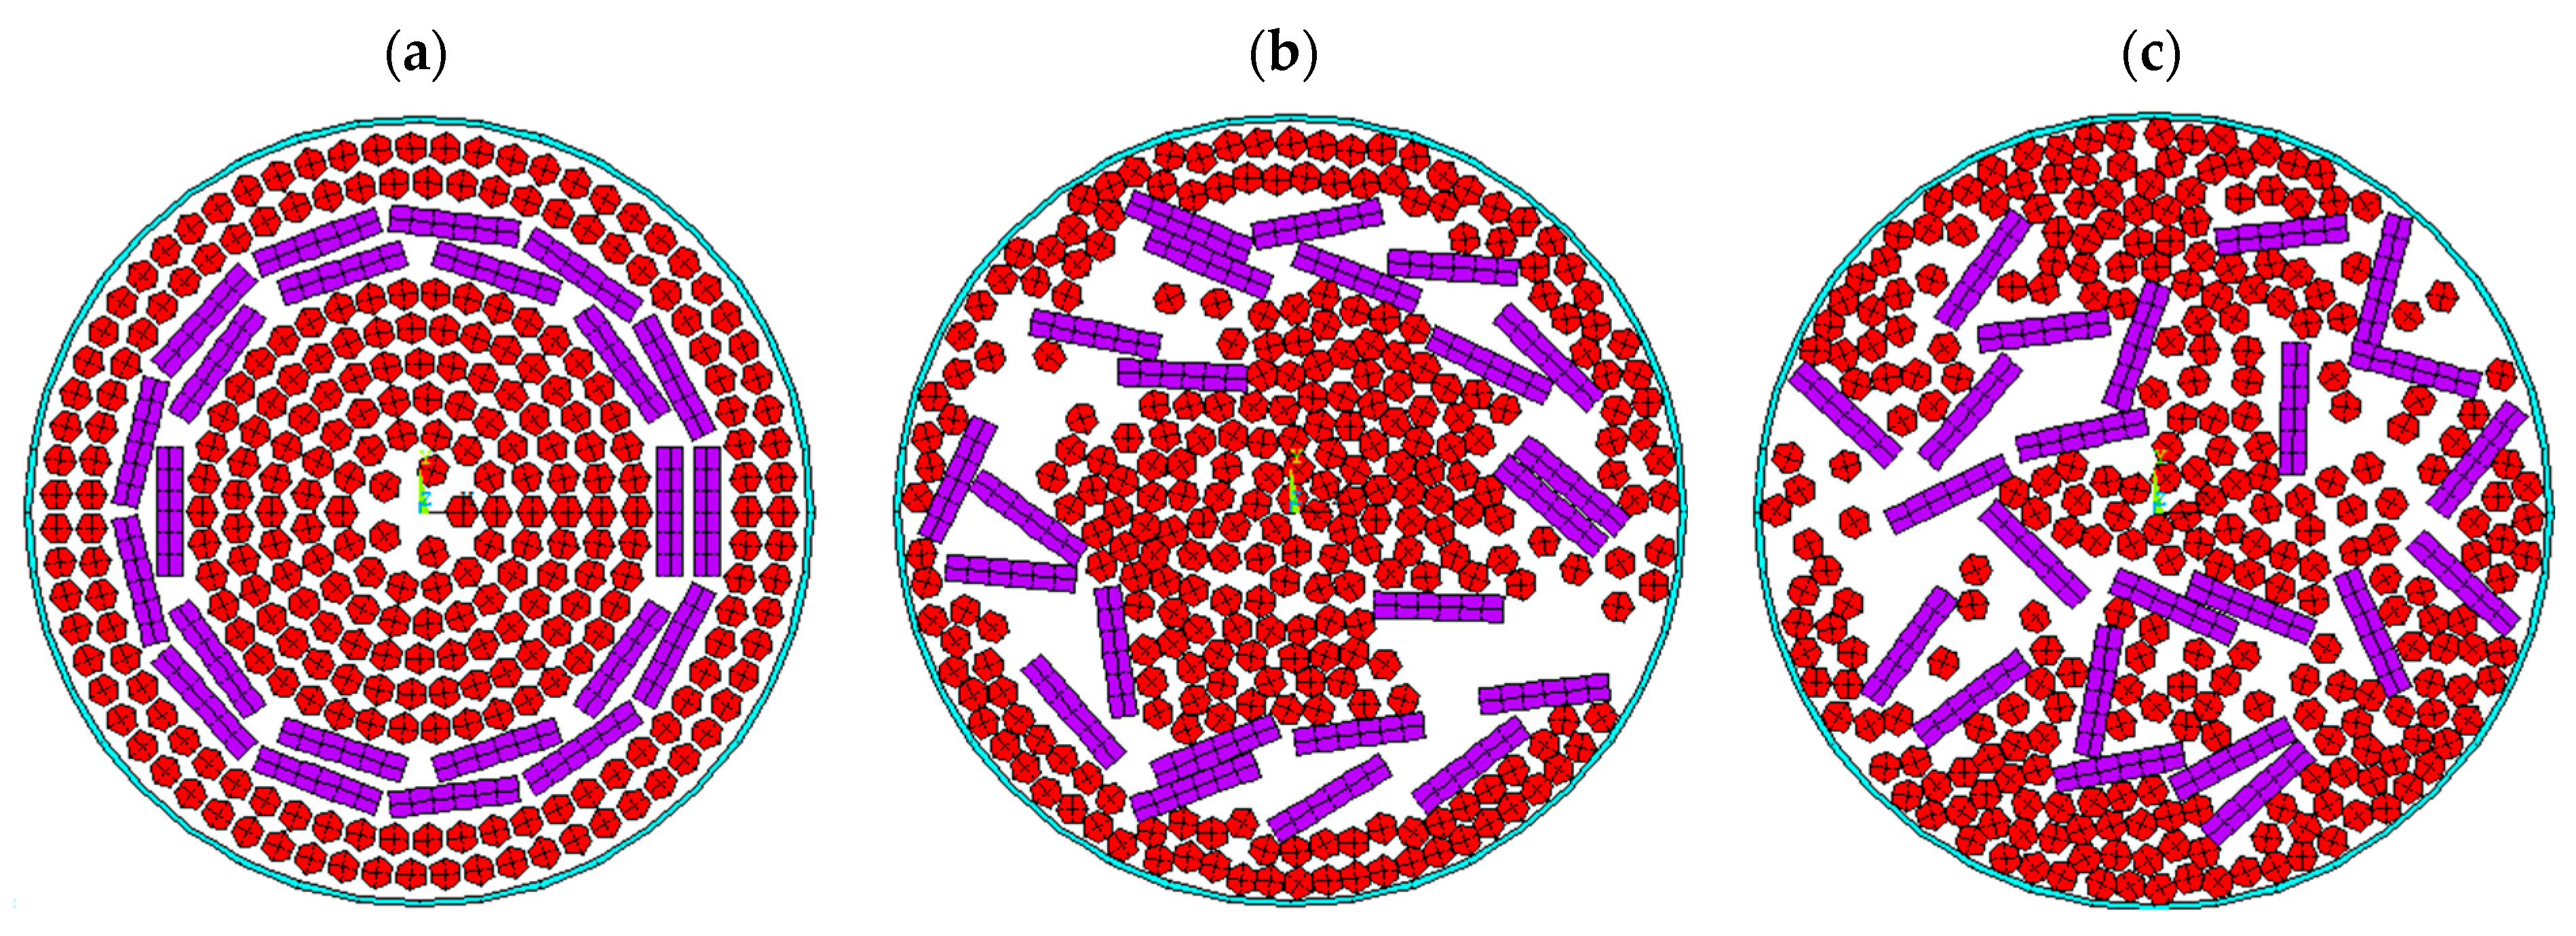
Figure 6 shows the simulation results for the millstones and WS particles transferred inside the working chamber of the EMM during the milling cycle. The calculations of the trajectory of millstones and WS particles were carried out for KM with a diameter of 120 mm, the number of millstones in the two-dimensional elementary layer was 23, and the number of WS particles—273. The dimensions of each millstone was Ø4 × 40 mm, and the WS particles, Ø5 mm.
Processing the results of the trajectory calculations allows for finding of the average number of hits between millstones and WS particles and between the millstones themselves, and for calculation of the average impulse of those hits. The manner applied to determine these relations is presented in detail in earlier studies [
20,
24].
6. EMM Efficiency and Grinding Quality
Using a mathematical model to calculate the trajectories of the dynamic ‘millstone—WS—WC’ system elements requires adjusting the input model data to conform to the technological parameters of the grinding process. Such indicators include the mass of the millstones and initial WS mass, which are normally derived from experimental studies. Due to the assumption of a two-dimensional movement of elements, the indicators in the mathematical model are, respectively,: the number of millstones and the number of WS particles in a two-dimensional elementary layer limited by the WC edge.
In order to achieve the above, bulk density was utilized—it is the mass of divided loose materials in a unit of volume, including the empty space between particles.
For steel millstones, irrespective of their diameter, the bulk density was assumed to be = 3990 , and for WS particles— = 1340 .
Subsequently, bulk volume of the millstones-WS mix was calculated:
where
,
—mass of the millstones and of the WS, respectively.
Height of a layer of this mix with volume
inside of a WC with diameter
is
The amounts of millstones and WS particles in the elementary layer are, respectively, expressed as:
where
—height of the elementary layer (assumed to be equal to a millstone diameter);
,
—respectively mass of one particle of the medium and one WS particle.
The values that appear in (18) are applied as input data for the mathematical model intended for calculation of medium and WS particle trajectories. Based on the results of the simulation and certain mathematical transformations, whose outline can be found in [
20,
24], the average number of millstones impacts
was established and the average value of the impulse of those impacts
in the time interval matching one full rotation of the resultant MMF of the inductor winding was also determined.
The analysis of the experimental studies (
Table 1) demonstrates that duration forms one of the principal parameters of the grinding process. Hence, its consideration carried out on the basis of numerical integration (15) using a directly given time interval is unnecessary. It would result in a significant increase in the duration and have virtually no effect on the result. Therefore, the obtained average number of impacts of millstones
is used for calculation of the average number of impacts in the actual duration of the process,
where
p—number of pole pairs in the inductor;
f—inductor winding power frequency; which will allow to reduce the number of independent variables in the functional dependencies of efficiency and quality, while simultaneously taking into account the grinding duration.
The values
and
(18) in the elementary layer of the WC do not take into account the change in mass of the WS-medium mix. For example, for
= 200 g,
= 100 g (experiment no. 18
Table 1 and
Table 2) and
= 800 g,
= 400 g (experiment no. 14
Table 1 and
Table 2), the values
and
will be the same.
To account for the influence of the total mass of the mix in the WC on the grinding process, the mean values of the force
impulse will be adjusted according to the formula
where
is adjustment coefficient.
The relation of this coefficient to the loading level of the WC or the WS layer height was approximated based on physical considerations and analysis of the experimental data from a quality point of view (
Figure 7). The final shape of the relation
will of course require additional experimental studies.
The results of mathematical experimentation and calculated values of the average number of impacts and their impulse are presented in
Table 3. It should be noted that the numbers of experiments given in
Table 3 correspond to numbers of experiments in
Table 1.
To extend the capability of the analysis of the obtained data, regression analysis was utilized, similar to the one described earlier (3)–(11). Proposed methods of fitting data (18)–(20) resulted in the reduction in the number of independent variables to three. Those are millstone diameter
, average number of millstone impacts
and the adjusted force impulse of those impacts
. The Taylor polynomial used in regression of efficiency
and quality
is expressed in scalar notation:
Regression coefficients
are displayed in
Table 4.
Figure 8 presents the relations of efficiency
and quality
to two technological indicators—duration and millstone diameter. The other independent variables were assumed to be constant. The values obtained here allow for a comparison with values obtained directly from the experiment.
Figure 8a shows the variability of efficiency depending on the grinding time for different diameters of millstones. This demonstrates that millstones with a diameter of 4 mm perform their role most effectively for short grinding times, whereas the efficiency decreases with the extension of the grinding time for all millstones. In the case of using millstones with a diameter of 3 and 4 mm for grinding times of equal to approximately 240 and 420 s, the efficiency expressed in terms of grinding time is identical. This proves interesting since for grinding times below 240 s, the use of millstones with a diameter of 4 mm was demonstrated as more effective, whereas for grinding times between approximately 240 and 420 s, the use of millstones with a diameter of 3 mm was demonstrated to be more beneficial. Over the entire range of tested diameters, the use of millstones with a diameter of 2 mm proved to be least effective, i.e., the ratio of time to the volume of ground material was the smallest.
Figure 8b. shows the course of variability of grinding quality against time. The graph takes into account the diameters of millstones equal to 2, 3 and 4 mm with a ratio of the masses of millstones and substance subjected to grinding equal to 1:2.
Figure 8c shows the variability of the grinding efficiency in relation to the diameter of the millstones at different grinding times. From these waveforms it can be concluded that for the grinding time equal to 360 s, the best efficiency is achieved for the diameter of the grinding medium of approximately 3.5 mm. For longer grinding times equal to 420 s and 480 s, it is more advantageous to use millstones with diameters of 3.6 and 3.75 mm.
Figure 8d shows the dependence of the quality of the grinding process on the diameter of the millstones used. Simulations were carried out for three grinding times: 360, 420 and 480 s. The best grinding quality was obtained for 360 s. Regardless of the grinding time, if the grinding medium diameter is increased from approximately 2.6 to approximately 3.5 mm, the grinding quality decreases by approximately 50% for each of the considered times. After exceeding the millstone diameter equal to 3.5 mm, the quality increases significantly for all tested times.
Sequential execution of experimental data (
Table 1) processing procedures, creation of TF approximating electrodynamic force fields (13) and torques (14), calculation millstone trajectories (15) and further processing of the results (
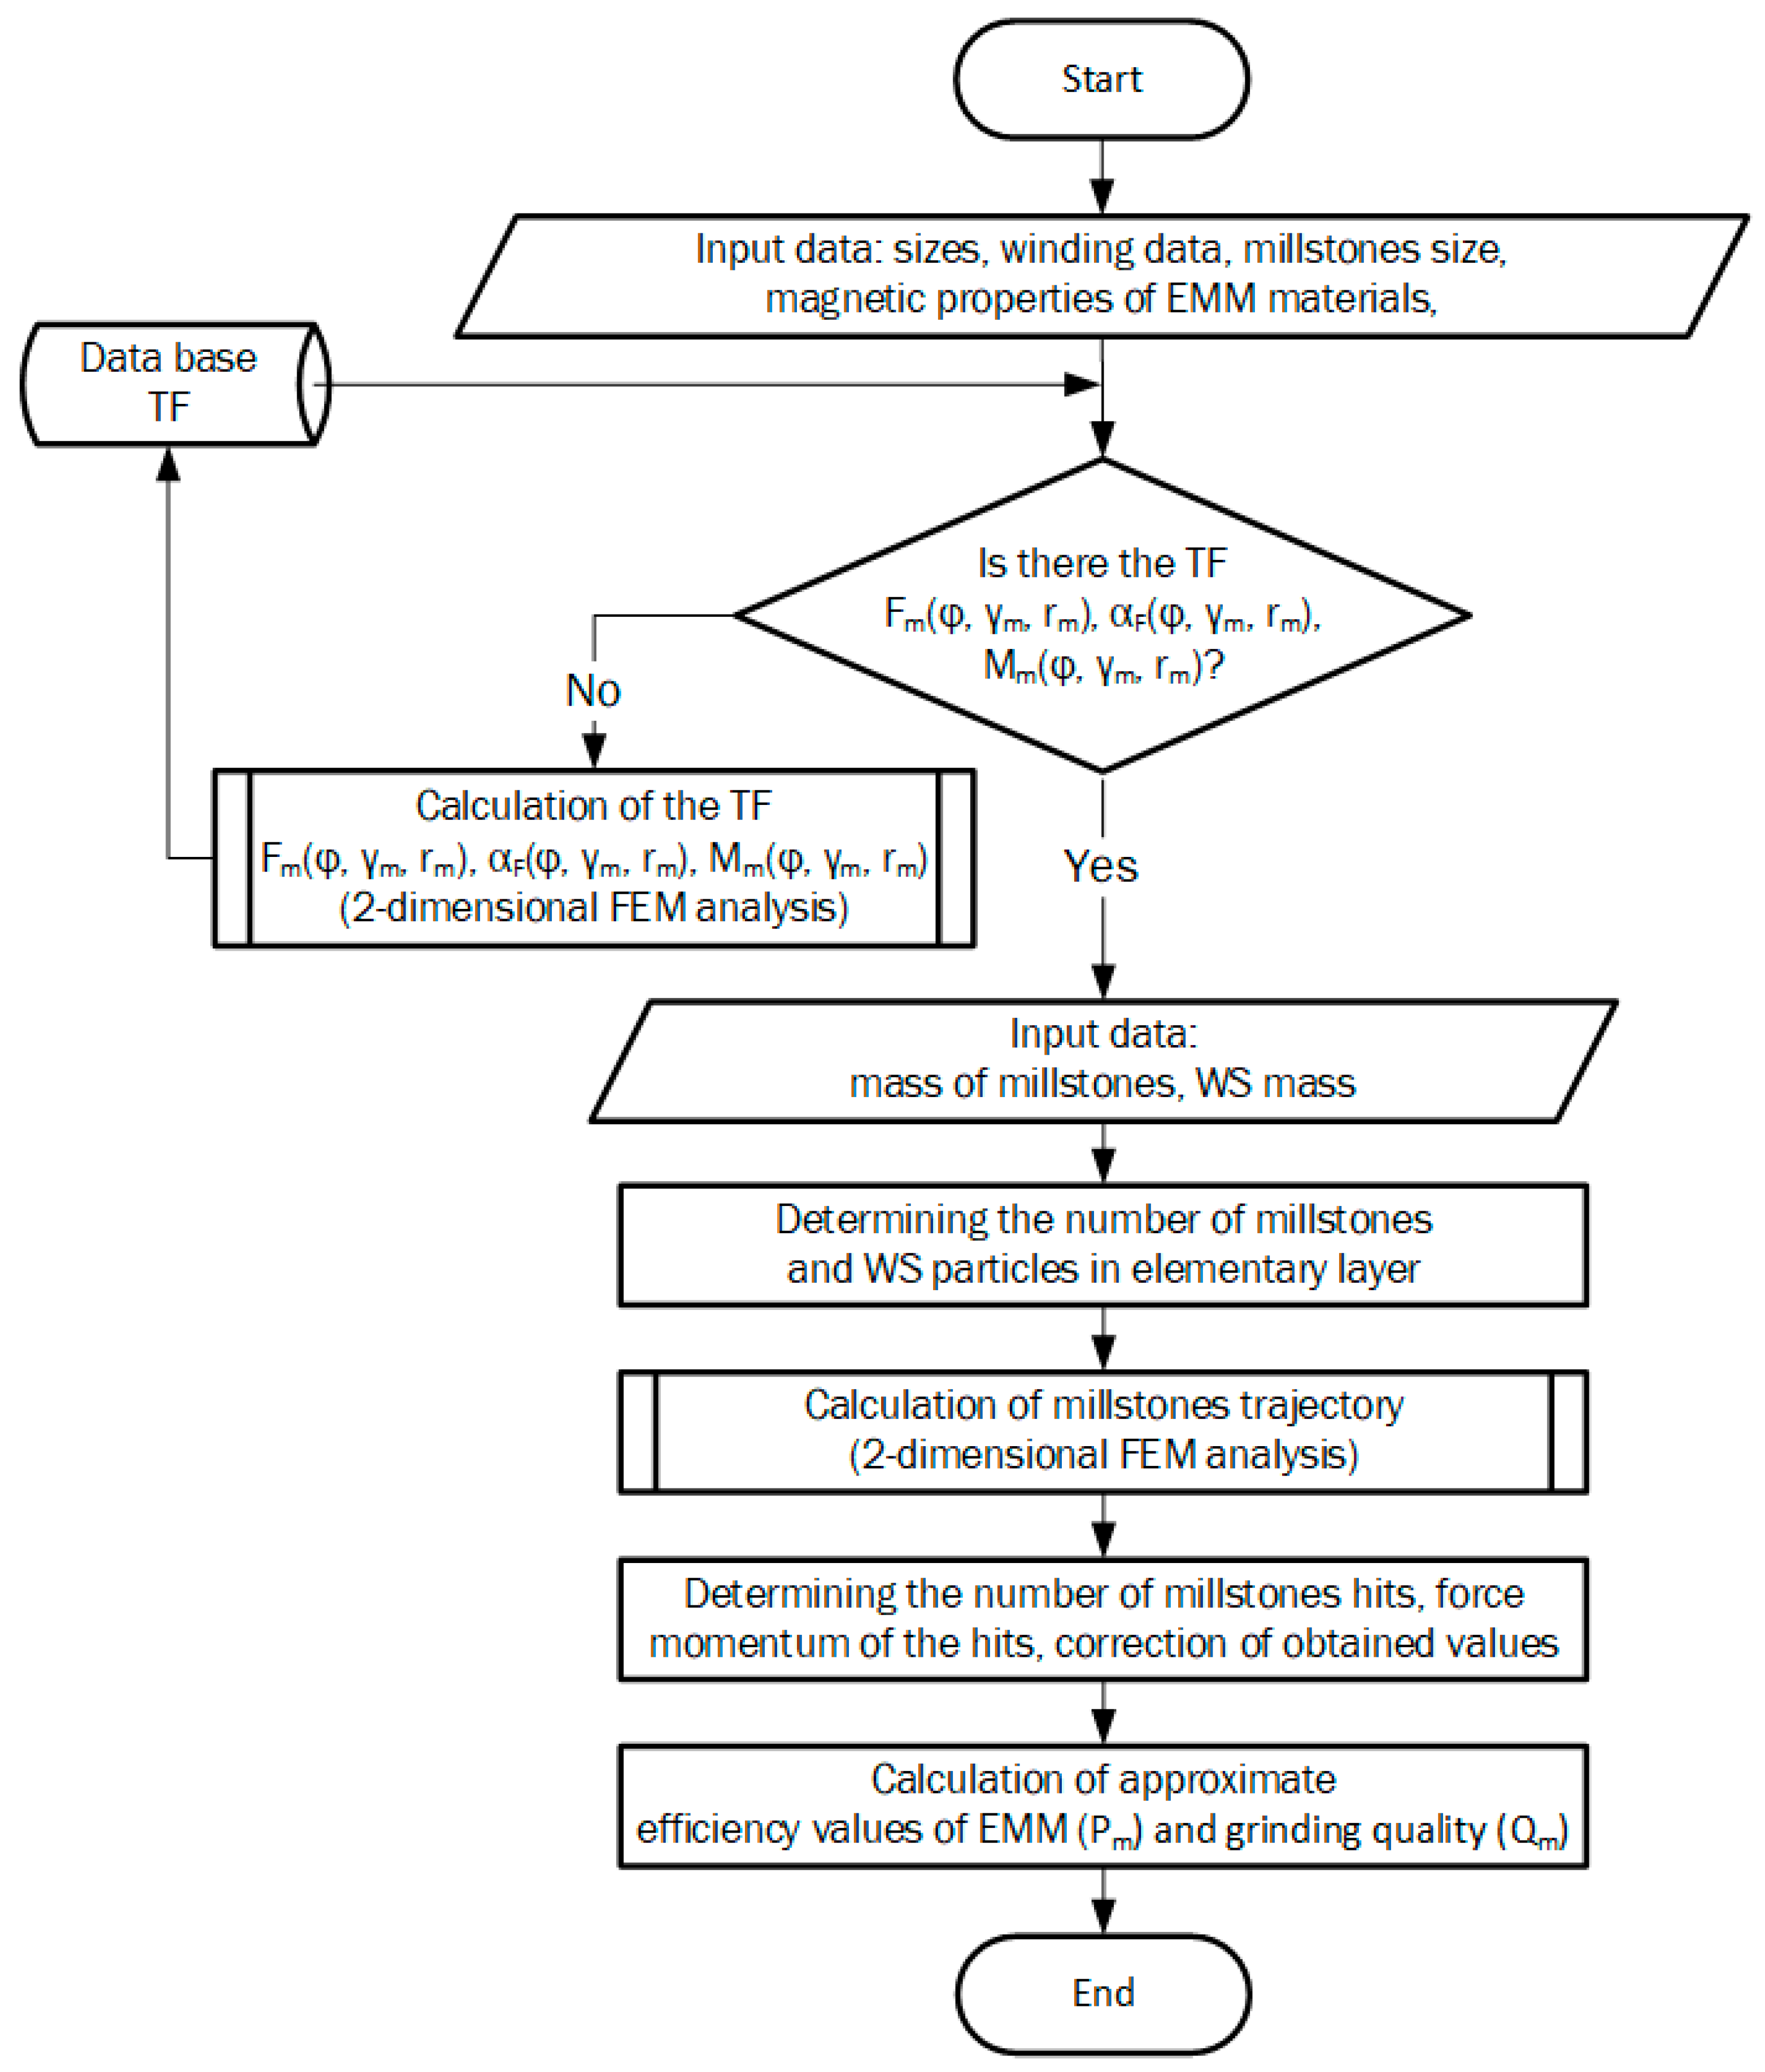
Table 3) connects EMM efficiency indicators with its design parameters and technical aspects of the technological WS grinding process. The algorithm applied in this calculation sequence is presented as a flowchart in
Figure 9. It facilitates the assessment of preliminary efficiency and grinding quality during the EMM design stage. The first step of the algorithm involves input of data such as millstone dimensions and MEM parameters (dimensions, winding data and magnetic properties of the materials applied to build it). Subsequently, the algorithm verifies whether there is a function defined in tabular form (TF) in the database, and if it does not exist, the algorithm calculates it and saves it in the database. Following that, the database is verified again. If there is TF in it, then the algorithm proceeds to a subsequent stage, in which further input data are given, such as mass of grinding millstones and WS mass. Then, the number of millstones and WS particles (18) in the two-dimensional elementary layer limited by the WC boundary is given. The next step is to determine the trajectory of the movement of millstones using a two-dimensional FEM analysis described in detail in the earlier publication by this author [
19]. In the next stage of the algorithm, the number of millstone collisions and the momentum of these collisions are determined, in the form that is given in the publication referred to [
20], which is followed by an adjustment of the obtained results according to the needs (20). In the final stage of the algorithm, approximate values of
and
are calculated on the basis of regression equations (22) by application of the coefficients presented in
Table 4.


