1. Introduction
Computer-guided dynamic navigation systems have emerged as an alternative to conventional template guidance techniques. The system functionality relies on capturing reference markers rigidly placed on the patient and on the surgical instruments with the use of sensors (mainly cameras) capable of capturing the environment in real time [
1]. The preparation of the system to be used in the surgery involves several steps, such as taking a cone-beam computed tomography (CBCT) scan of the patient, planning the guidance, calibrating the implant drill, and pairing the CBCT data with the tracking marker placed on the patient. Guidance during the operation is usually carried out by the surgeon focusing on the display on which the patient’s CBCT data are shown along with the current position of the surgical instrument in relation to the patient’s marker. By examining the display, the surgeon can adjust the implant drill position and angle based on guidance indicators overlayed on the patient’s CBCT data. However, the guidance using such systems requires the surgeon’s frequent distraction from the patient to the display of the system, increasing the risk of accidental implant drill positional changes [
2]. In addition, some operating sites might be too confined for currently available systems, such as Navident (ClaroNav, Toronto, ON, Canada), ImplaNav (ImplaNav, BresMedical, Sydney, Australia), X-Guide (X-Nav Technologies, Lansdale, PA, USA), or AqNavi (AQNavi, TITC Ltd., Kaohsiung, Taiwan). These inconveniences can be eliminated by replacing the display with an augmented reality (AR) headset, which has been the subject of research in various other medical fields: neurosurgery [
3], urology [
3], ophthalmology [
4], orthopedic [
5], and plastic [
6] surgery. AR allows superimposing digital information into the physical surrounding, thereby enhancing the user’s perception of their environment [
7]. In terms of a computer-guided dynamic navigation system, it would allow surgeons to concentrate on both the operating site and guiding instructions given by the system without the need for redundant movement. More importantly, depth sensors that are integrated into headsets can offer an alternative to bulky camera setups that are commonly used in conventional systems.
Similarly, as in conventional dynamic navigation systems, real and digital world interaction also remains a crucial component in AR systems. Two common approaches used in AR systems for tracking and registering the environment are marker-based and marker-less methods. Each method provides its own benefits and drawbacks. In the marker-based approach, factors such as simplicity and computational performance play a major role in their prevalent choice among researchers [
8]. Here, the selection of markers to be tracked can encompass a range of options, including IR-reflective markers, fiducials, or landmark-based markers. In the medical field, these landmark-based markers can refer to any rigid anatomical landmark, which could be easily identifiable with an AR tracking system. The utilization of a marker-less approach can offer benefits in scenarios where marker occlusion is expected. Furthermore, it provides a more sterile method since tracking relies solely on the objects present in the scene, eliminating the need for additional objects. Nonetheless, a significant advantage of the marker-based approach over the marker-less method is its superior precision [
9]. This advantage is of utmost importance for the success of surgical procedures, and it was chosen as the primary rationale for employing the marker-based approach in this study.
With the introduction of HoloLens 1 (Microsoft, Redmond, WA, USA), which is considered to be the first commercially available autonomous optical see-through AR headset, a shift towards more self-contained system development has gained substantial popularity among researchers [
10]. The advantages of utilizing commercially available headsets lie in their ease of use and development environments, which can be effortlessly deployed. Additionally, their hardware incorporates various embedded tracking sensors, which has the possibility to eliminate reliance on external devices. For example, the second iteration of HoloLens has four head-tracking cameras, one time-of-flight and one 8-MP RGB camera, which compose the system, capable of registering and tracking the markers. Commonly, the selection of markers for AR applications often involves choosing from widely utilized options such as ArUco [
11] and its variants or the popular Vuforia library (PTC Inc, Boston, MA, USA). While there is plenty of research on the use of HoloLens with marker-based tracking in medicine [
12], the same cannot be said for dentistry applications, particularly in the field of implantology (see
Section 2).
The objective of this in vitro study is to assess the suitability of utilizing the AR headset HoloLens 2 for marker tracking in the dentistry scenario, preferring application in dynamic navigational guidance, and determine its accuracy. Accuracy in this sense is defined as the combination of trueness and precision [
13]. Trueness explains how close the measured values are to actual ones, and precision defines the closeness of agreement between repeated values. A few null hypotheses of accuracy in different experimental scenarios were stated. The first hypothesis was that there is no accuracy difference between locations in the dental arch that were identified as appropriate for the calibration procedure. The second hypothesis was that there is no accuracy difference in virtual model perspective in different view positions and settings.
The rest of the paper is organized as follows. In
Section 2. we explore AR headset implementation in the implantology-related literature. In
Section 3, we describe the experimental design of the calibration and virtual dental model alignment setups for accuracy evaluation.
Section 4 presents the results obtained from each experimental setup. In
Section 5, we discuss the results and their applicability in addressing the raised problem. Finally,
Section 6 presents the conclusions of our study.
2. Related Work
One of the few pilot studies investigating the use of AR headsets in implant planning and navigation was published by Wanschitz et al., who, with the help of a modified commercially available AR headset, achieved a 1 mm distance and 3
angle deviation from preplanned implant positions [
14]. Vigh et al. in their in vitro study compared information outputs from both headset- and monitor-based approaches, demonstrating similar levels of accuracy in angular- and distance-related implant measurements for each case [
15]. Lin et al. in their study achieved satisfactory results sufficient to implement in clinical practice with the use of a self-made augmented reality system [
16]. The commercially available optical see-through system Magic Leap One (Magic Leap Inc., Miami, FL, USA) was used in Kivovics et al.’s in vitro study, where the utilized system achieved results comparable to those obtained with the physical template guidance technique [
17].
While studies with HoloLens can be found in numerous medical fields, there is a noticeable lack of extensive research within the dental field, especially with the latest version of HoloLens. Existing studies employing HoloLens for the study of dental applications can be grouped into two categories: focused on training [
18,
19] or monitoring [
20,
21] and interaction based [
22]. The first one focuses on displaying virtual content, while the latter involves the interaction between virtual content and real objects, which is the category with which guided implant placement studies are associated.
One of the clinical studies by Pellegrino et al. successfully used HoloLens 1 to screen dynamic navigation system output in an AR headset, without the need for the surgeon to look at the system display [
23]. Liu et al. utilized HoloLens 1 in a mixed-reality-based dental implant navigation method and showed improvement over the hand-free approach [
24]. In a recent study by Tao et al., a comparison was made between the computer-guided dynamical navigational system and the use of HoloLens 2. The study indicated similar accuracy in implant distance-related measurements. However, it revealed that the AR system exhibited higher angular deviations (3.72
) compared to the conventional dynamic navigational system (3.1
) [
25].
3. Materials and Methods
The study was implemented with the use of a commercially available augmented reality device Microsoft HoloLens 2. For marker recognition and tracking, Vuforia (10.5) library in the Unity (2020.3.17) game engine was used. Additionally, to control the different stages of the experiment, a graphical user interface (GUI) was developed with the use of the Mixed Reality Toolkit (MRTK). The digital dental model was used as a basis for the experiments. For tracing the dental model, a “Γ”-shape marker was designed. Both the dental model and the “Γ”-shape marker were manufactured additively using the resin-based 3D printer MAX UV385 (Asiga, Sydney, Australia). For the calibration procedure, a pencil-like positioning probe with known dimensions was modeled and printed with a resin-based Ember 3D printer (Autodesk, San Rafael, CA, USA). One of the pencil ends was modeled as a 30 × 30 × 30 mm cube to represent the tracking part. The other end of the probe was designed as a cone with the intention to use its tip as a contact area with the touched dental model surface.
Both the positioning probe cube (
Figure 1, left) and the “Γ”-shape marker (
Figure 1, middle) were covered with contrasting black and white labels to be trained in the Vuforia environment. Training is the procedure for selected tracers to be paired with their markers or objects. The marker and probe tools were trained in Vuforia as object and model targets, respectively. Model target technology allows the object to be recognized based on its existing digital model. The object target, on the other hand, was trained with the help of the phone camera in which various tracking points describing the object are collected and then trained to recognize the marker. The “Γ”-shape marker was connected to the dental model via inflexible wire with the use of self-curing acrylic resin as an adhesive at both ends of the wire (
Figure 1, right). For better durability during the experiments, the marker and dental model were attached onto a plastic plate. The study was divided into two procedures: calibration and virtual dental model accuracy experiments. Only the HoloLens 2 optical system was employed to track both the dental marker and the probe.
3.1. Calibration Accuracy Setup
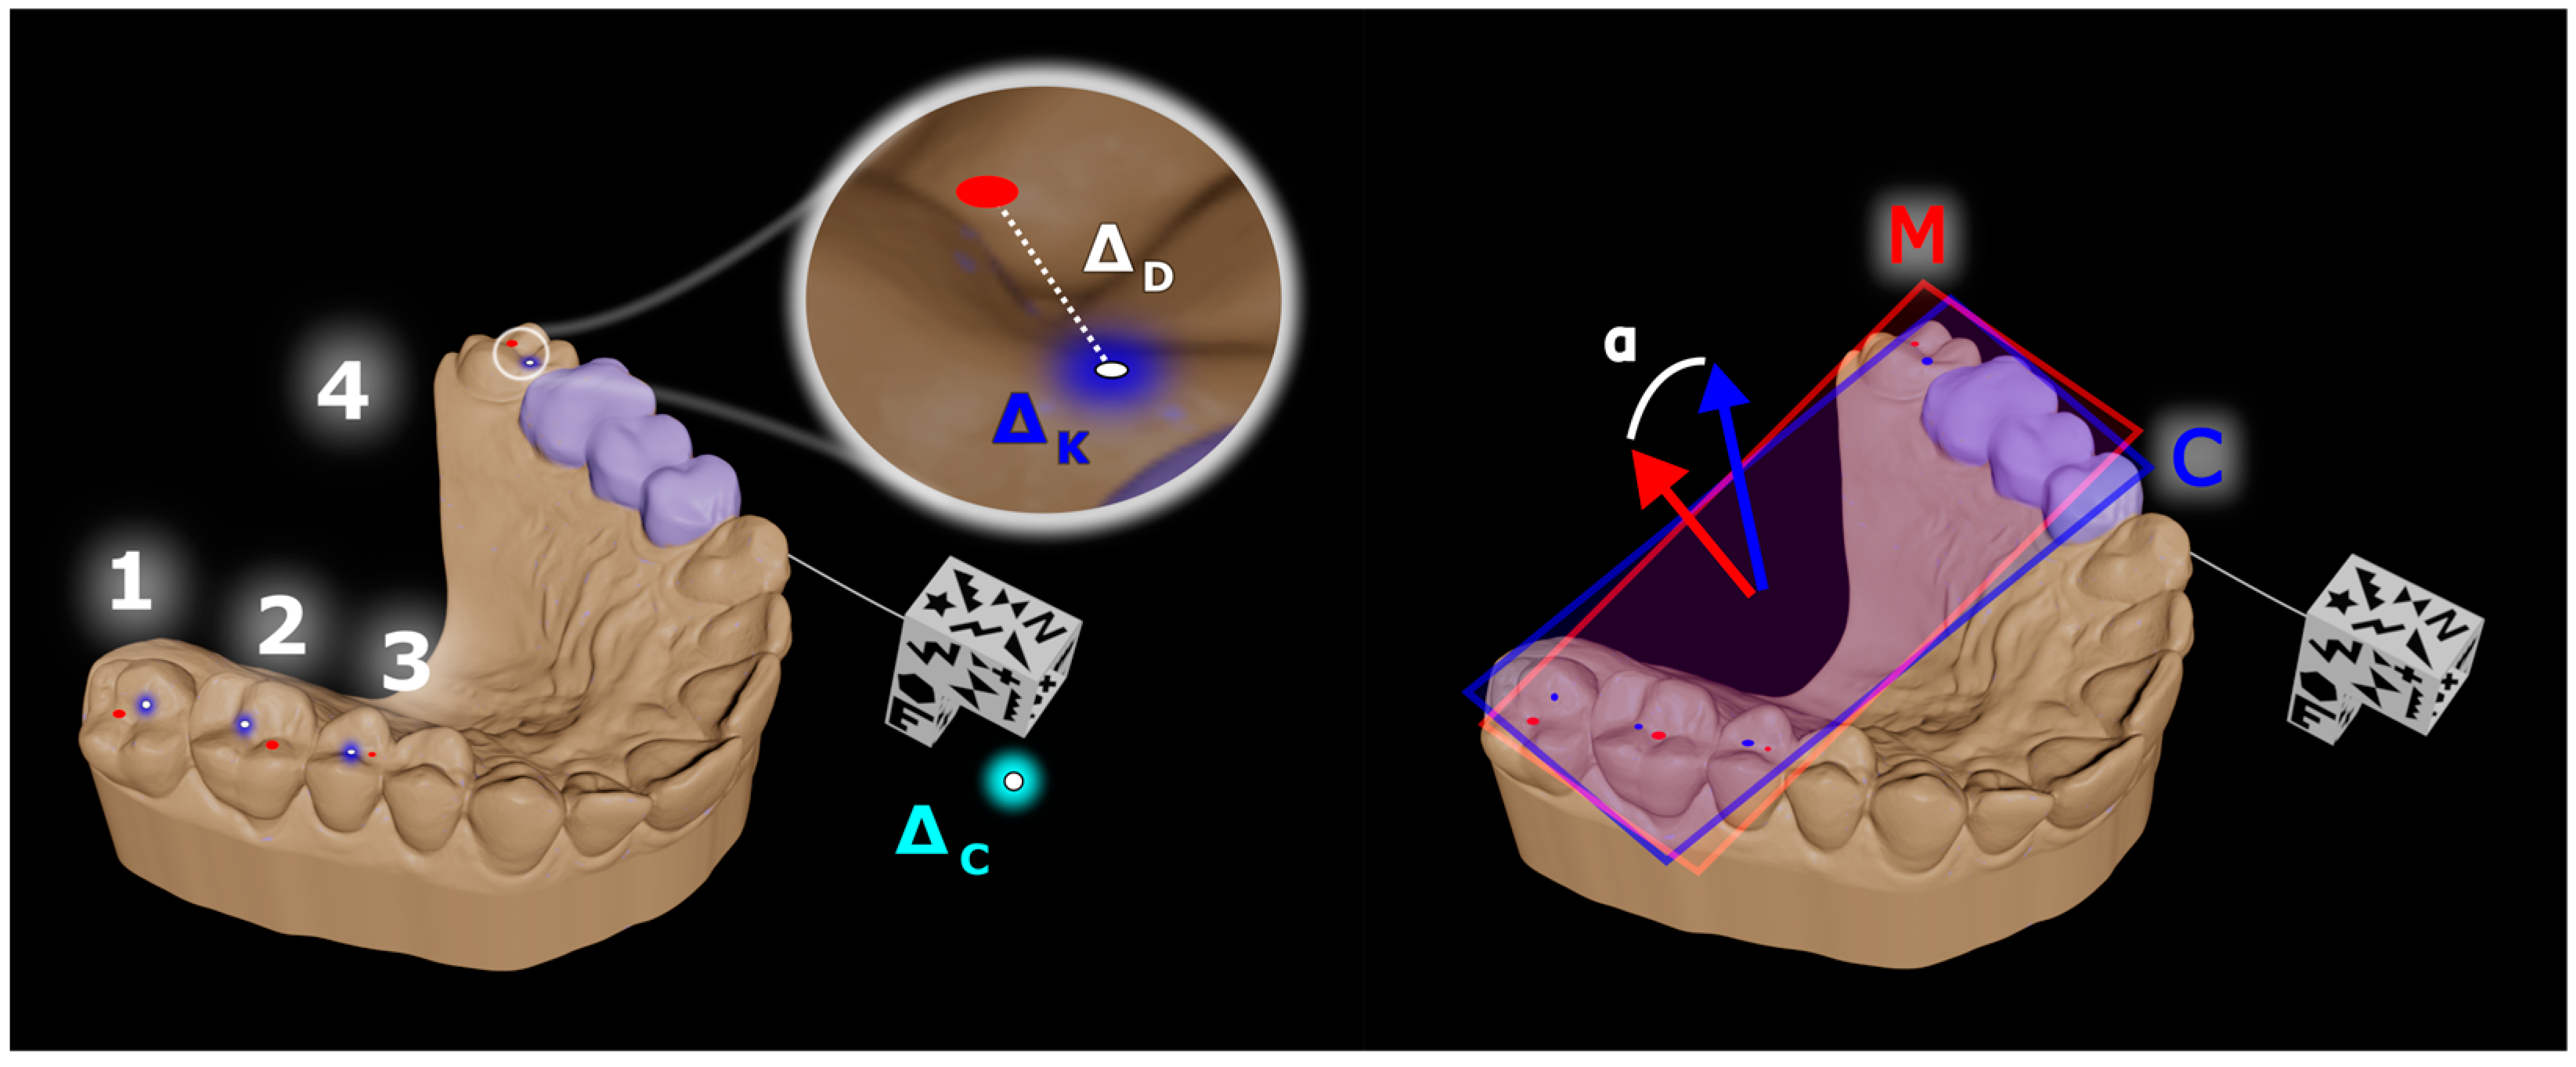
The calibration procedure is necessary to accurately link the digital dental model to its marker. During calibration, the user wearing the HoloLens 2 headset focuses their gaze on the physical dental model and calibration probe markers with the intention of correctly recognizing them. The correct recognition and the beginning of the tracking are indicated for the user on the headset display with a visibly seen superimposed digital probe on the physical probe and four virtual points appearing on the corners of the dental model marker. If all conditions are met, the user can start the calibration by pinpointing predefined intrinsic surface points in sequence on the physical dental model with the probe. Four points were chosen for the calibration procedure. The location where the user must place the probe tip can be seen on the auxiliary digital dental model for reference throughout the entire calibration duration. For user convenience, an auxiliary dental model is fixed on the left side of the headset display. The tracked probe tip coordinate is saved and linked to the dental model marker using the HoloLens voice recognition system by saying the word “save”. The saved probe tip coordinate is calculated from the averaged data samples (size of 120), which are recorded in a couple of seconds after the saving command is given. Furthermore, after each saved coordinate, the reference point location in the auxiliary model is updated. Finally, after all predefined points are marked and paired with the marker, an automatic superimposition of the digital to the physical model occurs. Therefore, using the AR headset digital dental model after the calibration procedure can be seen as an overlay of its physical counterpart. After each calibration procedure, all predefined and unaggregated (120) calibration point coordinates with known location indices with the inclusion of marker points are saved in
.csv file format. The predefined points are positioned relative to their paired calibration points without changing their interconnection distance. All data were imported into MATLAB 2020b software (MathWorks, Natick, MA, USA) for further analysis. The calibration data annotation and measurement scheme is shown in
Figure 2. Measurements of the Euclidean distance (∆
D) between the average of the calibration points and the coordinates of the marker point in each position were made. Angular measurements were evaluated using the angle (α) between the plane normal defined using the averages of calibration points and predefined points. Both angle (α) and distance (∆
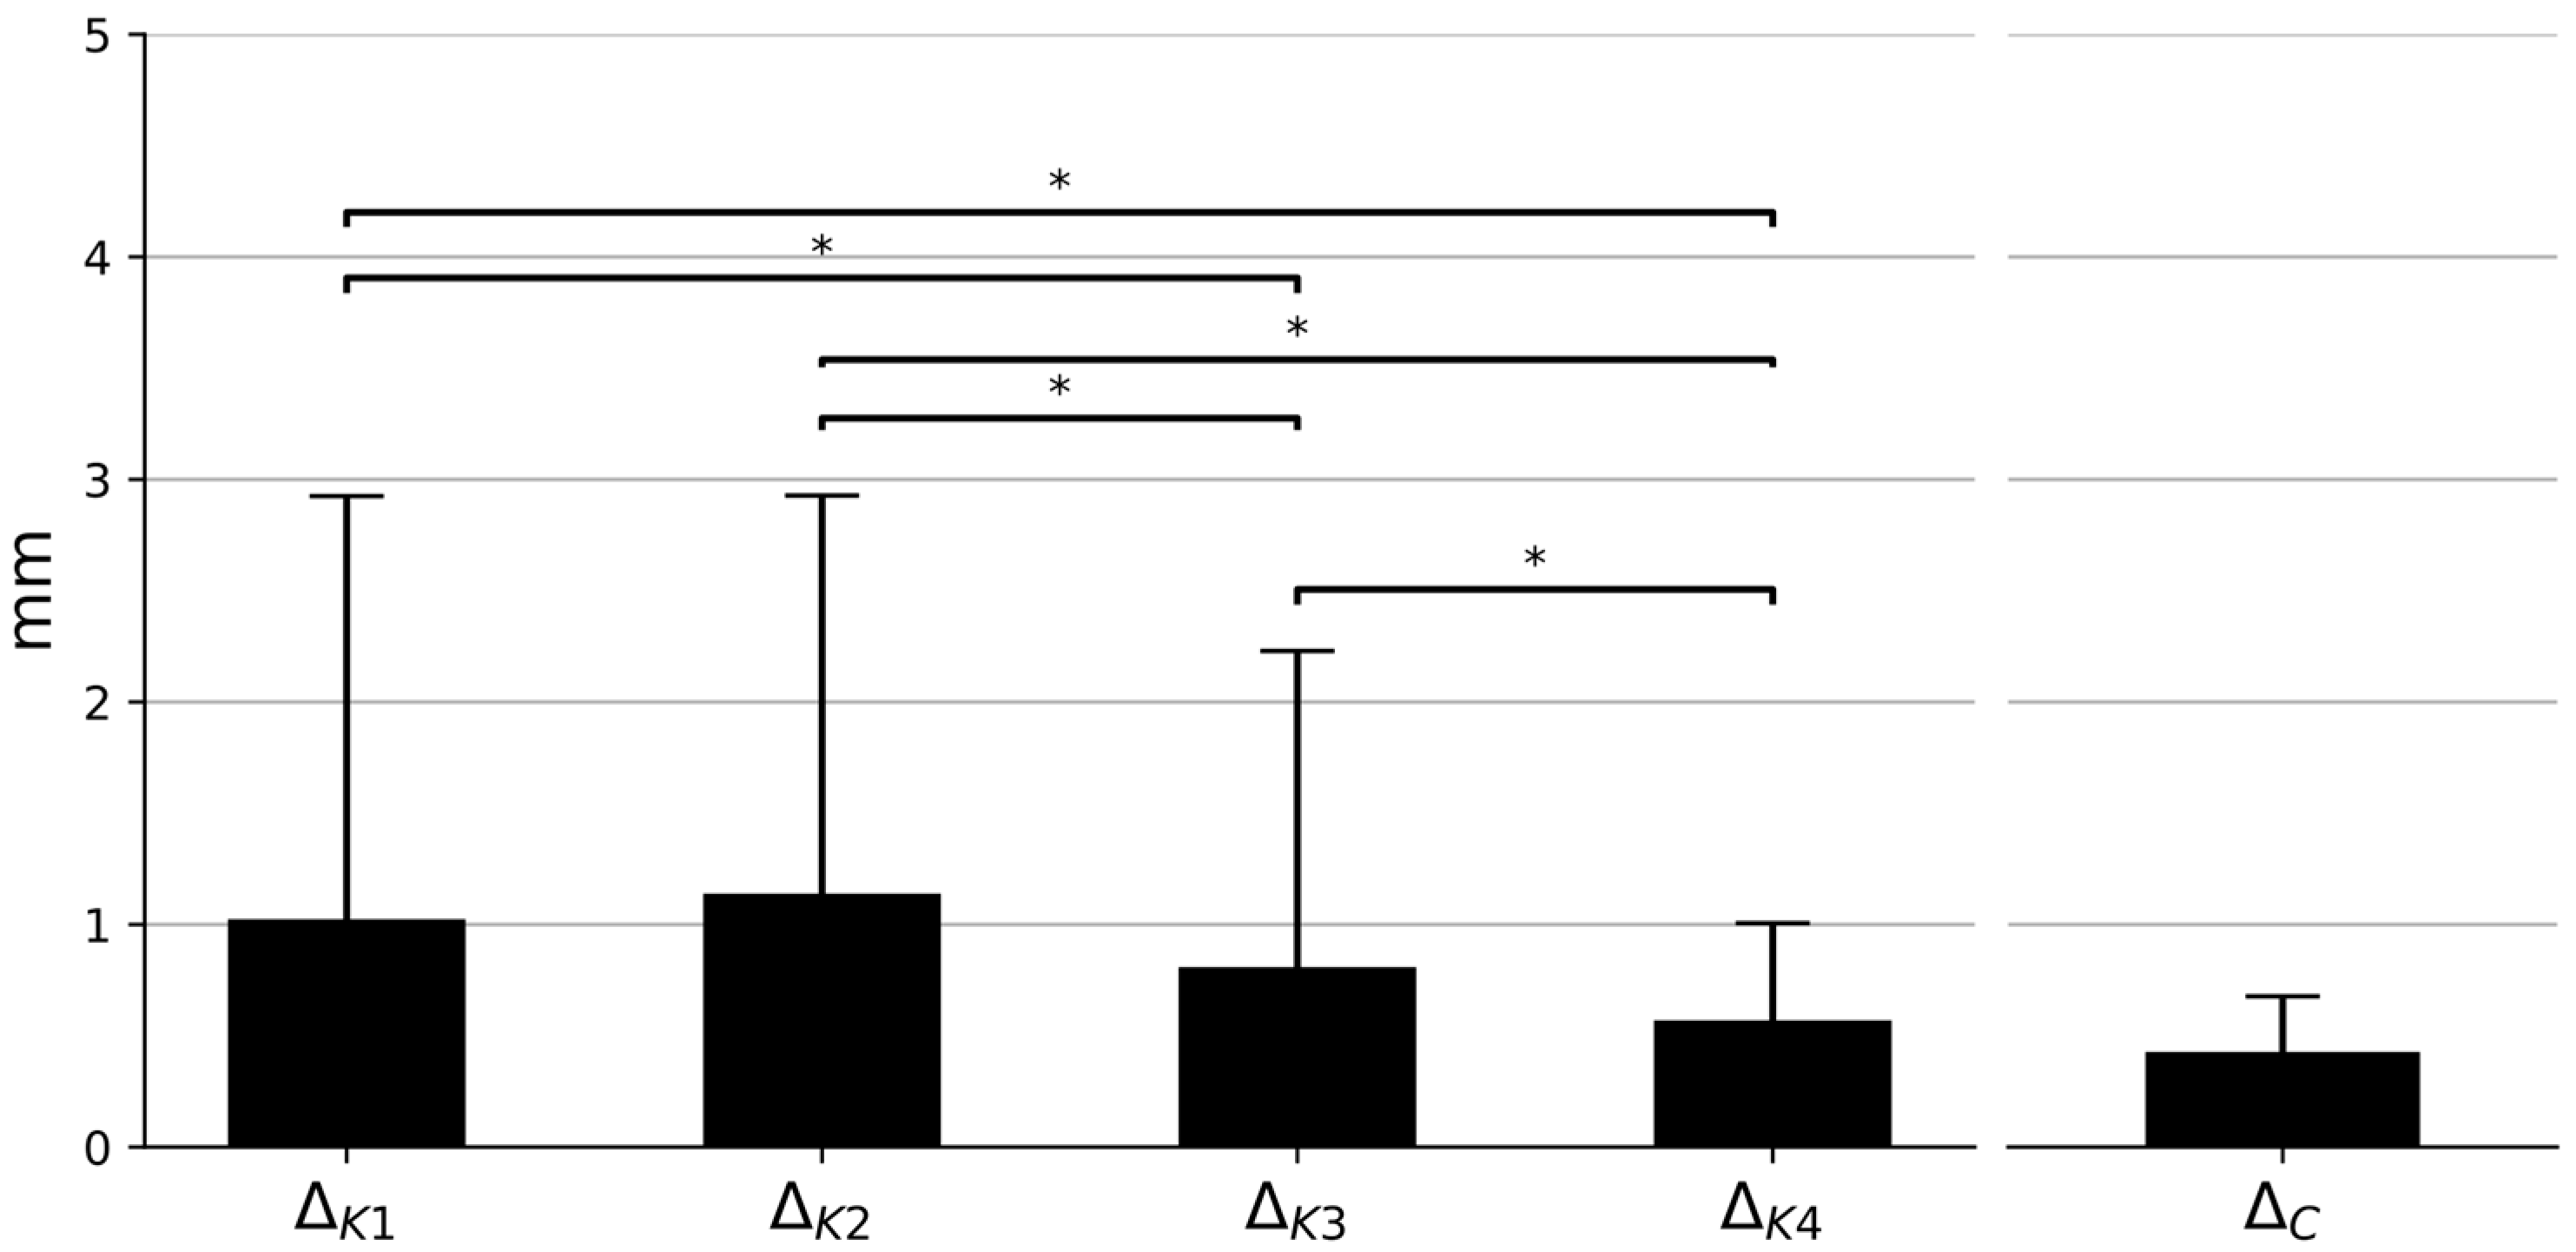
D) measurements were chosen as trueness descriptors. Furthermore, to evaluate the calibration (∆
K) and marker (∆
C) precision values, the Euclidean distances between each data point and the respective coordinate averages were measured.
3.2. Virtual Dental Model Accuracy Assessment Setup
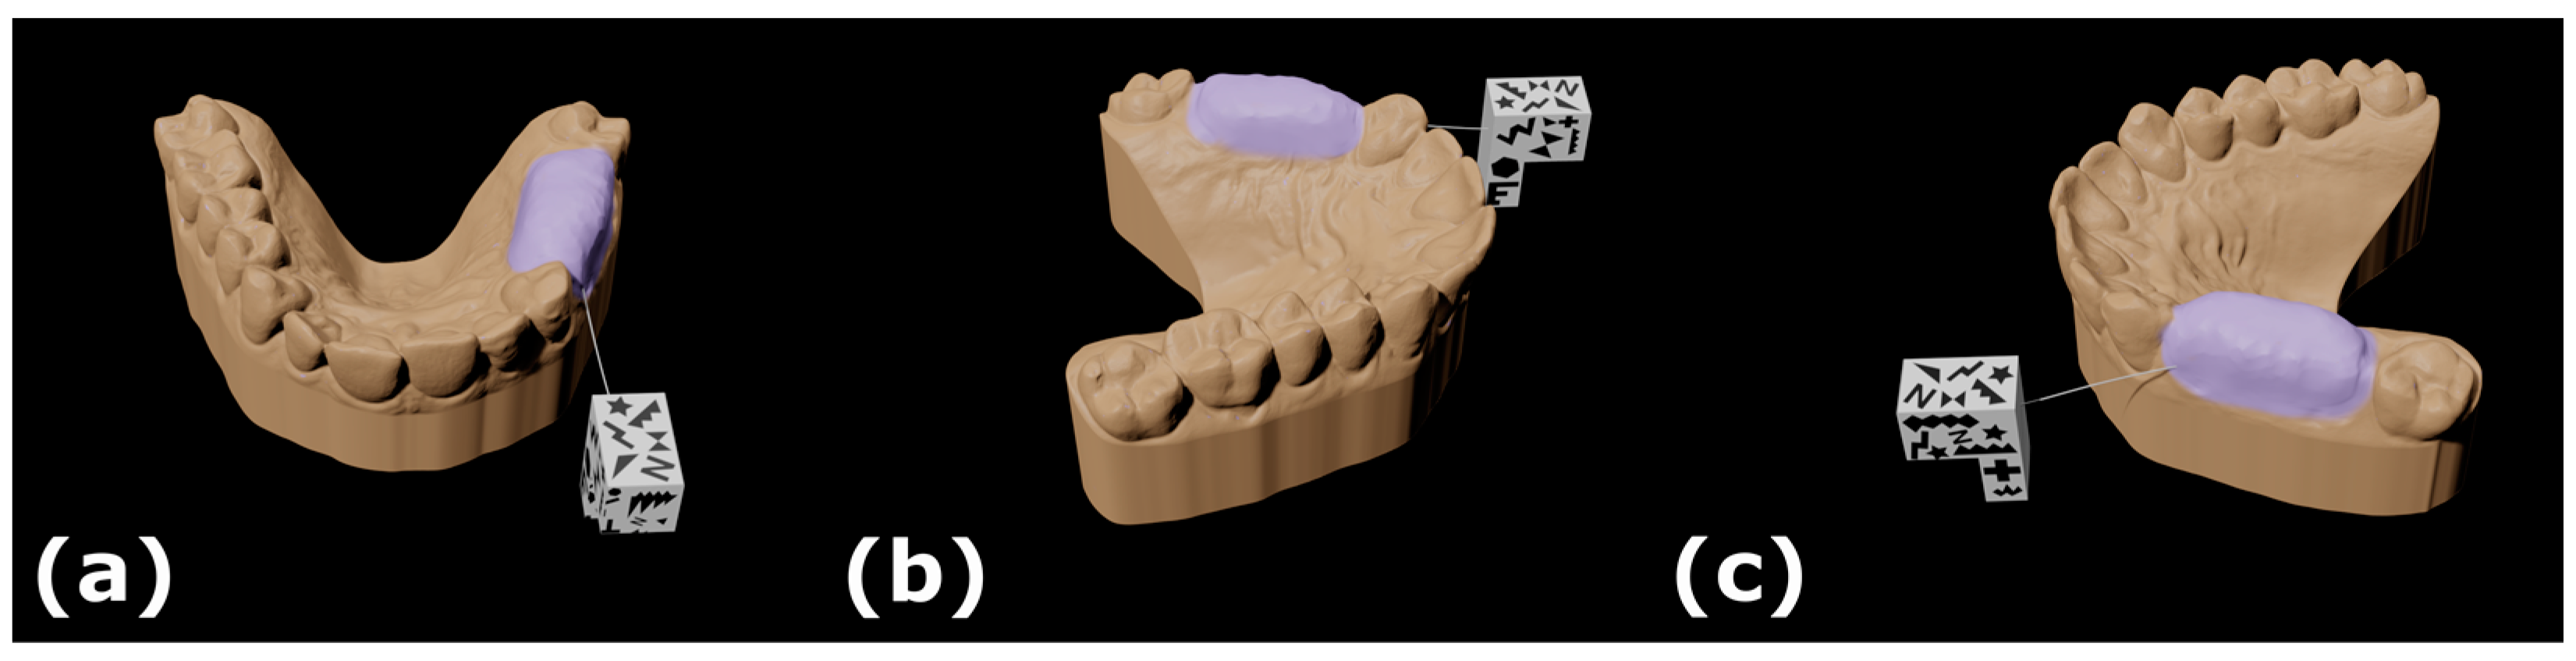
To evaluate the accuracy of the designed marker and HoloLens system, videos of the virtual dental model augmented onto its physical model after successful calibration were recorded with the addition of point data. Two experimental settings were chosen: static and dynamic. In both cases, the plate with the attached dental model and marker was fixed on the table. The HoloLens headset was positioned at a moderate distance from the plate and directed towards the model at a slightly inclined angle in both scenarios. In the dynamic setting, the user wore the headset, while in the static setting, it was placed on a plastic head model. Three data registration positions were chosen: front, left, and right of the model (
Figure 3). To evaluate the virtual perspective seen through the headset, 4 points were marked on both the virtual and physical dental model’s distinct surface areas. Two data types were gathered: videos from the HoloLens integrated camera saved in .mp4 file format and tracked camera and marker point coordinates saved in .csv file format (
Figure 4). All data were imported into MATLAB software for further analysis. For relationship establishment between physical and virtual model points, all physical model point coordinates, marked as black dots, were manually selected and saved in the first video frame. Due to observed jitters in the virtual model, the Kanade–Lucas–Tomasi algorithm was used for automatic virtual point tracking, which are represented as red spheres in the right of
Figure 4. In every video frame, the algorithm detects each virtual point movement by highlighting it with several characteristic points denoted with green crosses in the red sphere’s area.
The average coordinates of these “cross” canters are considered as detected virtual points. Additional consideration was given to dynamic settings to mitigate possible head movement by using video stabilization methods present in the used software. The Euclidean distance (∆V) was measured between detected virtual and manually selected points in their respective locations. To establish pixel size in units, the ratio between the measured edge in pixels and the known real values of the upper marker base was calculated. A similar procedure was utilized as in calibration for precision measurements from data gathered from marker (Q) and camera (F) points: the distances between each marker and camera point and their respective coordinate averages were measured.
3.3. Statistical Analysis
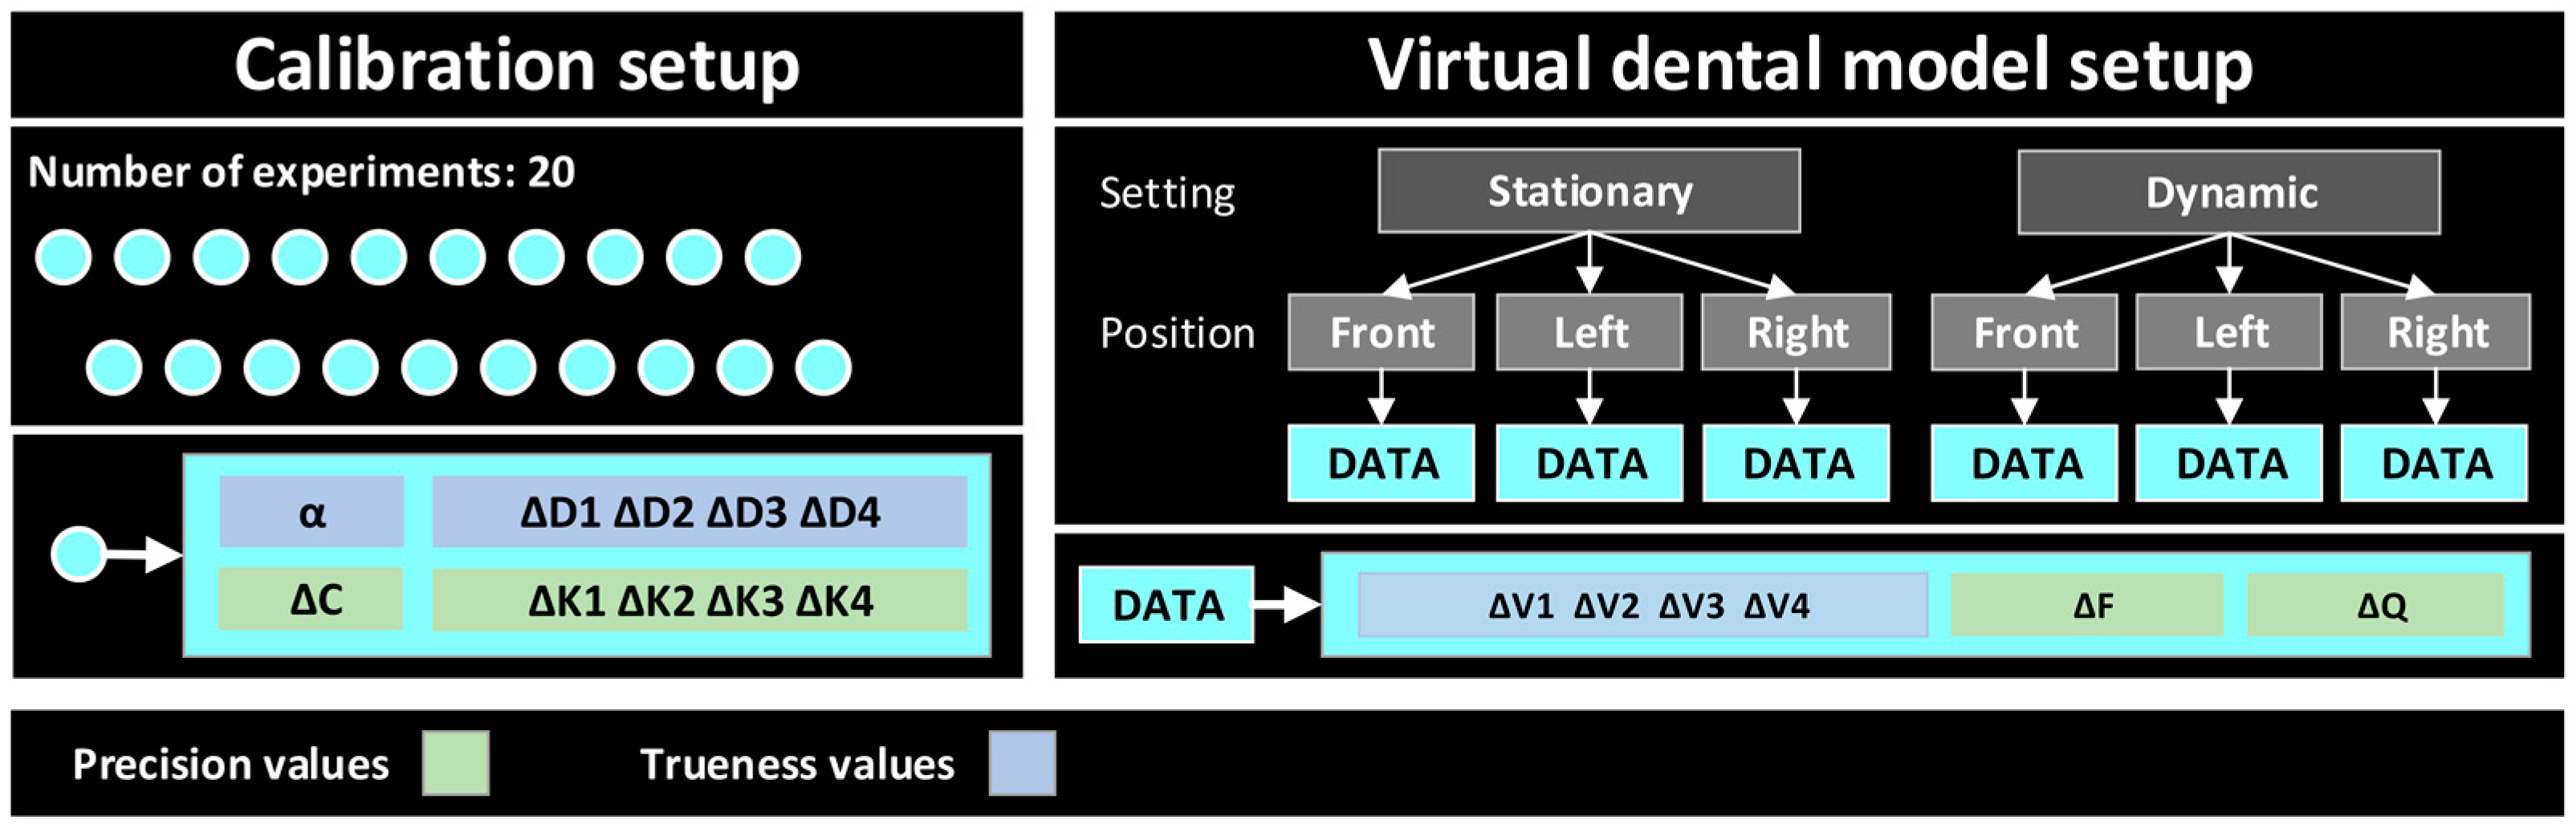
The scheme for all gathered data types is shown in
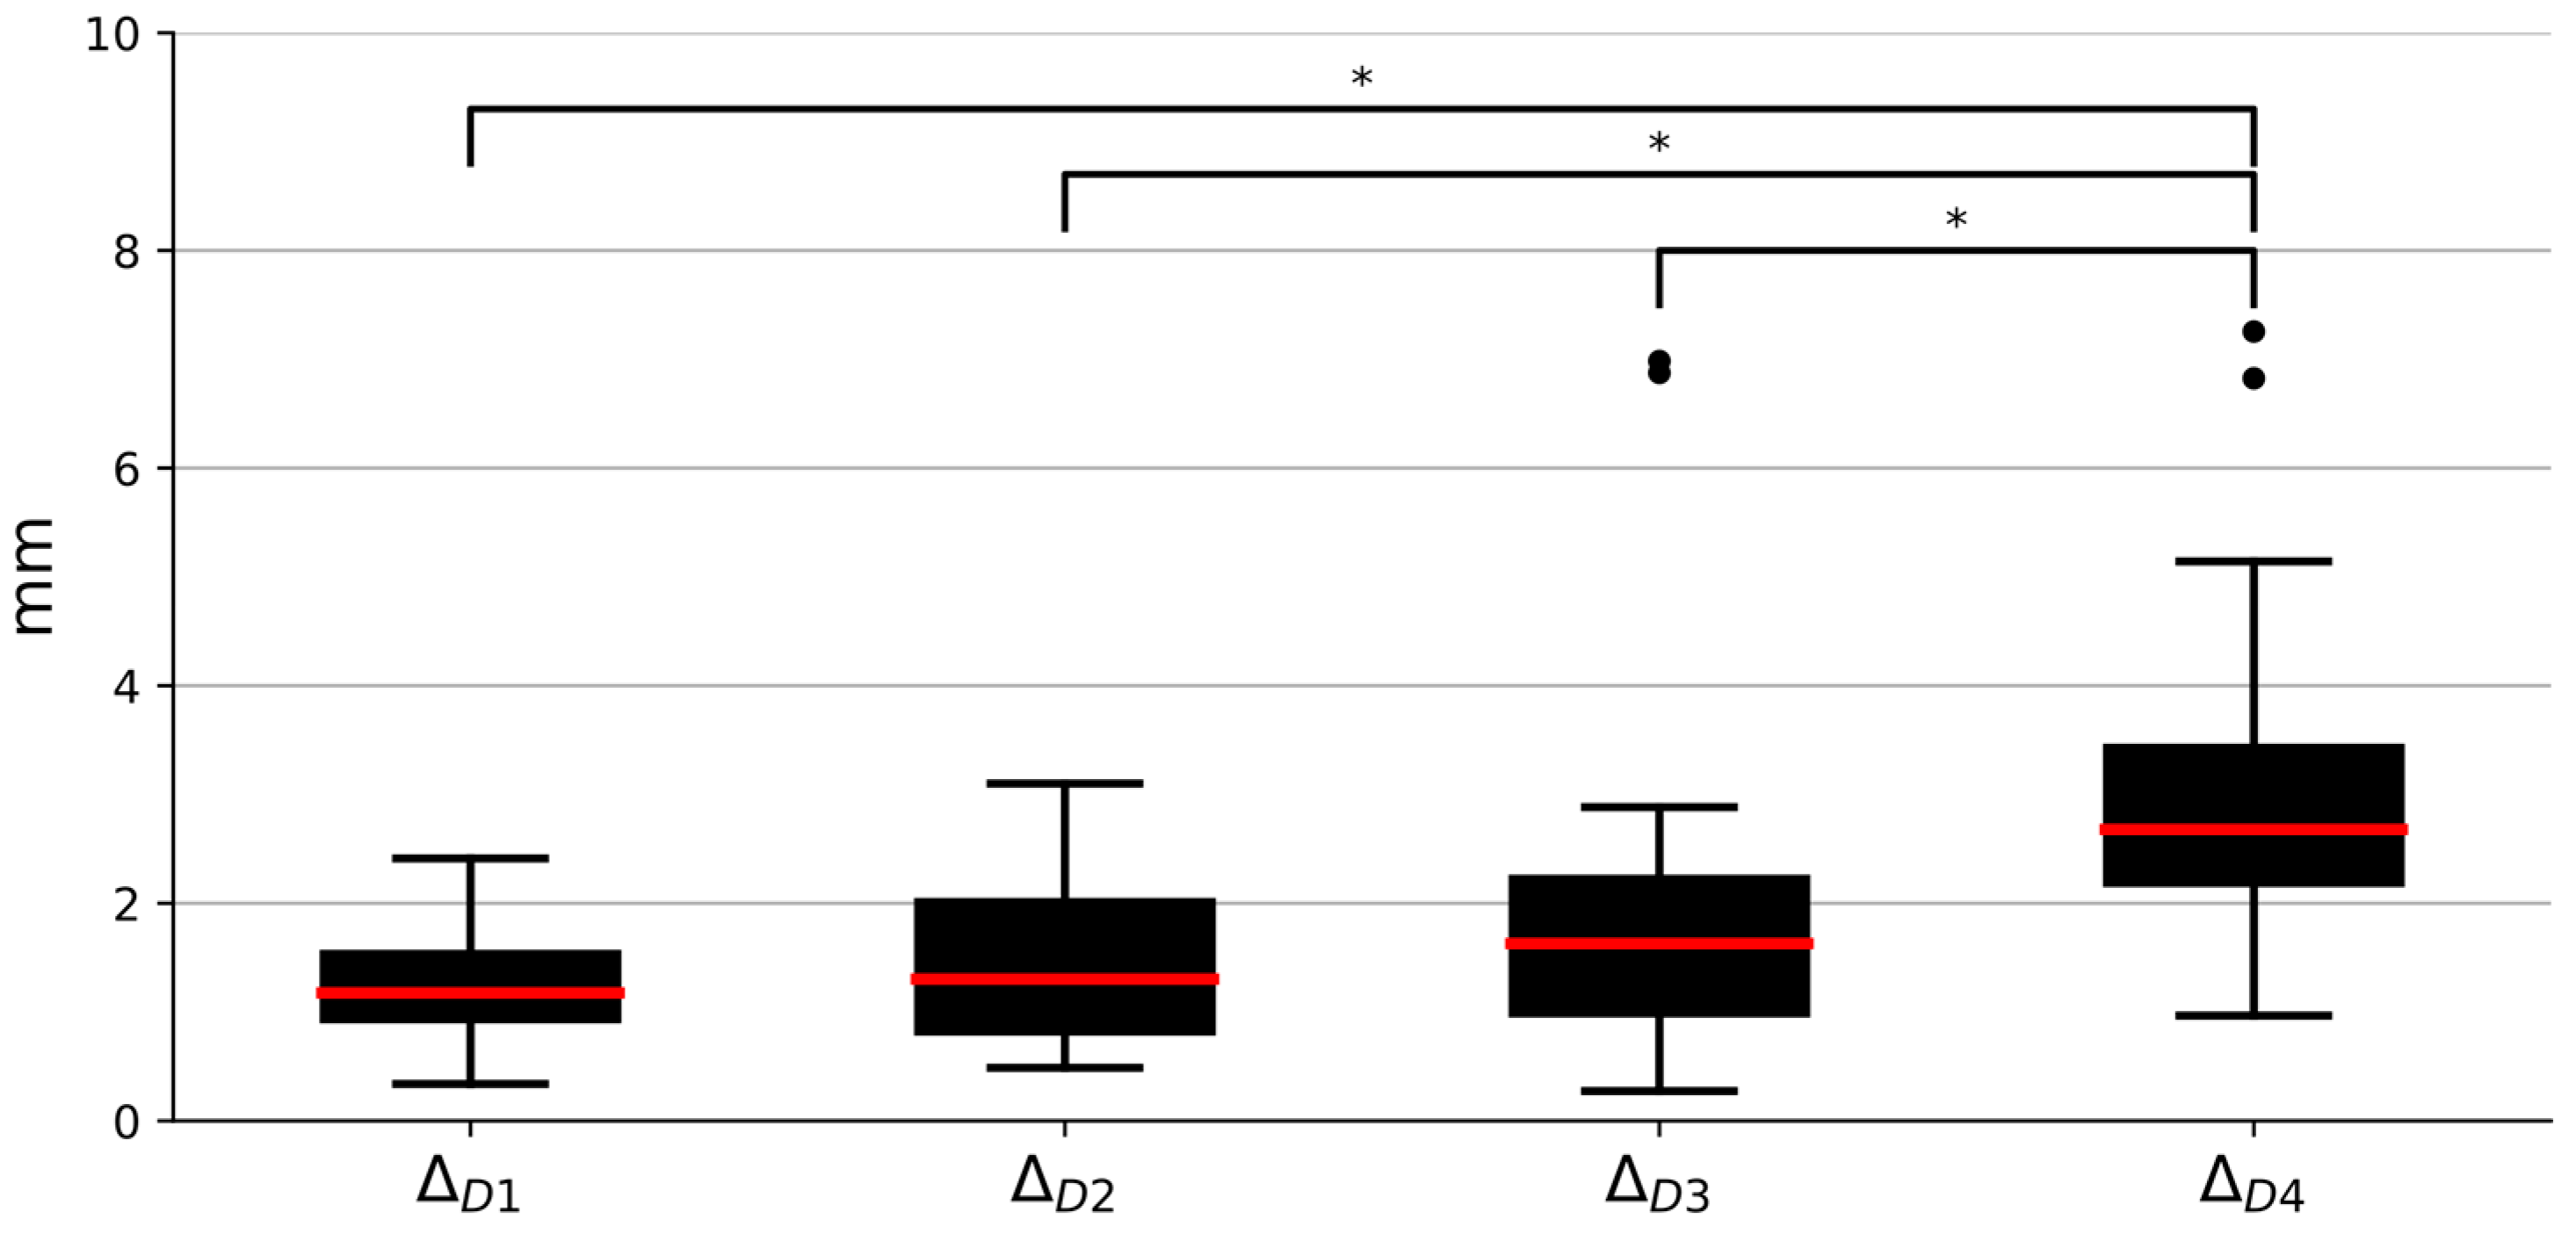
Figure 5. For statistical analysis of the calibration distance measurements, the data comparison between different point locations (∆
D1…4) was evaluated. The same principle was applied for precision data analysis, where comparisons of calibration (∆
K1…4) data sets were evaluated. Furthermore, comparisons were made between the positional data of marker point precision values (∆
Q) for each setting. Additionally, a comparison between each trueness data point location (∆
V1…4) in different settings and positions was estimated.
Data sets were subjected to the Shapiro–Wilk normality test with additional considerations of the results presented with quantile–quantile (Q-Q) plots. To verify the homogeneity of variance between data sets, Levene’s test was used. For data comparison the non-parametric Kruskal–Wallis test was used followed by Dunn’s post-hoc test. For all used statistical tests, the level of significance α = 0.05 was chosen.
5. Discussion
The advancement in augmented reality headsets has the potential to improve or even replace computer-aided dynamic navigational systems in implantology, making them more approachable for practitioners. This statement can be backed by the recent study by Mai et al., suggesting that the accuracy of dental implant navigation with the use of AR is comparable to conventional implant-guided techniques [
26].
This study evaluated the capabilities of the commercially available AR headset HoloLens 2 in the application of dentistry practice, specifically in implantology, using a custom-designed marker. Marker accuracy analysis was separated into two experimental setups: calibration and virtual model perception analysis. In calibration experiments, the majority of trueness and precision results surpass the 1 mm threshold in distance-related measurements (∆
D and ∆
K, respectively). Angle results disperse in a wide range, implying that the calibration results could contrast significantly after each calibration. In terms of dynamic navigation system accuracy, these calibration results could double the error in the commonly presented distance between the implant top (1.02 mm) and bottom bases (1.33 mm) or angle (3.59
)-related measures [
27]. Therefore, the use of additive error mitigation techniques should be applied for further use. The results of the perception accuracy of the virtual model showed a significant dependence on the settings. However, it is more prominent in trueness data than in precision data sets. This can be explained by complexity and made assumptions about the trueness data measurement scheme where video recordings were chosen instead of raw three-dimensional data. Furthermore, differences in positional data in both calibration and virtual model perspectives are noticeable. The result of the statistical analysis confirms it, which subsequently led to the rejection (
p 0.001) of both null hypotheses. It could be explained in two possible ways: changes in marker distance from the headset or changes in marker tracing reliability with changing angles.
One of the limitations of this study is the chosen marker and probe development procedure, which involves the overreliance on the existing Vuforia library for the creation of trackers. The choice of marker texture and dimensions was in accordance with the presented library guidelines, which limit the usage in the context of accuracy research. Although planar fiducial marker-based tracking is the most widely used method with HoloLens among researchers [
12], it is arguably not the only way for an AR headset to interact with the real world, as mentioned in the Introduction section (
Section 1). One proposal was made by Gsaxner et al. [
28], which involves retro-reflective spheres with a measured root mean square error of 1.7 mm and 1.11
compared to fiducial ArUco markers with 6.09 mm and 6.73
in distance- and angle-related measures. Another step further for registration and tracking is to detect and track the objects without relying on prior knowledge or the presence of predefined markers [
29]. This marker-less approach is still in the infant stage due to the current limited headset computational capabilities. However, the possibility to track the object without the use of any other secondary objects is promising since, in addition to the aforementioned sterility, it would free up the already confined surgery space. Furthermore, the mentioned trueness measurements from video data may be more conclusive if a reference measurement system was included. Lastly, the experiments were carried out by only one person, which arguably shows bias in the presented results.
Nevertheless, the second iteration of HoloLens is observed to have restricted use in applications that require high accuracy, as it barely reaches the millimeter range [
12,
30]; however, some promising results have begun to emerge [
25]. In this context, substituting existing dynamic navigation systems with the current HoloLens 2 headset is doubtful, even though it has found some success in other fields of surgery [
31]. However, there are field-focused devices, such as xVision (Augmedics Inc., Arlington Heights, IL, USA), that attempt to leverage technology to appropriate levels for medical use. Therefore, the safest practical application of HoloLens 2 in dynamic navigation systems is currently limited to merely displaying information translated from conventional systems [
23], without the use of its own sensors to track the scene during the surgery.
Future work should account for the proposition of other more sophisticated AR headsets with the inclusion of more appropriate tracking techniques. Since calibration is particularly important for further procedures, a more versatile calibration probe should also be prioritized.


 and
and 

