Abstract
The dominant technology in hard rock mining is drilling and blasting; therefore, the importance of fragment size estimation is an essential problem in the mining industry. By using a theoretical foundation that explains rock-fracturing mechanisms by blasting, a 3D fragmentation model with general applicability was developed. The main capabilities of the model are the ability to consider different and complex blasting patterns, both with parallel and non-parallel boreholes, and different explosive and rock properties. The geological input of the model is defined by generating the primary blocks within rock mass using discrete fracture networks. The model handles different, complex geological setups and blasting scenarios that include bench, ring, and tunneling blasting. Also, it considers borehole deviation, misfires, and the influence of previous blasts. Full-scale ring blasts were carried out to validate the model against real-world data, and the results showed a high level of agreement between model predictions and in situ data. In situ data were collected using image processing methodology and WipFrag v4 software. X50 and X80 size values showed a maximum error in prediction of around 15%, while R2 values between fragmentation curves were approximately 90% without a detailed model calibration to the obtained data.
1. Introduction
Hard rock mining relies on drilling and blasting technology as the dominant method for rock breaking and further mineral extraction. The methodology assumes that several drill holes are drilled in a specific pattern, filled with explosives, and initiated in a precisely defined order. Explosive detonation generates pressure wave and forms numerous fractures in the rock mass that intersect with preexisting rock joints and newly formed blast-induced fractures, eventually forming rock fragments of different sizes and shapes. Rock fragments form a muckpile that is loaded and carried to the mineral processing plant for further scaling and chemical treatment.
Different sizes and shapes of rock fragments are generated depending on the blasting pattern, type of explosives, and rock properties. Loading such rock is difficult if fragmentation is coarse, and further on-site scaling is required. This requires additional mining equipment, workforce, time to perform operations, and, from a business point of view, operational cost increases that could be avoided by better engineering. Difficulties also arise in processing plants where coarser fragmentation leads to faster wearing of the equipment and increased maintenance costs of crushing and grinding equipment, resulting in overall time and cost increase for production. On the other hand, finer fragmentation may result in losses if brittle minerals are extracted. Their improper blasting will result in a dust-like consistency that is hard to load and transport to a processing plant.
Different mining methods utilize different blasting patterns. Open-pit mining dominantly uses blasting patterns with parallel blast holes, and in such situations, fragmentation is easier to control by pattern adjustments. Also, the size distribution of rock fragments is much more uniform since the spacing between blast holes is uniform. Underground mining methods rely on various blasting patterns for rock breaking, where development openings are excavated using complex blasting patterns to achieve the desired shape of the opening. Yet, there is ring or fan blasting where blast holes in the pattern are differently spaced along their length. These situations result in ununiform fragment size distribution and loading difficulties, and additional scale requirements may result in much more complex problems for mining production. A typical case is a sublevel caving, where ring patterns are the base of the method and where fragments form gravity flow highly dependent on fragment size and spatial size distribution. Fragmentation in sublevel caving is one of the critical parameters and may compromise the whole method if blasting is not carried out with care.
Geology significantly impacts fragment formation since the structural setup of rock mass defines conditions in which fragments are formed. The spacing and orientation of rock joints have a significant impact since those joints prevent the propagation of blast-induced fractures [1,2,3]. Therefore, the primary rock blocks’ size, shape, and spatial distribution dominate fragment formation and are only partly considered by available models.
Estimating blast fragmentation has been essential in mining engineering practice and research, where different methodologies have been developed over a long time. The Kuz–Ram model is widely used for predicting blast fragmentation in mining operations. Based on Rosin–Rammler distribution [4,5,6,7], it is still the dominant methodology for blast fragmentation assessment, considering geological, drill, and blast properties. The model has been widely validated through field trials and found to be an acceptable predictor of blast fragmentation in various mining operations. The model can predict fragmentation using parallel blast holes, while ring blasting cases are not as extensively investigated [8].
Application of the Kuz–Ram model for ring blasting was investigated within the Kiruna and Malmberget mines in Sweden, with large-scale sublevel caving operations [8]. The Kuz–Ram model was modified to meet mines’ requirements where blast fragmentation significantly affects overall production effectiveness. The model had limitations due to the problems related to determining rock factors, mean fragment size, and handling of the area where rock is broken due to the crater effect. Representation of the primary rock blocks was identified as an issue as well. It should be noted that sublevel caving ring blasting is a specific case since it is done in confined conditions. The presence of fragmented rock in front of the free surface limits the movement of the blasted rock. It reduces its subsequent fragmentation related to fragment interaction and ground impact, which are common in unconfined blasting conditions.
Models developed by Julius Kruttschnitt Mineral Research Centre (JKMRC) are based on the Kuz–Ram model and tend to overcome its limitations regarding fines estimation. These are known as the “Two component model” [9] and “Crush zone model” [10,11]. Further improvements in fragmentation assessment, especially in the estimation of fines content and optimization, were made by introducing the Swebrec function [12]. The Fragmento model within JKSimBlast v2 software [13,14] made a step forward by providing capabilities to handle more complex blasting patterns used in underground mining.
Aegis [15,16] is a powerful tool used for blast design within underground mines focusing on ring blasting. Unlike other models, it analyzes not a single blast but the whole stope and provides optimal ring design considering all relevant factors. Its core is related to the breakage zone analysis around the explosive charges in 3D, making it possible to estimate the void space formed after the blasting and dilution while matching the desired fragmentation for the loading process.
The models mentioned above provide analytical solutions with acceptable prediction accuracy. As discussed herein, geological setup in available models is not represented in the most usual manner. Available methodology such as discrete fracture networks (DFN) [17] provides an opportunity to capture geological setup as it corresponds to reality and, more importantly, to provide spatial insight into the distribution of primary rock blocks that are being blasted. The first point in blast fragmentation analysis is primary block distribution in size and space. Additionally, rock joint distribution varies in space, and available models do not adequately capture this property. This means that variation in spacing, size, and orientation of joints is taken into account only by a single average value, which significantly simplifies the system. Numerical methods such as discrete element method (DEM) or its derivates are excellent tools for blasting process modeling [18,19,20,21]. These methods allow users to create detailed and complex models to obtain insight into the effects of specific blasts. Due to the modeling concept, the bonding of singular particles into macro objects, it is possible to simulate pressure wave propagation through the medium and analyze bond breaking over time. The downside of such an approach is an expensive simulation in the time and resources necessary to create and process those models.
The model herein tends to overcome other models’ issues and provide an efficient and reliable tool for blast fragmentation analysis. The model ground was set through the rock fracturing theory explaining blast-induced fracture formation mechanisms. Their interaction with preexisting joints in the rock mass and properties of the blasting process is herein considered.
2. Fragmentation Model Fundamentals
2.1. Fragmentation Mechanism
Explosive charge detonation creates a pressure wave in the surrounding rock that propagates around the blasthole and is transmitted from one “particle” to another. Bonds between particles are stressed in tension and break accordingly, while due to the circular/cylindrical shape of the pressure wave front, a radial pattern of fractures is formed (Figure 1). The forming of each fragment requires three fracture sets to be generated in mutually perpendicular positions. Hence, the length and density (spacing) of fractures in each set will determine its size. The foundation of the model presented herein is the rock fracturing theory [22], which provides constitutive relationships between rock and explosive properties for estimating the length and density of blast-induced fractures. The tensile nature of radial fractures is investigated numerically [23] and in practical identification [24].
Figure 1.
Schematic illustration of radial tension fractures formation [22].
The length of radial tension fractures that fall in a specific density zone is calculated according to the following relationship [22]:
where
- —crack zone radius;
- —borehole pressure;
- —borehole radius;
- ;
- —Poisson’s ratio;
- —tensile strength;
- n—number of fractures in the zone.
For a blasthole with radius and pressure in granite with a tensile strength of and Poisson’s ratio , the cracking zones are as presented in Figure 2.
Figure 2.
Radial tension fracture length and density around the blasthole [22].
The high energy of the pressure wave is transferred from particle to particle, and at a certain point, this load will reach boundary particles at the free surface (Figure 3). Due to highly different densities between air and rock medium, these particles have high acceleration towards void space and no rock particles to transmit the load. If the load is high enough, those particles form a tension fracture subparallel to the free surface and can practically be “torn” from the rest of the rock medium.
Figure 3.
Pressure wave reaching the free surface [22].
During the pressure wave propagation, each particle moves forward, transmits the load, and tends to return to its initial state. However, due to the plastic nature of rock medium, particles will return to a position different from their origin in relation to the elastic property of the rock medium or the recoverability of strain energy (Figure 4).
Figure 4.
Absorbed and recovered strain energy [22].
This phenomenon relationship was developed to estimate distances between tension fractures subparallel with the free surface [22]. First, tension fracture is formed at a distance:
where
- B—burden of an explosive charge ();
- —index of strain energy recoverability;
- —recoverable strain energy;
- —total strain energy (recoverable + absorbed).
The following tension crack forms at the distance b1 that is smaller than distance b since the tensile strain is larger, so distance b2 is smaller than b1 and so on (Figure 5).
Figure 5.
Formation of tension cracks subparallel with the free surface [22].
The radial tension fractures, after reaching the free surface, for a rock wedge that is being subjected to the loads and a third set of blast-induced fractures, are formed. This third set is perpendicular to the free surface or the face of the excavation (Figure 6).
Figure 6.
Formation of blast-induced fractures perpendicular to the free surface [22].
2.2. Principles of Rock Fragmentation by Blasting
Explosive charge detonation generates a pressure wave that propagates in a cylindrical shape around the blast hole. The propagation of a high-energy pressure wave results in a tensile load between rock particles and the formation of tensile fractures. Any existing discontinuities in the rock medium will prevent wave propagation between rock particles since there is no physical connection between them. Therefore, preexisting rock mass joints will limit the length of blast-induced fractures if their infill is weaker than the primary rock medium or if there is no infill material.
The principle, as mentioned earlier, is essential for rock mass blasting and proper blast design since primary block size and distribution in space will influence blasting results. Preexisting joints separate primary blocks in the rock mass, and to reduce their size by blasting, the explosive charge must pass through a single primary block. Otherwise, oversized fragments will be formed, which is an undesired outcome in every blasting situation, especially in underground environments with constrained space conditions. Besides constrained space, mining methods such as sublevel caving may experience significant performance decline and disruption of the gravity flow.
Figure 7 illustrates radial tension fracture formation in a monolith rock medium and fractured rock mass. This is one of the main principles used in the 3D fragmentation model presented in this paper.
Figure 7.
Tension crack formation in monolith and jointed rock.
3. Three-Dimensional Fragmentation Model
Excavation in hard rock by blasting assumes that explosive charges are placed in drilled holes ordered in specific patterns. Rock mass itself is defined as a set of rock blocks separated by joints known as primary rock blocks with their size. The blasting process removes parts of the rock mass and scales down the size of rock blocks (later fragments) to load and remove such material easily. In certain situations where rock mass is highly jointed, blasting is used only to initiate the movement of rock material so it can be loaded. The common practice assumes that the blasting process is designed so that the primary crushing process is avoided to reduce the costs of material handling after blasting.
Rock mass features, such as joints, stope shape, and blasting patterns, are easily geometrically represented; the model presented herein utilizes such geometrical features to define both size and spatial fragment distribution. Constitutive relationships for the estimation of blast-induced fracture lengths and densities around blast holes with spatial orientation and position of holes create a foundation for the analysis of rock breaking under complex conditions. Such capabilities make it possible to provide insights into rock fragmentation with both bench and ring blasting patterns, even patterns as complex as those found in development or tunneling blasts. Hole geometry can be captured accurately, making it possible to account for their deviations or exclude them from analysis in case of risk assessment for misfire occurrence.
The model is implemented as a Rhino3D plugin and relies on its API to analyze the fragmenting process. The plugin is written in C# and utilizes multithreading for computational efficiency since the concept is to estimate the size and position of many fragments, counting more than 100 k fragments for simple models.
3.1. Model Input
The fragmentation model was conceptualized to capture all input parameters of the blasting process, which are related to rock and explosive properties as well as the pattern being used. The rock properties required for the model are the tensile strength of monolith rock, its Poisson ratio, and strain energy recovery index. To model the blasting process in a representative geological setup, discrete fracture network (DFN) was used to represent the structure of the rock mass and its primary blocks.
Explosive properties are used to estimate pressure inside the borehole after its detonation. For these purposes, it is necessary to know the velocity of detonation (VOD) and density of the explosive since those parameters directly influence the resulting detonation pressure. Borehole and charge radius are required for the same purpose because the ratio between the hole and charge radius influences pressure reduction inside the borehole if those radii are not the same.
The third group of input parameters is related to the geometry of the blast and tends to capture the designed positions of the explosive charges, their orientation, and initiation sequence. Finally, a solid block representing a stope shape must be defined. The model input is illustrated in Figure 8.
Figure 8.
Fragmentation model input diagram.
3.2. Primary Blocks in the Rock Mass and Model Geometry
Proper blast fragmentation analysis requires that geological features are accounted for a significant impact on results. The model considers this by introducing a discrete fracture network (DFN) that describes the spatial distribution of preexisting joints in the rock mass that will impact pressure wave propagation in the rock mass. DFN captures orientation, size, and spacing between joints and is a well-known method in rock engineering used to represent the structural properties of the rock mass.
The model requires that the initial “solid” block is defined at the first step, and then, DFN is introduced for analysis. The goal is to obtain as representative as possible a primary block size distribution, which is performed by splitting the initial “solid” block by fractures in DFN. Firstly, fractures contained within DFN are sorted in descending order by size. The first fracture in the sequence splits the solid block completely, resulting in two newly formed blocks. The subsequent fracture in sequence splits the block, inside of which its centroid is located. This procedure repeats for all fractures in DFN. There is the second mode of splitting, where fractures are sorted in the same manner, but each fracture splits all the blocks it has intersected with. Which mode should be used is determined by returning to the structural setup of the certain rock mass. The result is a set of primary blocks distributed in space that is further to be fragmented by explosive charges that pass through them.
As previously said, only blocks intersecting with the borehole and containing an explosive charge within will be fragmented by explosive detonation. Figure 9 illustrates the process of model geometry preparation, where the block to be mined is split by preexisting joints, and a set of primary blocks is defined. In the next step, explosive charges are incorporated into the model. As can be seen, some of the primary blocks do not or only partially contain an explosive charge inside them.
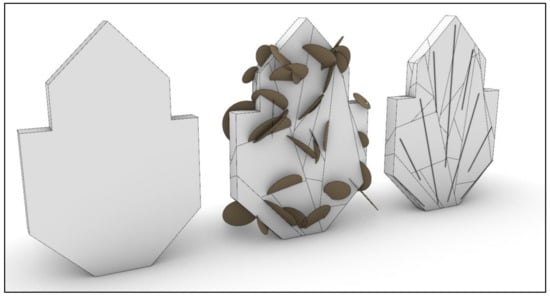
Figure 9.
Initial model geometry.
Each explosive charge is defined by explosive properties (density and detonation velocity) that determine the pressure inside the blast hole. The geometry of the blasting pattern defines the position of each charge. Each charge is labeled by its number in the initiation sequence within the pattern.
3.3. Blasting Patterns and Charge Initiation Sequence
Mining production in hard rock, where blasting is the primary excavation technique, assumes the application of different blasting patterns suitable for given conditions. Open-pit and most underground mining methods rely on blasting patterns where boreholes are parallel, which is simple and efficient in design and execution. However, there are methods where ring blasting with non-parallel boreholes is applied in underground mining conditions.
The problem with non-parallel boreholes is that the spacing of explosive charges is not even along the borehole’s axis, so rock fragmentation is influenced. This is especially emphasized in underground mining conditions since areas where explosive charges are close to each other may experience excessive generation of fines or overbreak of the rock mass. Fines usually do not provide additional operational problems except for larger explosive consumption or mineral losses, while overbreak may influence difficulties in subsequent blasts. In cases where ring blasts are not adequately designed, oversized rock blocks are encountered, raising the need for downsizing and increasing time consumption. Non-uniform spatial size distribution of blasted fragments has the most influence in sublevel caving operations, directly impacting gravity flow and economic outcome. In summary, proper estimation of fragment size distribution and even their spatial positions has a crucial impact on mining and economic efficiency.
The model presented herein can handle parallel, non-parallel, or even arbitrarily placed boreholes. Each explosive charge is represented by a line or polyline using Rhino3D built-in capabilities. Therefore, every charge has its properties, such as spatial position, length, and direction, that determine its interaction with primary rock blocks and other charges. The initiation sequence is a critical parameter for successful blasting, and each charge in the model is assigned a unique number representing its position in the firing sequence (Figure 10). This is carried out during the model preparation phase and is a mandatory parameter.
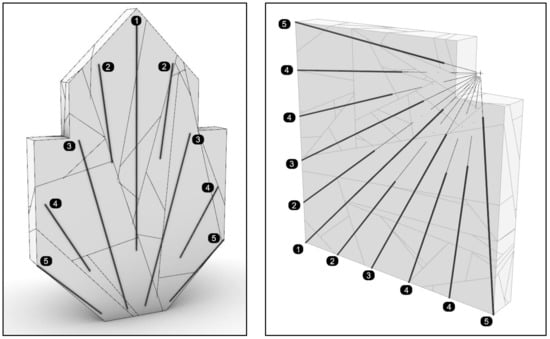
Figure 10.
Explosive charge sequencing within blasting patterns.
Besides mentioned, the influence of previously fired explosive charges is also considered. Previous charges induce additional fractures in the rock mass, changing initial conditions for fragmentation analysis. Only radial fractures are considered within previous explosive charges since pressure wave propagation will not reach the free surface, and its energy will be spent without forming other fracture sets.
3.4. Fragments Computation
Fragment computation is carried out by splitting previously generated primary blocks in an analogous process, as described in Section 3.2. The process consists of several steps that repeat for each explosive charge in the sequence. At first, borehole orientation is determined, and primary blocks intersected by explosive charge are selected for further splitting. As stated in Section 2.2, only blocks that contain an explosive charge within them will be fragmented and subjected to the influence of explosive detonation and the resulting pressure wave. In this procedure, the length of the total explosive charge is increased to account for the crater effect at the ends of the explosive charge. This increase is equal to 70% of the burden (B). Figure 11 illustrates the complete fragmentation process.
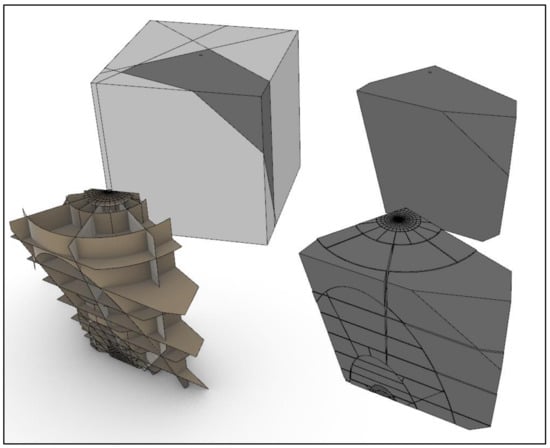
Figure 11.
Schematic presentation of the fragment computation procedure.
Secondly, blast-induced fractures are generated along the blasthole axis, with size and density explained in Section 2.1. Each filtered primary block is then subjected to the splitting process, where generated fractures are sorted in descending order by their size. Then, it is tested if the fracture completely splits a single block. If the fracture is not splitting the block completely, then the splitting of the block is determined by the percentage of the block being cut by that same fracture. If the area of intersection is more than 50% of the total cross-section area along that fracture, the block is split and vice versa. If the fracture splits a completely tested block, then two new blocks, now fragments, are created, and both of these new fragments are tested for splitting against remaining blast-induced fractures. If no new fragments are made from the current primary block, the splitting process is continued to the following primary block in sequence until all selected blocks are tested for splitting against blast-induced fractures from the current charge. This process repeats for every explosive charge in sequence.
3.5. Postprocessing
Different shapes and dimensions of fragments are created during fragment computation by splitting primary rock blocks. In some cases, elongated or thin fragment shapes are computed, which is usually a rare or impossible situation in practice due to material movement and interaction leading to additional fragment splitting. To obtain results as close to reality as possible, postprocessing of fragments is performed at the end of the computation cycle.
This process consists of analyzing each fragment and determining its elongation or thickness, assuming the resulting fragments will be close to an isometric shape. Fragment dimensions are determined along its axes; if the ratio between the longest and shortest axis exceeds 1.5 fragment, it is then split into halves at the middle of the long axis. This iterative process repeats until all newly formed fragments satisfy the defined criteria. Figure 12 illustrates this procedure and its outcome.
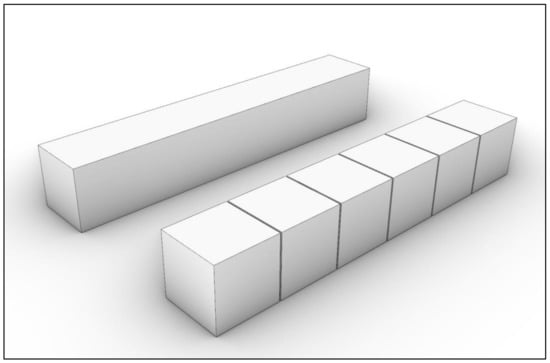
Figure 12.
Illustrated post-processing procedure.
3.6. Fragmentation Analysis
After the generation of fragments, their size distribution is determined by analyzing each fragment. In practice, this is determined by sieve analysis, where fragments are classified by their remaining quantity at each standardized size class [25]. Results obtained in this manner consist of known sieve size and the measured amount of material for that class. In the end, a graphical expression of the results is performed.
For each fragment, its size is determined by computing the bounding box of the fragment and then determining the longest edge of the bounding box. In such a manner, the fragment size determination is as close to the sieve analysis as possible. To determine the final size distribution of generated fragments, it is necessary to understand mass distribution by computing each fragment’s volume using Rhino3D’s built-in capability.
3.7. Range of Application
The model can capture fragmentation by blasting in most common blasting scenarios and therefore has general applicability. The range of applicability covers blasting of different scales and pattern complexity.
Even if not used besides in research, the first application case is the possibility of modeling fragmentation of specimen-sized monolith rocks blasted in a laboratory environment. Such cases are reported in the literature [26] and are used for blasting process optimization where laboratory results are scaled up to the in situ application. Figure 13 illustrates an example on a laboratory-scale rock specimen blasted with a single explosive charge along the specimen’s long axis.
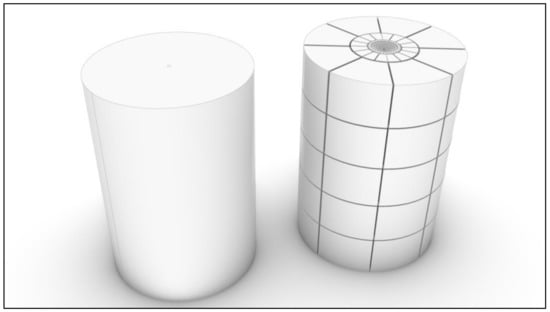
Figure 13.
Specimen blasting on a laboratory scale.
The fragmentation model’s general applicability is further explained by its ability to model blasting with parallel and non-parallel explosive charges. For the model capability explanation’s sake, each explosive charge may be of different explosive types and sizes. The most common blasting situation in both surface and underground conditions is bench blasting, i.e., a case where explosive charges are parallel. Also, spacing between explosive charges is uniform in this case, and the resulting fragmentation has even spatial distribution with minor or no variations.
In underground mining, many blasting scenarios are used, especially with ring blasting, where highly complex cases may occur. This relates to cases with sublevel open stoping mines where single sublevel drift ring designs may vary depending on ore body morphology. Ring blasting scenarios have already been discussed in more detail within previous chapters, and examples were given.
The development of underground mines in hard rock conditions differs from typical production blasts due to pattern complexity and initiation sequence. These blasts start with closely spaced cut boreholes, usually spaced by 20 cm, in order to open additional free surfaces. The cut is followed by additional boreholes placed around it. Still, the spacing between those boreholes is subsequently increased until the final spacing (burden) is reached, or the contour of the underground opening is reached. In such cases, the fragmentation of blasted material is different in each blasting sequence only because of spacing between boreholes, which creates an extremely difficult case for fragmentation estimation. The practice has shown that most such blasts result in fine fragmentation where explosive usage is increased above the optimal level. The jointing conditions of the rock mass may influence oversized fragmentation and difficulties with the loading process if such a case is not predicted and adequately solved.
Currently, available models do not provide such capabilities for fragmentation estimate in tunneling; therefore, herein, this capability is presented for the case of underground mine development. Figure 14 illustrates the blasting pattern used for model capability illustration. As seen, there are different zones where the spacing between boreholes and their spacing away from the free surface is different, and therefore, the fragment size will differ in each zone (Figure 15).
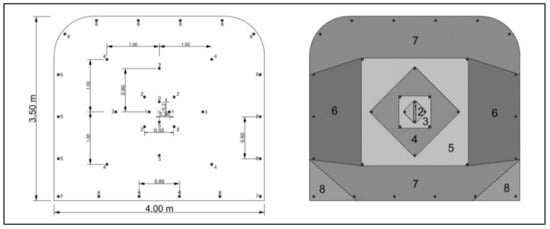
Figure 14.
Blasting pattern with initiation and fracturing sequence.
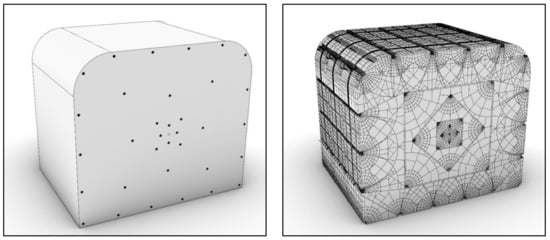
Figure 15.
Model before and after processing.
3.8. Consideration of Previous Blasts
Each blast will result in more or less damage to the surrounding rock mass by inducing additional fractures, hence reducing the size of the primary blocks. This damage may be significant in production blasting, and its influence on fragmentation is an essential factor to consider.
The 3D fragmentation model considers the influence of the previous blasting by generating radial blast-induced fractures from the location of the previous blasting pattern. Although it is not required, the user can specify a previously used blasting pattern that may be the same or different as the main blasting pattern, and the model will generate additional fractures to be considered in the fragment computation stage.
3.9. Consideration of Borehole Deviations and Charge Misfire
Modern mining production relies on drilling long boreholes with a length that exceeds several decameters. In such a manner, production is optimized so that less labor and fewer materials are used per unit of production, resulting in overall cost reduction. Such long boreholes will have deviations depending on the quality of the drilling equipment, rock conditions, and drilling pattern. Borehole deviation may influence significant problems in production, especially in mining methods where drilling precision is a crucial parameter, such as ring blasting in underground conditions where deviation influence is highly emphasized. Deviation influences larger spacing between explosive charges, leading to coarser fragmentation in that area or increased fines in an area where explosive charges are brought closer. Implications are sometimes so severe that the stoping process may be compromised.
The model can analyze the influence of both deviated boreholes and undetonated explosive charges on fragmentation outcome.
Borehole deviation is considered straightforward since blast-induced fractures are generated around a curve representing the borehole axis. Primary blocks to be tested for splitting are filtered by the intersection of such deviated boreholes and primary blocks. The main difference in this case compared to ideally drilled boreholes is that the spatial position of blast-induced fractures is changed, meaning that certain fragmentation zones within primary blocks will have limited extents, and final results vary accordingly.
Misfire means that certain explosive charges in sequence failed to be initiated for some reason, and this process is modeled by excluding this explosive charge from the initiation sequence. This results in unfragmented primary blocks that would be fragmented otherwise by the explosive charge that suffered a malfunction (Figure 16).
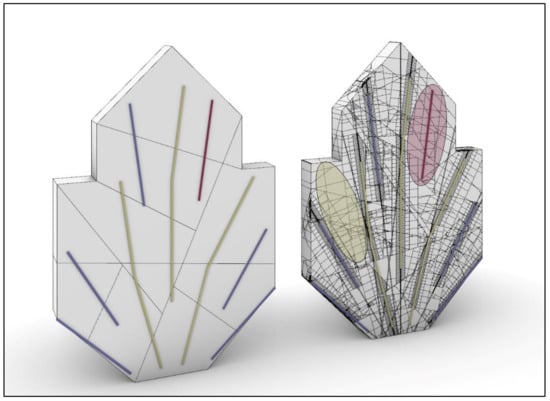
Figure 16.
Borehole deviation and charge misfire modeling.
3.10. Batch Processing for Multiple Scenarios Consideration
Rhino3D has built-in scripting capabilities with Python programming language [27] that make it possible to perform batch processing of specific models and test them against input data variations.
This makes it easy to support decision making about what drill and blast parameters will provide optimal fragmentation for the given conditions. Testing the influence of different borehole diameters and different explosives may provide insight into the best economical excavation solution. Different hole diameters may influence equipment selection and drilling speed, where significant cost optimization may occur, as well as the selection of proper explosive type with its contribution to overall cost optimization.
Python scripts in Rhino allow the user to utilize Rhino commands or plug-in commands and manipulate them according to their needs. This means the user may repeatedly use the same command with different input parameters to achieve the ultimate goal. Similarly, python script can process the same model geometry against different input data, such as blasthole diameters and explosive properties, or even generate different DFN variants to achieve a broad spectrum of results.
After numerous fragmentation curves are available, it is significantly easier to make the proper decisions regarding what drill and blast parameters are optimal and what the possible outcomes are. Besides determining optimal drill and blast parameters, it is possible to predict the probability of oversized blocks and improve plans and schedules accordingly. Also, the economic assessment may imply that adjusting the blasting pattern by inserting additional boreholes may be more cost-effective than handling oversized blocks after the blasting.
3.11. Model Parameters Variability Influence on Fragmentation
To be a valid, a model has to provide results that are close to those expected before its calibration as well as behave according to practically determined and logical patterns. This section provides insight into model behavior against different input parameter values.
3.11.1. Variation of Explosive Properties
Explosive properties are the main parameters influencing fragmentation outcomes by influencing different pressures inside the blasthole. The achieved pressure will directly affect the size of the cracking zones around explosive charge and, therefore, the size of the fragments.
Several parameters have an impact on pressure, and those are explosive density and velocity of detonation as well as hole diameter, which has an impact on the amount of explosives in the charge. The effect of increasing any of the aforementioned parameters is increased borehole pressure. Increased pressure will influence finer fragmentation and vice versa.
3.11.2. Rock Strength Influence
The influence of rock tensile strength on fragmentation is the opposite of the explosive pressure influence, meaning that with lower tensile strength, the cracking radii are larger and vice versa. The fragmentation model considers this at the fundamental level of its formulation.
3.11.3. Rock Mass Jointing Influence on Fragmentation
The influence of rock joints on the size of blasted fragments is seen through two separate influences. First, joints are discontinuities in rock medium and will limit propagation of the pressure wave and, therefore, the extent of blast-induced fractures if there is soft or no infill inside the joints. Second, joint orientation also influences the blast-induced fracture extent, where the most significant influence is seen when the orientation of rock joints is approximately perpendicular to the blast-induced fracture or close to parallel orientation with a free surface. Otherwise, when the orientation of the rock joints is close to parallel to the orientation of blast-induced fractures, the influence is reduced or negligible. The density of the pre-existing rock joints will impact the size of the primary rock blocks, and when there is an increased number of natural joints, and primary blocks are smaller in size, the influence of the explosive on further fragmentation is reduced. This also means that the influence of blast-induced fractures is increased with larger primary blocks. These are incorporated into the model using DFN as the main parameter to determine the primary block size. DFN usually contains the spatial variability of jointing in the rock mass, meaning that differently positioned stopes can be modeled in a representative manner by means of structural setup.
4. Case Study
4.1. Model Setup and In-Situ Conditions
A full-scale in-situ test was carried out to validate the fragmentation model. The test was carried out in an underground copper porphyry mine where the sublevel open stoping mining method uses a ring blasting pattern. The fragmentation model uses relevant laboratory rock mechanics data, in situ geological survey of rock joints, and blasting properties used for production. Fragmentation analysis was carried out by WipFrag [28] image processing methodology [29,30,31].
A geological survey of the production drifts determined there are three joint sets (Table 1), with joints without any infill and open. A small percentage of joints (10–15%) are filled with soft material, and since the pressure wave cannot propagate through this material with the same velocity as it propagates in the main rock, these joints are treated as open and are a limiting factor for blast-induced fractures. The stope azimuth is 75 degrees, and its orientation is accounted for in the primary block generation process.

Table 1.
Joint orientation and spacing.
Rock strength has been determined by standard rock mechanics testing, and herein, relevant data for the fragmentation model is reported:
Tensile strength—5 MPa (average);
Poisson ratio—0.21 (average);
Explosive properties are given in Table 2.
Table 2.
Explosive properties.
Blasting is carried out by ring pattern, as illustrated in Figure 17, showing the complete model setup. The borehole diameter is 76 mm, and explosive charging is optimized, as is seen in Figure 17, where only explosive charges are emphasized.
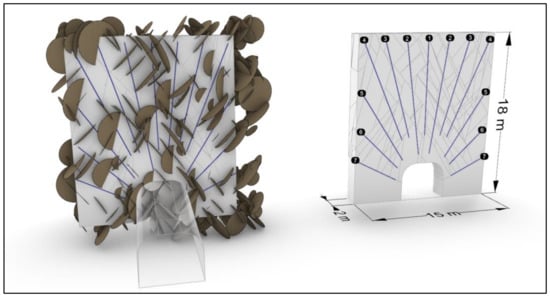
Figure 17.
Fragmentation model setup.
To make the model as representative as possible, the influence of the previous blasting is accounted for in the model with the same pattern and explosive parameters. Blast-induced fractures of the prior blast are only radial and will influence less-coarse fragmentation.
4.2. Burden Analysis and Model Pre-Calibration
In situ production blasts use the explosives and pattern described in previous paragraphs. The burden for the explosive charges is 2 m. The fragmentation model determines the burden by the following expression [22]:
where
- —borehole pressure;
- —borehole radius;
- ;
- —Poisson’s ratio;
- —tensile strength.
Borehole pressure is determined according to the Chapman–Jouguet detonation theory [32,33], and expression for explosives with density above 1 g/cm3 is as follows:
where
- ρe—density of explosive (g/cm3);
- D—detonation velocity of explosive (km/s).
For explosives with a density below 1 g/cm3, the pressure on the blasthole walls is calculated as follows:
Therefore, for rock with a tensile strength of 5 MPa that is blasted with 76 mm ANFO charge with VOD of 2000 m/s and density of 0.9 g/cm3, the burden equals approximately 1 m. This is two times smaller than the actual case. With such burden value and model setup, as previously explained, the fragmentation model would compute blast-induced fractures that are too small, and complete fragment computation would not be possible. The reason for such discrepancy is within the pressure calculation formula.
To overcome pressure formula limitations, the model was pre-calibrated by increasing borehole pressure to achieve a burden of the same size as was used in production. This means that borehole pressure increased from an initial value of 0.8 GPa to 1.68 GPa, corresponding with a burden of 2.01 m in the model.
4.3. Results
In situ data were collected within the stope approximately one hour after the blasting and before loading the muckpile. Data were compiled using the latest-technology cellphone with a high-performance camera and pair of mobile LED reflectors. The lighting and camera positioning were fixed, as suggested by WipFrag’s “Sampling and Analysis guide”. Image processing was performed by qualified technicians using MailFrag service, and the obtained results from two underground blasts using a ring blasting pattern are shown in Figure 18. The fragmentation model was prepared as previously described and pre-calibrated for the burden used for stope blasting. A comparison between two in situ blasts and model results is given in Figure 19.
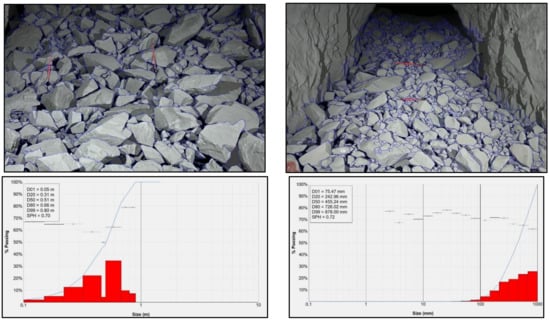
Figure 18.
Survey results for blasts B1 and B2 using WipFrag image analysis software.
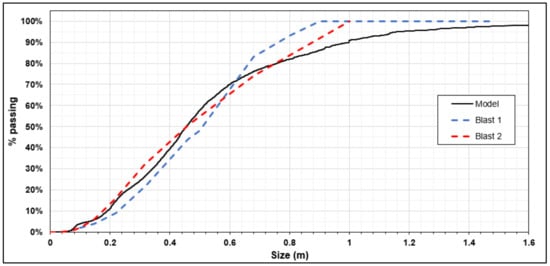
Figure 19.
Fragment size distribution comparison between model and in situ blasts.
As can be seen from Figure 19, fragment size distribution between the model and in situ blasts showed a high level of agreement between fragmentation curves. In the first 40% of the diagram, the model curve passes between two in situ curves, where excellent prediction is made for the given conditions. General agreement between the model and in situ data continues up to 80% of the diagram, with slight variations that have no significant importance for the overall result. Fragment size for the X50 values between the model and blast B2 are the same, while the same value compared with blast B1 has an 11.76% relative error. In the case of the X80 values, the model prediction has higher values than those measured, where the relative error between the model and blast B2 is 4.11%, and between the model and blast B1, it is 15.15%. Considering these errors for the X50 and X80 values, it can be stated that the model prediction has high reliability (Table 3).
Table 3.
Fragments size distribution for model and in situ blasts with errors.
The model generally agrees better with blast B2, where a relative error has a maximum value of 13.33% for a range between X10–X80. In the case of blast B1, relative errors are slightly higher than with a second blast, and for the size range of X10–X80, the maximum relative error is 17.39% for the X10 sizes.
The size range above X80 shows that model prediction has increased relative error in both cases, where the comparison with blast B1 has a 31.58% difference, and B2 has only 13.64%. The maximum estimated value according to the model is significantly higher than those measured in situ. Even though this is only a small fraction of the total muckpile maximum size, this may imply the necessity for further scaling of the material. Reasons for this discrepancy may be found in the model and the image processing size distribution methodology. As with any other digital model, the first model may provide errors due to imperfections and inevitable simplifications of reality. In other words, capturing exact in situ conditions and representing them within models is still impossible. Also, due to its nature, the mining industry is one of the few where data variations are increased. Another possible reason for the discrepancy between the maximum sizes may be that by image processing methodology, one captures only one part of the muckpile that is available for photographs. This means that the actual fragment size may differ from the one that is determined, and some fragments are not shown, as they are found within the deeper part of the muckpile.
In means of an agreement between fragmentation curves, it can be said that R2 values are 89.97% between the model and blast B1 and 92.48% between the model and blast B2. These values are high and obtained by only a pre-calibration procedure based on burden analysis.
5. Discussion
The fragmentation model presented herein is based on theoretical work that describes the rock fracturing mechanism by blasting [22]. This work has been previously applied for estimating blast-induced damage of underground openings [34], and its further applicability was continued by constituting a 3D fragmentation model with general applicability, which is the subject of this manuscript.
As explained in previous chapters, the model has general applicability in considering different blasting patterns and variations of both rock, explosive, and geometrical parameters of the blasting. It reflects the variation of input parameters as expected, meaning that the model constitution may be considered valid since it incorporates all essential parameters, and results are affected by their variability in an expected manner. This means that pressure increase will lead to finer fragmentation, as is the case with decreasing rock strength. Also, the same is true considering the influence of the previous blasts, DFN parameter change, and geometry variation of the stope and blasting patterns. It is important to state that model is in its prototype stage of development, and further improvement and capability development is expected.
In terms of comparison with other available models, the model presented herein has the potential of application to any blasting scenario used in practice, whether it is bench, ring, or tunneling blast; even arbitrary blasting patterns could be analyzed. Other models are case-specific and usually work with one of the possible scenarios, while their modifications to work in more general applications did not provide significant results. Being developed in 3D space, it can handle the spatial variability of rock mass structural and mechanical properties in space and handle borehole deviations, misfires, and different explosive properties. All these capabilities contribute to the universality of the proposed model.
Further development should consider the efficient handling of complex blasting patterns with a large number of boreholes, and this is a code-wise improvement. Core capabilities will consider blasting in different crustal stress conditions and its influence on blast-induced fracture length and orientation, which is especially important for deep underground mines. Blasting in confined conditions, such as in sublevel caving mines, is one of the research topics where the model could provide new insights, especially if coupled with gravity flow models, to assess the fragmentation influence on the recovery and dilution of ore. Due to the geometrical foundation of the model, fragmentation results are easily exported to the discrete element codes where each fragment can be modeled at its place of formation. Also, this relates to panel caving mines, where undercutting operations rely on ring blasting and where optimal ring blasting may influence cost reduction and overall productivity improvement.
Regarding model validation against real-world data, several full-scale ring blasts were carried out to compare model results. The model generally agrees with in situ blasts, where R2 values are around 90% for both cases. If X50 and X80 values are compared, the maximum error between the model and tests is around 15%, which is, in practical means, excellent prediction. A higher discrepancy between the model and tests is seen in values above X90 and in determining the maximum fragment size. This may be for different reasons associated with model and fragmentation survey methodology. As said, the model was only simply pre-calibrated by burden analysis, and no post calibration was carried out. Since the model creates fragments in the form of geometrical solids, there is the capability to identify fragments or areas of the model where the discrepancy is found and then to treat that area differently to match in situ data. Other options may include calibration of the model in depth to match the specific location in a best-fit manner by adjusting the model core parameters. Since all input data come with certain variations, generating multiple scenarios and running simulations is possible considering the full spectra of data variation. This could cover all possible outcomes for the given data set. Also, image processing methodology has limitations since it considers only the fragments exposed to the surface, while other fragments of different sizes that may influence overall size distribution may lay within the muckpile and not be seen.
Finally, the results show good agreement between the model and full-scale tests, proving the fragmentation model’s general functionality. The main goal, to provide a general applicability fragmentation model, has been reached in its prototype stage, and all further improvements will positively benefit its prediction accuracy.
6. Conclusions
The model’s universal functionality is seen in its capability to model all blasting cases used in practice, which shows its robustness. Bench blasting is typical in surface and underground mining, where parallel boreholes are used. This simple situation means that all boreholes are parallel and equally distanced among themselves, resulting in even fragmentation within the blasted block. A much more complex case is ring blasting, where explosive charges are placed with different spacing between them within a single pattern. The model can capture this case accurately and has been tested against such cases in practice. Further, the model can provide estimates for complex blasting patterns, such as in tunneling or underground mining development. This case is specific since the spacing between boreholes changes during the firing sequence, and boreholes may be parallel or non-parallel among themselves. Besides those mentioned earlier, the model captures the influence of the previous blasts, borehole deviation, and misfires that significantly influence the overall fragmentation results.
A case study is provided to validate the model where model prediction is compared with two ring blasts from the underground mine. The setup of the model is such that it captured the exact blasting pattern used for the stope blasting with the same firing sequence. At the same time, the primary block size was estimated by generating DFN from the available joint survey.
Initial burden analysis showed that pressure estimation formulas used for the model resulted in much lower borehole pressures impacting the high difference between model and in situ burdens of explosive charges. For such reasons, the model was pre-calibrated to operate with borehole pressure that would result in the same 2 m burden that is found in stope blasting. The fragmentation survey was provided using the image processing software WipFrag v4 and following their sampling and analysis guides.
The obtained results showed that the relative error for X50 values is 11.76% for the first blast, while the second blast and model X50 values are the same. X80 value-relative errors are 15.15% and 4.11%, respectively. This means that model prediction is accurate within this size range. The maximum error found for the size range between X10 and X80 is around 17%. Size prediction for the range of X80–X90 shows an increased error of 13% and 30%, respectively, for blasts B1 and B2, and the maximum predicted value is also significantly larger in the model than for the case of in situ tests. This issue is discussed, and several reasons are possible causes for this. First, the model was only pre-calibrated, and no post-calibration procedures were carried out to adjust the model to the obtained results. Therefore, the model could be recalibrated to provide the best fit for the specific location. However, the critical point here is to validate the general model functionalities and determine if the results fall within the reasonable scope of expected values that have been proven. Comparing obtained curves from the model and in situ tests, it was determined that R2 values are 89.97% and 92.48%, demonstrating the model’s reliable estimate.
At its prototype stage, the model shows a high level of agreement compared with full-scale in situ ring blasting tests and a simple pre-calibration procedure. With further development of the model, the main idea is to improve its computational speed and resource usage. This could provide the possibility of modeling complex scenarios with millions of fragments to be generated, considering complex DFNs, and using real-world drilling data. Also, a standardized calibration procedure utilizing modern AI or ML tools might be developed to decrease estimation errors for each size class by adjusting the model to certain conditions.
Author Contributions
V.L. and S.T. formulated and implemented fragmentation model; V.L., M.S. and I.V. designed in situ tests and collected and processed dana; V.L. wrote the paper. All authors have read and agreed to the published version of the manuscript.
Funding
This research received no external funding.
Conflicts of Interest
The authors declare no conflict of interest.
References
- Wang, Z.L.; Konietzky, H.; Shen, R.F. Coupled finite element and discrete element method for underground blast in faulted rock masses. Soil Dyn. Earthq. Eng. 2009, 29, 939–945. [Google Scholar] [CrossRef]
- Chakraborty, K.; Jethwa, J.L.; Paithankar, A.G. Effects of joint orientation and rock mass quality on tunnel blasting. Eng. Geol. 1994, 37, 247–262. [Google Scholar] [CrossRef]
- Hyldahl, J. Effects of Jointing on Fragmentation: Design and Influence of Joints in Small Scale Testing; Luleå University of Technology: Luleå, Sweden, 2018. [Google Scholar]
- Cunningham, C. The Kuz-Ram model for prediction of fragmentation from blasting. In Proceedings of the 1st International Symposium on Rock Fragmentation by Blasting, Luleå, Sweden, 23–26 August 1983. [Google Scholar]
- Cunningham, C.V.B. Fragmentation estimations and the Kuz-Ram model-four years on. In Proceedings of the 2nd International Symposium on Rock Fragmentation by Blasting, Keystone, CO, USA, 23–26 August 1987. [Google Scholar]
- Cunningham, C.V.B. The Kuz-Ram fragmentation model–20 years on. In Proceedings of the 20th ACM Symposium on Operating Systems Principles, SOSP 2005, Brighton, UK, 23–26 October 2005. [Google Scholar]
- Kuznetsov, V.M. The mean diameter of the fragments formed by blasting rock. Sov. Min. Sci. 1973, 9, 144–148. [Google Scholar] [CrossRef]
- Lith, A.; Kuchta, M.; Quinteiro, C. Prediction of fragmentation for ring blasting in large-scale sublevel caving. In Proceedings of the 13th International Symposium on Mine Planning and Equipment Selection (MPES 2004), Wroclaw, Poland, 1–3 September 2004; CRC Press/Balkema: Boca Raton, FL, USA, 2004. [Google Scholar]
- Djordjevic, N. A two-component model of blast fragmentation. In Fragblast; South African Institute of Mining and Metallurgy: Johannesburg, South Africa, 1999. [Google Scholar]
- Thornton, D.M.; Kanchibotla, S.S.; Esterle, J.S. A fragmentation model to estimate ROM size distribution of soft rock types. In Proceedings of the 27th Annual Conference on Explosives and Blasting Technique, Cleveland, OH, USA, 28–31 January 2001. [Google Scholar]
- Thornton, D.; Kanchibotla, S.S.; Brunton, I. Modelling the impact of rockmass and blast design variation on blast fragmentation. Fragblast 2002, 6, 169–188. [Google Scholar] [CrossRef]
- Ouchterlony, F. The Swebrec© function: Linking fragmentation by blasting and crushing. Min. Technol. 2005, 114, 29–44. [Google Scholar] [CrossRef]
- Onederra, I. Breakage and fragmentation modelling for underground production blasting applications. In Proceedings of the IRR Drilling & Blasting 2004, Perth, Australia, 2004. [Google Scholar]
- Oñederra, A. A Fragmentation Model for Underground Production Blasting. Ph.D. Thesis, The University of Queensland, St Lucia, QLD, Australia, 2005. [Google Scholar]
- Preston, C.; Williams, T.; Lipchak, I. Modeling of Dynamic Break in Underground Ring Blasting. Available online: https://iring.ca/articles/Modeling%20of%20Dynamic%20Break%20in%20Underground%20Ring%20Blasting.pdf (accessed on 1 June 2023).
- Preston, C. 3D Blast design for ring blasting in underground mines. In Proceedings of the EXPLO 95–The Australasian Institute of Mining and Metallurgy, Brisbane, Australia, 4–7 September 1995. Complete Monogram. [Google Scholar]
- Alghalandis, Y.F. ADFNE: Open source software for discrete fracture network engineering, two and three dimensional applications. Comput. Geosci. 2017, 102, 1–11. [Google Scholar] [CrossRef]
- Furtney, J.K.; Cundall, P.A.; Onederra, I.; Sellers, E. Numerical modeling of rock blasting: Validation tests for Blo-Up 2.5. In Proceedings of the Continuum and Distinct Element Numerical Modeling in Geomechanics–2011, Melbourne, Australia, 14–16 February 2011; Itasca International Inc.: Minneapolis, MN, USA, 2011; pp. 2–9. [Google Scholar]
- Torres, V.F.N.; Castro, C.; Valencia, M.E.; Figueiredo, J.R.; Silveira, L.G.C. Numerical Modelling of Blasting Fragmentation Optimization in a Copper Mine. Mining 2022, 2, 654–669. [Google Scholar] [CrossRef]
- Yi, C. Improved Blasting Results with Precise Initiation: Numerical Simulation of Small-Scale Tests and Full-Scale Bench Blasting; Swedish Blasting Research Centre och Luleå Tekniska Universitet: Luleå, Sweden, 2013. [Google Scholar]
- Tao, J.; Yang, X.-G.; Li, H.-T.; Zhou, J.-W.; Qi, S.-C.; Lu, G.-D. Numerical investigation of blast-induced rock fragmentation. Comput. Geotech. 2020, 128, 103846. [Google Scholar] [CrossRef]
- Torbica, S.; Lapčević, V. Rock fracturing mechanisms by blasting. Podzemni Radovi 2018, 32, 15–31. [Google Scholar] [CrossRef]
- Bird, R.; Paluszny, A.; Thomas, R.N.; Zimmerman, R.W. Modelling of fracture intensity increase due to interacting blast waves in three-dimensional granitic rocks. Int. J. Rock Mech. Min. Sci. 2023, 162, 105279. [Google Scholar] [CrossRef]
- Bednarik, R.G. Compressive–tensile rock markings. Geol. Mag. 2019, 156, 2113–2116. [Google Scholar] [CrossRef]
- Franklin, J.A.; Katsabanis, T. Measurement of Blast Fragmentation; CRC Press: Boca Raton, FL, USA, 1996. [Google Scholar]
- Moser, P. Comparison of the blast fragmentation from lab-scale and full-scale tests at Bararp. In Proceedings of the EFEE 2nd World Conference Explosives & Blasting Technology, Prague, Czech Republic, 10–12 September 2003; Balkema: Prague, Czech Republic. [Google Scholar]
- Van Rossum, G.; Drake, F.L. Python Reference Manual; Centrum voor Wiskunde en Informatica Amsterdam: Amsterdam, The Netherlands, 1995. [Google Scholar]
- Maerz, N.H.; Palangio, T.C.; Franklin, J.A. WipFrag image based granulometry system. In Measurement of Blast Fragmentation; Routledge: London, UK, 2018; pp. 91–99. [Google Scholar]
- Sereshki, F.; Hoseini, S.M.; Ataei, M. Blast fragmentation analysis using image processing. Int. J. Min. Geo-Eng. 2016, 50, 211–218. [Google Scholar]
- Hunter, G.C.; McDermott, C.; Miles, N.J.; Singh, A.; Scoble, M.J. A review of image analysis techniques for measuring blast fragmentation. Min. Sci. Technol. 1990, 11, 19–36. [Google Scholar] [CrossRef]
- Nanda, S.; Pal, B.K. Analysis of blast fragmentation using WipFrag. J. Image 2020, 5, 1561–1566. [Google Scholar]
- Chapman, D.L., VI. On the rate of explosion in gases. Lond. Edinb. Dublin Philos. Mag. J. Sci. 1899, 47, 90–104. [Google Scholar] [CrossRef]
- Jouguet, E. Sur la propagation des réactions chimiques dans les gaz. J. Maths. Pure Appl. 1905, 7, 347. [Google Scholar]
- Torbica, S.; Lapčević, V. Estimating extent and properties of blast-damaged zone around underground excavations. Rem Rev. Esc. Minas 2015, 68, 441–453. [Google Scholar] [CrossRef]


Disclaimer/Publisher’s Note: The statements, opinions and data contained in all publications are solely those of the individual author(s) and contributor(s) and not of MDPI and/or the editor(s). MDPI and/or the editor(s) disclaim responsibility for any injury to people or property resulting from any ideas, methods, instructions or products referred to in the content. |
© 2023 by the authors. Licensee MDPI, Basel, Switzerland. This article is an open access article distributed under the terms and conditions of the Creative Commons Attribution (CC BY) license (https://creativecommons.org/licenses/by/4.0/).