Abstract
At present, anti-counterfeiting schemes based on the combination of anti-counterfeiting patterns and two-dimensional codes is a research hotspot in digital anti-counterfeiting technology. However, many existing identification schemes rely on special equipment such as scanners and microscopes; there are few methods for authentication that use smartphones. In particular, the ability to classify blurry pattern images is weak, leading to a low recognition rate when using mobile terminals. In addition, the existing methods need a sufficient number of counterfeit patterns for model training, which is difficult to acquire in practical scenarios. Therefore, an authentication scheme for an anti-counterfeiting pattern captured by smartphones is proposed in this paper, featuring a single classifier consisting of two modules. A feature extraction module based on U-Net extracts the features of the input images; then, the extracted feature is input to a one-class classification module. The second stage features a boundary-optimized OCSVM classification method. The classifier only needs to learn positive samples to achieve effective identification. The experimental results show that the proposed approach has a better ability to distinguish the genuine and counterfeit anti-counterfeiting pattern images. The precision and recall rate of the approach reach 100%, and the recognition rate for the blurry images of the genuine anti-counterfeiting patterns is significantly improved.
1. Introduction
The rapid development of the economy has greatly changed and enriched people’s lives, which is accompanied by an endless stream of problems. In recent years, with the development of information technology, more and more counterfeits such as fake and shoddy products, pirated trademarks and various kinds of coupons have entered social circulation, causing serious negative impacts on society and our daily lives. In 2019, the volume of trade in counterfeit and pirated goods reached 2.5 percent of world trade, with about 5.8 percent of imports in the EU alone, before the COVID-19 pandemic accelerated the illicit trade and alarmed law enforcement in many parts of the world [1]. In China, there are many kinds of fake and inferior commodities; its output value is up to billions of Yuan. The widespread proliferation of fake and shoddy products such as food, clothing, tobacco, alcohol, medicine, etc. not only violates the legitimate rights and interests of enterprises as well as endangers the survival and development of enterprises, it also causes huge economic losses to consumers, disrupts the operation of the market economy, and even causes economic crimes [2]. Anti-counterfeiting aims to prevent illegal peddlers from imitating, copying or counterfeiting and selling other people’s products without the permission of the trademark owner. In China, the anti-counterfeiting industry market capacity has reached 800 billion yuan at present. More than 90% of the domestic drugs, more than 15% of food and more than 95% of tobacco and alcohol products are using anti-counterfeiting technology [3]. Anti-counterfeiting technology is used to identify a product’s authenticity and prevent counterfeiting, alteration or cloning. Its main form of existence is as an anti-counterfeiting label; consumers can quickly identify the authenticity of products through anti-counterfeiting labels. An anti-counterfeiting label is difficult to forge or imitate, greatly increasing the cost of counterfeiting and thus maintaining the brand image.
Existing anti-counterfeiting technologies can be divided into the following categories:
- (1)
- Visual anti-counterfeiting technology is currently widely used in the world, including security ink [4], security paper [5], watermark anti-counterfeiting [6,7], laser holographic [8,9,10], gravure printing [11] and so on. This kind of anti-counterfeiting technology constructs anti-counterfeiting labels applying special materials or processes. The cost is high; at the same time, once the material formula or process is disclosed, the anti-counterfeiting ability is lost.
- (2)
- Electronic identification anti-counterfeiting technology mainly includes radio frequency identification [12,13], magnetic recording and so on. Such technology relies on the data management system to play a role: the forged product information is not in the database, thus preventing counterfeiting. For example, RFID technology has the advantages of high precision, strong anti-interference ability and convenient operation, but it often relies on professional equipment to carry out authentication queries. Thus, a query can only be realized under specific conditions, which makes its application scenario and application range limited to a certain extent and difficult to popularize.
- (3)
- Code anti-counterfeiting technology [14] uses a system that integrates modern computer technology, network communication technology, data coding technology and so on, combining the achievements of the information industry with anti-counterfeiting. There is an anti-counterfeiting password that uniquely corresponds to the product hidden on the anti-counterfeiting label. After purchasing the product, consumers can obtain the password by scraping off the coating on the product packaging, and then they can inquire the authenticity information of the product from the computer identification system by means of telephone or SMS. Code anti-counterfeiting technology is unforgeable and convenient, but the code itself does not have anti-forgery ability and the query rate is low; once the counterfeiters acquire a real anti-forgery code, many counterfeit labels can be forged. In addition, a code anti-counterfeiting label usually does not support pre-sale query nor can it be queried several times, greatly limiting its application.
- (4)
- Textural anti-counterfeiting [15,16,17] starts from the uniqueness of natural textures such as wood and stone. Considering the defects of the anti-counterfeiting technology of electric codes, it designs anti-counterfeiting labels with stable and unique texture, and each anti-counterfeiting label is non-replicable. Texture anti-counterfeiting systems first use high-definition photography or scanning to obtain all the texture anti-counterfeiting label images; then, they establish a database and upload, number, and save the images. Consumers can retrieve the corresponding label images stored in the database by taking photos with their mobile phones, and they judge the authenticity by the comparison with their own eyes, which relies on subjective judgment and lacks more objective and intelligent identification means.
- (5)
- Printable graphic code (PGC) anti-counterfeiting [18,19,20,21] is represented by a two-dimensional code, which has been widely used in the fields of commerce, logistics, transportation and so on. It combines the physical anti-counterfeiting label, information technology, communication technology, big data and cloud platform, geographic information positioning and other advanced technical means to obtain the relevant information uploaded when the consumer scans the anti-counterfeiting label. In combination with the merchant information, commodity information and anti-counterfeiting identification information saved in the big data cloud platform, real-time matching and comparison are carried out so as to achieve anti-counterfeiting identification. When a serialized and unique barcode is printed on a product, it remains unchanged in the product’s life cycle. However, with the development of information technology, more and more high-precision digital input and output devices have come out and become popular, making the printed two-dimensional code vulnerable to illegal copying: that is, the scanned and copied two-dimensional code can still obtain the same information as the original two-dimensional code after decoding [22,23].
In recent years, the anti-counterfeiting scheme based on a printable graphic code (PGC) has low cost and strong anti-counterfeiting ability, which has attracted more and more attention in industry and academia. The copy detection pattern (CDP) is named for its sensitivity to illegal copying, which is also known as an anti-counterfeiting pattern [24,25]. It is usually composed of a fine micro-texture. Compared with the original pattern, the pattern generated by illegal copying will have great changes in the texture micro-features. By capturing these micro-features through machine learning, CDP can be authenticated.
In terms of applying anti-counterfeiting patterns for print matter anti-counterfeiting, many researchers have already put forward corresponding schemes. Tkachenko I. et al. [26,27] proposed a two-level QR code (2LQR code); unlike standard QR codes, 2LQR codes use specific texture patterns instead of black-and-white block structures to construct a private level for private information or authentication. The patterns are sensitive to the print-and-scan (P&S) process, thus preventing copying. Xie N. et al. [28] proposed an LCAC (low-cost anti-copying) 2D barcode, the anti-duplication effect of which is achieved by adding location-confidential authentication information to the original information in the process of generating a QR code. Justin [29] designed an anti-counterfeiting QR code with a copy detection pattern, which is composed of small black and white blocks of different densities. The copy detection pattern is inserted into the digital image of the QR code before production and printing. The pattern is sensitive to the copy process and can be scanned and analyzed by a mobile app to identify forgery. Yan [30] combined visual features with QR codes to design the anti-counterfeiting system of the Internet of Things. The visual features used included natural texture features and printed micro-features. In the anti-counterfeiting verification process, a feature extraction algorithm was used to calculate the feature similarity between the sample to be tested and the sample in the database to obtain identification results.
According to the existing research, the authenticity identification method based on CDP still has the following problems or defects:
- (1)
- At present, the commonly used method of authenticity identification is based on traditional machine learning, which usually relies on expert experience to manually design feature extraction and feature selection methods. In the design process, it is necessary to collect a large number of images of genuine anti-counterfeiting patterns and forged anti-counterfeiting patterns, extract and compare different features, and select one or several features with the best differentiation. However, traditional features are still surface features with limited representation ability. It is particularly difficult to design traditional manual features with robustness and good distinguishing ability for various sample changes. As the update iteration of electronic equipment becomes faster and faster and the equipment used for forgery becomes more and more sophisticated, it is difficult to collect all types of forgery during design, which makes the differentiation of traditional features easy to decline.
- (2)
- At present, most of the identification methods rely on special equipment, and the identification methods on mobile devices are not mature. There is a lack of accurate and efficient anti-counterfeiting pattern authentication methods for mobile devices.
- (3)
- The blur degradation of the printed anti-counterfeiting patterns is often produced in the process of using mobile devices to capture [31,32]. Due to the relative motion of the camera and the pattern in the process of photo acquisition, as well as the error of the focusing operation and other factors, the acquired image often degrades, which has an impact on the authenticity identification of the anti-counterfeiting pattern. Therefore, it is necessary to consider the blurry situation in the design of the identification algorithm for mobile devices so as to reduce the impact of blur on the identification results.
Targeting the problems above, based on the fact that there are far more authentic products than fakes, a forgery detection method for anti-counterfeiting patterns using U-Net and a single classifier is proposed. A two-stage framework for deep one-class classification [33] is applied. First, an auto-encoder (AE) based on U-Net architecture [34] is trained to extract features of the anti-counterfeiting pattern images, and blurry images are used to train the AE to enhance the robustness of extracted features of input blurry images. Then, we build a one-class classifier on the extracted features, the feature vectors are input into one-class support vector machine (OCSVM) for classification, and the decision boundary of OCSVM is modified according to certain strategies to improve the robustness of the input blurry images. The experimental results show that the method proposed in this paper is suitable for practical applications. On the basis of being able to better distinguish the authentic and counterfeit anti-counterfeit pattern images, the recognition rate of the blurry image of the authentic anti-counterfeit pattern is improved.
2. Related Works
2.1. Anti-Counterfeiting Two-Dimensional Code
An anti-counterfeiting two-dimensional code [35] is mainly composed of a standard 2D barcode and anti-counterfeiting pattern, as shown in Figure 1. The anti-counterfeiting pattern is a pattern with fine texture, and its digital image is only composed of black and white binary pixels. Illegal copying will further magnify the ink diffusion or ink powder adsorption of fine texture in the printed anti-counterfeiting pattern so as to better expose the forgery trace, thus effectively improving the anti-counterfeiting property of the two-dimensional code. Then, it is acquired by scanning or photographing equipment and matched with relevant authenticity identification algorithms to achieve the purpose of identifying authenticity.
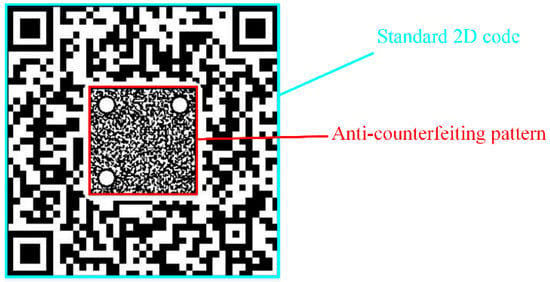
Figure 1.
Composition of the anti-counterfeiting 2D code.
The production and forgery process of an anti-counterfeiting 2D code is shown in Figure 2. The authentic anti-counterfeiting 2D code is generated by the official generation system and printed by the printing device, and it is pasted on the commodity or document as an anti-counterfeiting label for circulation. The forger cannot obtain the original generated anti-counterfeiting 2D code digital file, so the forgery process involves scanning the digital image based on the authentic anti-counterfeiting 2D code, printing it again to obtain the forgery, and pasting it on the counterfeit goods or documents.

Figure 2.
Production and forgery process of anti-counterfeiting 2D code.
The anti-counterfeiting 2D code needs to be combined with the corresponding anti-counterfeiting system to achieve an effective anti-counterfeiting function. The anti-counterfeiting system integrates a computer system, database system, software system and communication network technology, which mainly includes an anti-counterfeiting 2D code generation system, anti-counterfeiting 2D code acquisition system, cloud server and mobile applications. The generation and acquisition systems play roles in the digital image generation, physical printing and data acquisition of the anti-counterfeit 2D code. The cloud server monitors and manages the upload, storage, verification and other processes of the anti-counterfeit 2D code. The mobile application collects and uploads the anti-counterfeit 2D code image to be tested to the server for verification; then, it feeds back the authenticity verification results to consumers.
The authentication flow of the anti-counterfeiting 2D code based on the anti-counterfeiting system includes the following steps.
- (1)
- The anti-counterfeiting 2D code generation system is used to generate the anti-counterfeiting 2D code digital image in batches; then, the digital images are printed as physical objects;
- (2)
- The anti-counterfeiting 2D code acquisition system uses an industrial camera to capture the printed anti-counterfeiting 2D code and then uploads it to the cloud server for storage;
- (3)
- Then, it builds the anti-counterfeiting 2D code authenticity dataset and designs the corresponding authenticity identification algorithm;
- (4)
- The consumer collects the anti-counterfeiting 2D code to be tested through mobile devices (such as smart phones) and uploads it to the cloud server;
- (5)
- A feature comparison between the anti-counterfeiting pattern inside the code and the genuine anti-counterfeiting pattern image stored in the cloud server is carried out using the authenticity identification algorithm, and an identification result is given;
- (6)
- After receiving the authentication result sent by the cloud server, the mobile application will display it to the consumer.
2.2. One-Class Support Vector Machine
Support vector machine (SVM) is a new machine learning algorithm developed on the basis of statistical learning theory. SVM is based on the principle of structural risk minimization, and it minimizes the empirical risk and confidence range at the same time. It has the advantages of high fitting accuracy, few parameters, strong generalization ability and global optimization. SVM provides an effective tool for solving problems in situation such as small samples, high dimensions and nonlinearity, and it has become one of the research hotspots in the field of machine learning and has been widely used.
In essence, support vector machine is proposed to solve the binary classification problem. In order to achieve this goal, the training set needs positive and negative samples. However, in practical applications, it is almost impossible to obtain two types of samples or the cost is very high in some fields [36,37]. For example, for the identification of friend or foe, attack samples, satellite failures, etc., only one type of samples can be obtained, so only this type of samples can be used for learning, forming data descriptions, and thus achieving classification. Therefore, the one-class classification algorithm has emerged as the times require.
One-class support vector machine (OCSVM) was proposed by Scholkopf et al. [38]. It is a one-class classification algorithm based on support vector machine. The basic concept is similar to that of traditional support vector machines: to find the classification hyperplane with the largest classification interval as the optimal result, which can realize structural risk minimization and global optimization. Vert et al. theoretically and strictly analyzed the convergence boundary and upper limit of classification error of OCSVM, providing a solid theoretical basis for OCSVM.
For the nonlinear separable problem, OCSVM uses the kernel technique to transform it into a linear separable problem. First, the data in the original space are mapped into a feature space through a nonlinear transformation, and the origin point of the feature space is regarded as the representative of the abnormal points. Then, a hyperplane is found in the feature space, which can separate the image of the data from the origin, and the distance between the hyperplane and the origin is maximized.
Given the normal sample dataset , represents the ith normal data, its feature dimension is d, and the image in the feature space is . Set and represent the normal vector and offset of the separation hyperplane, respectively, and the expression form of the separation hyperplane is
Similar to the SVM used for binary classification, in order to improve the classification performance of OCSVM, the corresponding relaxation variable is introduced for each normal data . The optimization problem of OCSVM is as follows
In the above formulation, , is the percentage estimation, also called as the attribute, which is closely related to the number of support vectors. More specifically, is the upper bound of the boundary support vector and the lower bound of the number of all support vectors.
By solving the optimization problem with the Lagrange multiplier method and replacing the inner product with kernel function, the above optimization problem can be converted to the following one
where refers to the kernel matrix, .
After the optimization problem is solved, the sample meeting is called the support vector. Since the support vector is located on the hyperplane, the offset can be calculated by the inner product of the image of a support vector in the feature space and the normal vector
For the sample to be tested , the decision function of one-class support vector machine is
When the value of is greater than zero, it is determined that the sample is normal; when the value of is less than zero, it is determined that the sample is abnormal.
3. Deep Single Classifier for Anti-Counterfeiting Pattern Forgery Detection
The deep single classifier is composed of two modules: a feature extraction module based on U-Net and a one-class classification module based on boundary-optimized OCSVM. The feature extraction module is used to extract and generate the feature vector of the smartphone-captured pattern images for the training, boundary optimization and testing of the second classification module. The overall process is shown in Figure 3.

Figure 3.
Identification process of the proposed deep single classifier.
3.1. Feature Extraction Module Based on U-Net
In this paper, a U-Net based auto-encoder is used to realize the feature extraction of the printed anti-counterfeit pattern [39]. The main idea is to restore the input printed anti-counterfeit pattern to a binary digital pattern and compare it with the original binary digital pattern input at the same time to calculate a set of similarity measures. Then, the measures are concatenated to construct the feature vector of the printed anti-counterfeit pattern image.
As mentioned above, after the anti-counterfeiting code is generated and printed, the anti-counterfeiting pattern will be collected and stored by the industrial camera as a standard sample of the identification algorithm in practical applications. There is usually a high-resolution industrial camera and a fixed shooting environment in the collection process. However, the smartphone-captured image is prone to equipment defocusing, jitter and other fuzzy situations. In this paper, it is considered that the standard pattern images collected by the industrial camera can be used as the training sample after being artificially blurred to improve the restoration ability of the network for blurry images.
The auto-encoder training process is shown in Figure 4. The digital pattern generated by the anti-counterfeiting code generation system is input into the auto-encoder based on U-Net in pairs with the anti-counterfeiting code collected by the industrial camera and then artificially blurred. The encoder predicts the digital pattern from the input blurred pattern , and it takes the mean square error of the predicted pattern and the input real digital pattern as the loss item . The decoder predicts the predicted digital pattern again to obtain the possible print-captured pattern . Similarly, the mean square error of and is taken as the loss item . The loss function of the whole auto-encoder is composed of two loss terms, and the expression is as follows
where β is the relative weight of two loss terms in the system loss function.

Figure 4.
Training process of feature extractor in the first stage.
In the test phase, the anti-counterfeiting pattern image collected by the user using the mobile device and the corresponding original digital pattern image in the database are used as a pair of network inputs. Firstly, a binary anti-counterfeiting pattern image recovered from is obtained, and then, it is compared with to calculate a set of similarity metrics. Finally, the metrics is concatenated as the feature vector. In this paper, the Hamming distance and Jaccard similarity are selected to construct a two-dimensional feature vector.
For the recovered binary image and the corresponding digital image of the same size, set is the number of pixels whose pixel values are both 0 at the same position in and , is the number of pixels whose pixel values are 255 and 0, respectively, at the same position in and , is the number of pixels whose pixel values are 0 and 255, respectively, at the same position in and , and is the number of pixels whose pixel values are both 255 at the same position in and . Then, the Hamming distance and the Jaccard similarity can be calculated as the following formulation
In addition, the feature vector for can be constructed as
3.2. One-Class Classification Module Based on Boundary-Optimized OCSVM
After the feature extractor training process is completed, two-dimensional feature vectors can be extracted from the anti-counterfeiting pattern images captured by mobile devices and then input into the second stage OCSVM for training and testing.
For the above-mentioned anti-counterfeiting system, if a few forged products pass the genuine product verification, the forged labels can also be tracked through big data technology. If the number of one label appears in large numbers, it is considered that the label may be a forged product. Therefore, the boundary obtained by standard OCSVM training can be modified and expanded to improve the recognition rate of authentic products at the cost of reducing the ability to distinguish counterfeits. The specific process is as follows:
(1) According to the standard OCSVM training process, a decision hyperplane can be generated based on the positive sample feature vector, and the expression of the hyperplane is the same as (1)
where represents the normal data, its feature dimension is , and the image in the feature space is . and represent the normal vector and offset of the separation hyperplane, respectively.
(2) For sample , set
The used positive sample training set is input to the trained OCSVM for testing. Due to the existence of the attribute, some of the input positive sample feature vectors may fall outside the decision boundary.
If any sample point falls outside the decision boundary, the mathematical expression is
where is the decision function of the standard OCSVM method. The sample point farthest from the decision hyperplane can be found by traversing the positive sample training set; the sample is denoted as . Correspondingly, is the minimum value in
where .
If all sample points are located in the decision hyperplane, then is set to zero.
(3) Modify the decision hyperplane; the expression of the modified decision hyperplane is as follows
where D is the expansion offset, and the expression is
In the formulation, is obtained from step (2); is the offset coefficient and is greater than zero. The first item in the expression enables all samples in the training set to fall into the decision hyperplane, and the second item improves the recognition rate of OCSVM for low-quality image sample input.
The training set of positive samples, the boundary generated by OCSVM and the modified boundary is shown in Figure 5, where and are similarity metrics of the samples.
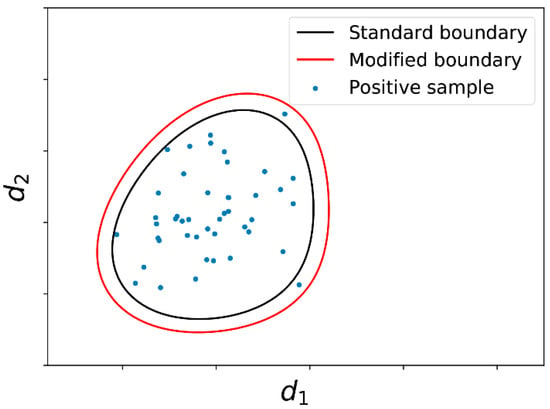
Figure 5.
Scatter plot of positive samples and the boundaries.
4. Experimental Results and Analysis
4.1. Experimental Dataset
A total of 90 anti-counterfeit code digital images are generated using the anti-counterfeit code generation system. The model of the printing device is HP Indigo 6000; forgery methods include directly duplicating and reprinting after scanning. The printer is used to print 90 genuine anti-counterfeiting codes, while 80 printed codes are used as standard samples to train the feature extractor, and the other 10 codes are used as test samples. Then, we duplicate and scan–reprint the 10 genuine codes correspondingly to obtain 20 forged anti-counterfeiting codes in total.
In order to simulate the real scene of photo verification of mobile devices, the printed or forged anti-counterfeit code was photographed five times each with four mobile phones of different brands and models (see Table 1), including a Huawei Mate30, Xiaomi 11 Ultra, iPhone 13 Pro and Redmi K40 Pro. The central anti-counterfeit pattern part is extracted: 10 × 4 × 5 = 200 genuine anti-counterfeit pattern images, 200 copied anti-counterfeit pattern images and 200 scanned and reprinted anti-counterfeit pattern images are obtained. In addition, the 80 standard anti-counterfeiting pattern images are obtained through the standardized collection of 80 genuine anti-counterfeiting codes by industrial cameras. The digital image of the anti-counterfeit pattern, the standard pattern collected after printing, and the genuine and forged anti-counterfeit patterns taken with mobile phones are shown in Figure 6, Figure 7, Figure 8 and Figure 9.

Table 1.
The mobile phones used in the experiment.
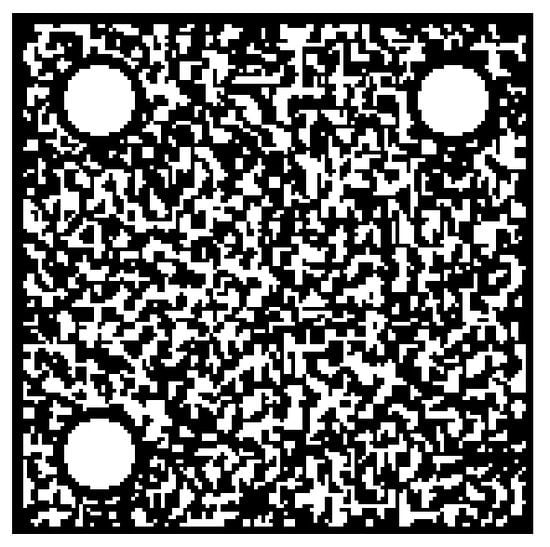
Figure 6.
Digital pattern.
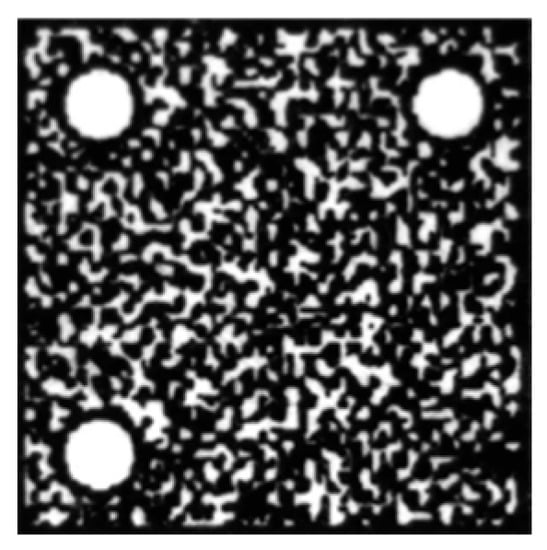
Figure 7.
Standard collected pattern.
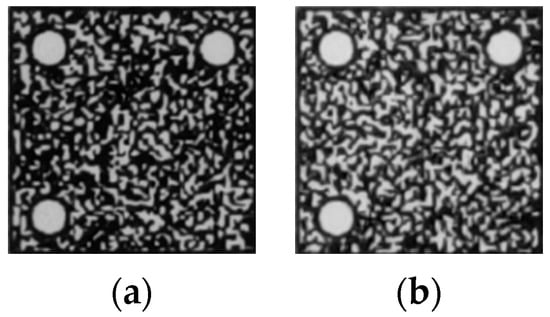
Figure 8.
Smartphone-captured genuine patterns. (a) Clear pattern; (b) Blurry pattern.
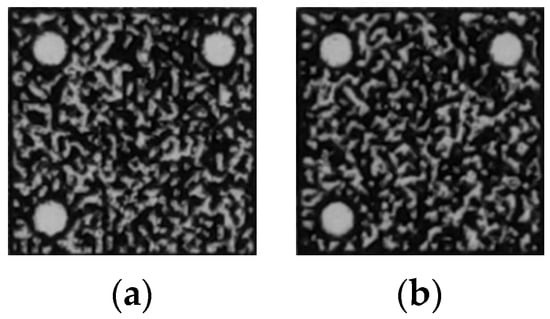
Figure 9.
Smartphone-captured forged patterns. (a) Duplicated pattern; (b) Scan–reprinted pattern.
It can be seen that the standard pattern is the closest to the digital pattern, while the mobile phone image is more or less blurry compared with the standard pattern. In addition, there is a visual degeneration from the genuine anti-counterfeit pattern to the forged pattern in texture.
4.2. Experimental Setup
All of the experiments were implemented on a desktop with CPU i5-8250U (8 GB, 1.80 GHz) with Ubuntu 18.04 OS, and the GPU graphics card model is Nvidia GeForce RTX3080 (12 GB). The deep learning framework used is Tensor Flow, the CUDA version is 11.2, and the CUDNN version is 8.1.
4.2.1. U-Net Model Training Setup
For the first stage training process, 80 standard patterns collected by the industrial camera are used as the training sample set after Gaussian filtering. The size of the filter matrix used is 7 × 7, the mean value is 0, and the variance is 3. In addition, considering that the image captured by the smartphone is affected by the ambient light (light or dark), data augmentation based on gamma correction is conducted on the training samples. The gamma values range from 0.5 to 1.2, and the step size is 0.1. A total of eight values are selected. After augmentation, 80 × 8 = 640 training sample images are obtained in all as the train set of U-Net model.
The learning rate of U-Net is set to 1 × , Adam optimizer is applied, the number of training epoch is 1000, and the relative weight of loss items β is set to 25.
4.2.2. OCSVM Model Training Setup
At present, the type of kernel function is basically selected by experience. After selecting the kernel function, the relevant parameters are determined through experiments. Several kernel functions widely used in practice include linear kernel function, polynomial kernel function, radial basis function and sigmoid kernel function, among which the radial basis function is the most widely used [40]. It has a wide convergence domain and is an ideal kernel function for classification. The radial basis function is also selected as the kernel function in this paper.
In the second stage, 60 (200 × 30%) positive sample feature vectors are randomly selected as the training set. All the positive samples are used as the test set, and negative sample feature vectors are not used. The offset coefficient of the modified OCSVM will directly affect the shape of the final decision hyperplane and the identification result. The value of is selected by the parameter trying; the goal is to modify the decision boundary and make sure all the 60 training sample points fall into the modified decision boundary. Increasing the value of corresponds to expanding the boundary so that positive samples can fall into the decision boundary as much as possible, and at the same time, excessive values of will reduce the resolution of abnormal samples. Finally, is set to 30%; the corresponding distribution of test sample points in the feature space and the decision boundary are shown in Figure 10. It can be seen that normal sample points all fall into the modified decision boundary.
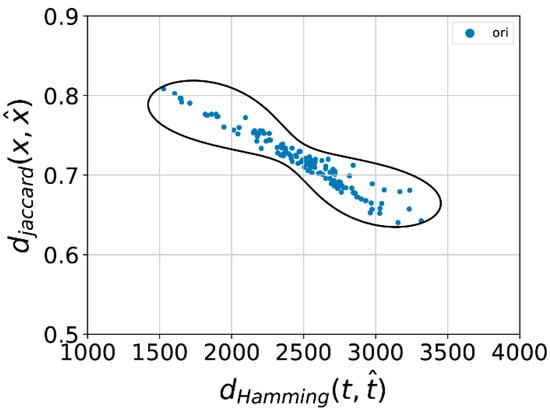
Figure 10.
Scatterplot and the optimized decision boundary.
4.2.3. Classification Criteria
The classification performance is evaluated by several metrics as follows:
(1) TP, TN, FP and FN. The four metrics TP (True Negative), TN (True Positive), FP (False Positive) and FN (False Negative) are the most basic metrics.
(2) Precision. The precision rate represents the proportion of samples with positive predicted results, where the ground truth is also positive. The expression is
(3) Recall. The recall rate represents the proportion of samples with positive predicted results among all samples that are positive in the real situation. The expression is
(4) F1 Score is an indicator used in statistics to measure the accuracy of binary classification models. It takes into account both the accuracy and recall of the classification model. The F1 score can be seen as a harmonic average of model precision and recall. The expression is
Generally speaking, the higher the values of precision, recall and F1 score, the better the performance of an algorithm.
4.3. Genuine and Forged Anti-Counterfeiting Pattern Identification Test
As mentioned above, after the completion of the auto-encoder training, a set of feature vectors corresponding to the positive samples can be extracted by taking the smartphone-captured genuine pattern images as input, and a set of feature vectors corresponding to the abnormal sample is extracted by taking the smartphone-captured counterfeit pattern images as input. Then, the second stage of the one-class classifier randomly selects 30% positive sample feature vectors as the training set, and all positive sample and abnormal sample feature vectors are the test set.
The comparative experiment in the two stages is conducted, and the obtained classifiers are named C1, C2, C3, and C4. For C1 and C2, the U-Net-based feature extractor is trained by standard collected patterns without artificially blurring in the first module, while for C3 and C4, the feature extractor is trained by artificially blurred patterns. In the second stage, for C1 and C3, the boundary is generated by the standard OCSVM method, while the boundary generated by OCSVM is optimized for C2 and C4. The discrimination ability of different classifiers is measured by the recognition rate of the test samples. The results are shown in Table 2. The TP rate is the recognition rate of genuine patterns indicating the proportion of the input genuine patterns that are also recognized as normal samples, and the FP rate is the misclassification rate of counterfeit patterns indicating the proportion of the counterfeit patterns that are misjudged as normal samples.

Table 2.
Performance comparison of different classifiers (%).
The sample scatterplot obtained by feature extraction in the first stage and the decision boundary obtained in the second stage corresponding to each classifier are shown in Figure 11a–d, where the label ori corresponds to positive samples (genuine patterns), while cop and scan correspond to duplicating and scan–reprinting negative samples (counterfeit patterns), respectively.
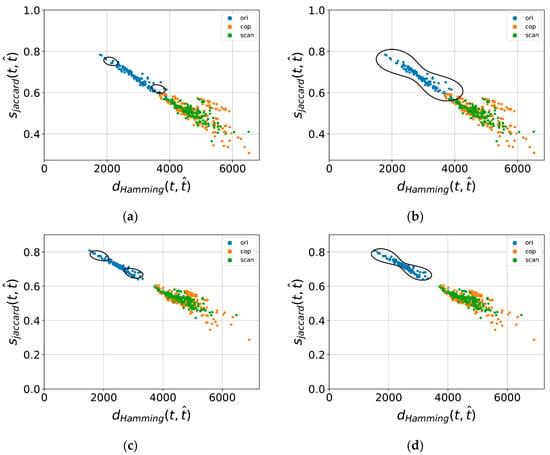
Figure 11.
Scatter plot and the decision boundary of different classifiers. (a) Scatterplot and the decision boundary of C1; (b) Scatterplot and the decision boundary of C2; (c) Scatterplot and the decision boundary of C3; (d) Scatterplot and the decision boundary of C4.
It can be seen from the chart that classifier C1 does not use blurred patterns in the first stage of training, and there is an intersection between positive and negative sample points in the feature space. At the same time, because there are relatively few samples used in training OCSVM, most of the positive sample points fall outside the generated decision boundary, and the recognition rate of authentic products is very low. Classifier C2 modifies the boundary on the basis of C1, and all positive sample points fall within the modified decision boundary. However, due to the intersection of positive and negative samples, it is inevitable that a small number of negative sample points also fall within the boundary and are judged as positive sample points. Classifier C3 uses blurred patterns to train the U-Net in the first stage, and it can be seen that the model has a good restoration ability for the blurred pattern images taken by mobile phones. The distribution of positive and negative sample points in the feature space is not overlapped, which makes it easier for the classifier to identify the sample points. On the basis of C3, classifier C4 conducts boundary correction, all the positive sample points fall within the decision boundary, and at the same time, it can completely distinguish negative samples. The recognition rate of authentic products reaches 100%, and the false classification rate reduces to 0%, which verifies the effectiveness of the proposed classifier.
4.4. Comparison with One-Class Classifier Method Based on Hand-Crafted Features
In the literature [41], it is proposed to directly use traditional image features to construct feature vectors, and the standard OCSVM method is applied to identify the authenticity of printed anti-counterfeiting patterns. The applied feature metrics include structural similarity (SSIM), correlation coefficient (CORR), Hamming distance (HAMMING), and Jaccard similarity (JACCARD). The following experiment also takes the same 60 positive samples as the training set, while all the positive samples and negative samples are the test set. It calculates the feature metrics of the sample images to construct the feature vector and then inputs OCSVM for training and testing. The obtained classifiers are named C5, C6 and C7. The metrics used to construct feature vectors and the identification result are shown in Table 3.

Table 3.
Comparison with one-class classifiers based on hand-crafted features (%).
It can be seen from the table that the commonly used hand-crafted features are used to construct feature vectors for one-class classification according to the method, and there are obviously many misclassifications, which indicates that these features are not suitable for a one-class classification of such anti-counterfeit patterns. It may be necessary to design and apply more complex traditional features to achieve classification in combination with both genuine and counterfeit patterns. And as mentioned above, the equipment used for forgery is becoming more and more sophisticated, so it is difficult to collect all types of forgery during the design process.
The scatter plots of samples in two-dimensional feature space and corresponding decision boundaries of classifiers using two-dimensional feature vectors are shown in Figure 12a,b. It can also be seen from the figure that many positive and negative sample points are overlapped, which is not conducive to differentiation.
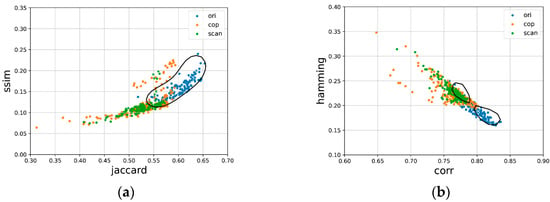
Figure 12.
Scatter plot and the decision boundary of classifiers based on hand-crafted features. (a) Scatterplot and the decision boundary of C5; (b) Scatterplot and the decision boundary of C6.
4.5. Comparison with One-Class Classifier Method Based on Deep Learning Features
In the literature [39], Taran et al. uses a U-Net auto-encoder (AE) for feature extraction, and OCSVM is used for classification; clearly captured pattern images are used to train the model. To apply the method, the same 80 × 8 = 640 clear images are used to train the auto-encoder, and feature vectors of the same 60 images captured by different smartphones are used to train OCSVM.
Due to the difficulty in training with only one normal class, there are few methods for deep one-class classification compared with binary or multi-classification. Recently, Deepa et al. [42] proposed using the pretrained CNN models for feature extraction, and their results show that the combination of VGG19 and OCSVM may perform better than any other combination of a classical CNN model and one-class method. The pretrained VGG19 model trained on ImageNet is used to extract features, and feature vectors of the same 60 images captured by different smartphones are used to train OCSVM.
The identification result of the methods is shown in Table 4. As can be seen from the table, the proposed method performs better than the methods in terms of anti-counterfeiting pattern classification. For Deepa’s method, the feature extracted from the pretrained model can be insignificant for the pattern images. And the performance of Taran’s method decreases for blurry input; a slightly blurry image may also be judged as counterfeit.

Table 4.
Performance comparison of deep one-class methods (%).
5. Discussion
At present, counterfeit and inferior products cause economic losses to consumers and disrupt the normal economic order of society. The anti-counterfeiting label printed or pasted on the package can prevent anti-counterfeiting to some extent, but some limitations lead to a low query rate of identification by customers.
Many existing schemes rely on special equipment such as scanners or microscopes, and customers have to go to a particular place for the query service. In other cases, the scheme allows customers to take a photo of the label and upload the image to achieve an identification query, but the ability to authenticate a blurry pattern image is weak, leading to a low recognition rate at mobile terminals. It may take several tries for a customer to take a photo that is clear enough for a query.
According to the literature [41], a binary classification method may perform better for anti-counterfeiting pattern identification compared to a one-class method. However, it is difficult to collect enough counterfeit patterns during the design process in practical applications. The existing binary classification methods based on deep learning rely on a large amount of training data containing both positive and negative samples, while collecting the negative samples can increase the cost. Considering the fact that there are far more authentic products than fakes, it is necessary to apply one-class based anti-counterfeiting methods in a practical scenario.
Therefore, an authentication scheme for an anti-counterfeiting pattern captured by a smartphone is proposed in this paper, and a two-stage single classifier is designed in the scheme. The classifier only needs to learn positive samples to achieve effective identification. In the first stage, the U-Net-based auto-encoder is trained with artificially blurred pattern images for feature extraction, and artificially blurred images are used for training to enhance the robustness of restoration ability. In the second stage, the features extracted by U-Net are used for one-class classification. Based on the standard OCSVM method, the generated boundary is modified according to certain strategies so that more positive samples fall within the decision boundary, and the recognition rate for the blurry image of the genuine pattern is improved. Compared with the traditional method, with the same number of samples, the proposed method achieves a recognition rate of 100% for authentic products with certain fuzziness, and the false classification rate decreases to 0%, which verifies the effectiveness of the proposed method.
Compared with multi-class classification approaches, there are few methods for deep one-class classification. In this work, the mostly-used two-stage framework for deep one-class classification is applied. First, a deep learning model is trained for feature extraction, and the extracted feature is used to train a classification model. Recently, some deep end-to-end methods for one-class classification are proposed, where the feature extraction model and the classification model can be trained together with a shared loss function. In our future work, a deep end-to-end model for one-class classification can be considered as a substitute for the two-stage framework model.
6. Conclusions
Counterfeit and inferior products not only greatly damage the reputation of businesses but also cause economic losses to consumers and disrupt the normal economic order of society. Anti-counterfeiting technology has become an important means to combat counterfeiting. Due to their own shortcomings and limitations, traditional physical and chemical anti-counterfeiting, code anti-counterfeiting and other technologies generally have problems such as high cost, poor user experience, and poor objectivity. Thus, there is an urgent need for a cost-effective anti-counterfeiting technology in the market.
At present, the QR code anti-counterfeiting technology integrating anti-counterfeiting patterns has attracted more and more attention due to its high cost performance and pre-scale anti-counterfeiting advantages, but there are still some problems. Many existing identification schemes rely on special equipment such as scanners and microscopes, and there are few methods for authentication on smartphones. In particular, the ability to classify to blurry pattern images is weak, leading to a low recognition rate at mobile terminals. The existing methods also need enough counterfeit patterns for model training, which is hard to collect in practical scenarios.
Therefore, a deep one-class method for an anti-counterfeiting pattern captured by smartphones is proposed in this paper. Only positive samples are needed to achieve effective identification. The experimental results show that the proposed approach is more able to distinguish the genuine and counterfeit anti-counterfeiting pattern images. The recognition rate for the blurry images of the genuine anti-counterfeiting patterns is particularly improved.
Author Contributions
Conceptualization, H.Z. and C.Z.; methodology, H.Z. and C.Z.; software, C.Z.; validation, C.Z., T.W. and C.Y.; formal analysis, H.Z. and C.Z.; investigation, H.Z. and C.Z.; resources, X.L. and H.Z.; data curation, C.Z., T.W. and C.Y.; writing—original draft preparation, C.Z.; writing—review and editing, H.Z., X.L. and C.Z.; visualization, C.Z., T.W. and C.Y.; supervision, H.Z.; project administration, H.Z.; funding acquisition, X.L. and H.Z. All authors have read and agreed to the published version of the manuscript.
Funding
This work was supported by the scientific research foundation of the Nanchang Institute of Science and Technology (No. NGRCZX-21-02), the Science and Technology Research Project of the Jiangxi Provincial Department of Education (No. GJJ212507), and the Nanchang Key Laboratory of Internet of Things Information Visualization Technology (No. 2020-NCZDSY-017).
Institutional Review Board Statement
Not applicable.
Informed Consent Statement
Not applicable.
Data Availability Statement
The images in this paper are available upon request.
Conflicts of Interest
The authors declare no conflict of interest.
References
- OCED/EUIPO. Global Trade in Fakes: A Worrying Threat; OECD Publishing: Paris, France, 2021; ISBN 978-92-64-81302-1. [Google Scholar]
- Guo, Z. Research on Authenticity Identification of Printed Anti-Counterfeiting QR Code. Ph.D. Thesis, Wuhan University, Wuhan, China, 2022. [Google Scholar]
- Zhong, Y.; Hu, Y.; Yang, L.; Liu, Y. Security Printing and Packaging Anti-Counterfeiting, 1st ed.; Tsinghua University Press: Beijing, China, 2020; pp. 52–91. ISBN 978-7-302-53866-0. [Google Scholar]
- Gao, M.; Li, J.; Xia, D.; Jiang, L.; Peng, N.; Zhao, S.; Li, G. Lanthanides-based security inks with reversible luminescent switching and self-healing properties for advanced anti-counterfeiting. J. Mol. Liq. 2022, 350, 118559. [Google Scholar] [CrossRef]
- Lee, S.H.; Kim, M.S.; Kim, J.K.; Hong, I.P. Design of Security Paper with Selective Frequency Reflection Characteristics. Sensors 2018, 18, 2263. [Google Scholar] [CrossRef] [PubMed]
- Zheng, H.; Zhou, C.; Li, X.; Guo, Z.; Wang, T. A Novel Steganography-Based Pattern for Print Matter Anti-Counterfeiting by Smartphone Cameras. Sensors 2022, 22, 3394. [Google Scholar] [CrossRef] [PubMed]
- Shen, J. Research and Implementation of Two-Dimensional Code Anti-Counterfeiting System Based on Information Hiding. Master’s Thesis, University of Electronic Science and Technology of China, Chengdu, China, 2019. [Google Scholar]
- Wu, T.; Wang, C.; Kao, H.; Su, P.; Ma, J. Analysis of the factors influencing the diffraction characteristics of volume holographic grating for 3D anti-counterfeiting. In Proceedings of the SPIE 11571, Optics Frontier Online 2020: Optics Imaging and Display (OFO-1), Shanghai, China, 7 October 2020. [Google Scholar] [CrossRef]
- Hu, Y.; Zhang, T.; Wang, C.; Liu, K.; Sun, Y.; Li, L.; Lv, C.; Liang, Y.; Jiao, F.; Zhao, W.; et al. Flexible and Biocompatible Physical Unclonable Function Anti-Counterfeiting Label. Adv. Funct. Mater. 2021, 31, 2102108. [Google Scholar] [CrossRef]
- Lee, I.-H.; Li, G.; Lee, B.-Y.; Kim, S.-U.; Lee, B.; Oh, S.-H.; Lee, S.-D. Selective photonic printing based on anisotropic Fabry-Perot resonators for dual-image holography and anti-counterfeiting. Opt. Exp. 2019, 27, 24512–24523. [Google Scholar] [CrossRef] [PubMed]
- Grau, G.; Cen, J.; Kang, H.; Kitsomboonloha, R.; Scheideler, W.J.; Subramanian, V. Gravure-printed electronics: Recent progress in tooling development, understanding of printing physics, and realization of printed devices. Flex. Print. Electron. 2016, 1, 023002. [Google Scholar] [CrossRef]
- Sun, W.; Zhu, X.; Zhou, T.; Su, Y.; Mo, B. Application of Blockchain and RFID in Anti-counterfeiting Traceability of Liquor. In Proceedings of the 2019 IEEE 5th International Conference on Computer and Communications (ICCC), Chengdu, China, 6–9 December 2019; pp. 1248–1251. [Google Scholar] [CrossRef]
- Khalil, G.; Doss, R.; Chowdhury, M. A Novel RFID-Based Anti-Counterfeiting Scheme for Retail Environments. IEEE Access 2020, 8, 47952–47962. [Google Scholar] [CrossRef]
- Ding, Y. Design and Realization of Anti-counterfeit System based on RFID. Master’s Thesis, SYSU, Guangzhou, China, 2013. [Google Scholar]
- Lin, Y.; Zhang, H.; Feng, J.; Shi, B.; Zhang, M.; Han, Y.; Wen, W.; Zhang, T.; Qi, Y.; Wu, J. Unclonable Micro-Texture with Clonable Micro-Shape towards Rapid, Convenient, and Low-Cost Fluorescent Anti-Counterfeiting Labels. Small 2021, 17, e2100244. [Google Scholar] [CrossRef] [PubMed]
- Zheng, Z.; Xu, B.; Ju, J.; Guo, Z.; You, C.; Lei, Q.; Zhang, Q. Circumferential Local Ternary Pattern: New and Efficient Feature Descriptors for Anti-Counterfeiting Pattern Identification. IEEE Trans. Inf. Forensics Secur. 2022, 17, 970–981. [Google Scholar] [CrossRef]
- Wong, C.W.; Wu, M. Counterfeit detection using paper PUF and mobile cameras. In Proceedings of the 2015 IEEE Int. Workshop Inf. Forensics Security (WIFS), Rome, Italy, 16–19 November 2015; pp. 1–6. [Google Scholar] [CrossRef]
- Al-Bahri, M.; Yankovsky, A.; Kirichek, R.; Borodin, A. Smart System Based on DOA & IoT for Products Monitoring & Anti-Counterfeiting. In Proceedings of the 2019 4th MEC Int. Conf. Big Data Smart City (ICBDSC), Muscat, Oman, 15–16 January 2019; pp. 1–5. [Google Scholar] [CrossRef]
- Wazid, M.; Das, A.K.; Khan, M.K.; Al-Ghaiheb, A.A.-D.; Kumar, N.; Vasilakos, A.V. Secure Authentication Scheme for Medicine Anti-Counterfeiting System in IoT Environment. IEEE IoT. J. 2017, 4, 1634–1646. [Google Scholar] [CrossRef]
- Chen, R.; Yu, Y.; Chen, J.; Zhong, Y.; Zhao, H.; Hussain, A.; Tan, H.-Z. Customized 2D Barcode Sensing for Anti-Counterfeiting Application in Smart IoT with Fast Encoding and Information Hiding. Sensors 2020, 20, 4926. [Google Scholar] [CrossRef] [PubMed]
- Tkachenko, I.; Kucharczakr, F.; Destruel, C.; Strauss, O.; Puech, W. Copy Sensitive Graphical Code Quality Improvement Using a Super-Resolution Technique. In Proceedings of the 2018 25th IEEE International Conference on Image Processing (ICIP), Athens, Greece, 7–10 October 2018; pp. 3808–3812. [Google Scholar] [CrossRef]
- Nguyen, H.P.; Delahaies, A.; Retraint, F.; Nguyen, D.H.; Pic, M.; Morain-Nicolier, F. A watermarking technique to secure printed QR codes using a statistical test. In Proceedings of the 2017 IEEE Global Conference on Signal and Information Processing (GlobalSIP), Montreal, QC, Canada, 14–16 November 2017; pp. 288–292. [Google Scholar] [CrossRef]
- Zhang, H. QR-Code Anti-Counterfeiting Method Based on Random Dot Code. Master’s Thesis, Wuhan University, Wuhan, China, 2021. [Google Scholar]
- Zhang, P.; Zhang, W.; Yu, N. Copy Detection Pattern-Based Authentication for Printed Documents with Multi-Dimensional Features. In Proceedings of the 2019 7th International Conference on Information, Communication and Networks (ICICN), Macao, China, 24–26 April 2019; pp. 150–157. [Google Scholar] [CrossRef]
- Khermaza, E.; Tkachenko, I.; Picard, J. Can Copy Detection Patterns be copied? Evaluating the performance of attacks and highlighting the role of the detector. In Proceedings of the 2021 IEEE Int. Workshop Information Forensics Security (WIFS), Montpellier, France, 7–10 December 2021; pp. 1–6. [Google Scholar] [CrossRef]
- Tkachenko, I.; Puech, W.; Destruel, C.; Strauss, O.; Gaudin, J.-M.; Guichard, C. Two-Level QR Code for Private Message Sharing and Document Authentication. IEEE Trans. Inf. Forensics Secur. 2016, 11, 571–583. [Google Scholar] [CrossRef]
- Tkachenko, I.; Puech, W.; Strauss, O.; Destruel, C.; Gaudin, J.-M. Printed document authentication using two level or code. In Proceedings of the 2016 IEEE International Conference on Acoustics, Speech and Signal Processing (ICASSP), Shanghai, China, 20–25 March 2016; pp. 2149–2153. [Google Scholar] [CrossRef]
- Xie, N.; Zhang, Q.; Chen, Y.; Hu, J.; Luo, G.; Chen, C. Low-Cost Anti-Copying 2D Barcode by Exploiting Channel Noise Characteristics. IEEE Trans. Multimed. 2021, 23, 3752–3767. [Google Scholar] [CrossRef]
- Picard, J. Digital authentication with copy-detection patterns. In Optical Security and Counterfeit Deterrence Techniques V; SPIE: Bellingham, WA, USA, 2004; Volume 5310, pp. 176–183. [Google Scholar] [CrossRef]
- Yan, Y.; Zou, Z.; Xie, H.; Gao, Y.; Zheng, L. An IoT-Based Anti-Counterfeiting System Using Visual Features on QR Code. IEEE IoT. J. 2021, 8, 6789–6799. [Google Scholar] [CrossRef]
- Abdullah-Al-Mamun, M.; Tyagi, V.; Zhao, H. A New Full-Reference Image Quality Metric for Motion Blur Profile Characterization. IEEE Access 2021, 9, 156361–156371. [Google Scholar] [CrossRef]
- Huang, R.; Fan, M.; Xing, Y.; Zou, Y. Image Blur Classification and Unintentional Blur Removal. IEEE Access 2019, 7, 106327–106335. [Google Scholar] [CrossRef]
- Sohn, K.; Li, C.L.; Yoon, J.; Jin, M.; Pfister, T. Learning and Evaluating Representations for Deep One-Class Classification. Presented at ICLR 2021. Available online: https://arxiv.org/pdf/2011.02578.pdf (accessed on 25 March 2021).
- Ronneberger, O.; Fischer, P.; Brox, T. U-Net: Convolutional Networks for Biomedical Image Segmentation. In Proceedings of the 2015 Medical Image Computing Computer-Assisted Intervention (MICCAI), Munich, Germany, 5–9 October 2015; Volume 9351, pp. 234–241. [Google Scholar] [CrossRef]
- Zheng, Z.; Zheng, H.; Ju, J.; Chen, D.; Li, X.; Guo, Z.; You, C.; Lin, M. A system for identifying an anti-counterfeiting pattern based on the statistical difference in key image regions. Expert Syst. Appl. 2021, 183, 115410. [Google Scholar] [CrossRef]
- Dai, J.; Liu, H.; Zhang, Q. One Class Support Vector Machine Active Learning Method for Unbalanced Data. In Proceedings of the 2020 International Conference on Cyber-Enabled Distributed Computing and Knowledge Discovery (CyberC), Chongqing, China, 29–30 October 2020; pp. 309–315. [Google Scholar] [CrossRef]
- Guo, K.; Liu, D.; Peng, Y.; Peng, X. Data-Driven Anomaly Detection Using OCSVM with Boundary Optimzation. In Proceedings of the 2018 Prognostics and System Health Management Conference (PHM-Chongqing), Chongqing, China, 26–28 October 2018; pp. 244–248. [Google Scholar] [CrossRef]
- Chen, Y.; Zhou, X.S.; Huang, T. One-class SVM for learning in image retrieval. In Proceedings of the 2001 International Conference on Image Processing (Cat. No. 01CH37205), Thessaloniki, Greece, 7–10 October 2001; Volume 1, pp. 34–37. [Google Scholar] [CrossRef]
- Taran, O.; Tutt, J.; Holotyak, T.; Chaban, R.; Bonev, S.; Voloshynovskiy, S. Mobile authentication of copy detection patterns: How critical is to know fakes? In Proceedings of the 2021 IEEE International Workshop on Information Forensics and Security (WIFS), Montpellier, France, 7–10 December 2021; pp. 1–6. [Google Scholar] [CrossRef]
- Li, J.; Zuo, L.; Su, T.; Guo, Z. The Choice of Kernel Function for One-Class Support Vector Machine. In Proceedings of the 2021 2nd International Conference on Big Data & Artificial Intelligence & Software Engineering (ICBASE), Zhuhai, China, 24–26 September 2021; pp. 195–198. [Google Scholar] [CrossRef]
- Chaban, R.; Taran, O.; Tutt, J.; Holotyak, T.; Bonev, S.; Voloshynovskiy, S. Machine learning attack on copy detection patterns: Are 1 x 1 patterns cloneable? In Proceedings of the 2021 IEEE International Workshop on Information Forensics and Security (WIFS), Montpellier, France, 7–10 December 2021; pp. 1–6. [Google Scholar] [CrossRef]
- Deepa, N.; Sumathi, R. Transfer Learning and One Class Classification-A Combined Approach for Tumor Classification. In Proceedings of the 2022 6th International Conference on Electronics, Communication and Aerospace Technology, Coimbatore, India, 1–3 December 2022; pp. 1454–1459. [Google Scholar] [CrossRef]
Disclaimer/Publisher’s Note: The statements, opinions and data contained in all publications are solely those of the individual author(s) and contributor(s) and not of MDPI and/or the editor(s). MDPI and/or the editor(s) disclaim responsibility for any injury to people or property resulting from any ideas, methods, instructions or products referred to in the content. |
© 2023 by the authors. Licensee MDPI, Basel, Switzerland. This article is an open access article distributed under the terms and conditions of the Creative Commons Attribution (CC BY) license (https://creativecommons.org/licenses/by/4.0/).