Article

Impact of a Thermally Stratified Energy Source Located in Front of a Pointed Cylinder Aerodynamic Model on the Pressure Signatures and PLdB Effect on the Ground

1
Federal Research Center “Computer Science and Control” of the Russian Academy of Sciences, 119333 Moscow, Russia
2
Department of Mechanical & Aerospace Engineering, Rutgers University, New Brunswick, NJ 08854, USA
*
Author to whom correspondence should be addressed.
Appl. Sci. 2023, 13(13), 7927; https://doi.org/10.3390/app13137927
Submission received: 9 June 2023 / Revised: 3 July 2023 / Accepted: 5 July 2023 / Published: 6 July 2023
(This article belongs to the Special Issue Recent Advances in Space Propulsion Technology)

Abstract

:
The problem of noise reduction in supersonic aircraft design is one of the key problems, the solution of which largely determines the speed of development of supersonic aviation as a whole. The present study examines the noise generation during flights of supersonic civil aircraft. The effect of a thermally stratified energy source (TSS) used to control the supersonic flow past a pointed cylinder aerodynamic model on the near-field and ground pressure signatures, as well as on the perceived loudness in decibels (PLdB) on the ground, is evaluated. The complex conservative difference schemes, Tomas’ waveform parameter method, and Stevens’ algorithm Mark VII are used for near-field modeling, obtaining the ground pressure signature, and the evaluation of the PLdB on the ground, accordingly. The fields of flow parameters and the dynamics of a drag force are researched at the variation of temperatures in layers of TSS and for different numbers of layers. Simulations showed that changing the surface pressure due to drag reduction does not necessarily imply a change in the PLdB on the ground. In particular, it has been shown that when performing the flow control at freestream Mach numbers 1.5–2 using TSSs with the number of layers from 2.5 to 7.5 and rarefaction parameters in the layers from 0.15 to 0.3, some weakening of the bow shock wave in the near-field pressure signature due to the effect of TSS occurs, and no additional noise impact on the ground is introduced.

1. Introduction

The problem of controlling high-speed flows by non-mechanical means, namely, remote energy input, is currently at the forefront in the field of flow/flight control research. [1]. Recently, the use of electric discharges, microwaves, and laser energy deposition to control supersonic flows are quite developed areas of research in aerospace technology [1,2,3]. Historical analysis of breakthrough results obtained several decades ago, indicating the possibility of controlling supersonic flows by supplying energy to various parts of the flow and the surface of an aerodynamic (AD) body, is presented in [4]. In [5], the study is conducted on a sonic boom effect using continuous energy deposition consisting of two and three longitudinal heated filaments. The flow case was considered when one of the filaments was located upper to the pointed AD body. Due to the impact of such an energy deposition on the flow, a decrease in the perceived loudness in decibels (PLdB) on the ground was obtained, although this was shown to require significant energy consumption. An overview of studies of noise generation (the Sonic Boom problem) in the field of supersonic flows/flights is presented in [6], where a summary is provided of the research conducted in the framework of the Second AIAA Sonic Boom Workshop.
Previously, the efficiency of energy supply in the form of longitudinal filaments for the reduction of aerodynamic drag was established theoretically and experimentally [7,8,9]. At present, researchers are paying attention to the influence of spatially inhomogeneous plasma structures on the flow. In a supersonic flow, it was obtained that the reflected SW was suppressed in the region of a multifilament plasma generated by Quasi-DC electric discharges [10]. In [11], an array of surface plasma actuators was used to control the interaction of a shock wave (SW) with a boundary layer in a flow. As a result, the disappearance of a SW fragment inside the inhomogeneous area was established. In experiments [12], thermal and density inhomogeneities were generated using a discharge plasma formed by a number of the heated wires, which, when interacting with SW, was a reason for the RMI manifestation and the vortex lines origination.
The influence of the region of ionization instability of a glow gas discharge, which is accompanied by the formation of a layered structure of the ionization strata, on an initially flat plane SW was studied in [13]. In these experiments, it was shown that the stratification of the electron temperature field leads to the stratification of the gas temperature, and the impact of an inhomogeneous plasma medium caused distortion and partial SW vanishing. The calculations performed showed the manifestation of the RMI at many points, leading to SW smearing, which was consistent with the experimental results [13].
In [14], the effect of a combined energy deposition in the supersonic flow is considered, and a double-vortex mechanism influencing the AD body was suggested. Besides, it was shown that the generation of double vortices is the result of the RMIs manifestation at two points in the flow. A natural continuation of this idea was the study of the effect of a TSS on the supersonic flow past an AD body [15], where a new multi-vortex mechanism of the TSS action on the surface of an AD body connected with multiple manifestations of the RMIs was established. Basic principles for non-stationary and stationary control of a high-speed flow using TSSs were obtained [16,17]. A possibility of controlling the bow shock wave (BSW) and the aerodynamic characteristics of a streamlined body, such as parameters at the stagnation point, drag and lift forces, location, and shape of the BSW, etc., by using a TSS in front of the BSW has been shown.
In [18], the complex conservative difference schemes are presented, which have the second order of space–time approximation on a minimal stencil, which is the stencil of Lax’s scheme. The scheme is conservative in space and time everywhere in the computational domain, including its parts adjacent to the boundaries of the body. The Thomas waveform parameter method [19], originally developed to obtain pressure signatures during tests in a wind tunnel, is now widely used for obtaining far-field pressure signatures based on the near-field pressure signatures generated by CFD solvers. Currently, there are several codes for the propagation of these signals, including the Thomas code, PC Boom, and boom codes, as well as a novel implementation of the Thomas algorithm, the SUBoom code, the description of which is presented in [20]. The approach for calculating PLdB [21] includes the PyLdB code, which is based on the Mark VII algorithm [22].
The wide possibilities of flow control using TSSs have been shown previously [14,15,16,17]. However, the question remained as to what noise could be introduced to the ground during flow/flight control with the use of TSSs. The present paper gives an answer to this question; however, so far, in a limited range of the characteristics of flow and AD models. This work is devoted to the study of the problem of noise generation during flights of supersonic civil aircraft (Sonic Boom problem) (M = 1.5–2). The fields of the flow parameters and the dynamics of the drag forces of a pointed cylinder aerodynamic model by means of a TSS with a different number of layers and different temperatures in the layers are studied. The influence of the TSS used for the flow control on the near-field pressure signatures (NFPS) and the ground pressure signatures (GPS) is considered using the approaches from [18,19], accordingly, and the impact of the perceived loudness in decibels (PLdB) is estimated on a base of the code from [21]. It has been shown that when controlling the flow with the help of TSS of the considered parameters, no additional noise impact on the ground is introduced, which is a step forward in expanding the ability to control high-speed flows using TSS.

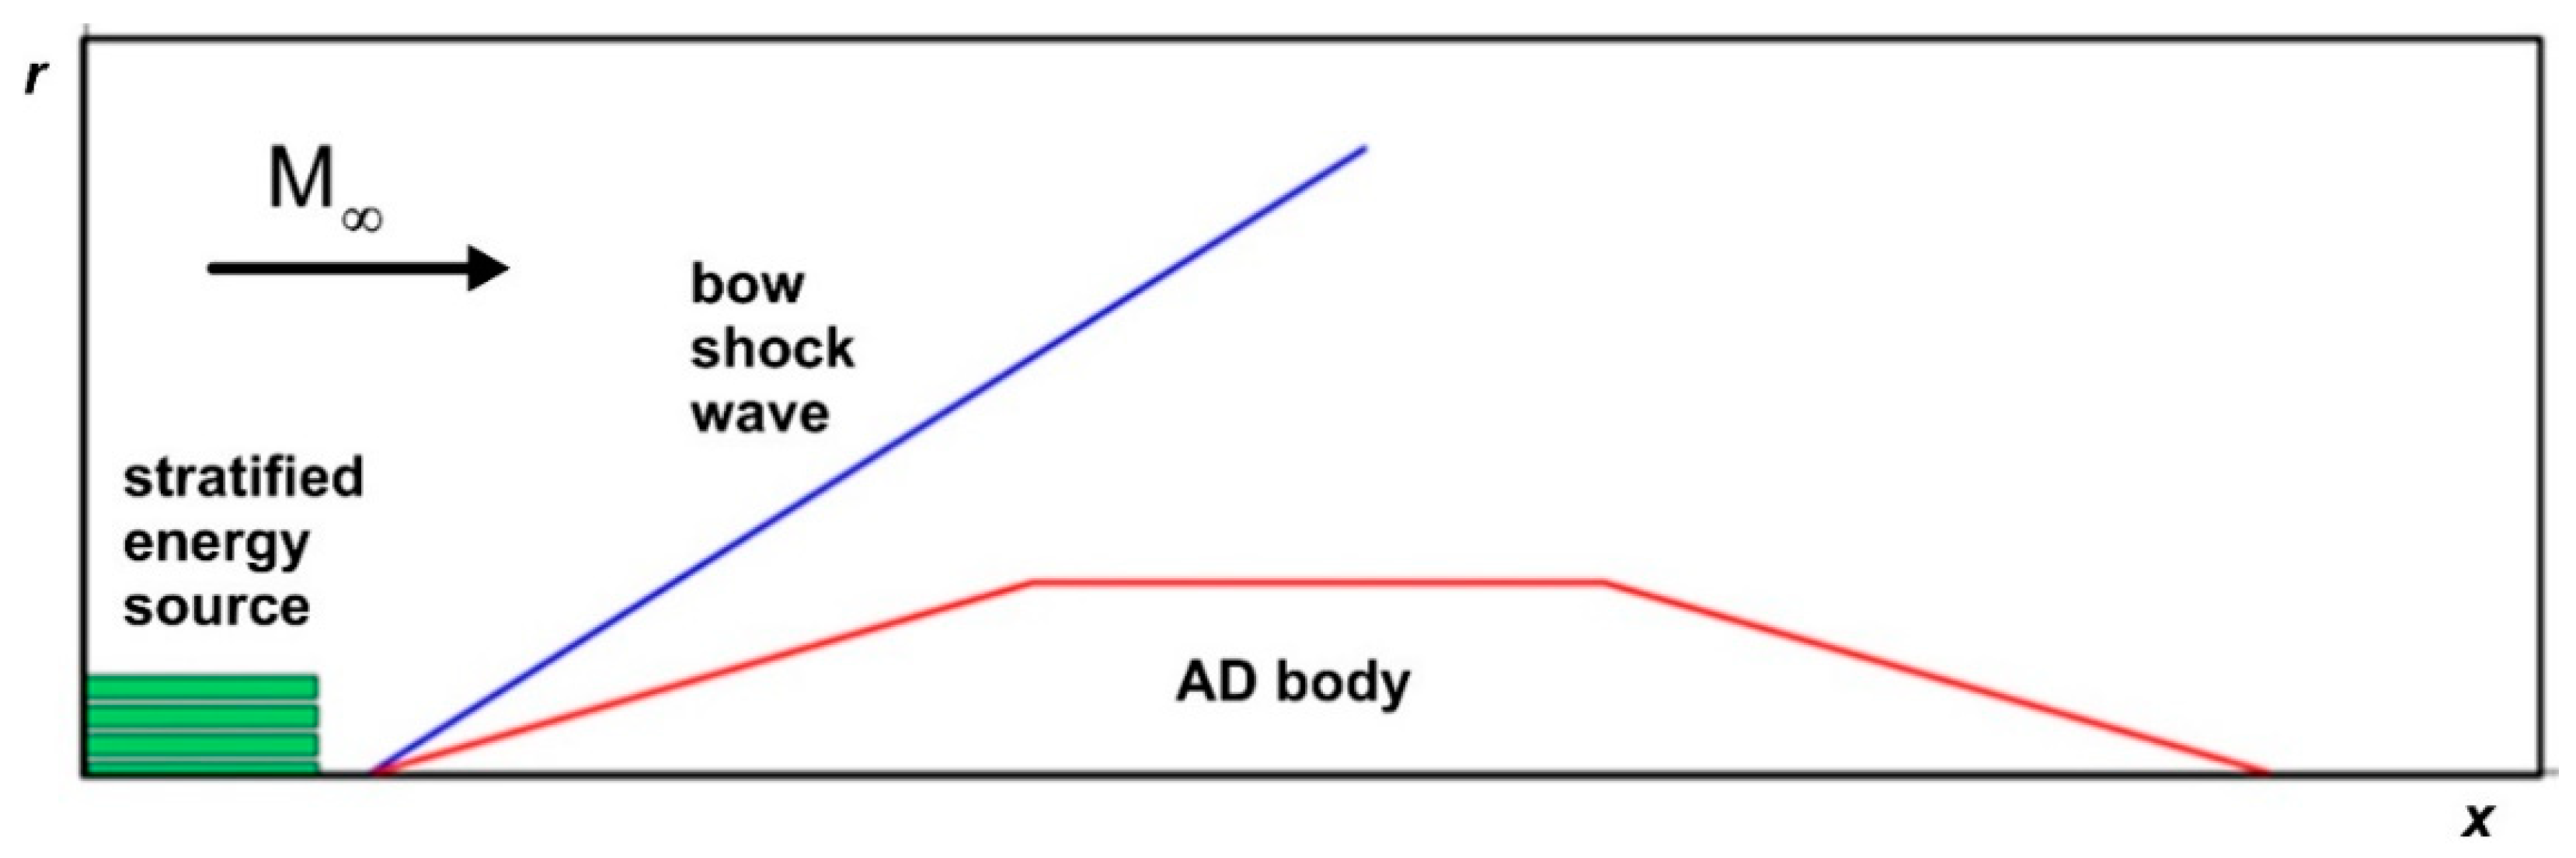
2. Statement of the Problem and Methodology for the Near-Field Simulation

The impact of an area of thermally stratified energy deposition (which, for short, hereinafter referred to as thermally stratified energy source—TSS) on a supersonic flow past a pointed cylinder body is considered. The freestream Mach number M is equal to 1.5 and 2 (Figure 1). It should be noted that the shapes of AD bodies considered in the research were chosen to achieve an attached BSW and do not apply to any existing aircraft shape.
The simulation of the flow for evaluating the near-field pressure signature is based on the Euler system of equations in a cylindrical form for a perfect inviscid gas with the ratio of specific heats γ = 1.4:
( U r ) t + ( F r ) x + ( G r ) r = H ,
U = ( ρ , ρ u , ρ v , E ) T , F = ( ρ u , p + ρ u 2 , ρ u v , u ( E + p ) ) T ,
G = ( ρ v , ρ u v , p + ρ v 2 , v ( E + p ) ) T , H = ( 0,0 , p , 0 ) T ,
E = ρ ( ε + 0.5 ( u 2 + v 2 ) ) .
The state equation for a perfect gas is used:
ε = p / ( ρ ( γ 1 ) )
Here ρ, p, u, v are the gas density, pressure, and velocity x- and y-components, ε is the specific internal energy. The following normalizing values for the parameters are accepted:
ρ n = ρ , p n = 5 p , l n = k l 1 R , T n = T , u n = ( p / ρ ) 0.5 , t n = l n / u n .
where kl is the dimensionless value of R.
The thermally stratified energy source (TSS) was defined as a set of rarefied gas layers located in front of the BSW (Figure 1). The layers in TSS were chosen to have the same width; distances between them were equal to half the layer’s width. Inside every j- layer, the gas density was reduced, ρj = αjρ, with the rarefaction coefficient αj < 1, j = 1 ÷ N, N is a number of layers in TSS in the calculation area taking into account the cylindrical symmetry of the problem (for example, in the TSS in Figure 1, N = 3.5). Other parameters of TSS were set equal to their freestream values, pj = p, uj = u, vj = 0. So, the temperature inside the layers was increased compared to its freestream value, Tj = αj−1T. The flow cases are considered when the r-coordinate of the upper boundary of the TSS is not greater than 1.1R, where R is the radius of the cylinder part of the AD body.
For evaluation of the NFPS, we used our own software package based on the complex conservative difference schemes [18]. When constructing these schemes, differential consequences of Equation (1) are used, which makes it possible to obtain the second order of space–time approximation on a minimal stencil, which is the stencil of the Lax’s scheme. So, the grids used are Cartesian and staggered. The boundaries of the body are included in the computational domain without violating the space–time conservation properties. The construction of the complex conservative schemes in the computational domain and near the boundaries of an AD body, as well as numerous test examples, are presented in [18].
The position of the conical part of the body on the difference grid is shown in an enlarged view in Figure 2. In the calculations, the distance between the stencil nodes at each time level was assumed to be 2hx, 2hr (where hx, hr are the space steps in the x- and r-directions).

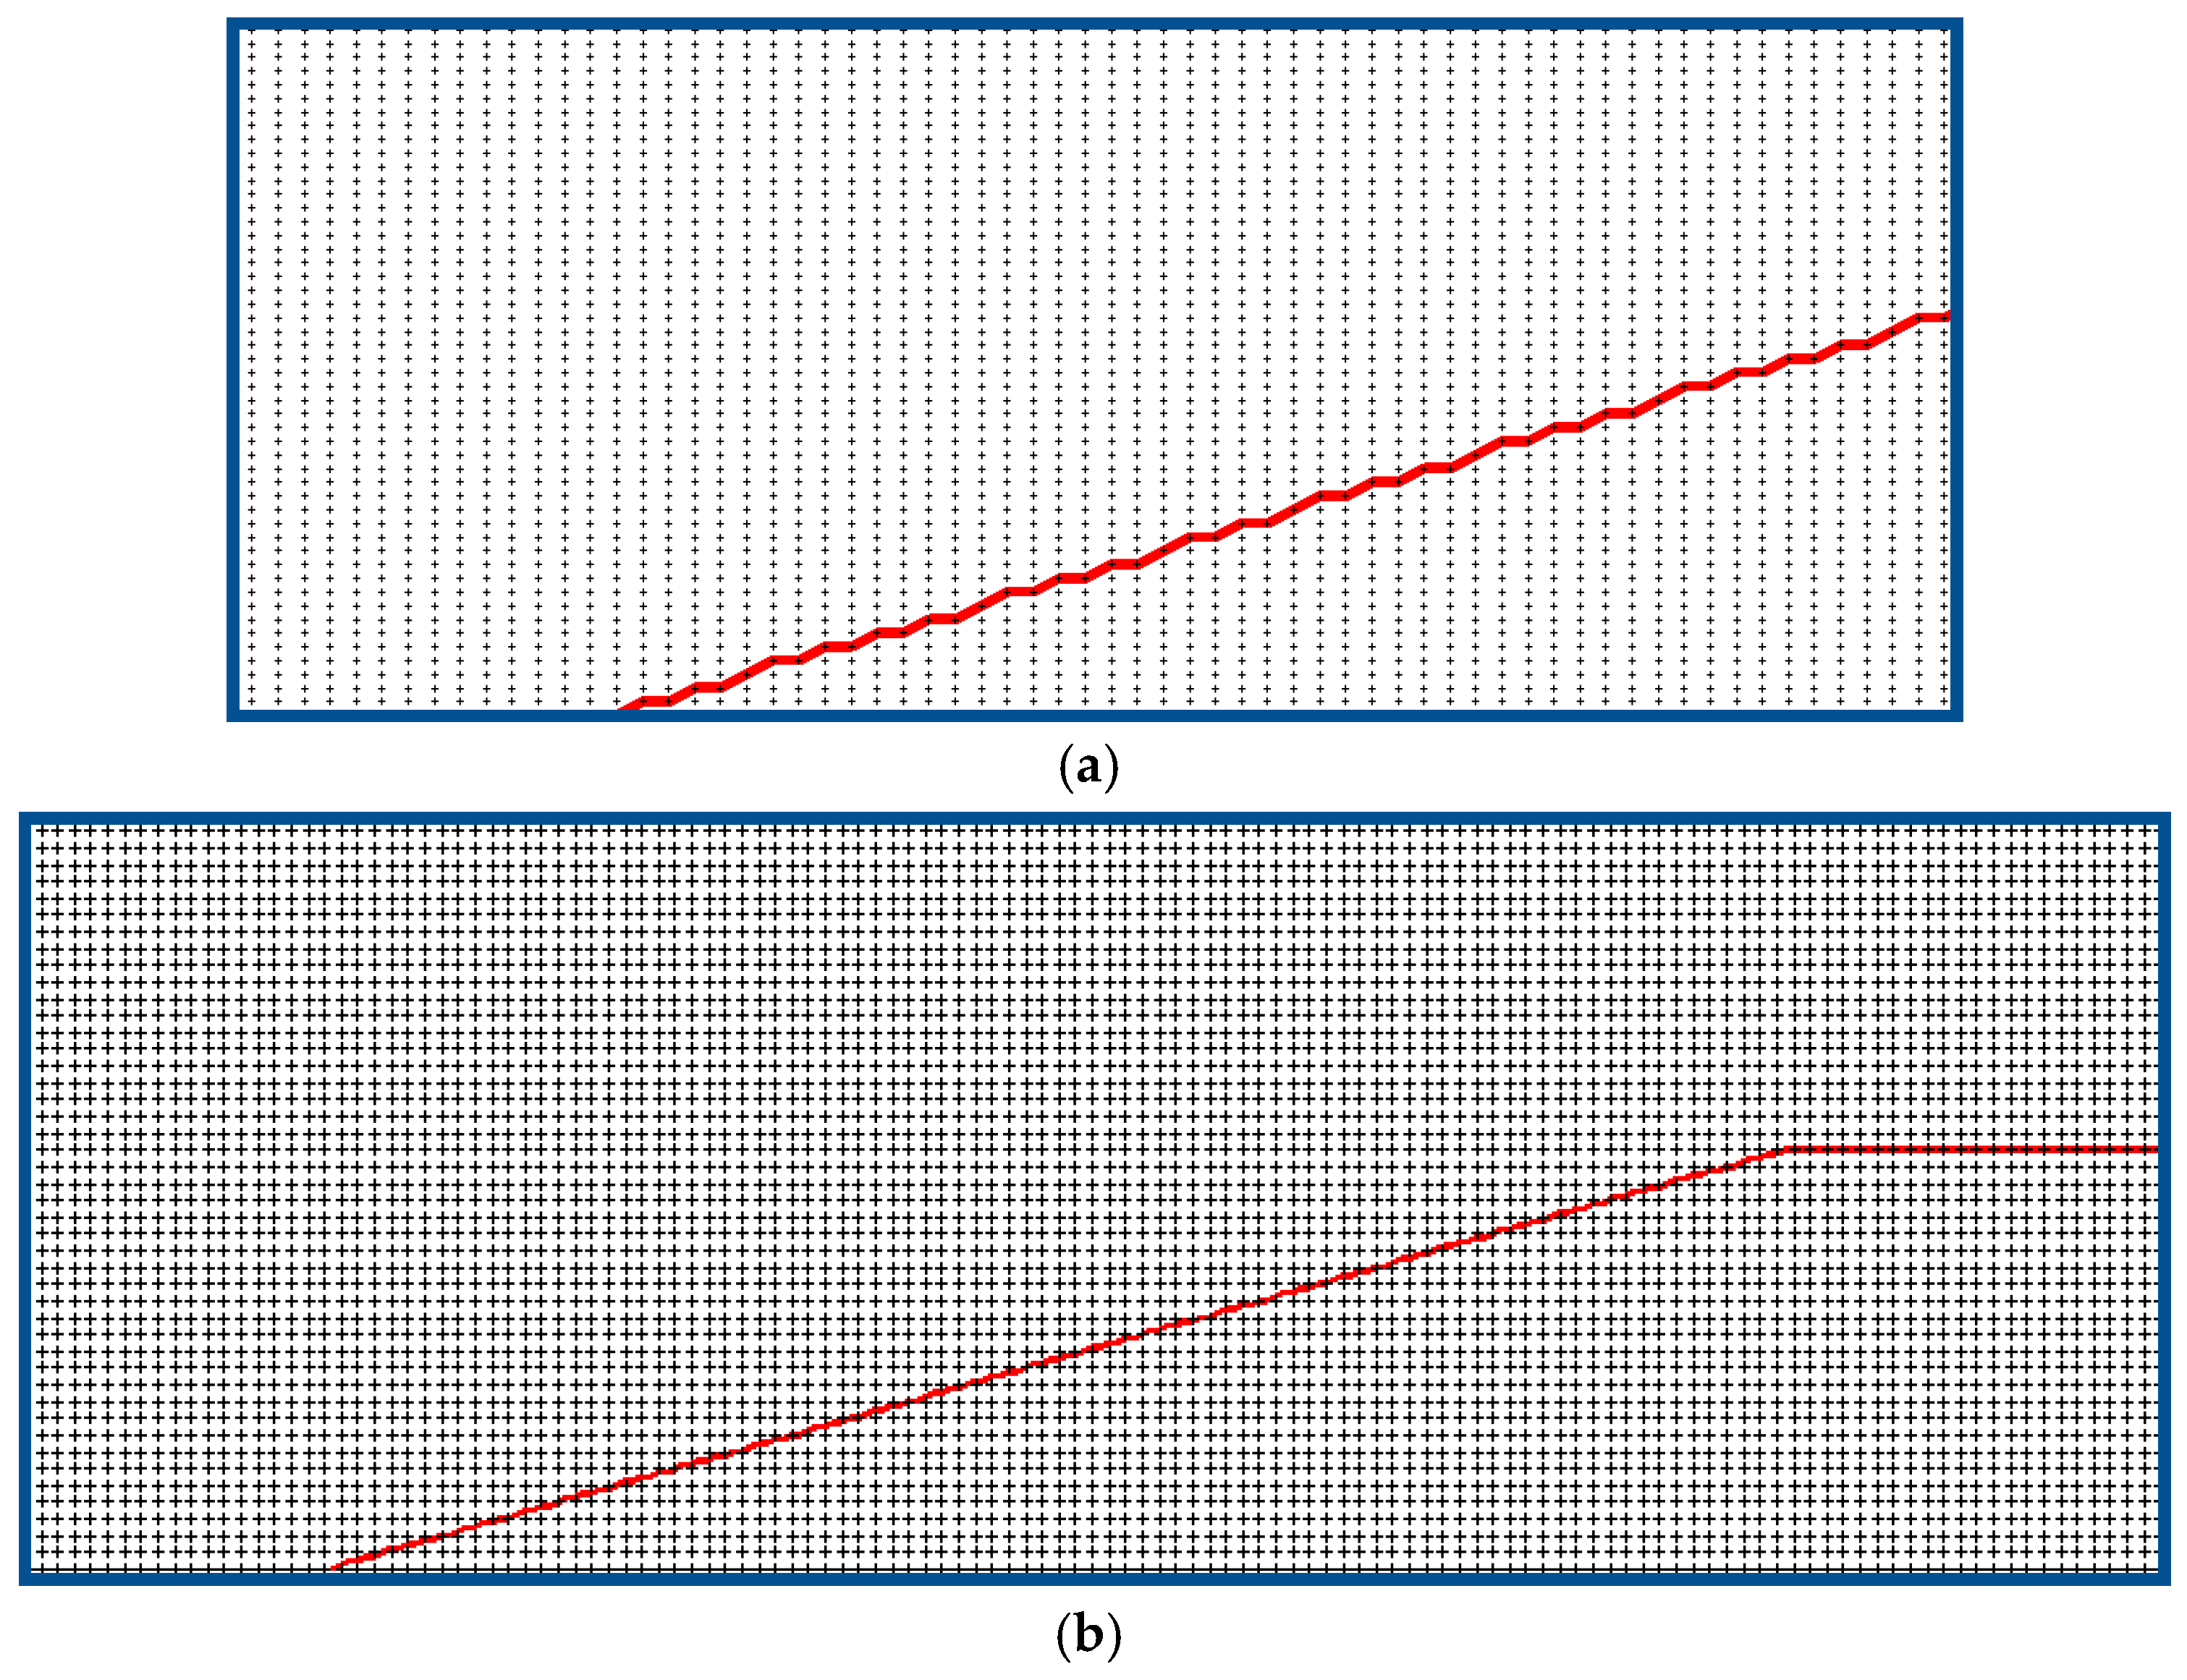
3. Analysis of the Grid Convergence

For the analysis of the grid convergence, the calculations of flow dynamics up to the establishment of the steady flow mode for three difference grids were conducted (Table 1, t = 1.5). Here for the grid convergence test, the computational domain was cut off in x- and in r- directions and the flow near the body was considered.
Figure 3 demonstrates the flow fields in isochores (Figure 3a), the dynamics of the parameters at the apex of the body (Figure 3b) obtained using these three difference grids, and the profiles of pressure and density in the BSW for r = 0.504 (Figure 3c). The number of points in Grid 1 and Grid 3 differs by about 9 times, and in Grid 1 and Grid 2 by 4 times, but, nevertheless, the isochores of the flow near the body and the shape of the BSW practically coincide (see Figure 3a). The dynamics of pressure and density at the body’s top point differ only at the initial stage (where the solution is not smooth) and are practically the same at the steady flow mode (Figure 3b). Besides, the profiles of pressure and density in the BSW show the tendency to become more vertical with decreasing the space steps (Figure 3c). Note that the difference scheme is not monotonic and gives two numerical oscillations before and after the SW front [18]. All these test variants show the presence of grid convergence in the used numerical methods.

4. Results

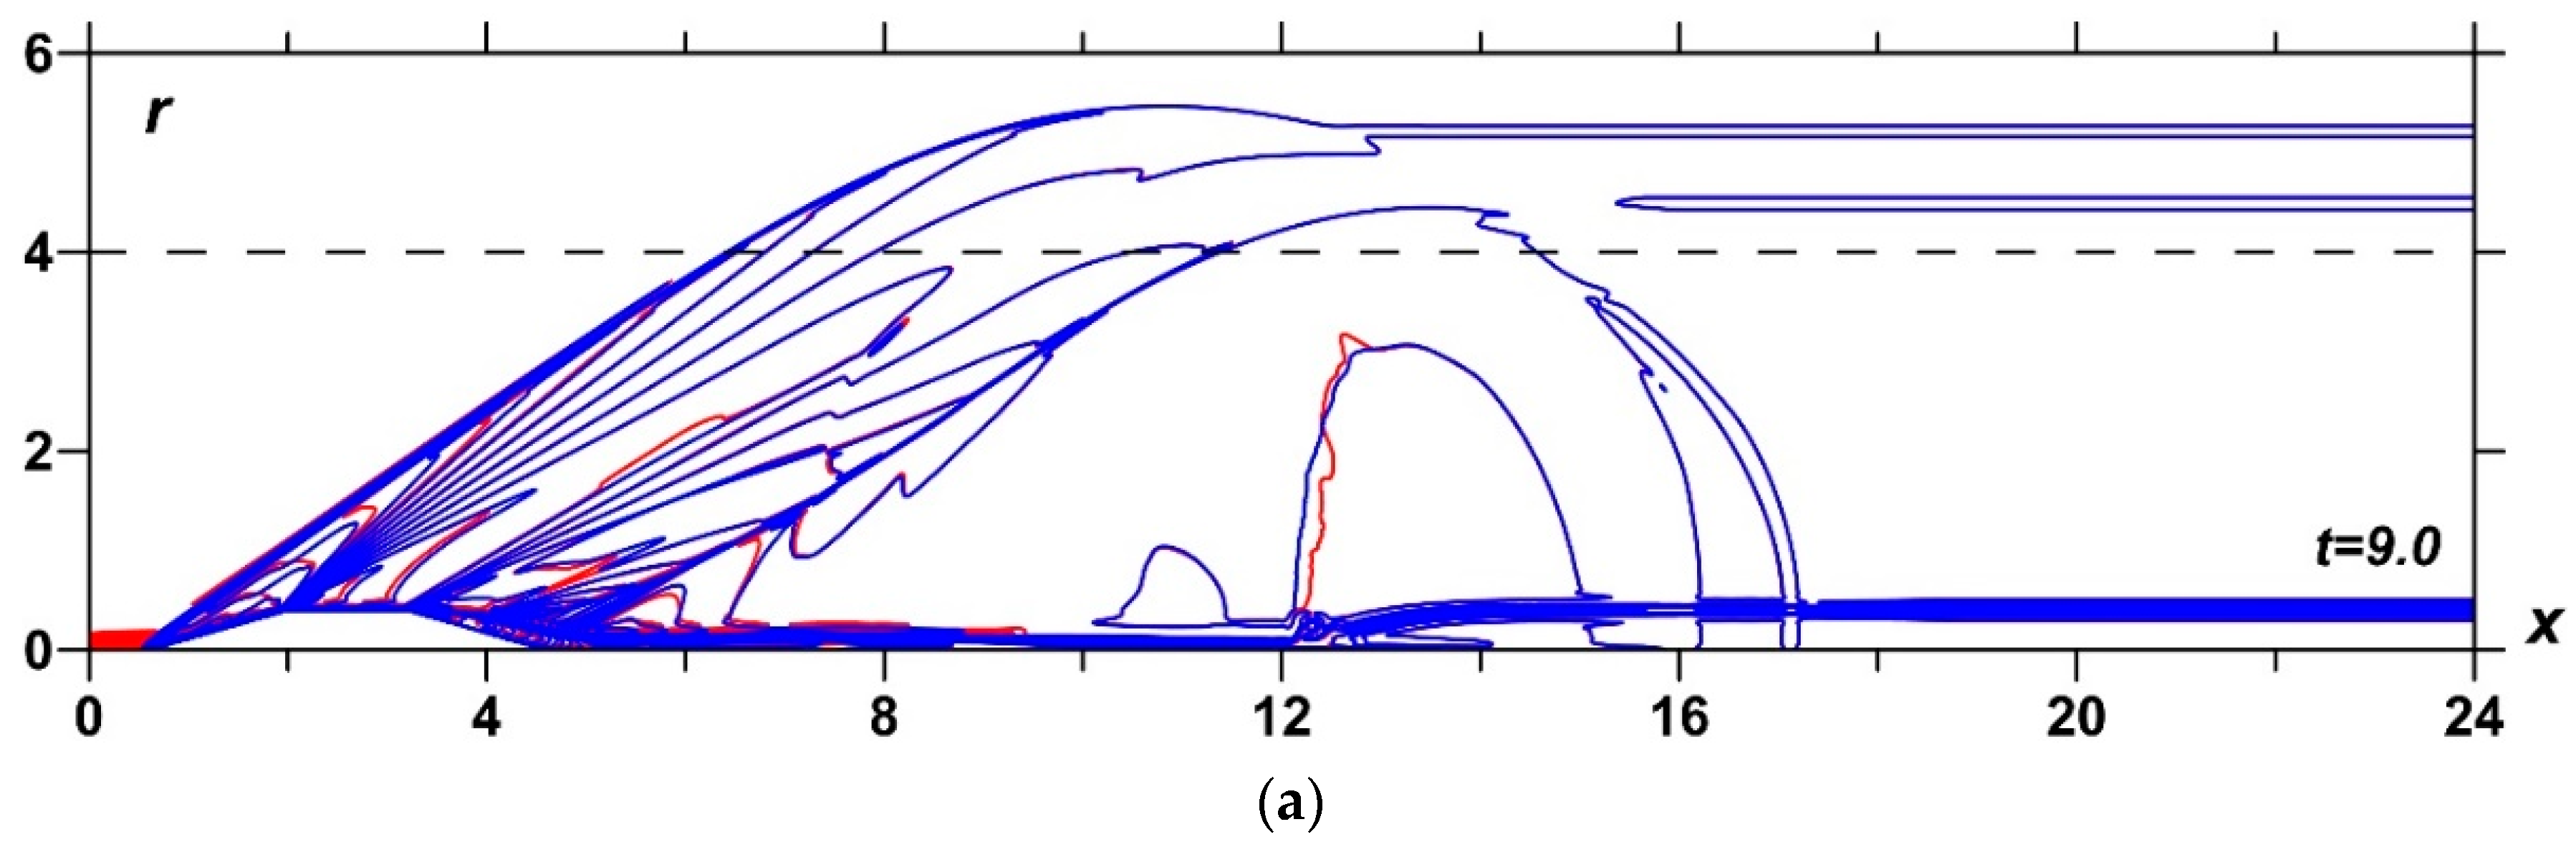
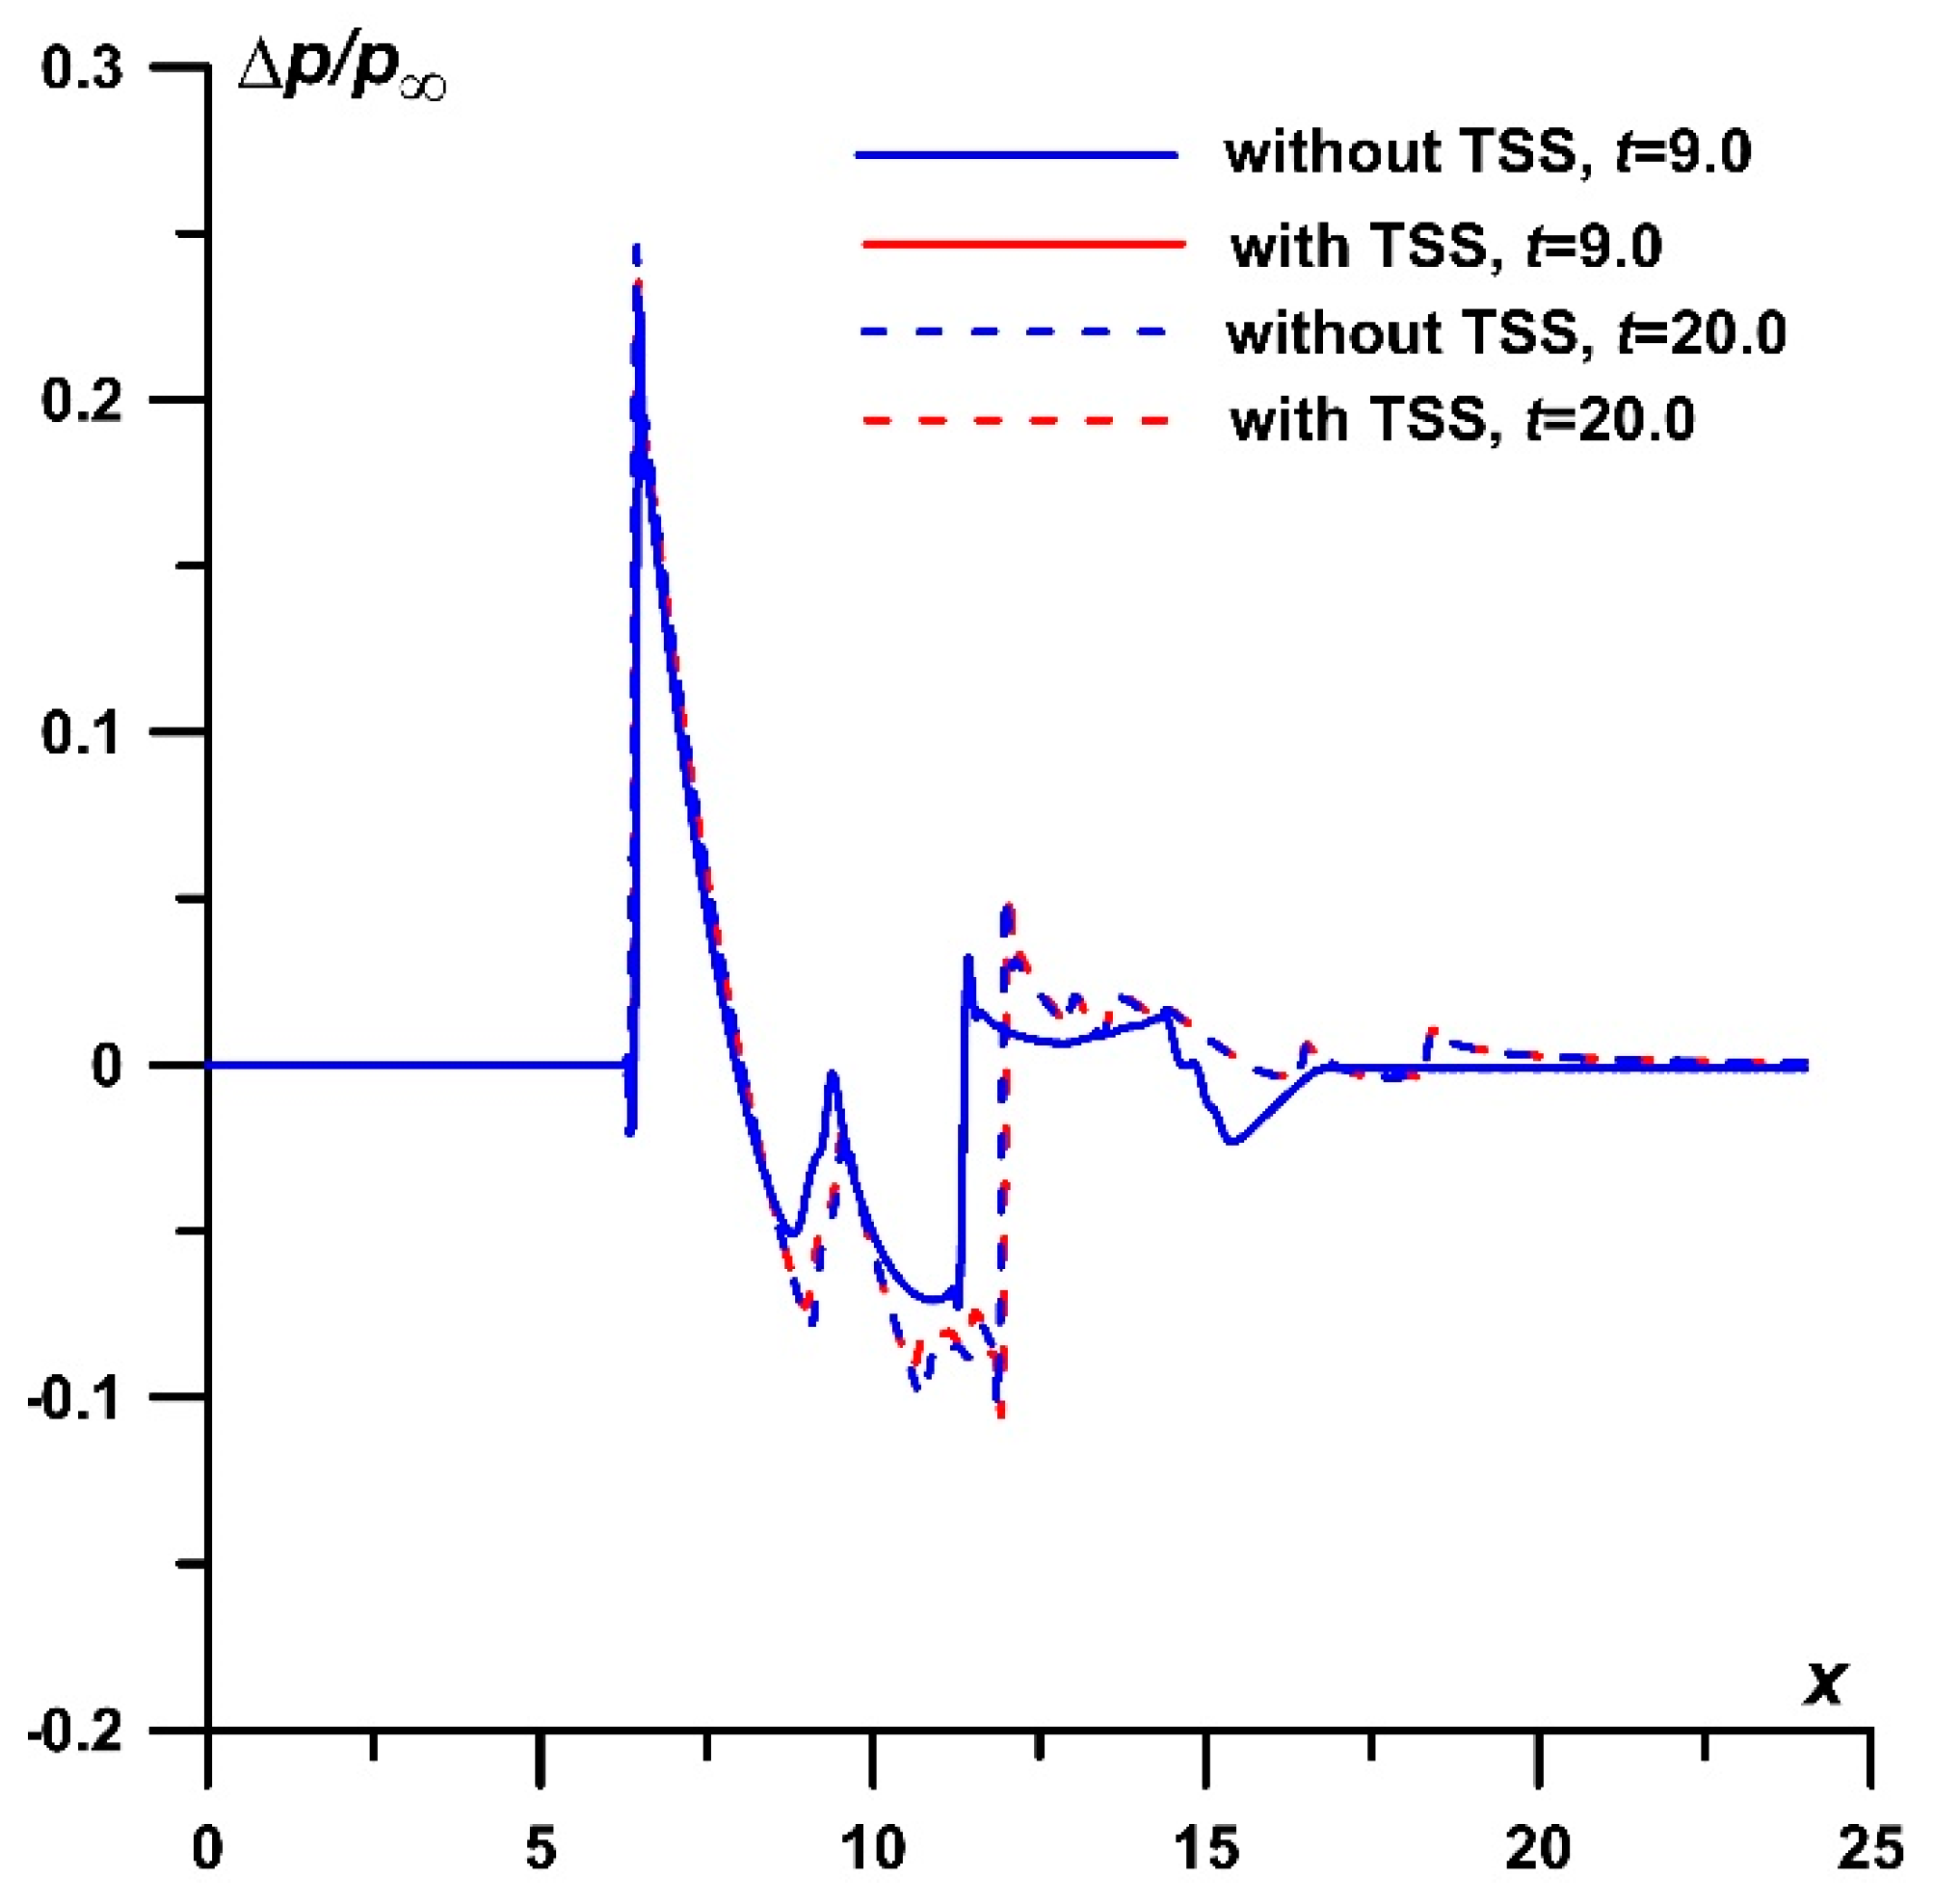
4.1. The Effect of TSS on the BSW, Near-Field Pressure Signature, and Aerodynamic Characteristics of a Body, L/R = 10

First, let us consider the effect of TSS on the BSW and the aerodynamic characteristics of a pointed AD body for a fairly short body. The angle at the top of the model was 16.6° fore and aft, L/R = 10. The dimensional length of the body is presumably 5 m. The parameters used in the simulations are presented in Table 2. The TSS is assumed to occur at the initial stage of the process, at the time ti = 0.001, and it is supposed that it has an unlimited duration in time. In Section 4.1, for the simulations, we used Grid 2 (hx = 0.004, hr = 0.002) on the computation domains, which was extended to the entire calculation area and contained 18 × 106 nodes (counting the middle point of the stencil).
The dynamics of the density fields at M = 2 in isochores under the action of TSS containing 2.5 layers with equal rarefaction parameters in the layers αj = 0.3 is presented in red in Figure 4a–c. Here the r-coordinate of the upper boundary of the TSS is Rs = 0.35R. For comparison, the dynamics of the density fields without the impact of the TSS are also shown (blue). The density fields are presented for two different time moments, t = 9.0 and t = 20.0, which reflect unsteady and steady flow modes relative to the flow at the level of r = 4.0 (Figure 4a,b). Figure 4c shows the density field during the interaction of TSS with the BSW in an enlarged view. The corresponding density fields for the steady flow mode (t = 20.0) in colors and isochores are presented in Figure 4d,e. It can be seen that, far from the body, disturbances provided by the TSS are practically not introduced into the flow, while near the body, the source introduces noticeable changes in the flow process. In particular, it can be noted that a fragment of the BSW is completely blurred inside the TSS region (see red isochores).
The dynamics of the corresponding profiles of relative pressure Δp/p for r = 4.0 are presented in Figure 5. Here Δp/p = (p(x) − p)/p. Next, we studied the pressure profiles for t = 20.0 at the level of r = 4.0 (near-field pressure signatures—NFPS) when these pressure profiles are close to stationary in time.
The relative pressure profiles Δp/p at the level r = 4.0 (NFPS) for TSS with different values αj are presented in Figure 6a. It can be seen from the enlarged image (Figure 6b) that the smaller αj in the TSS (the higher the temperature in the layers), the greater the effect of this TSS on the BSW front. One can also conclude that this effect causes a decrease in pressure at the BSW front.
The density fields in isochores of the steady flows at t = 20 and αj = 0.15 under the action of the TSSs with the number of layers N = 3.5 (Rs = 0.5R), N = 5.5 (Rs = 0.8R), and N = 7.5 (Rs = 1.1R) are presented in Figure 7a,b, Figure 8a,b and Figure 9a,b, accordingly (in red). The distance between isochores is 0.05. The enlarged images of the density fields during the interaction of different TSSs with the BSW are also shown there. For comparison, the corresponding dynamics of the density fields without the impact of the TSS are shown (in blue) as well. In Figure 7c, the density field for the steady flow mode (t = 20.0) in the absence of TSS, in colors and isochores is presented. In Figure 7d, Figure 8c and Figure 9c, the corresponding density fields under the TSS impact, in colors and isochores are presented. In the behavior of the density fields for a different number of layers in the TSS, the same trend can be obtained as for N = 2.5 (Figure 4); namely, the influence of the TSS is localized in the area immediately adjacent to the body (and behind it).
The enlarged images in Figure 4c, Figure 7b, Figure 8b and Figure 9b show that the front of the BSW in the TSS region is almost completely blurred (see the red contours). This is taken place due to the influence of three factors that distinguish the effect of TSS from the effect of homogeneous energy sources. Firstly, this is a manifestation of the RMI in multiple points at the initial stage of interaction, which smears the BSW [15,16]. Secondly, the influence of the heated layers interspersed with cold gaps between them changes the shape of the BSW and gives it a wavy appearance, which also contributes to the blurring of its front. The third one is, of course, that the BSW also weakens simply due to a change in the Mach number inside the heated layers. This smearing of the front under the action of the TSS is further influenced the pressure amplitudes in the near-field signature and, finally, may possibly affect the pressure amplitudes in the ground signature and the PLdB on the ground.
The possibility of flow control using heated filaments has been well-proven both experimentally and theoretically (see [1,2,3,4]). Figure 10 and Figure 11 demonstrate the possibility of flow control for the considered shape of the body at M = 1.5 and M = 2 using the considered TSSs, in particular, controlling the drag force F. Here
F = 0 R p b r d r ,
where pb is the pressure on the conical surface. For comparison, the corresponding dynamics of F is also shown in the absence of the influence of TSS (in blue). It can be seen that the smaller αj in the TSS (the higher the temperature in the layers), the greater the influence of this TSS on the stationary value of the drag force F (Figure 10). The greatest effect εF for αj = 0.15 is 10.8% (from the value of F 0 without the impact of TSS) at M = 2 and 11.1% at M = 1.5. Here
ε F = ( F F 0 ) / F 0 × 100 % .
In Figure 11, the dynamics of F are presented at M = 1.5 and M = 2 for αj = 0.15 under the action of the TSSs with 3.5, 5.5, and 7.5 layers. One can see that the greater the number of layers N in TSS in the TSS, the stronger the effect of this TSS on the steady value of the drag force F (Figure 11). The greatest effect (for N = 7.5) is 15.1% of the value of F without the impact of TSS at M = 2 and 12.3% at M = 1.5.
At the same time, analyzing the corresponding relative pressure profiles at the level of r = 4.0 at t = 20 (NFPS), it can be concluded that the considered TSSs decrease the pressure at the BSW front (for example, by 2.8% of p for the best case of the TSS with N = 7.5 for M = 2 and 7.4% for M = 1.5, using the same criterion as for F) (Figure 12). Thus, when controlling the flow with the help of TSS under the considered parameters at M = 1.5–2, the NFPSs do not show an increase in the amplitudes of the BSW front values in the near-field region to the AD body.

4.2. The Effect of TSS on the BSW and Near-Field Pressure Signature, L/R = 12.5; Energetic Considerations

In order to evaluate the impact of the PLdB during the implementation of flow control using the TSS, calculations of the relative pressure Δp/p in the near-field for a longer body (L = 10) at the level of r = 16.8 were carried out. An angle at the model’s top is 24°, L/R = 12.5. The dimensional length of the body is presumed to be 80 m. Characteristics of the flow and AD model applied in the simulations in Section 4.2 have an order of real parameters of aircraft (see Table 3).
In Section 4.2, the calculations were carried out on a grid of 9600 × 4500 (43.2 × 10⁶ nodes, counting the middle node of the stencil) with hx = 0.005, hr = 0.004.
Dynamics of density fields for αj = 0.25 under the action of the TSS with the number of layers N = 7.5 (Rs = 1.1R) compared with that in the absence of TSS at M = 1.5, 2 is presented in Figure 13. In Figure 14, the dynamics of F are presented at M = 1.5 and M = 2 for αj = 0.25 under the action of the TSSs with 7.5 layers (of the greatest effect). The effect in the reduction of the drag force F is 20.7% at M = 2 and 19.0% at M = 1.5.
Figure 15 shows a comparison of the NFPS Δp/p at r = 16.8 in the case of the absence of TSS (blue) and in the presence of TSS with αj = 0.25, N = 7.5 (orange). For this flow geometry, the NFPS is considered for t = 40. One can see that the action of TSS does not increase the amplitude of the BSW in the NFPS in spite of the presence of the effect of drag reduction. The reason for this is that the TSS impact on the BSW is concentrated in the area closest to the body.
Using the Formulas (20) and (25) from [5], it is possible to evaluate the effective power P required for the creation of the considered stratified energy sources. Taken into account that the half-width of the layers in considered TSSs rs = 10hr and the coordinates of the centers of layers rc in these simulations can be calculated as r c = 30 ( N 0.5 ) h r , the effective power P can be evaluated as follows:
P = π / 4 γ γ 1 β u p r s 2 / 4 1 α j + 4 π ( N 0.5 ) γ γ 1 β u p r c r s 1 α j = = π γ γ 1 β M c p 100 h r 2 1 α j ( 1 / 16 + 12 ( N 0.5 ) 2 ) ,
where a constant β = 0.1 [5]. The values of the effective power for the parameters of the simulations from Section 4.2 and Section 4.3, αj = 0.25, N = 7.5 using the obtained expression for P are 591.27 MW for M = 1.5 and 788.37 MW for M = 2, which are large and likely impractical. Nevertheless, we examine the maximal possible effect from the considered TSS to evaluate the perceived level in decibels (PLdB) impact on the ground during the implementation of the flow control using TSS.

4.3. The Effect of TSS on the GPS and PLdB on the Ground, L/R = 12.5

To assess the PLdB impact on the ground, we were guided by the approach proposed in [19,20]. According to the calculated near-field, the Thomas waveform parameter method [19] allows approximating the pressure profile in the far zone by solving the ODE system, which approximates the ground pressure signature (GPS) after the signal has passed through the atmosphere. The GPS is characterized by the rates of change in the sound speed, the density of the environment, and the propagation velocity depend on the trajectory of the signal.
The profiles of NFPS from Figure 15 were processed with the use of the software packages from [19], which realizes the Thomas waveform parameter method to simulate the passage of a signal through the atmosphere. We evaluated the impact of only the “N-wave” in the profiles; besides, the profiles were shifted to the coordinate origin.
Figure 16 shows the processing of the NFPS profiles and the final GPSs resulting after using the numerical code from [19]. The GPSs are expressed in pounds per square foot. A comparison is shown at M = 2 and M = 1.5 for the cases of the absence of the TSS action (blue) and of the maximal effect of the TSS on the NFPSs (N = 7.5) (orange) at the level of r = 16.8. The flight altitude was supposed to be equal to 10,000 m or 32,808.4 ft.
The corresponding values of the PLdB impact on the ground evaluated using the open-source package PyLdB [21] are presented in Table 4. The PyLdB code implements the perceived loudness level calculation determined using the algorithm Mark VII, where the perceived value is correlated with the table of the corresponding range compiled by Stevens, and the value of the perceived amplitude is converted to the PldB, according to the additional table [22].
One can see that at M = 1.5–2, the TSS, which has the maximum effect on the front of the BSW (and on the NFPS as well), does not increase the impact of the ground sound pressure. Thus, it can be concluded that controlling the flow (past an AD model of the considered shape) using the TSSs with the considered parameters does not increase the PLdB impact on the ground.
Besides, from these simulations, one can conclude that changing the surface pressure on the AD body due to drag reduction does not necessarily cause a change in the PLdB on the ground.

5. Conclusions

A study was made of the effect of a thermally stratified energy source on the supersonic flow past a pointed cylindrical body “cone-cylinder-cone” at M = 1.5, 2.0. Density fields under the influence of the stratified energy sources (TSS) with different temperatures in their layers and different numbers of layers were investigated. A comparison was made with the density fields for steady supersonic flow in the absence of external influence. It was shown that the higher the temperature in the layers in the TSS and the greater the number of layers in it, the greater the influence of such a TSS on the amplitude of the BSW and the value of the frontal drag force of the AD body.
Pressure signatures in the near-field and on the ground, as well as the sonic boom impact on the ground in decibels (PLdB), have been studied at freestream Mach numbers 1.5, 2. The calculations in the near-field use the author’s code based on the complex conservative difference schemes. For obtaining the ground pressure signature, the Tomas’ waveform parameter method was employed, and the PLdB was evaluated using the Stevens’ calculation algorithm Mark VII, which was realized in the PyLdB code. The validation of the results was proved by the analysis of the grid convergence using three difference grids.
The number of layers in TSS varied from 2.5 to 7.5, and the rarefaction parameters in the layers were set from 0.15 to 0.3. It was found that when controlling the flow by changing the temperature in the layers of the TSS and changing the number of layers in TSS, there was some decrease in pressure at the BSW front, in nearfield and ground pressure signatures, and these values did not exceed those for the flow without a TSS. In other words, it has been shown that when performing the flow control using considered thermally stratified energy sources, no additional noise is introduced on the ground. Besides, in a broad sense, the simulations showed that changing the surface pressure signature due to drag reduction does not necessarily imply a change in the perceived loudness in decibels (PLdB) on the ground.
The results obtained are valid for the considered AD models and TSSs with the considered characteristics. For other models and other characteristics of TSS, the same predictive simulations should be carried out, which we plan to do in future work. Nevertheless, the results presented can be considered as a step forward in expanding the ability to control high-speed flows using TSS.

Author Contributions

Conceptualization, D.D.K.; data curation, O.V.K., O.A.A. and D.D.K.; formal analysis, O.V.K., O.A.A. and D.D.K.; methodology, O.A.A. and D.D.K.; software, O.V.K. and O.A.A.; supervision, D.D.K.; validation, O.V.K., O.A.A. and D.D.K.; visualization, O.V.K. and O.A.A.; writing—original draft, O.A.A., D.D.K. and O.V.K. All authors have read and agreed to the published version of the manuscript.

Funding

This research received no external funding.

Informed Consent Statement

Not applicable.

Data Availability Statement

The data that support the findings of this study are available from the corresponding author, O.A.A., upon reasonable request.

Conflicts of Interest

The authors declare no conflict of interest.

Nomenclature

ADaerodynamic
TSSthermally stratified energy source
SWshock wave
BSWbow shock wave
RMIRichtmyer–Meshkov instability
PLdBperceived loudness in decibels
GPSground pressure signature
NFPSnear-field pressure signature
Rradius of a cylinder part of the aerodynamic body
Mthe freestream Mach number
p, ρ, u, vpressure, density, and velocity components of a gas
pbthe pressure on the conical surface of an AD body
ttime
αjrarefaction parameter in a j-layer of the stratified energy source
Na number of heated layers in TSS
rsj-layer half-width
rcj-layer center r-coordinate
Rsupper TSS boundary r-coordinate
γadiabatic index
Indices
jparameters in j-layer in TSS
nscale values
tstagnation values
parameters of the freestream flow

References

  1. Knight, D.D. Review of Energy deposition for high-speed flow control. Energies 2022, 15, 9645. [Google Scholar] [CrossRef]
  2. Ahmed, M.Y.M.; Qin, N. Forebody shock control devices for drag and aero-heating reduction: A comprehensive survey with a practical perspective. Prog. Aerosp. Sci. 2020, 112, 100585. [Google Scholar] [CrossRef]
  3. Leonov, S.B. Review of plasma-based methods for high-speed flow control. In Proceedings of the Sixth International Conference on Fluid Mechanics AIP Conference Proceedings, Guangzhou, China, 30 June–3 July 2011. [Google Scholar] [CrossRef]
  4. Fomin, V.M.; Tretyakov, P.K.; Taran, J.-P. Flow control using various plasma and aerodynamic approaches (short review). Aerosp. Sci. Technol. 2004, 8, 411–421. [Google Scholar] [CrossRef]
  5. Knight, D. Reduction of sonic boom signature using energy deposition. In Proceedings of the AIAA SciTech Forum, San Diego, CA, USA, 3–7 January 2022. [Google Scholar] [CrossRef]
  6. Park, M.A.; Nemec, M. Nearfield Summary and Statistical Analysis of the Second AIAA Sonic Boom Prediction Workshop; American Institute of Aeronautics and Astronautics: Reston, VA, USA, 2018; pp. 1–61. [Google Scholar] [CrossRef] [Green Version]
  7. Georgievsky, P.Y.; Levin, V.A. Supersonic Flow Over Bodies in the Presence of External Energy Release. Pis’ma v Zh. Tekh. Fiz. 1988, 14, 684–687. (In Russian). Available online: http://journals.ioffe.ru/articles/viewPDF/31216 (accessed on 3 July 2023).
  8. Artem’ev, V.I.; Bergel’son, V.I.; Nemchinov, I.V.; Orlova, T.I.; Smirnov, V.A.; Hazins, V.M. Changing the regime of supersonic streamlining obstacles via raising the thin channel of low density. Izv. Akad. Nauk SSSR Meh. Židk. Gaza. 1989, 5, 146–151. (In Russian) [Google Scholar]
  9. Kolesnichenko, Y.F.; Brovkin, V.G.; Azarova, O.A.; Grudnitsky, V.G.; Lashkov, V.A.; Mashek, I.C. Microwave energy release regimes for drag reduction in supersonic flows. AIAA 2002-0353. In Proceedings of the 40th Aerospace Sciences Meeting and Exhibit, Reno, NV, USA, 14–17 January 2002. [Google Scholar] [CrossRef]
  10. Leonov, S.B.; Carter, C.D.; Hedlund, B.E.; Houpt, A.W.; Ombrello, T.; Firsov, A.A. Control of amplitude and position of reflected shock wave by stripwise plasma. AIAA 2018-0683. In Proceedings of the Aerospace Sciences Meeting, Kissimmee, FL, USA, 8–12 January 2018. [Google Scholar] [CrossRef]
  11. Gan, T.; Wu, Y.; Sun, Z.; Jin, D.; Song, H.; Jia, M. Shock wave boundary layer interaction controlled by surface arc plasma actuators. Phys. Fluids 2018, 30, 055107. [Google Scholar] [CrossRef] [Green Version]
  12. Apazidis, N.; Sembian, S.; Liverts, M. Blast wave interaction with thermal and density inhomogeneities in air. In Proceeding of the 32nd International Symposium on Shock Waves, Singapore, 14–19 July 2019. [Google Scholar] [CrossRef]
  13. Lapushkina, T.A.; Erofeev, A.V.; Azarova, O.A.; Kravchenko, O.V. Interaction of a plane shock wave with an area of ionization instability of discharge plasma in air. Aerosp. Sci. Technol. 2019, 85, 347–358. [Google Scholar] [CrossRef]
  14. Azarova, O.A. Supersonic flow control using combined energy deposition. Aerospace 2015, 2, 118–134. [Google Scholar] [CrossRef] [Green Version]
  15. Azarova, O.A.; Kravchenko, O.V. Impact of a thermally stratified energy source on the bow shock wave and aerodynamic characteristics of a body. J. Phys. Conf. Ser. 2021, 1891, 012025. [Google Scholar] [CrossRef]
  16. Azarova, O.A.; Kravchenko, O.V. Principles of unsteady high-speed flow control using a time-limited thermally stratified energy source. Fluids 2022, 7, 326. [Google Scholar] [CrossRef]
  17. Azarova, O.A. Basics of control of the bow shock wave, drag and lift forces, and stability in a steady supersonic flow past an AD Body using permanently operating thermally stratified energy deposition. Energies 2022, 15, 8627. [Google Scholar] [CrossRef]
  18. Azarova, O.A. Complex conservative difference schemes for computing supersonic flows past simple aerodynamic forms. J. Comp. Math. Math. Phys. 2015, 55, 2025–2049. [Google Scholar] [CrossRef]
  19. Thomas, C.L. Extrapolation of Sonic Boom Pressure Signatures by the Waveform Parameter Method. NASA Tehnical Note D-6832. 1972, pp. 1–31. Available online: https://archive.org/details/NASA_NTRS_Archive_19720018354/mode/2up (accessed on 3 July 2023).
  20. Munguia, B.C.; Economon, T.D.; Alonso, J.J. A Discrete adjoint framework for low-boom supersonic aircraft shape optimization. In Proceedings of the 18th AIAA/ISSMO Multidisciplinary Analysis and Optimization Conference, Denver, CO, USA, 5–9 June 2017; AIAA 2017-3326. pp. 1–11. [Google Scholar] [CrossRef]
  21. Pyldb. “PyLdB”. 2019. Available online: https://github.com/usuaero/PyLdB (accessed on 20 April 2023).
  22. Stevens, S.S. Perceived level of noise by Mark VII and decibels (E). J. Acoust. Soc. Am. 1972, 51, 575–601. [Google Scholar] [CrossRef]
Figure 1. The scheme of the calculation domain.
Applsci 13 07927 g001
Figure 2. A pointed part of the AD model in a computational domain (increased): (a) each node in x and r is shown; (b) every second node in x and every fourth node in r is shown.
Applsci 13 07927 g002
Figure 3. Grid independence test: (a)—density fields, t = 1.5 (superposed). The distance between isochores is 0.08; (b)—dynamics of the pressure pt and density ρt at the top of the model; (c)—profiles of density and pressure for r = 0.504 in the BSW.
Applsci 13 07927 g003
Figure 4. Impact of TSS on the flow past the body: dynamics of the density fields, M = 2, without energy source—blue, with TSS, αj = 0.3; N = 2.5—red; (a) t = 9.0, isochores; (b) t = 20.0, isochores; (c) interaction of TSS with the BSW (enlarged, isochores). The distance between isochores is 0.05; (d) without TSS, t = 20.0, colors and isochores; (e) with TSS, t = 20.0, colors and isochores.
Applsci 13 07927 g004aApplsci 13 07927 g004b
Figure 5. Dynamics of profiles of relative pressure Δp/p for r = 4.0, M = 2, in TSS αj = 0.3, N = 2.5.
Applsci 13 07927 g005
Figure 6. Profiles of NFPS Δp/p for r = 4.0, t = 20, different αj, N = 2.5 (left); impact on the BSW, enlarged (right): (a) M = 2; (b) M = 1.5.
Applsci 13 07927 g006aApplsci 13 07927 g006b
Figure 7. Impact of TSS on the flow past the body: dynamics of the density fields, M = 2, without energy source—blue, with TSS, αj = 0.15; N = 3.5—red; (a) t = 20.0, isochores; (b) interaction of TSS with the BSW (enlarged, isochores); (c) without TSS, t = 20.0, colors and isochores; (d) with TSS, t = 20.0, colors and isochores.
Applsci 13 07927 g007
Figure 8. Impact of TSS on the flow past the body: dynamics of the density fields, M = 2, without energy source—blue, with TSS, αj = 0.15; N = 5.5—red; (a) t = 20.0; (b) interaction of TSS with the BSW (enlarged); (c) with TSS, t = 20.0, colors and isochores.
Applsci 13 07927 g008
Figure 9. Impact of TSS on the flow past the body: dynamics of the density fields, M = 2: without energy source (blue), with TSS, αj = 0.15, N = 7.5 (red); (a) t = 20.0; (b) interaction of TSS with the BSW (enlarged); (c) with TSS, t = 20.0, colors and isochores.
Applsci 13 07927 g009aApplsci 13 07927 g009b
Figure 10. Dynamics of the drag force for TSS with different αj, N = 5.5: (a) M = 2; (b) M = 1.5.
Applsci 13 07927 g010
Figure 11. Dynamics of the drag force for TSS with different N, αj = 0.15: (a) M = 2; (b) M = 1.5.
Applsci 13 07927 g011
Figure 12. Profiles of NFPS Δp/p for r = 4.0, t = 20, αj = 0.15, different N (left); impact on the BSW, enlarged (right): (a) M = 2; (b) M = 1.5.
Applsci 13 07927 g012
Figure 13. Impact of TSS on the flow past the body: dynamics of the density fields, M = 2, without energy source—blue, with TSS, αj = 0.25; N = 7.5—red; (a) t = 9.0; (b) t = 20.0; (c) t = 40.0; (d) interaction of TSS with the BSW (increased). The distance between isochores is 0.05; (e) with TSS, t = 20.0, colors and isochores.
Applsci 13 07927 g013aApplsci 13 07927 g013b
Figure 14. Dynamics of the drag force for TSS with N = 7.5, αj = 0.25 in comparison with the undisturbed flow case: (a) M = 2; (b) M = 1.5.
Applsci 13 07927 g014
Figure 15. Profiles of NFPS Δp/p for r = 16.8, t = 40, αj = 0.25, N = 7.5: (a) M = 2; (b) M = 1.5.
Applsci 13 07927 g015
Figure 16. Profiles of NFPS Δp/p for r = 16.8, t = 40, M = 1.5, αj = 0.25, N = 7.5, profile processing (left), GPS (right): (a) M = 2; (b) M = 1.5.
Applsci 13 07927 g016
Table 1. Difference grids.
Grid Numberhx, hrSizes
Grid1hx = 0.002
hr = 0.001
3000 × 2000
Grid2hx = 0.004
hr = 0.002
1500 × 1000
Grid3hx = 0.00606060606
hr = 0.00303030303
990 × 660
Table 2. Characteristics of the flow and the AD model used in the calculations.
DescriptionDefinitionNon-Dimensional ValueDimensional ValueNormalizing Value
Freestream Max numberM2.0; 1.5
Freestream pressurep0.226.5 kPapn = 132.5 kPa
Ratio of specific heatsγ1.4
Maximal radius of AD bodyR0.40.5 mln = 1.25 m
Length of the AD bodyL4.05 mln = 1.25 m
The width of the layers in considered TSSsrs0.040.05 mln = 1.25 m
Number of layers in different TSSsN2.5; 3.5; 5.5; 7.5
Rarefaction parameter in the layer j in different TSSsαj0.15; 0.2; 0.25; 0.3
Table 3. Characteristics of the flow and the AD model used in the calculations.
DescriptionDefinitionNon-Dimensional ValueDimensional ValueNormalizing Value
Freestream Max numberM2.0; 1.5
Freestream pressurep0.226.5 kPapn = 132.5 kPa
Ratio of specific heatsγ1.4
Maximal radius of AD bodyR0.86.4 mln = 8 m
Length of the AD bodyL10.080 mln = 8 m
The half-width of the layers in considered TSSsrs0.040.32 mln = 8 m
Number of layers in different TSSsN7.5
Rarefaction parameter in the layer j in different TSSsαj0.25
Table 4. PLdB impact on the ground for different near-field signatures at M = 1.5 and 2.
Near-field Signatures Δp/pGround Sound Pressure Impact, M = 1.5Ground Sound Pressure Impact, M = 2
Without TSS163.62 dB166.11 dB
With TSS163.26 dB165.60 dB
Disclaimer/Publisher’s Note: The statements, opinions and data contained in all publications are solely those of the individual author(s) and contributor(s) and not of MDPI and/or the editor(s). MDPI and/or the editor(s) disclaim responsibility for any injury to people or property resulting from any ideas, methods, instructions or products referred to in the content.

