Article

Interaction of Segmental Tunnel Linings and Dip-Slip Faults—Tabriz Subway Tunnels

1
Department of Mining, Faculty of Engineering, Urmia University, Urmia 5756151818, Iran
2
Department of Civil Engineering, University of Minho, Campus de Azurém, 4800-058 Guimarães, Portugal
3
Institute for Sustainability and Innovation in Structural Engineering, University of Minho, 4800-058 Guimarães, Portugal
4
Laboratory 3SR, Department of Civil Engineering, Polytech Grenoble, Grenoble Alpes University, 38400 Grenoble, France
5
Department of Civil Engineering, University of Tabriz, 29 Bahman Sq., Azadi Ave., Tabriz 5166616471, Iran
*
Author to whom correspondence should be addressed.
Appl. Sci. 2023, 13(13), 7866; https://doi.org/10.3390/app13137866
Submission received: 2 May 2023 / Revised: 30 June 2023 / Accepted: 30 June 2023 / Published: 4 July 2023

Abstract

:
In some subsurface urban development projects, bedrock faults intersecting with the tunnel path are inevitable. Due to the high costs of urban tunnel projects, it is necessary to study the behavior of such concrete structures under fault movement risks. Using an advanced 3D numerical finite difference code and a plastic hardening constitutive model for the soil, this paper examined the performance of the straight and oblique segmented structures of Tabriz Subway Line 2 under large deformations. The Tabriz Line 2 tunnel passes through a reverse fault called the Baghmisheh Fault. The fault–tunnel simulations were validated by centrifuge tests on the segmental tunnel for normal faulting. In the centrifuge tests and validation models, there was a maximum difference of 15%. According to the results of the Tabriz Line 2 tunnel under reverse faulting, segmental structures outperform no-joint linings when it comes to fault movement. During reverse fault movement, line 2 segments did not collapse but showed slight deformations. However, continuous structures collapsed under faulting, i.e., the structural forces created exceeded the section strength capacity. Among the segmental structures, the lining with oblique joints showed better behavior against faulting than the lining with straight joints. For better tunnel performance under fault movement, oblique joints should be used in segmental structures in faulting areas.

1. Introduction

Ruptures due to seismic loadings may interact with underground and surface structures and cause damage to buildings, bridges, dams, and underground structures such as tunnels and pipelines [1,2,3,4,5]. There are two main categories of seismic damages for underground structures, (1) produced by permanent ground deformation (PGD) caused by the earthquake activity, and (2) caused by severe seismic shaking due to seismic wave propagation [6]. Based on field observations, however, the tunnel damage caused by displaced fault areas (first seismic hazard) is more severe than the shaking caused by seismic waves (second seismic hazard) [7]. The Kocaeli and Düzce Earthquakes (1999) in Turkey, the Chi-Chi Earthquake (1999) in Taiwan, and the Wenchuan Earthquake (2008) in China are among numerous examples that caused severe damage to infrastructures by PGD [2,8,9]. The presence of a fault causes stress concentrations. The excavation is then exposed to additional rock mass deformations, which in turn contributes to the support compression. This will then necessitate an additional support or the introduction of injection measures.
Active faults are the most important geological features when designs in seismic regions must be done, as there is always a relationship between the main region faults and the earthquakes. When structures are built near active faults, procedures are recommended [10,11]. Despite this, many cities, such as Tabriz in Iran, are situated within bedrock fault zones. Consequently, it may not always be possible to prevent construction near these faults. This phenomenon causes serious problems during tunnel construction. It is therefore necessary to conduct reliable design studies before constructing a tunnel intersection with an active fault. It is also recommended that suitable tunnel lining be used in order to minimize damage [2]. When dealing with mechanized shield tunneling, a segmental structure is installed by a tunnel boring machine (TBM). The segmental structure is composed of several reinforced concrete segments and joints (Figure 1). Using this structure, there is an increase in the degree of freedom of the tunnel lining both longitudinally and transversely. Earthquake-induced damage will then be concentrated in the flexible joints or limited to a portion of the segments. The result is that the damage to the entire lining can be reduced by this segmental structure. The basic question is whether the resistive capacity of the segmented lining is stable against the relative motion of the fault and what its difference is compared to the continuous lining.
This paper examines the performance of segmental tunnel structures affected by a dip-slip bedrock fault rupture using advanced three-dimensional numerical simulations. The Tabriz Subway Line 2 was used as a reference case. The tunnel route crosses a bedrock fault known as the Baghmisheh Fault. The developed numerical codes were validated with centrifuge tests performed by one of the co-authors [2,12]. In the next step, we investigated the interaction between the segmental tunnel structure and the capable fault rupture in the Tabriz Subway. Compared to similar studies, this research is distinguished by the advanced modeling of segment joints (oblique and straight joints) in conjunction with their interactions with soil mass. Furthermore, an advanced constitutive model was assigned to sandy soils, which had not previously been applied.

2. Literature Review

Numerous studies have focused on the tunnel crossings through active fault paths and the damage caused by fault offsets, including field studies [7,13], theoretical analyses [14], numerical simulations [1,4,5,15,16,17,18,19], and experimental tests [2,5,15,20,21,22].
Gregor et al. [23] also investigated the behavior of twin tunnels at fault intersections using numerical methods. They concluded that underground structures could be designed to withstand earthquake-induced vibrations and fault ruptures. They also found that the fault causes tunnel instabilities and that soil and water masses flow into the tunnel (in linings with ring joints). A series of experimental and numerical studies were conducted by [15] in order to analyze the behavior of tunnel linings crossing reverse faults. Additionally, they found that soil rigidity and fault angles play a significant role in the formation of shear zones. In a numerical study, Anastasopoulos et al. [16] investigated the faulting effects of an immersed tunnel which is exposed to earthquakes. Using the ground motion field data from the Wenchuan earthquake, Yang et al. [9] studied the dynamics of tunnel failure against an active fault. Based on their findings, it was necessary to examine the stability of underground structures affected by faults and earthquakes, since the motion of the fault reproduced the stresses. Using the 2D discrete element method, Chang et al. [1] investigated fault rupture propagation through overlying sand in a reverse fault and validated their numerical results using an 80× g centrifuge test. Furthermore, Baziar et al. [24] used the finite element method to simulate tunnel behavior in sandy soil sediments across reverse fault rupture propagation. It was suggested that the tunnel and soil interaction mechanisms should be considered during the design of tunnels near active fault zones. Additionally, Kiani et al. [2] conducted centrifuge tests to investigate the interaction between shallow segmental tunnels and normal faults in sandy soils. According to their findings, tunnel deformations are affected by tunnel depth and fault inclination angle. These tunnels are deformed and separated at the segmental joint location. Cai et al. [5] studied the intersection of normal faults and tunnels. Their results were confirmed by centrifuge tests, and the effect of tunnel length and tunnel depth was investigated. Nemati et al. [25] have also studied short-term seismicity patterns along the most active faults in Iran. Zhang et al. [26] modeled fault effects on a horseshoe tunnel, investigated different fault positions and added a new element to model discontinuous fault behavior. They concluded that fault location affects rock movements around the tunnel. Ma et al. [27] used discrete and continuous medium coupled models to explore cross-tunnel deformations and failure mechanisms within active faults. In a ring lining with a high number of flexible joints, they found that fault displacements and stresses were smooth. A new type of material with high deformability and flexibility was examined by Zhao et al. [18] in order to address tunnel fault damages. Based on the simulation results, it was found that the plastic strain zones were greatly reduced and concentrated in flexible joints made of plastic fiber concrete. Esmatkhah et al. [28] investigated the settlements and damages caused by the metro tunnel excavation operations during the tunnel excavation phase. They monitored the settlements that caused damage to the surface urban facilities and buildings and provided risk tolerance maps, using a geographical information system. Wang et al. [19] investigated the impact of faults on underground caverns. For the purpose of evaluating the faulting effects on the seismic behavior of underground caverns as well as the effect of fault parameters (intersection angle, fault thickness, and fault shear strength) on seismic response, they developed 3D dynamic finite-element models. Sabagh and Ghalandarzadeh [22] performed centrifuge tests to evaluate the behavior of continuous tunnels at the intersection of reverse faults, and validated their results with 3D numerical models and parametric analyses. According to Shen et al. [21], sectional tunnel linings with flexible joints can improve the deformation of cross-tunnel structures which have active faults. Yan et al. [29] also used two types of joint design and proposed a new method for modeling tunnel loading in fault zones under earthquakes. Zhou et al. [30] developed a finite element model of a horseshoe tunnel under seismic loads and examined parameters such as fault angle, ring width, and fault zone width. They concluded that the fault intersection fracture with the tunnel at an angle of 60° is more dangerous.
Aygar and Gokceoglu [31], Wen et al. [32], and An et al. [33] recently proposed methods for lining tunnels at fault intersections and examined these methods using numerical modeling to minimize the fault damage effects on the tunnel lining. Wen et al. [32] proposed a method for adjusting the ring lining (segmental lining with transverse joints only). According to their findings, the ring lining reduces compressive and shear stress, and the narrower the ring lining is, the greater its effectiveness. The study by An et al. [33] also concluded that, under normal conditions, tunnel fault movement causes tensile and compressive shear damage, which can cause the tunnel to collapse; however, the use of flexible joints reduces these damages.
The studies described above have not adequately discussed the geometry of the longitudinal and transverse joints of the segmental lining (oblique and straight joints). As can be seen from the figures of these studies, they have modeled the segmental structure only as a segmental ring, without longitudinal joints. The purpose of this paper is not only to simulate longitudinal and transverse joints in the precast tunnel structure but also to investigate the diagonality of the longitudinal joints of the segmental structure concerning the tunnel axis.

3. Materials and Methods

3.1. Reference Case

Tabriz, a city in northwestern Iran, is located on the Alpine–Himalayan belt, which is highly seismic. There are many tectonized occurrences of folds and faults, which cause numerous earthquakes [34]. According to the Richter intensity scale, Tabriz is in the range of magnitude 8 to 10. There is a high probability that surface structures will be destroyed in areas of this seismic intensity, and that the ground surface will crack. Tabriz has many small and large faults which, according to the existing regional earthquake data, are seismically active [34]. Among these faults, the Baghmisheh Fault intersects with two stations of the Tabriz Subway Line 2. This fault displays strike-slip motions with a reverse component in most focal mechanism [34]. The focal mechanism of earthquakes in northwest Iran and southeast Turkey shows that the convergence between the Arabian and Eurasian plates can be eroded along the right strike-slip faults. The strike-slip fault is the southeastern continuation of the North Anatolian fault into Iran, which includes discontinuous fault sections with the northwest–southeast extension [35]. Figure 2 shows the position of this fault concerning the Tabriz Subway Line 2. As a result of this fault in Line 2, this subway line located along the east–west axis of Tabriz was selected for the case study. The line consists of 20 stations and is 22 km long [36].
A fault displacement can be calculated using the empirical equations provided by Wells and Coppersmith. When designing a structure exposed to a fault of a certain magnitude, Equation (1) can be used to estimate the maximum displacement due to reverse faulting [37].
log δ fr = - 0 . 74 + 0 . 08 M w
where δfr is the reverse fault displacement, and Mw is the magnitude of the earthquake moment on the Richter scale.
The maximum displacement of the Baghmisheh Fault will equal 0.8 m if the largest earthquake event associated with the fault has a magnitude of 8. In spite of this, since the goal of this research is to determine the displacement of the Baghmisheh Fault on the scale of the centrifuge tests of Kiani et al. [2,12], the fault displacement was set at 2.5 m.
According to the plastic hardening (PH) constitutive model, the soil properties of the Tabriz Subway Line 2 have been defined (Table 1). The tunnel segmental structure behavior is linear elastic in numerical simulations, and its mechanical properties with grout are summarized in Table 2.

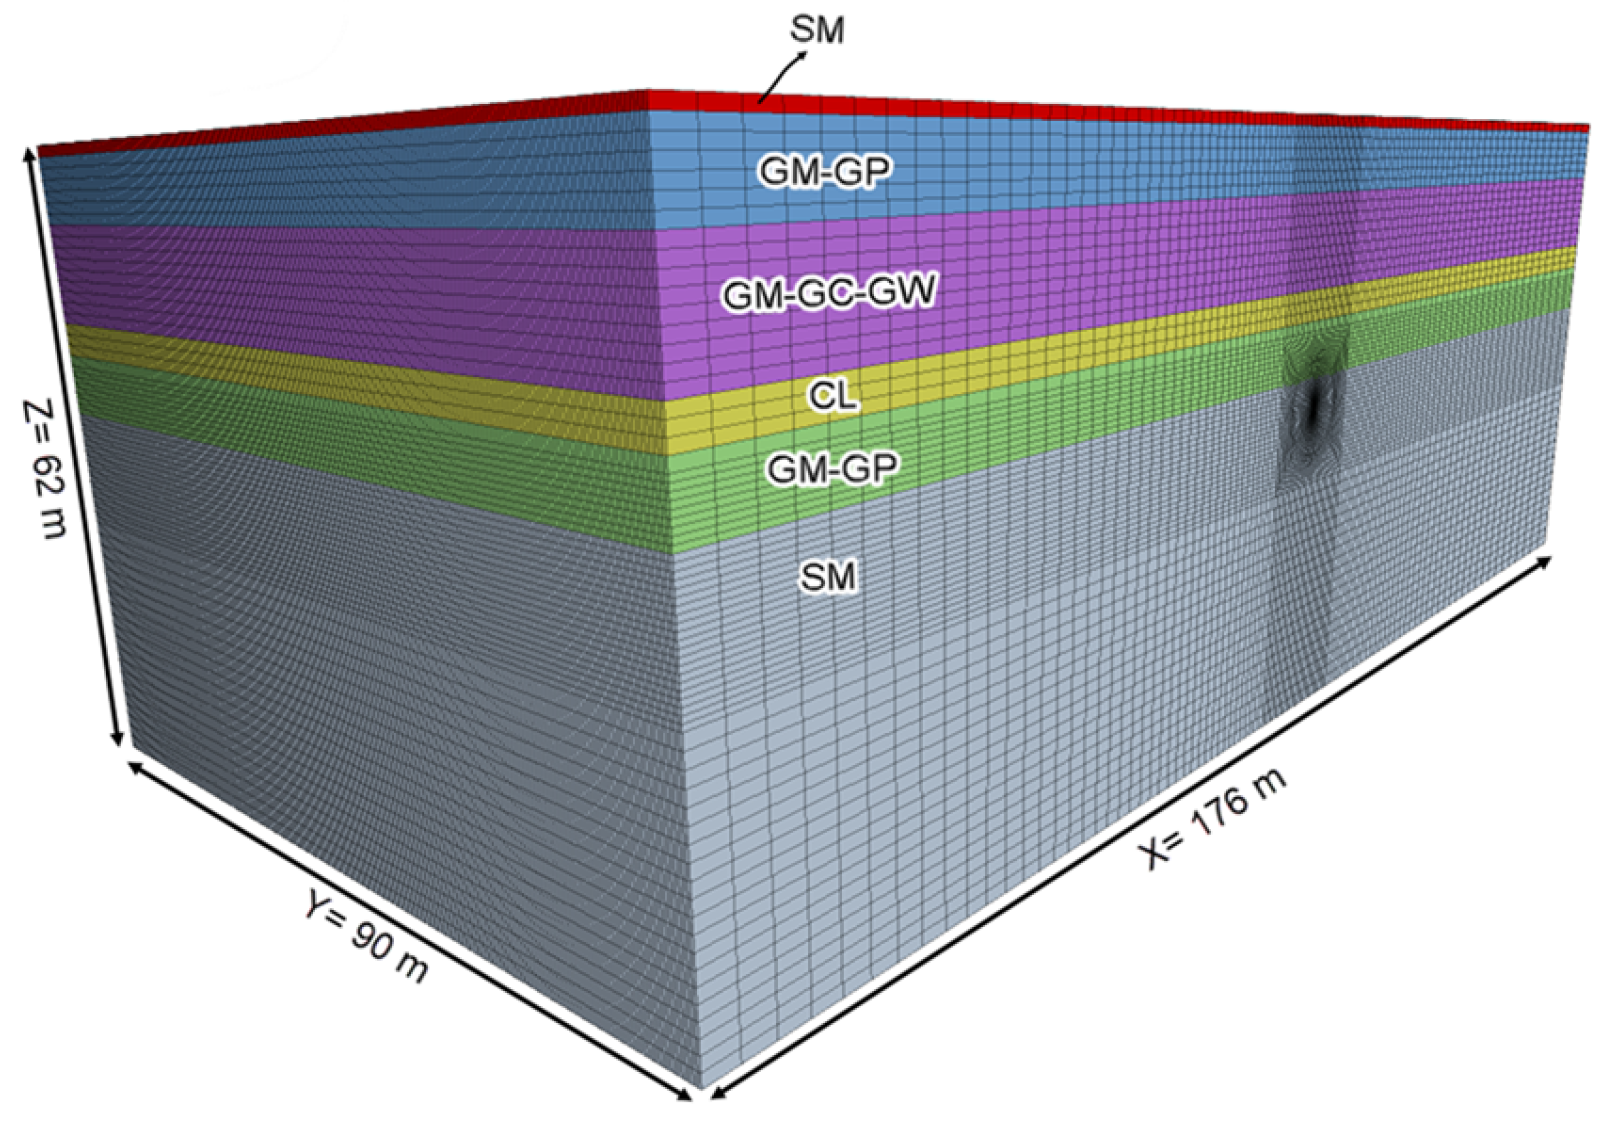
3.2. Three-Dimensional Numerical Simulation

Using FLAC3D finite difference software, the interaction between the segmental lining and fault motion was modeled. The numerical analysis was carried out in several stages. As a first step, the model reached initial equilibrium with in situ stresses. In the second step, the tunnel was excavated, and the segmental linings were installed. Lastly, dip-slip fault displacements were simulated. The hanging wall boundaries moved according to the type of dip-slip fault (normal or reverse) with a certain slope. At the same time, the footwall remained fixed. It was necessary to apply a specific velocity to the model hanging wall in order to achieve the desired fault displacements (Figure 3).
The analysis results depend partly on mesh density and model dimensions. Therefore, after analyzing the sensitivity of the mesh, a series of parametric studies were conducted to evaluate the minimum dimensions of the model, resulting in Equations (2)–(4) [39]. Having a powerful computer enabled this study to construct a model with a minimum dimension that exceeded the values of these equations. The fault location was selected at the center of the model in order to minimize boundary effects.
(H + 4D), for the model height
(H + 3D), for the model length
(3H), for the model width
where H is the tunnel axis depth, and D is the tunnel diameter.
An appropriate constitutive model for the soil is crucial for the numerical modeling of a tunneling process and, consequently, for the correct prediction of lining loads. It is important to note that constant stiffness would not be an appropriate method of approximating surface settlements for all levels of shear strain [40,41]. The plastic hardening constitutive model is characterized by a hyperbolic stress–strain relationship in drained axial compression (while unloading/reloading is elastic) and stress dependency, defined by a power law. It also includes shear and volumetric hardening and the Mohr–Coulomb (MC) failure criteria. Three non-linear rigidities explain the soil compressibility, depending on the stress level ( E 50 ref _ E oed ref _ E ur ref ) [42,43].
The FLAC3D Version 7.00.139 geotechnical program supports only linear elastic constitutive modeling for structural elements, so that precast concrete segments used for the segmental lining are modeled as linear elastic by the liner element, which creates a frictional interaction with the soil medium and can tolerate compressive and tensile forces in the normal direction [43,44,45]. The liner element provides the structural behavior of a shell and does not model the full volume of the segment. Due to this fact, it is not possible to make rebars between segments within the liner element in this geotechnical software. The liner element is in contact with the soil medium, using a link element. Link elements (like interface elements) between segments and soil should be stiffer than their surrounding materials, and the liner elements should be able to slide or open, relative to the soil medium’s surface. To determine the stiffnesses, the equivalent stiffness of materials is used, where Kn and Ks (normal and shear stiffnesses) can be adjusted to 10 to 100 times the stiffness equivalent to the stiffest adjacent zone. The equivalent stiffness in a zone in the normal direction is equal to Equation (5) [44]:
ES ( Equivalent   Stiffness ) = max K + 4 3 G Δ z min
where K and G are the soil bulk and shear modulus, respectively, and Δ z min is the smallest dimension of the neighboring zone in the normal direction.
Joints represent one of the main characteristics of segmental linings, including segmental joints between segments within a ring and ring joints between consecutive rings. The segment joints are simulated using link elements consisting of 6 degrees of freedom that can be assigned one of three boundary conditions: free, rigid, and deformable (linear and bi-linear) and represented by six springs (three transitional components in the directions x, y, z, and three rotational components in the directions x, y, z). A set of rotating springs (Krot), axial springs (Kaxi), and radial springs (Krad) illustrates the stiffness property of segment joints (Figure 4). The properties of longitudinal connections between individual segments can be considered in the form of a moment–rotation relationship for a certain Young’s modulus and thickness of the concrete segment. The idea is generally based on the concrete hinge method presented by [46] with its nonlinear behavior and maximum moment transfer (Myield). A practical method has been developed by [47] for simulating rotation springs with nonlinear behavior in longitudinal joints between concrete segments. Two adjacent segments in a ring are connected by this nonlinear spring. The assumption in this method is that the contact surface between two segments can be represented by a concrete beam with a depth equal to the width of the contact area (segment width) and a height and width equal to the contact height. In order to estimate the rotational stiffness in the form of a bilinear spring curve, first a calculation is performed with a complete hinge with a thickness of 35 cm in the narrowest part of the connection. The maximum bending moment, Myield, from the average axial force of the tunnel lining, is calculated for a rotation angle of 0.01 radians (1%), which is considered as an approximation of the maximum permissible rotation [48]. Therefore, the rotational stiffness of all connections is calculated in this manner. This assessment of axial force, 636 kN/m, is according to Equation (6):
K RO = 0.8 M yield / θ ( 0.8   Myield )
M yield   N = 636   kN / m = 94   kN.m / m     for   θ = 1 %
0.8 M yield = 0.8 94 = 75.2   kN.m / m     for   θ = 0.1212 %
K RO = 75.2 / 0.001212 = 62,046   kN.m / rad / m
It is also possible to model ring joints using link elements, and the mechanism of each spring is identical to that used to connect segmental joints, but the boundary conditions and directions of ring joints are different from those used in segmental joints [45,49,50].

3.3. Model Validation

Using experimental results, numerical simulations can be validated for their ability to estimate the interaction effects between tunnels and faults. In this study, the numerical modeling was validated by the experimental results of [2,12]. Using centrifuge tests, they investigated the behavior of segmental tunnels under normal faults. In their tests, considering a gravity acceleration of 50× g (centrifuge scale coefficient of 50), the prototype model’s dimensions were 20, 25, and 35 m (test dimensions: 0.4, 0.5, and 0.7 m). The diameter of the tunnel and the thickness of the segments were 5.9 m and 0.35 m, respectively. Six segments with a width of 1.15 m were present in each ring. The soil was composed of Firoozkuh sand No. 161 with a water content of 5% and a relative density of 50%. A more detailed description can be found in [2,12]. Table 3 lists the soil and segmental lining properties used in the centrifuge test.
Six centrifuge tests were conducted considering fault angles of 60 and 75 relative to the horizon and overburden/diameter ratios (h/D) of 0.75, 1, and 1.2. In the centrifuge tests, the footwall was fixed, and the movable hanging wall was moved downwards using the jack hydraulic force for normal faulting.
According to Figure 5, the validation model consists of 1,002,500 zones with a height of 33 m, a length of 60 m, and a width of 110 m. Figure 5 illustrates the mesh and groups of the numerical model. Table 4 provides stiffness values for the tunnel lining segments and rings based on the springs and stiffnesses discussed in Section 3.2.
In the centrifuge tests, fault displacements of 5 cm were applied. Based on the centrifuge scale coefficient, this displacement value equals 2.5 m in the prototype model. This value was decomposed into two directions, Z and Y, in the numerical modeling, to create the fault angle effect. Similar to the centrifuge tests, a displacement of 2.5 m was applied quasi-statically in the direction of the slope angle (using the velocity code step-by-step in FLAC3D software).

Validation Results

In this section, the numerical simulation results are compared with centrifuge tests conducted by [2,12] to ensure the accuracy of the numerical process. Therefore, numerical validation was carried out on six centrifuge tests. Figure 6, Figure 7, Figure 8, Figure 9, Figure 10, Figure 11 and Figure 12 show the results of numerical modeling for validation.
As shown in Figure 6a,b, deformations of the segmental lining were caused by normal faulting at angles of 60° and 75° with overburden (h)/diameter (D) ratios of 0.75, 1, and 1.2, respectively. Figure 7a,b shows the value of Le (the length affected by the fault in the lining) for both centrifugal tests presented by [2,12] and the numerical validation model. There is a relatively strong correlation between the Le value in the centrifuge test and the numerical model. It is observed that Le decreases with increasing depth. In other words, the fault’s effect on the tunnel is concentrated in the fault plane area, and it affects a smaller length of the tunnel lining as a result of increasing the tunnel’s depth.
Figure 8a,b illustrates the cross-sectional deformations of segmental linings under normal faulting at angles of 60° and 75° with different overburden/diameter ratios from the side and inside the tunnel. According to these figures, the longitudinal joint separation increases with increasing tunnel depth and fault angle. This rise in the 1.2D overburden ratio is quite evident, and includes more rings. A greater amount of separation occurs at an angle of 75°. As a result, an increase in fault angle leads to an increase in the vertical component of the faulting force and an increase in segmental ring ovalization. A diagram of the segmental lining vertical displacement following faulting at 60° and 75° slope angles with varying overburden ratios is shown in Figure 9a,b. In this case, the displacement of the segmental lining due to faulting increased with increasing tunnel depth. According to the curves, as the normal fault angle increases, the displacement slope of the segmental lining increases (Figure 9b).
Figure 10 shows the vertical displacements of the segmental lining with an overburden ratio of 1D at fault angles of 75° and 60°. At the beginning of the tunnel, the vertical displacement for the 75° angle is greater than the vertical displacement for the 60° angle. For 75° and 60° angles, this value is 2.379 m and 2.125 m, respectively. As shown in this figure, in the 75° fault, the fault plane intersects the tunnel at y = 22 m. In contrast, for the 60° fault, this intersection occurred at y = 26 m. After crossing the fault plane and in the footwall area, displacement values decreased for both cases. The reduction in displacement occurred more rapidly at the 75° angle. The displacement at the end of the tunnel (y = 60 m) reached 0.562 m for the 75° angle and 0.88 m for the 60° angle. For 75°, the vertical component of the fault force is greater than the horizontal component, which explains the variation in displacement between these two cases. Therefore, in this case, at the fault location, displacement changes have a steeper slope than in the 60° case. In the 60° case, the general displacement process occurs with a smoother slope, due to the increase in the horizontal component of the fault displacement compared to the 75° case.
Figure 11 illustrates the curves of vertical displacement of the ground surface for overburden ratios of 0.75D, 1D, and 1.2D and fault angles of 60° and 75° in numerical validation models. Observably, the maximum ground displacement value increases quite gradually with increasing overburden. The vertical displacement of the ground also increases as the fault angle increases due to an increase in the vertical component of the fault force. By decreasing the fault slope angle, the fault area develops further towards the footwall, affecting the surface further. Based on the results of the numerical validation models, the simulation results are consistent with those of the centrifuge tests conducted by Kiani et al. [2,12]. A comparison of the permanent ground displacement (PGD) in the validation model and the centrifuge test on a fault with a slope angle of 75° is shown in Figure 12. With acceptable accuracy, the centrifuge results validate the numerical simulations. There was a maximum difference of 15% between the validation model and the centrifuge test.
Accordingly, it can be concluded from these six validation models that the rupture mechanism governing the segmental tunnel is tensile and shear in normal faulting. Tunnel segment bodies do not rupture, due to the opening of longitudinal and transverse joints. Significant deformations are caused by the opening of longitudinal and transverse joints. There are no sudden deformations, and the tunnel structure can withstand a portion of the fault force without experiencing significant damage. An increase in the overburden reduces the length of the tunnel affected by the fault (Le), but the severity of the damage and the ellipse cross-section of the tunnel increase. A rise in the overburden increases the in situ stresses resulting from the overburden weight. As the fault angle increases, the vertical deformation of the tunnel segmental lining increases.

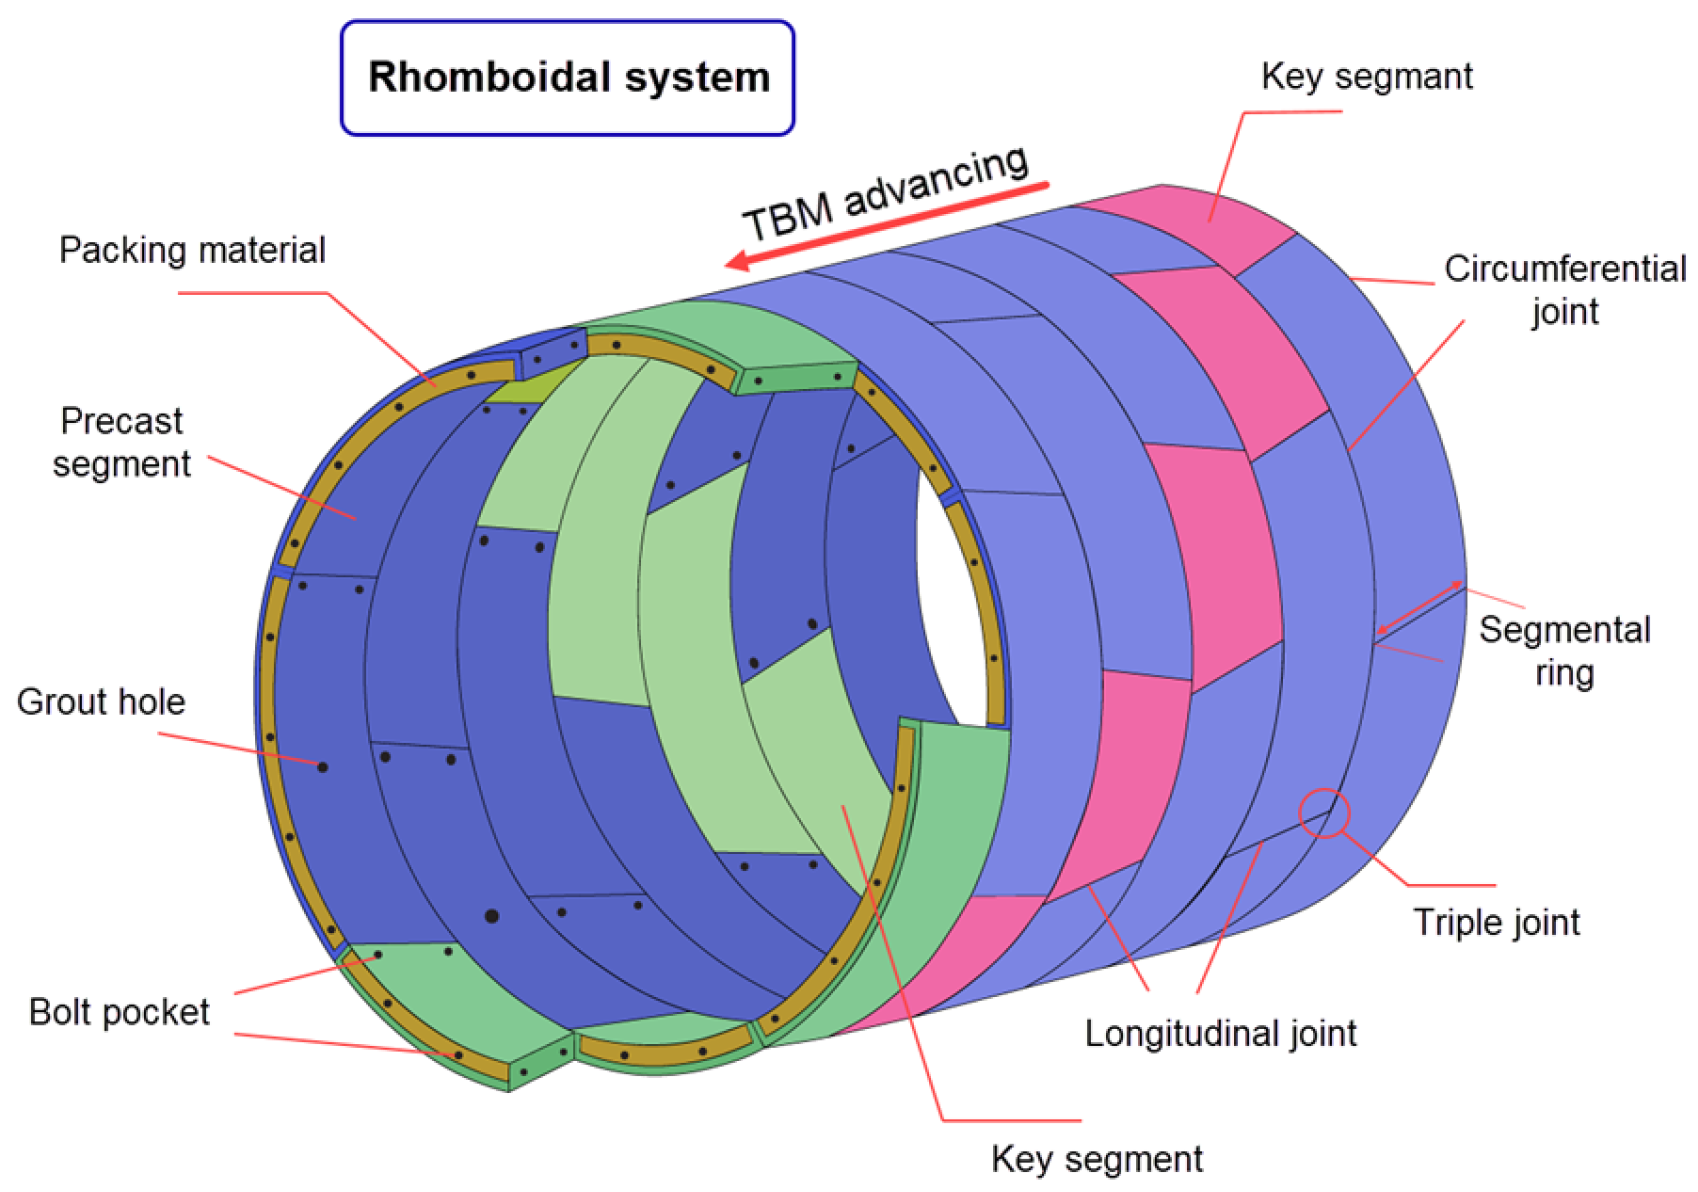
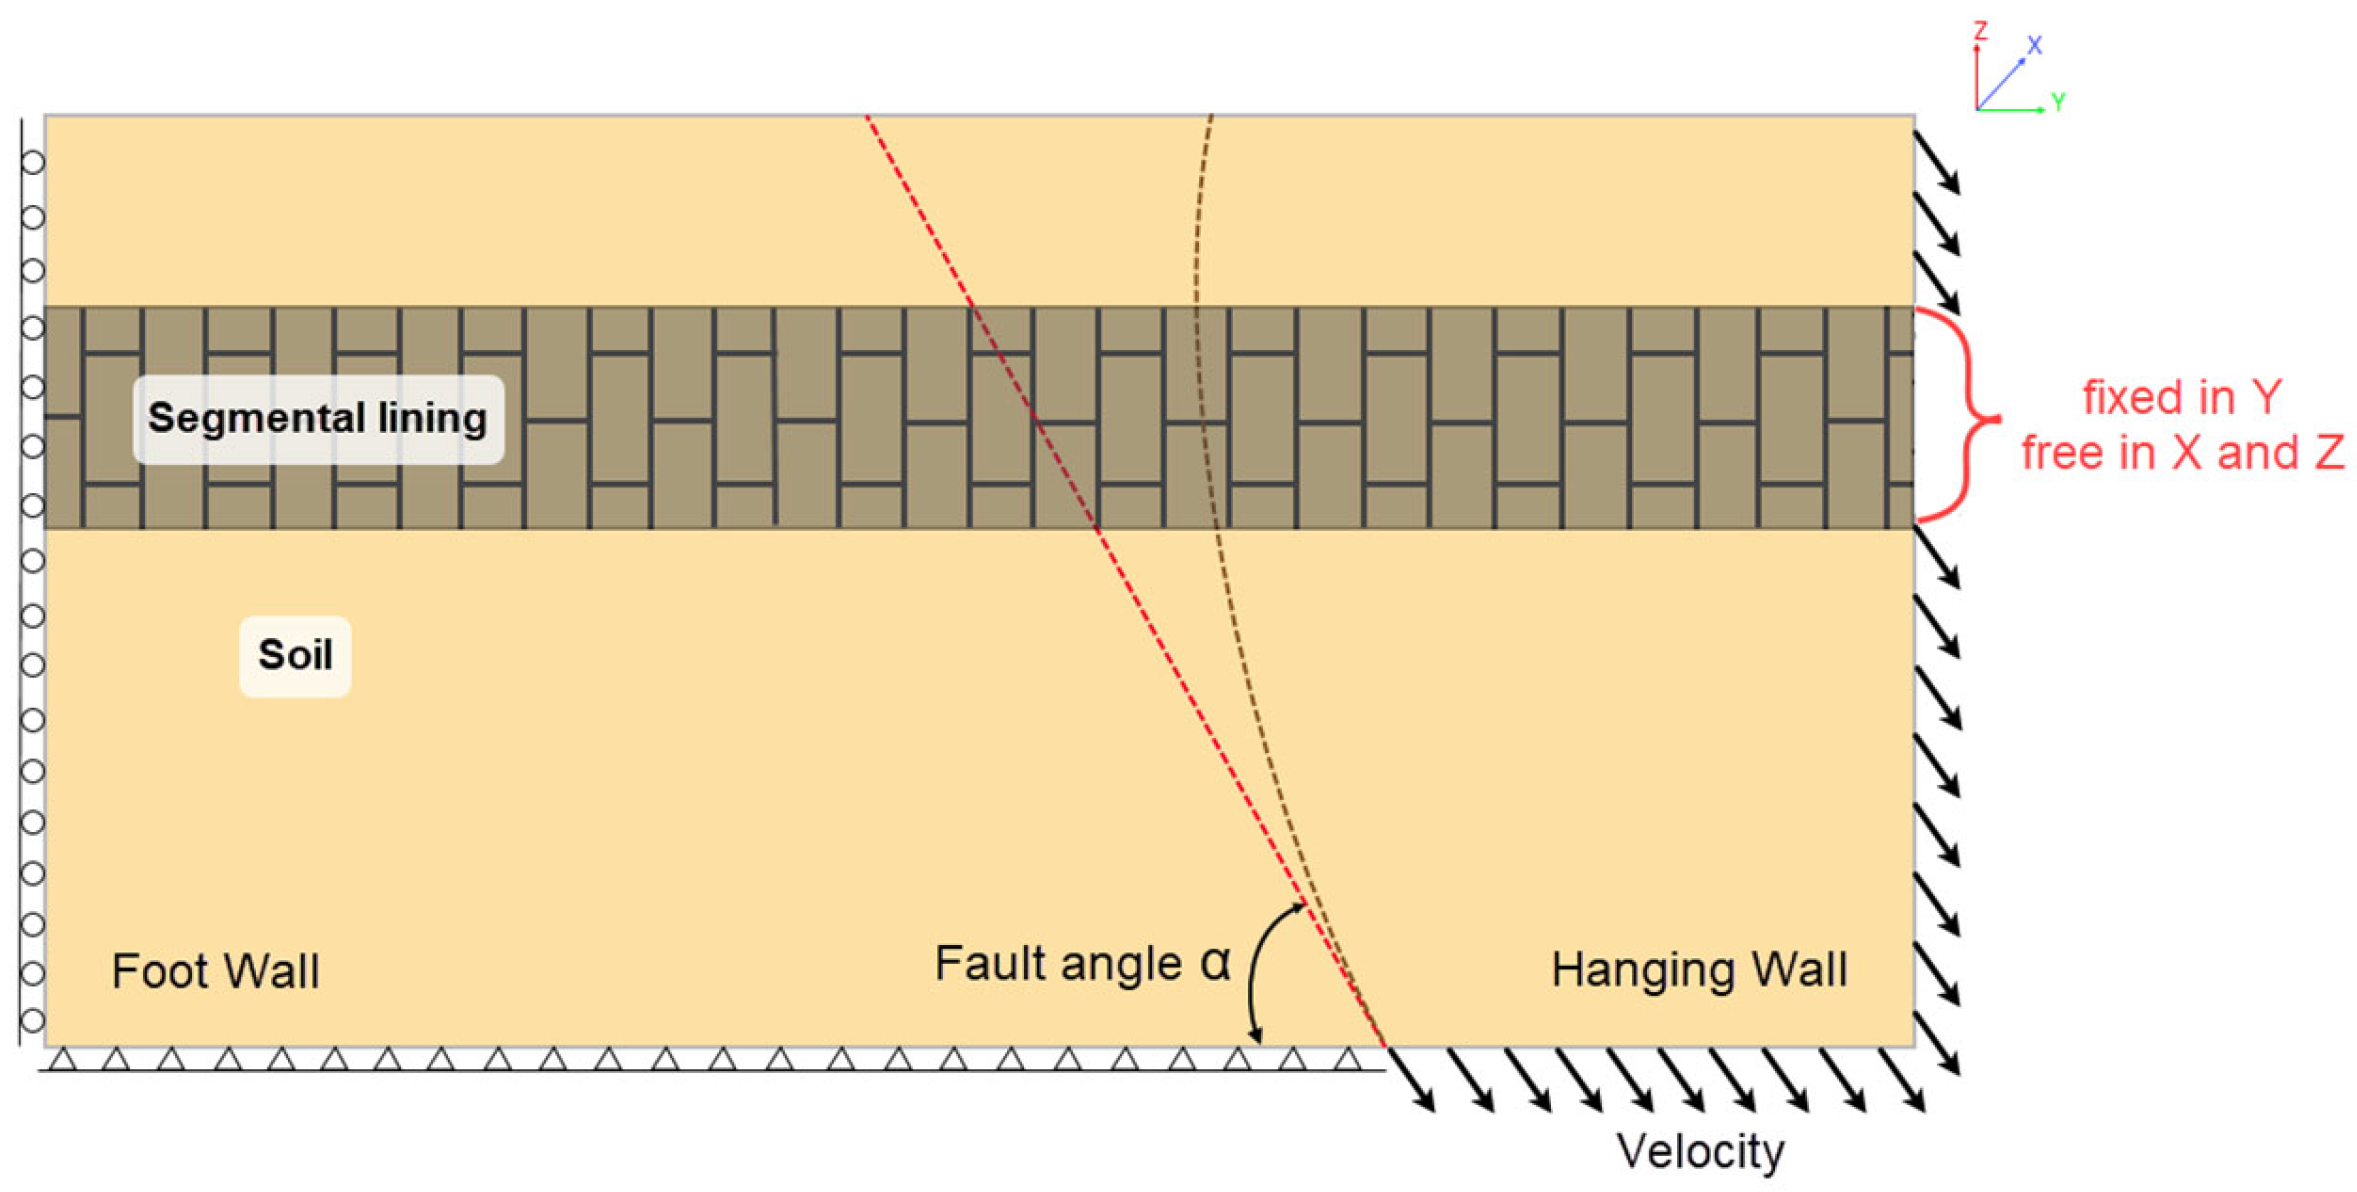
3.4. Bedrock Fault Intersection with Segmental Lining: Numerical Simulation

Figure 13 displays the advanced 3D numerical model of Tabriz Line 2. It has a length of 90 m, a height of 62 m, and a width of 176 m, twice the values obtained from Equations (2)–(4). There are approximately two million zones in the numerical model. The model reached equilibrium after constructing the soil layers and applying in situ stress and boundary conditions. In the following, the tunnel was excavated, segments installed, and grout was injected. Tunnel lining was modeled in two ways: continuously and segmentally, with oblique and straight joints. In Figure 14, you can see both continuous and segmental lining. The segment type is universal, with a ring width of 1.5 m. In order to prevent sealing defects, the longitudinal joints of the segmental lining and the joints of the segments are not aligned in consecutive rings. A solid element with a linear elastic model is used to model the grout behind the segments. Table 2 provides specifications for 28-day hard grout and tunnel lining. The segmental lining was modeled with oblique and straight joints to investigate the joint geometry effect. Two consecutive rings are modeled with a key segment at the crown in the first ring and a key segment at the floor in the second ring. The mechanical and geometrical characteristics of segment joints were almost identical to those reported by Do et al. [45]. The joint stiffness values related to their study were used in this study (Table 5).
Following the simulation of segment installation and grout injection, the faulting steps were carried out. Because the fault intersecting with Line 2 is a reverse fault and has a slope angle close to the vertical, the hanging wall’s lateral boundaries were moved upwards, with a slope of 80°. The velocity equivalent to the required displacement (2.5 m) was applied to both continuous and segmental models.

4. Results and Discussion

This section presents the numerical modeling outputs of the fault rupture on Line 2 of the Tabriz Subway. Outputs include displacements and internal structural forces for segmental and continuous linings.

4.1. Displacement Outputs

4.1.1. Soil Displacements

Figure 15 depicts the central profile of the ground displacement contour with segmental lining under reverse faulting for both types of joint arrangements (straight and oblique). The soil meshes adjacent to the fault area segments are compacted, indicating the interaction and pressure caused by reverse faulting in the fault area. The opening of longitudinal and transverse joints is observed in the crown and floor of the fault area segmental lining. Transverse joint openings are greater in straight joints than in oblique joints. Furthermore, longitudinal joint openings have been observed at the crown of straight joints. These results are similar to the centrifuge test results obtained by Kiani [12]. Kiani found that reverse faulting has a small effect on the rupture of segmental linings. There are only limited openings in the longitudinal and transverse joints of the segmental lining, as well as minor deformations.

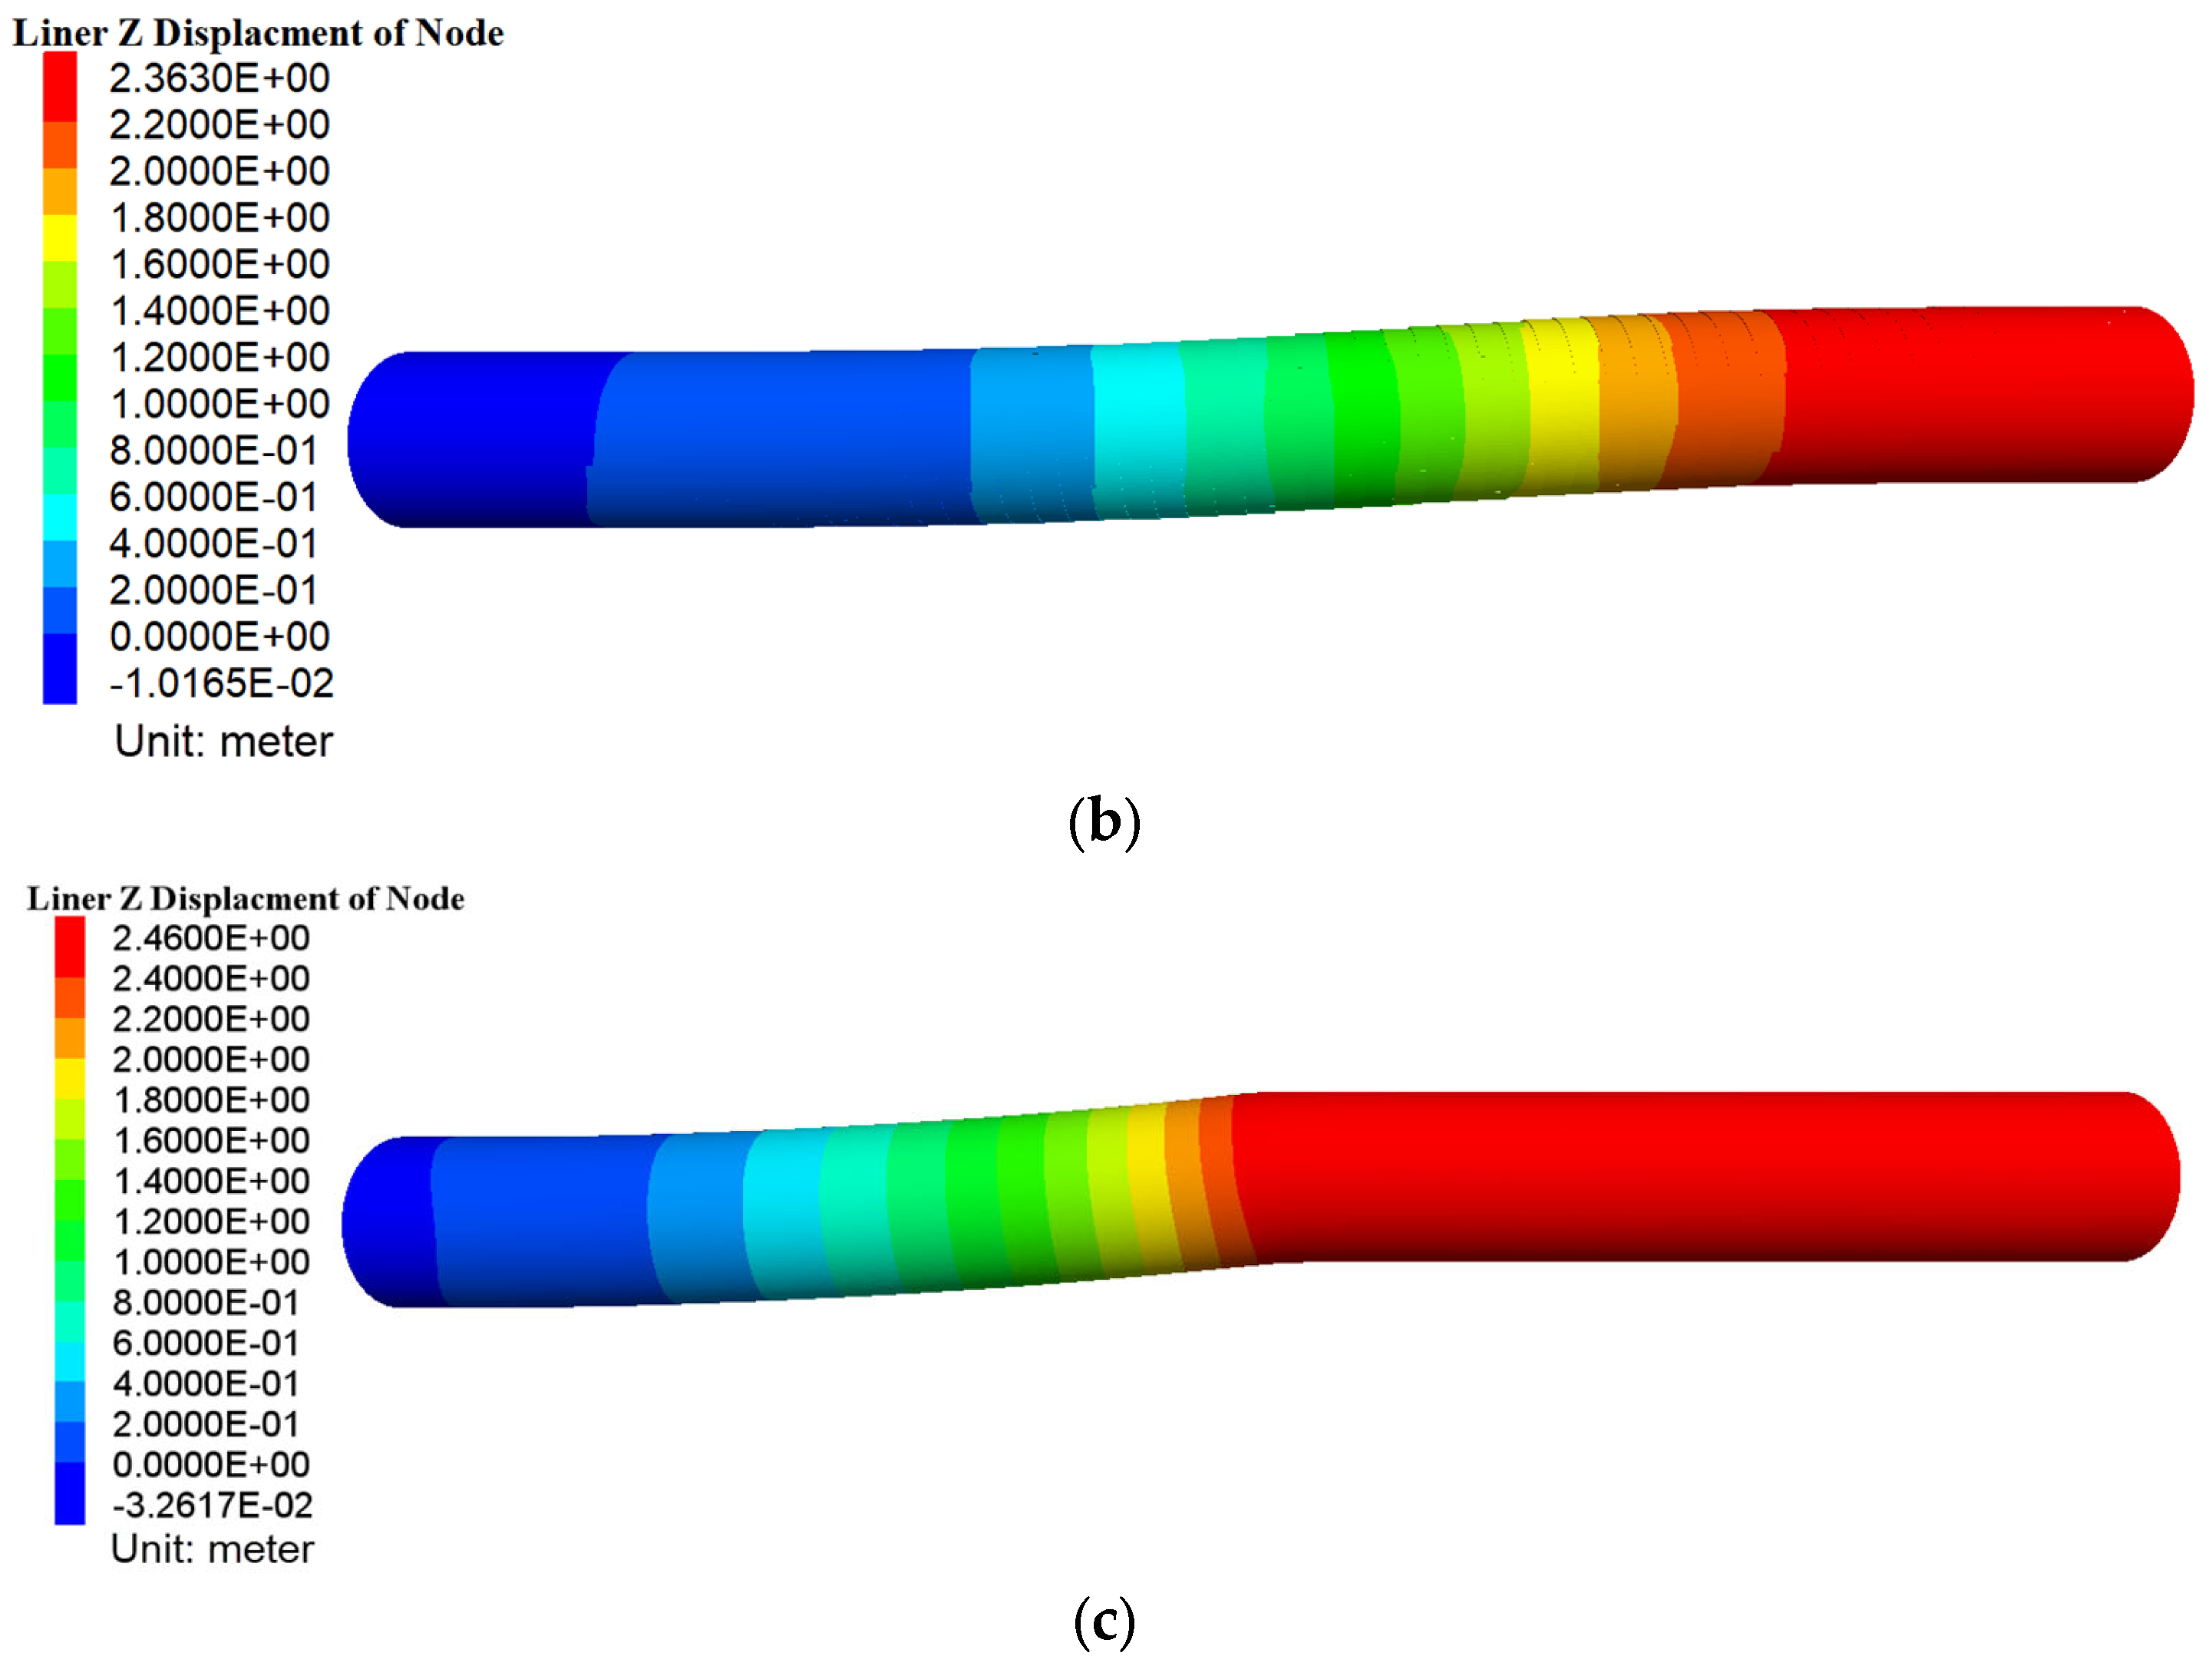
4.1.2. Lining Displacements

Figure 16 and Figure 17 show the contours and curves of the vertical displacements of segmented and continuous lining under reverse faulting, respectively. The segmental lining under faulting has smooth displacement along the entire tunnel path (Y-axis). The presence of joints acts effectively, causing gradual deformations. In comparison, the continuous lining in the fault zone shows sudden and non-uniform vertical displacements. Thus, due to continuous tunnel lining rigidity, the displacements are concentrated, and sudden changes appear at the fault location. Therefore, the probability of tunnel lining rupture in this concentrated area will be high. However, in the case of using a flexible lining (segmental), there are small displacements along the tunnel path axis. The displacements will not be concentrated at the fault location, and the probability of rupture in the segmental lining is lower. According to Figure 17, in the segmental lining located in the hanging wall, the tunnel segmental ring displacements of the tunnel crown are gradual, while in the continuous lining, the whole lining located in the hanging wall has the maximum fixed vertical displacement. From 2.5 m of displacement applied to the hanging wall in the slope direction, the vertical displacement is 2.46 m. The vertical displacement of 2.46 m is transferred to the continuous lining, and represents a total vertical displacement transfer from the hanging wall to the continuous tunnel lining. Nevertheless, for the segmental lining with oblique joints, the vertical displacement value is 2.32 m. For the segmental lining with straight joints, the vertical displacement value is 2.36 m. In segmental linings with oblique joints, displacements are lower than those in segmental linings with straight joints.

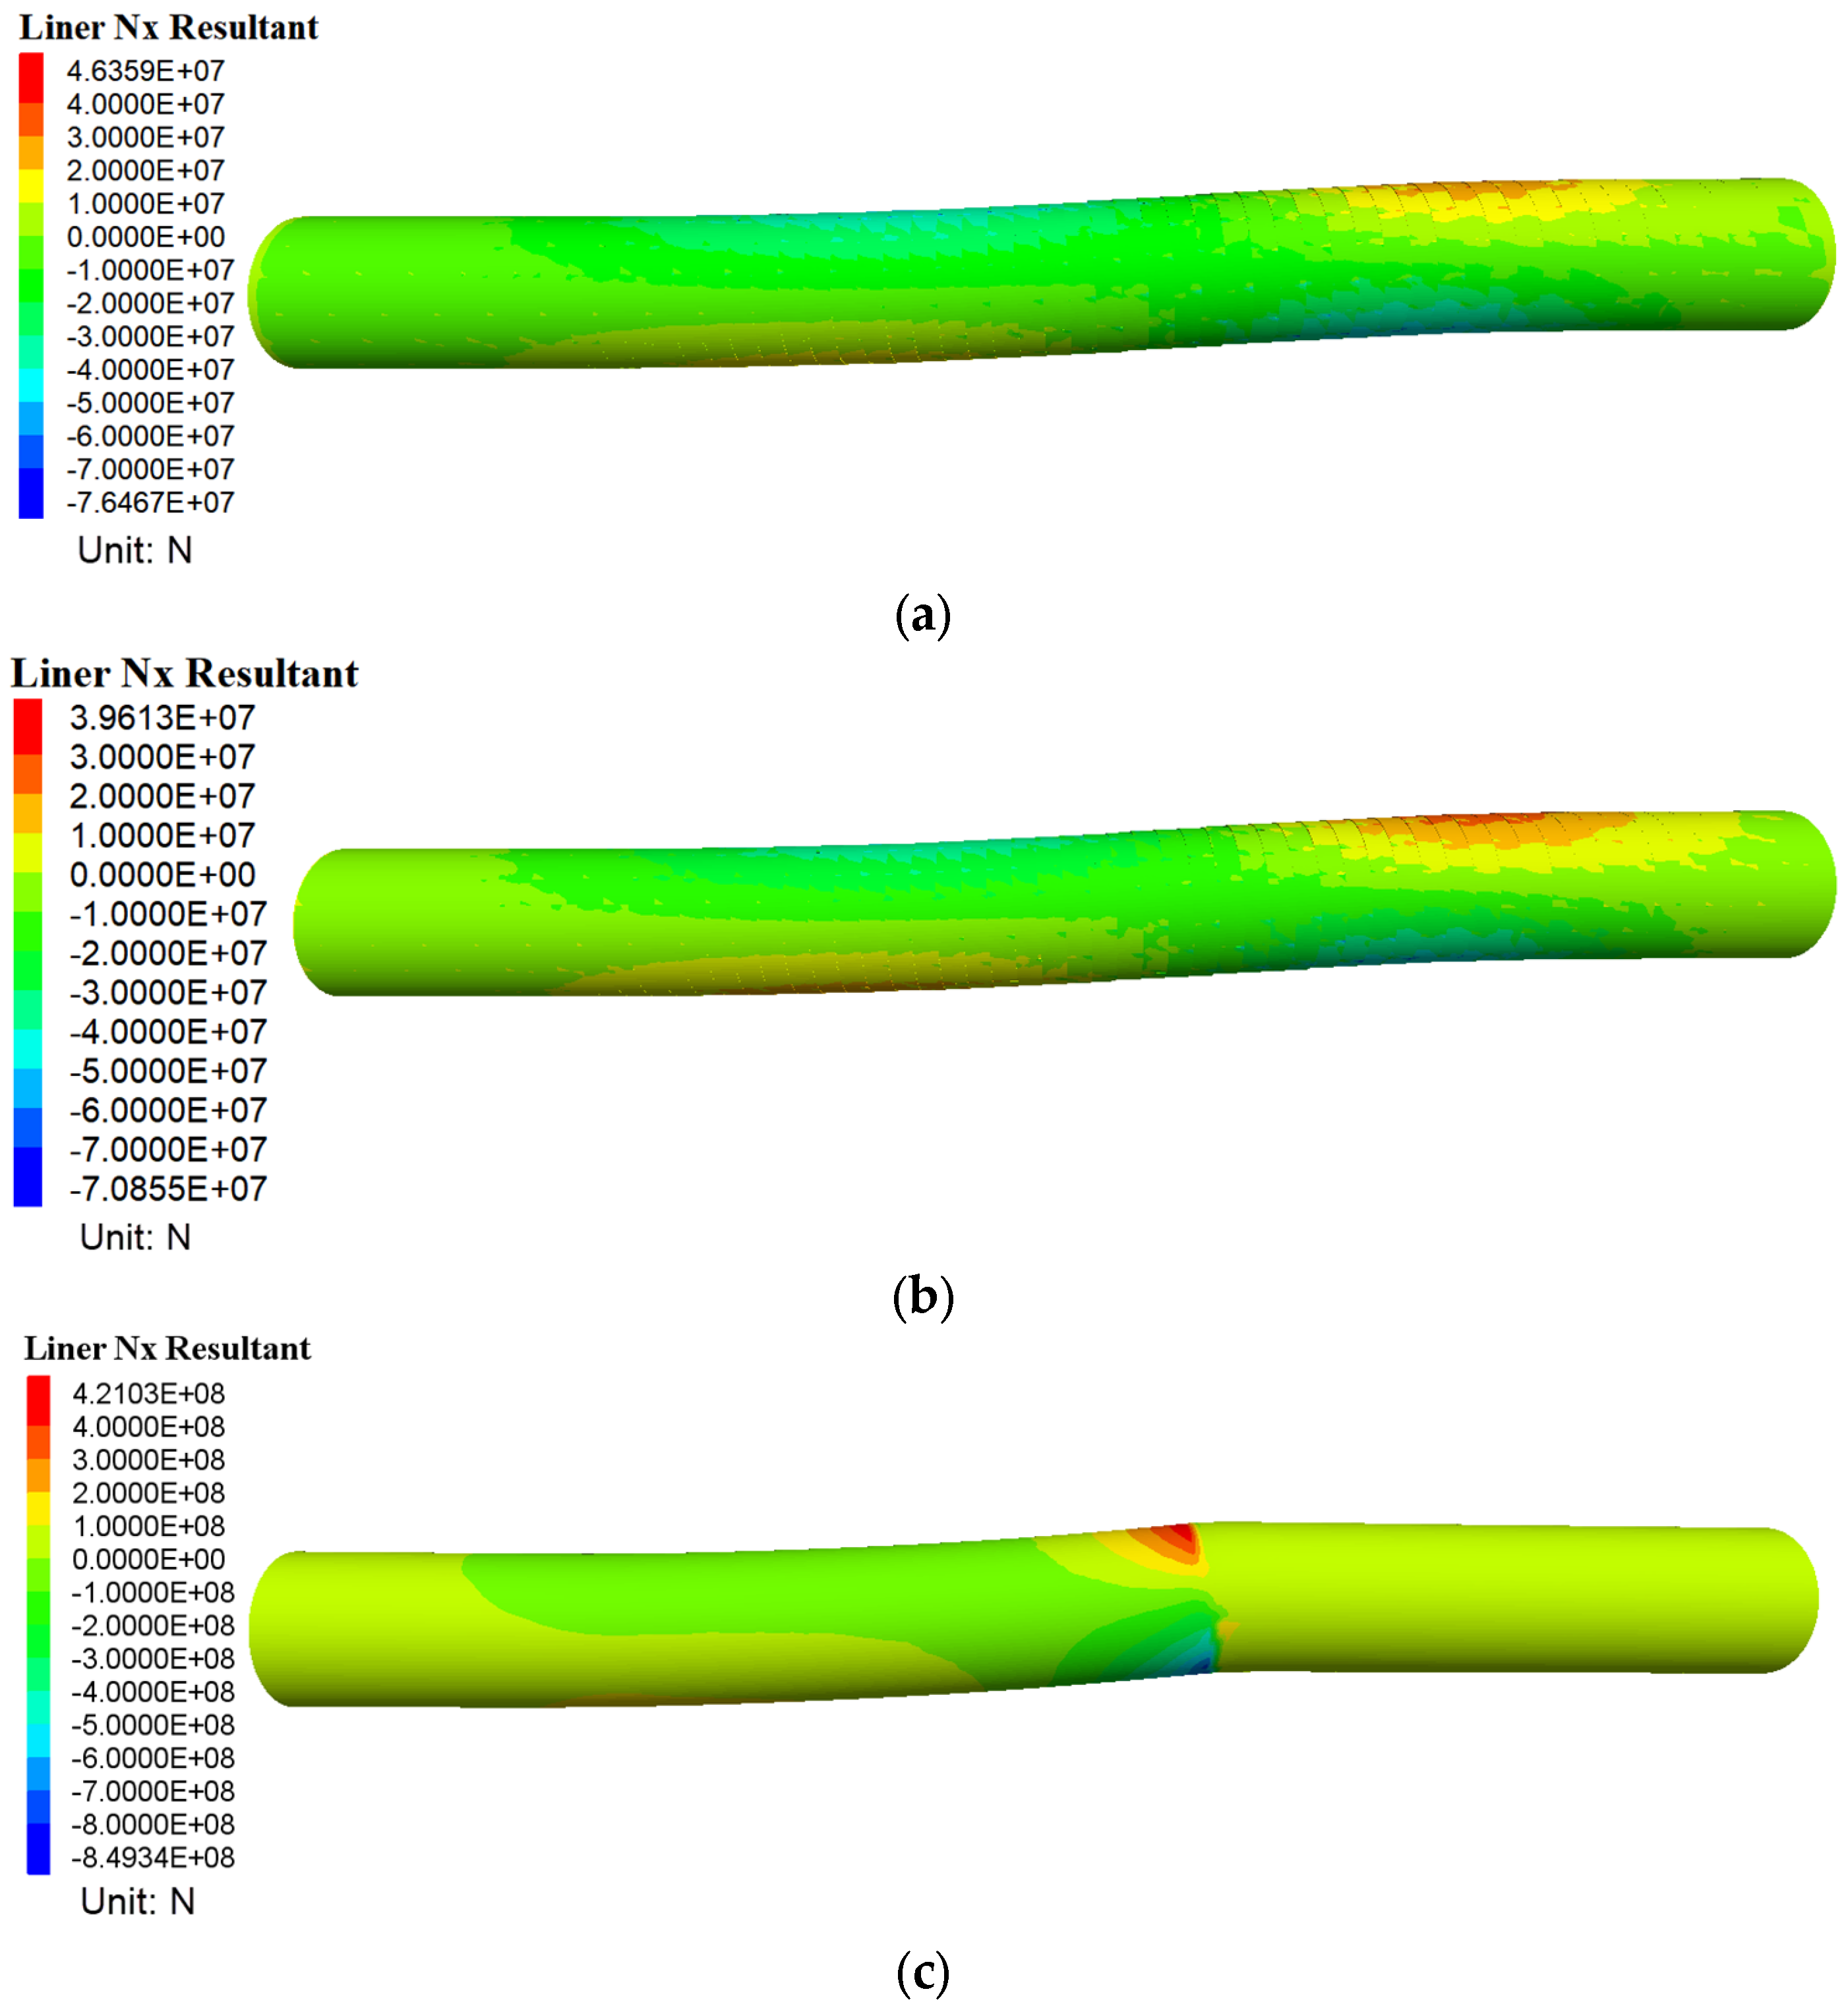
4.2. Internal Structural Forces

According to Figure 18a,b, the value of the bending moments in both segmental lining modes along the entire tunnel is uniform (a high concentration of bending moments is not observed at the fault line). Its value increases slightly only at joint location, especially for longitudinal joints, and there is no momentary concentration in the segment body. The maximum value of the negative segmental lining bending moment with oblique joints is about 8008 kN×m, and the segmental lining with straight joints is 7310 kN×m. Although the value of this parameter is higher in the model with oblique joints, the maximum value is present only at the longitudinal joint’s location, while in the model with straight joints it is present on a larger surface. According to Figure 18c, the bending moment value of the continuous lining is concentrated in the fault zone and has a high amount on the crown and floor of the lining. In continuous linings, the maximum value of the negative bending moment is about 17,328 kN×m. The maximum bending moment of the continuous lining is about two times that of the segmental lining. The positive bending moment is approximately equal for continuous and segmental linings.
According to Figure 19a,b, at the crown and floor of the segmental lining, normal forces are distributed along the tunnel’s axis. In the fault zone, there is no concentration of normal forces. In Figure 19c, the maximum concentration of normal force is observed in the fault zone of the continuous lining. The normal force values in the straight joints’ and the oblique joints’ lining are approximately equal. The maximum compressive normal force for the continuous lining is about 849 MN, which is about one-tenth of the continuous lining for the segmental lining (76 MN for the segmental lining with oblique joints and 70 MN for the segmental lining with straight joints).

4.3. Limitations and Future Recommendation

This research investigated the fault interaction with a segmental lining considering the Tabriz Metro tunnels case. This research contributes to the complete modeling of a segmental lining with transverse and longitudinal joints with a fault intersection. In previous researches, tunnel linings were modeled as continuous ones, and segmental linings were modeled only as rings, without longitudinal joints.
The limitations of the current study are as follows:
  • There is no elastoplastic constitutive model for the tunnel lining, and cracks cannot be considered.
  • There is no modeling of the rebars within the concrete lining.
Due to the progress of geotechnics and of geotechnical software, new capabilities and tools can be added in the future in FLAC3D. This will provide the possibility of an elastoplastic reinforced concrete modeling. One of the goals of this research in the future will be to model the damages and cracks created in the segmental tunnel structure. In future works, the following points will be investigated:
  • Full dynamic loadings of fault movements.
  • Use of solid elements and evaluation of the rebar presence in segmental tunnel linings the intersection of the faults.
  • Investigation of combined fault interaction with segmental tunnels.
  • Investigation of methods to reduce the damage on tunnel linings, such as an over-excavation and the use of compressible materials behind the segmental tunnel linings.

5. Conclusions

In order to gain a better understanding of the behavior of segmental tunnels in the face of normal and reverse fault movement, a 3D advanced numerical simulation was carried out. This research is distinguished by accurate details of segment joint modeling and an advanced soil constitutive model. To confirm the power of finite-difference numerical codes for the subject under study, centrifuge tests conducted by one of the co-authors were used (Kiani et al. [2,12]). In addition, a real-life case of a segmental tunnel facing a reverse fault on the Tabriz Metro line 2 was studied. Based on the results presented herein, the segmental lining at the intersection with the dip-slip fault (normal and reverse fault) has acted effectively. The ability to withstand and reduce a large part of the fault force and a major part of the lining failure is limited to the opening of transverse and longitudinal joints. The results can be resumed as follows:
  • Normal faults intersecting with segmental linings have tensile rupture mechanisms, and segmental lining joints undergo greater deformations and openings than reverse faults. It has been observed that as the tunnel depth increases, the degree of separation of segmental rings, the opening of longitudinal joints, and the severity of failures increase, while the range affected by the fault in segmental lining declines, and the breakage and opening of joints approach the fault line, as a result. Vertical displacement and tunnel rupture rates increase dramatically as the slope angle of the fault increases, and the rupture path tends to follow the footwall as the fault slope increases.
  • The function of the segmental tunnel in the reverse fault was compressive. Thus, unlike normal faults, it will not suffer extensive damage. As a result of reverse faulting, the segmental lining experiences smoother displacement along the entire tunnel length, and only undergoes limited deformation and opening of longitudinal and transverse joints. Furthermore, segmental linings with oblique joints perform better than straight joints. In comparison to straight joint linings, they have less displacement and their internal force, including bending moments, extends to a smaller area. The maximum ground displacement value increases gradually with increasing tunnel overburden in a normal fault. The vertical displacement of the ground also increases with an elevation of the fault angle. This is due to an increase in the vertical component of the fault force. Through a decrease in the fault slope angle, the fault area is further developed towards the footwall, and further affects the surface.
  • Comparing the performance of segmental and continuous lining at the intersection with the reverse fault, it can be concluded that, unlike segmental lining, continuous tunnel lining in interaction with the fault suffers sudden failure at the fault line. The displacements were concentrated at the fault line location due to the rigidity of the continuous tunnel lining. Consequently, the probability of rupture and failure of the continuous tunnel lining at the intersection with the fault is high. In addition, the majority of the fault force is transmitted to the tunnel lining in the hanging wall. In a continuous lining, the bending moment is about twice as great as in a segmented lining, and the normal force is ten times as great.

Author Contributions

A.R. (Asma Ramesh) and A.R. (Alireza Rashiddel): data curation, conceptualization, methodology, project administration, writing the original draft, software, and validation; M.H. and D.D.: investigation, software, supervision, and review and editing; M.K.: supervision and validation. All authors have read and agreed to the published version of the manuscript.

Funding

This research received no external funding.

Institutional Review Board Statement

Not applicable.

Informed Consent Statement

Not applicable.

Data Availability Statement

Requests for all types of data used to support the findings of this study, after the publication of this article, will be considered by the corresponding author.

Acknowledgments

The authors wish to express their gratitude to the Auckland University of Technology (AUT), New Zealand, for their collaboration in confirming the modeling aspects of this study using the academic license of the FLAC3D Version 7.00.139 software provided by the Itasca Consulting Group, Minneapolis, MN, USA. Thanks also to Mojtaba Nematollahi and Ngoc Anh Do for their guidance in modeling the segment joints of the tunnel lining.

Conflicts of Interest

The authors declare no conflict of interest.

References

  1. Chang, Y.Y.; Lee, C.J.; Huang, W.C.; Hung, W.Y.; Huang, W.J.; Lin, M.L.; Chen, Y.H. Evolution of the Surface Deformation Profile and Subsurface Distortion Zone during Reverse Faulting through Overburden Sand. Eng. Geol. 2015, 184, 52–70. [Google Scholar] [CrossRef]
  2. Kiani, M.; Akhlaghi, T.; Ghalandarzadeh, A. Experimental Modeling of Segmental Shallow Tunnels in Alluvial Affected by Normal Faults. Tunn. Undergr. Space Technol. 2016, 51, 108–119. [Google Scholar] [CrossRef]
  3. Ahmadi, M.; Moosavi, M.; Jafari, M.K. Experimental Investigation of Reverse Fault Rupture Propagation through Cohesive Granular Soils. Geomech. Energy Environ. 2018, 14, 61–65. [Google Scholar] [CrossRef]
  4. Azizkandi, A.S.; Ghavami, S.; Baziar, M.H.; Hasanaklou, S.H. Assessment of Damages in Fault Rupture–Shallow Foundation Interaction Due to the Existence of Underground Structures. Tunn. Undergr. Space Technol. 2019, 89, 222–237. [Google Scholar] [CrossRef]
  5. Cai, Q.P.; Peng, J.M.; Ng, C.W.W.; Shi, J.W.; Chen, X.X. Centrifuge and Numerical Modelling of Tunnel Intersected by Normal Fault Rupture in Sand. Comput. Geotech. 2019, 111, 137–146. [Google Scholar] [CrossRef]
  6. Baziar, M.H.; Nabizadeh, A.; Khalafian, N.; Lee, C.J.; Hung, W.Y. Evaluation of Reverse Faulting Effects on the Mechanical Response of Tunnel Lining Using Centrifuge Tests and Numerical Analysis. Géotechnique 2020, 70, 490–502. [Google Scholar] [CrossRef]
  7. Wang, W.L.; Wang, T.T.; Su, J.J.; Lin, C.H.; Seng, C.R.; Huang, T.H. Assessment of Damage in Mountain Tunnels Due to the Taiwan Chi-Chi Earthquake. Tunn. Undergr. Space Technol. 2001, 16, 133–150. [Google Scholar] [CrossRef]
  8. Rashiddel, A.; Koopialipoor, M.; Hadei, M.R.; Rahmannejad, R. Numerical Investigation of Closed-Form Solutions for Seismic Design of a Circular Tunnel Lining (by Quasi-Static Method). Civ. Eng. J. 2018, 4, 239. [Google Scholar] [CrossRef]
  9. Yang, Z.; Lan, H.; Zhang, Y.; Gao, X.; Li, L. Nonlinear Dynamic Failure Process of Tunnel-Fault System in Response to Strong Seismic Event. J. Asian Earth Sci. 2013, 64, 125–135. [Google Scholar] [CrossRef]
  10. Yeats, R.S.; Sieh, K.; Allen, C.R. The Geology of Earthquakes; Oxford University Press: Oxford, UK, 1997; Volume 68. [Google Scholar]
  11. Machette, M.N. Active, Capable, and Potentially Active Faults—A Paleoseismic Perspective. J. Geodyn. 2000, 29, 387–392. [Google Scholar] [CrossRef]
  12. Kiani, M. Effects of Surface Fault Rupture on Shallow Segmental Soil Tunnels-Centrifuge Modeling. Ph.D. Thesis, University of Tabriz, Tabriz, Iran, 2016. (In Persian). [Google Scholar]
  13. Kelson, K.I. Representative Styles of Deformation along the Chelungpu Fault from the 1999 Chi-Chi (Taiwan) Earthquake: Geomorphic Characteristics and Responses of Man-Made Structures. Bull. Seismol. Soc. Am. 2004, 91, 930–952. [Google Scholar] [CrossRef]
  14. Zhang, H.J.; Wang, Z.Z.; Lu, F.; Xu, G.Y.; Qiu, W.G. Analysis of the Displacement Increment Induced by Removing Temporary Linings and Corresponding Countermeasures. Tunn. Undergr. Space Technol. 2018, 73, 236–243. [Google Scholar] [CrossRef]
  15. Lin, M.-L.; Chung, C.-F.; Jeng, F.-S.; Yao, T.-C. The Deformation of Overburden Soil Induced by Thrust Faulting and Its Impact on Underground Tunnels. Eng. Geol. 2007, 92, 110–132. [Google Scholar] [CrossRef]
  16. Anastasopoulos, I.; Gerolymos, N.; Drosos, V.; Georgarakos, T.; Kourkoulis, R.; Gazetas, G. Behaviour of Deep Immersed Tunnel under Combined Normal Fault Rupture Deformation and Subsequent Seismic Shaking. Bull. Earthq. Eng. 2008, 6, 213–239. [Google Scholar] [CrossRef]
  17. Zhao, K.; Janutolo, M.; Barla, G.; Chen, G. 3D Simulation of TBM Excavation in Brittle Rock Associated with Fault Zones: The Brenner Exploratory Tunnel Case. Eng. Geol. 2014, 181, 93–111. [Google Scholar] [CrossRef]
  18. Zhao, K.; Chen, W.; Yang, D.; Zhao, W.; Wang, S.; Song, W. Mechanical Tests and Engineering Applicability of Fibre Plastic Concrete Used in Tunnel Design in Active Fault Zones. Tunn. Undergr. Space Technol. 2019, 88, 200–208. [Google Scholar] [CrossRef]
  19. Wang, X.; Xiong, Q.; Zhou, H.; Chen, J.; Xiao, M. Three-Dimensional (3D) Dynamic Finite Element Modeling of the Effects of a Geological Fault on the Seismic Response of Underground Caverns. Tunn. Undergr. Space Technol. 2020, 96, 103210. [Google Scholar] [CrossRef]
  20. Baziar, M.H.; Nabizadeh, A.; Jung Lee, C.; Hung, W.Y. Centrifuge Modeling of Interaction between Reverse Faulting and Tunnel. Soil Dyn. Earthq. Eng. 2014, 65, 151–164. [Google Scholar] [CrossRef]
  21. Shen, Y.S.; Wang, Z.Z.; Yu, J.; Zhang, X.; Gao, B. Shaking Table Test on Flexible Joints of Mountain Tunnels Passing through Normal Fault. Tunn. Undergr. Space Technol. 2020, 98, 103299. [Google Scholar] [CrossRef]
  22. Sabagh, M.; Ghalandarzadeh, A. Numerical Modelings of Continuous Shallow Tunnels Subject to Reverse Faulting and Its Verification through a Centrifuge. Comput. Geotech. 2020, 128, 103813. [Google Scholar] [CrossRef]
  23. Gregor, T.; Garrod, B.; Young, D. Analyses of Underground Structures Crossing an Active Fault in Coronado, California. In Proceedings of the World Tunnel Congress; Taylor & Francis: London, UK, 2007; Volume 3, pp. 445–450. [Google Scholar]
  24. Baziar, M.H.; Nabizadeh, A.; Mehrabi, R.; Lee, C.J.; Hung, W.Y. Evaluation of Underground Tunnel Response to Reverse Fault Rupture Using Numerical Approach. Soil Dyn. Earthq. Eng. 2016, 83, 1–17. [Google Scholar] [CrossRef]
  25. Nemati, M.; Derakhshani, R. Short-Term Seismicity Patterns along the Most Active Faults in Iran. J. Iber. Geol. 2021, 47, 441–459. [Google Scholar] [CrossRef]
  26. Zhang, Z.; Chen, F.; Li, N.; He, M. Influence of Fault on the Surrounding Rock Stability for a Mining Tunnel: Distance and Tectonic Stress. Adv. Civ. Eng. 2019, 2019, 1–12. [Google Scholar] [CrossRef] [Green Version]
  27. Ma, Y.; Sheng, Q.; Zhang, G.; Cui, Z. A 3D Discrete-Continuum Coupling Approach for Investigating the Deformation and Failure Mechanism of Tunnels across an Active Fault: A Case Study of Xianglushan Tunnel. Appl. Sci. 2019, 9, 2318. [Google Scholar] [CrossRef] [Green Version]
  28. Esmatkhah Irani, A.; Azadi, A.; Nikbakht, M.; Azarafza, M.; Hajialilue Bonab, M.; Behrooz Sarand, F. GIS-Based Settlement Risk Assessment and Its Effect on Surface Structures: A Case Study for the Tabriz Metro—Line 1. Geotech. Geol. Eng. 2022, 40, 5081–5102. [Google Scholar] [CrossRef]
  29. Yan, G.; Gao, B.; Shen, Y.; Zheng, Q.; Fan, K.; Huang, H. Shaking Table Test on Seismic Performances of Newly Designed Joints for Mountain Tunnels Crossing Faults. Adv. Struct. Eng. 2020, 23, 248–262. [Google Scholar] [CrossRef]
  30. Zhou, H.; He, C.; Wang, S.; Peng, F.; Zhu, S.; Yuan, D. Dynamic Stress Concentration Factors and Damage Mode of Horseshoe Tunnels Crossing Fault Fracture Zone. Geotech. Geol. Eng. 2020, 38, 5127–5141. [Google Scholar] [CrossRef]
  31. Aygar, E.B.; Gokceoglu, C. A Special Support Design for a Large-Span Tunnel Crossing an Active Fault (T9 Tunnel, Ankara–Sivas High-Speed Railway Project, Turkey). Environ. Earth Sci. 2021, 80, 37. [Google Scholar] [CrossRef]
  32. Wen, Y.M.; Xin, C.L.; Shen, Y.S.; Huang, Z.M.; Gao, B. The Seismic Response Mechanisms of Segmental Lining Structures Applied in Fault-Crossing Mountain Tunnel: The Numerical Investigation and Experimental Validation. Soil Dyn. Earthq. Eng. 2021, 151, 107001. [Google Scholar] [CrossRef]
  33. An, S.; Tao, L.J.; Han, X.C.; Zhang, Y. Application of Two-Level Design Method on Subway Tunnel Crossing Active Fault: A Case Study on Urumqi Subway Tunnel Intersected by Reverse Fault Dislocation. Bull. Eng. Geol. Environ. 2021, 80, 3871–3884. [Google Scholar] [CrossRef]
  34. Somerville, P.G. Implications of the Northridge and Kobe Earthquakes for the National Earthquake Hazard Reduction Program. Seismol. Res. Lett. 1997, 68, 711–713. [Google Scholar] [CrossRef]
  35. Hosseini, M.; Rahimi, H. Probabilistic Fault Displacement Hazard Analysis for the North Tabriz Fault. Nat. Hazards Earth Syst. Sci. 2022, 22, 3571–3583. [Google Scholar] [CrossRef]
  36. RAHAB. Consulting Engineers Geotechnical Studies Report of the Route and Eastern Parking; RAHAB: Tabriz, Iran, 2018. [Google Scholar]
  37. Wells, D.L.; Coppersmith, K.J. New Empirical Relationships among Magnitude, Rupture Length, Rupture Width, Rupture Area, and Surface Displacement. Bull. Seismol. Soc. Am. 1994, 84, 974–1002. [Google Scholar]
  38. TURO. Structural Analysis and Design of Segmental Tunnel Lining of the Line 2 Metro of Tabriz; Section l.: Tabriz, Iran, 2012. (In Persian) [Google Scholar]
  39. Lambrughi, A.; Medina Rodríguez, L.; Castellanza, R. Development and Validation of a 3D Numerical Model for TBM–EPB Mechanised Excavations. Comput. Geotech. 2012, 40, 97–113. [Google Scholar] [CrossRef]
  40. Ramesh, A.; Hajihassani, M.; Rashiddel, A. Ground Movements Prediction in Shield-Driven Tunnels Using Gene Expression Programming. Open Constr. Build. Technol. J. 2020, 14, 286–297. [Google Scholar] [CrossRef]
  41. Hejazi, Y.; Dias, D.; Kastner, R. Impact of Constitutive Models on the Numerical Analysis of Underground Constructions. Acta Geotech. 2008, 3, 251–258. [Google Scholar] [CrossRef]
  42. Rashiddel, A.; Kharghani, M.; Dias, D.; Hajihassani, M. Numerical Study of the Segmental Tunnel Lining Behavior under a Surface Explosion—Impact of the Longitudinal Joints Shape. Comput. Geotech. 2020, 128, 103822. [Google Scholar] [CrossRef]
  43. Rashiddel, A.; Hajihassani, M.; Kharghani, M.; Valizadeh, H.; Rahmannejad, R.; Dias, D. Numerical Analysis of Segmental Tunnel Linings-Use of the Beam-Spring and Solid-Interface Methods. Geomech. Eng. 2022, 29, 471–486. [Google Scholar]
  44. Itasca Consulting Group, Inc. FLAC3D—Fast Lagrangian Analysis of Continua in Three-Dimensions, Ver. 7.0; Itasca: Minneapolis, MN, USA, 2019. [Google Scholar]
  45. Do, N.-A.; Dias, D.; Oreste, P.; Djeran-Maigre, I. Three-Dimensional Numerical Simulation of a Mechanized Twin Tunnels in Soft Ground. Tunn. Undergr. Space Technol. 2014, 42, 40–51. [Google Scholar] [CrossRef]
  46. Leonhardt, F.; Reimann, H. Betongelenke. Der Bauing. 1966, 41, 49–56. [Google Scholar]
  47. Janssen, P. Tragverhalten von Tunnelausbauten Mit Gelenktübbings; Report-No. 83-41; Institute for Structural Analysis, Department of Civil Engineering, University of Braunschweig: Braunschweig, Germany, 1983. [Google Scholar]
  48. Do, N.A. Numerical Analyses of Segmental Tunnel Lining under Static and Dynamic Loads. Ph.D. Thesis, Civil Engineering, INSA de Lyon, Lyon, France, 2014. (In English). [Google Scholar]
  49. Do, N.-A.; Dias, D.; Oreste, P.; Djeran-Maigre, I. 2D Numerical Investigation of Segmental Tunnel Lining Behavior. Tunn. Undergr. Space Technol. 2013, 37, 115–127. [Google Scholar] [CrossRef]
  50. Do, N.-A.; Dias, D.; Oreste, P.; Djeran-Maigre, I. Three-Dimensional Numerical Simulation for Mechanized Tunnelling in Soft Ground: The Influence of the Joint Pattern. Acta Geotech. 2014, 9, 673–694. [Google Scholar] [CrossRef]
  51. Ramesh, A. Numerical Investigation of Fault Interaction with Segmental Lining in Tabriz Metro Tunnels. Master’s Thesis, Urmia University, Urmia, Iran, 2022. (In English). [Google Scholar]
Figure 1. 3D schematic of a segmental tunnel lining with oblique joints.
Applsci 13 07866 g001
Figure 2. Metro Lines of Tabriz and possible fault zones.
Applsci 13 07866 g002
Figure 3. Schematic view of the boundary condition of the normal faulting in the numerical model.
Applsci 13 07866 g003
Figure 4. Kaxi, Krad, Krot stiffness in the axial, radial, and rotational directions of a segmental joint.
Applsci 13 07866 g004
Figure 5. Numerical model of validation based on the centrifuge test.
Applsci 13 07866 g005
Figure 6. Deformation of the segmental lining under normal faulting: (a) the fault slope angle of 60°; (b) the fault slope angle of 75°.
Applsci 13 07866 g006
Figure 7. Le changes with increasing depth in the centrifuge test presented by [2,12] and the numerical validation model: (a) the fault slope angle of 60°; (b) the fault slope angle of 75°.
Applsci 13 07866 g007
Figure 8. The cross-sectional deformation of the segmental tunnel lining under normal faulting: (a) the fault slope angle of 60°; (b) the fault slope angle of 75°.
Applsci 13 07866 g008aApplsci 13 07866 g008b
Figure 9. Vertical displacement diagram of the segmental lining under normal faulting: (a) the fault slope angle of 60°; (b) the fault slope angle of 75°.
Applsci 13 07866 g009
Figure 10. Vertical displacement diagram of the segmental lining at 60° and 75° fault slope angles.
Applsci 13 07866 g010
Figure 11. Soil surface settlement for different overburdens and fault angles in numerical validation models.
Applsci 13 07866 g011
Figure 12. PGD in the numerical validation and the centrifuge test at the fault angle of 75°.
Applsci 13 07866 g012
Figure 13. Numerical model geometry of Line 2 with soil layers.
Applsci 13 07866 g013
Figure 14. Tunnel structure geometry of Line 2: (a) segmental lining with oblique joints; (b) segmental lining with straight joints; (c) continuous lining.
Applsci 13 07866 g014
Figure 15. Contours of vertical soil displacements under reverse faulting (central profile): (a) oblique joints; (b) straight joints.
Applsci 13 07866 g015aApplsci 13 07866 g015b
Figure 16. Contours of vertical lining displacements under reverse faulting: (a) segmental lining with oblique joints; (b) segmental lining with straight joints; (c) continuous lining.
Applsci 13 07866 g016aApplsci 13 07866 g016b
Figure 17. Vertical lining displacements under reverse faulting.
Applsci 13 07866 g017
Figure 18. Contours of the structural bending moments under reverse faulting: (a) segmental lining with oblique joints; (b) segmental lining with straight joints; (c) continuous lining.
Applsci 13 07866 g018
Figure 19. Contours of the structural normal forces under reverse faulting: (a) segmental lining with oblique joints; (b) segmental lining with straight joints; (c) continuous lining.
Applsci 13 07866 g019
Table 1. Geotechnical parameters of the critical section [36].
ParametersSymbolUnitValueValueValueValueValueValue
Soil typeL-Filling material (SM)CL–MLGM–GC–GWCLGM–GPSM
DepthDm0–1.51.5–77–1717–2020–2626–35
Dry density ρ g/cm31.651.7751.7751.7751.8501.825
CohesionCkPa01162555
Angle of internal frictionφDegree272432233332
Triaxial loading secant Young’s modulus E 50 ref MPa102547.5356555
Unloading–reloading Young’s modulus E ur ref MPa3075150105195165
Oedometric loading Young’s modulus E oed ref MPa123060427866
Coefficient of earth lateral pressureK0-0.540.5930.470.60.4550.47
Poisson’s ratio ν -0.330.390.320.390.330.32
Failure ratioRf-0.90.90.90.90.90.9
Janbu-type parameterm-0.50.50.50.50.50.5
Reference mean pressurePrefkPa100100100100100100
Table 2. Properties of the segmental tunnel lining and grout of the Tabriz Subway Line 2 [38].
ParametersSymbolUnitValue
Properties of the segmental liner
Young’s modulusEGPa30
Density ρ kg/m32500
External diameterDm9.5
Thicknesstcm35
Poisson’s ratio ν -0.2
Width of the segment ringWm1.5
Properties of the grouting layer (28-day)
Young’s modulusEMPa160
Poisson’s ratio ν -0.22
Density ρ kg/m32000
Grouting layer thicknesstcm15.5
Table 3. Mechanical and physical properties of sand and segmental lining in the validation model (prototype model).
ParametersSymbolUnitValue
Properties of the soil
Soil typeL-Firoozkuh # 161 sand
Density ρ kg/m31700
CohesionCkPa1
The angle of internal frictionφDegree37
Dilation angleψDegree10
Triaxial loading secant Young’s modulus E 50 ref MPa20
Unloading–reloading Young’s modulus E ur ref MPa60
Oedometric loading Young’s modulus E oed ref MPa16
Coefficient of earth lateral pressureK0-0.38
Poisson’s ratio ν -0.28
Failure ratioRf-0.9
Janbu-type parameterm-0.5
Reference mean pressurePrefkPa100
Properties of the liner [2,12]
Young’s modulusEGPa34
Density ρ kg/m32600
DiameterDm5.9
Thicknesstm0.35
Poisson’s ratio ν -0.2
Width of the segmental ringwm1.15
Table 4. Joint parameters of the segmental lining based on the centrifuge test [51].
Segmental JointsValueRing JointsValue
Radial stiffness KR (MN/m)216Radial stiffness KRR (MN/m)216
Axial stiffness KA (MN/m)4434Axial stiffness KAR (MN/m)4434
Rotational stiffness Kθ (MN×m/rad/m)62.046Rotational stiffness KθR (MN×m/rad/m)62.046
The maximum bending moment at segmental joint Myield (kN×m/m)121The maximum bending moment at ring joint MRyield (kN×m/m)121
Table 5. Parameters of the joints in Line 2 numerical model [38].
Segmental JointsValueRing JointsValue
Radial stiffness KR (MN/m)1050Radial stiffness KRR (MN/m)1050
Axial stiffness KA (MN/m)500Axial stiffness KAR (MN/m)500
Rotational stiffness Kθ (MN×m/rad/m)100Rotational stiffness KθR (MN×m/rad/m)100
The maximum bending moment at segmental joint Myield (kN×m/m)150The maximum bending moment at ring joint MRyield (kN×m/m)150
Disclaimer/Publisher’s Note: The statements, opinions and data contained in all publications are solely those of the individual author(s) and contributor(s) and not of MDPI and/or the editor(s). MDPI and/or the editor(s) disclaim responsibility for any injury to people or property resulting from any ideas, methods, instructions or products referred to in the content.

